Elastic Asymmetry of PLA Material in FDM-Printed Parts: Considerations Concerning Experimental Characterisation for Use in Numerical Simulations

 , ,
, ,
Abstract
:1. Introduction
2. Test Methods
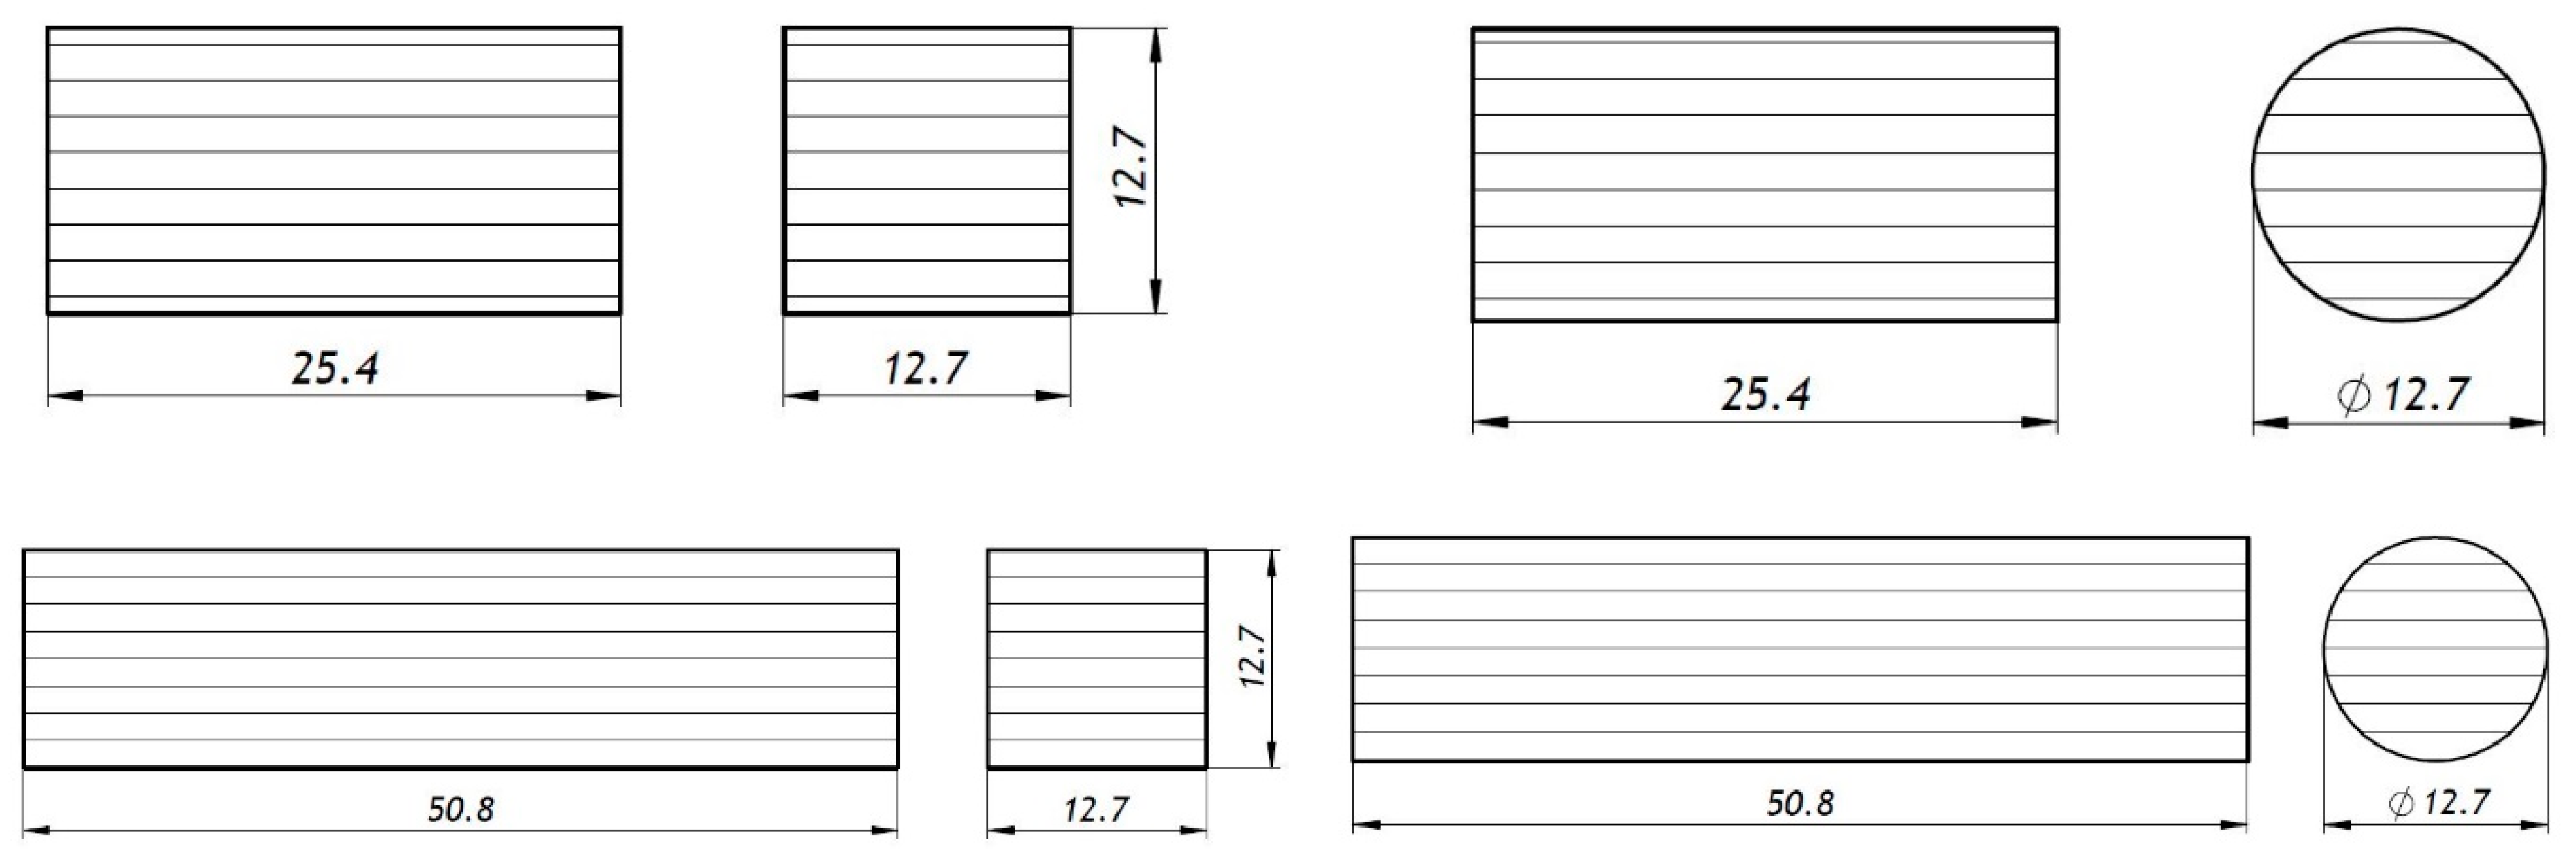
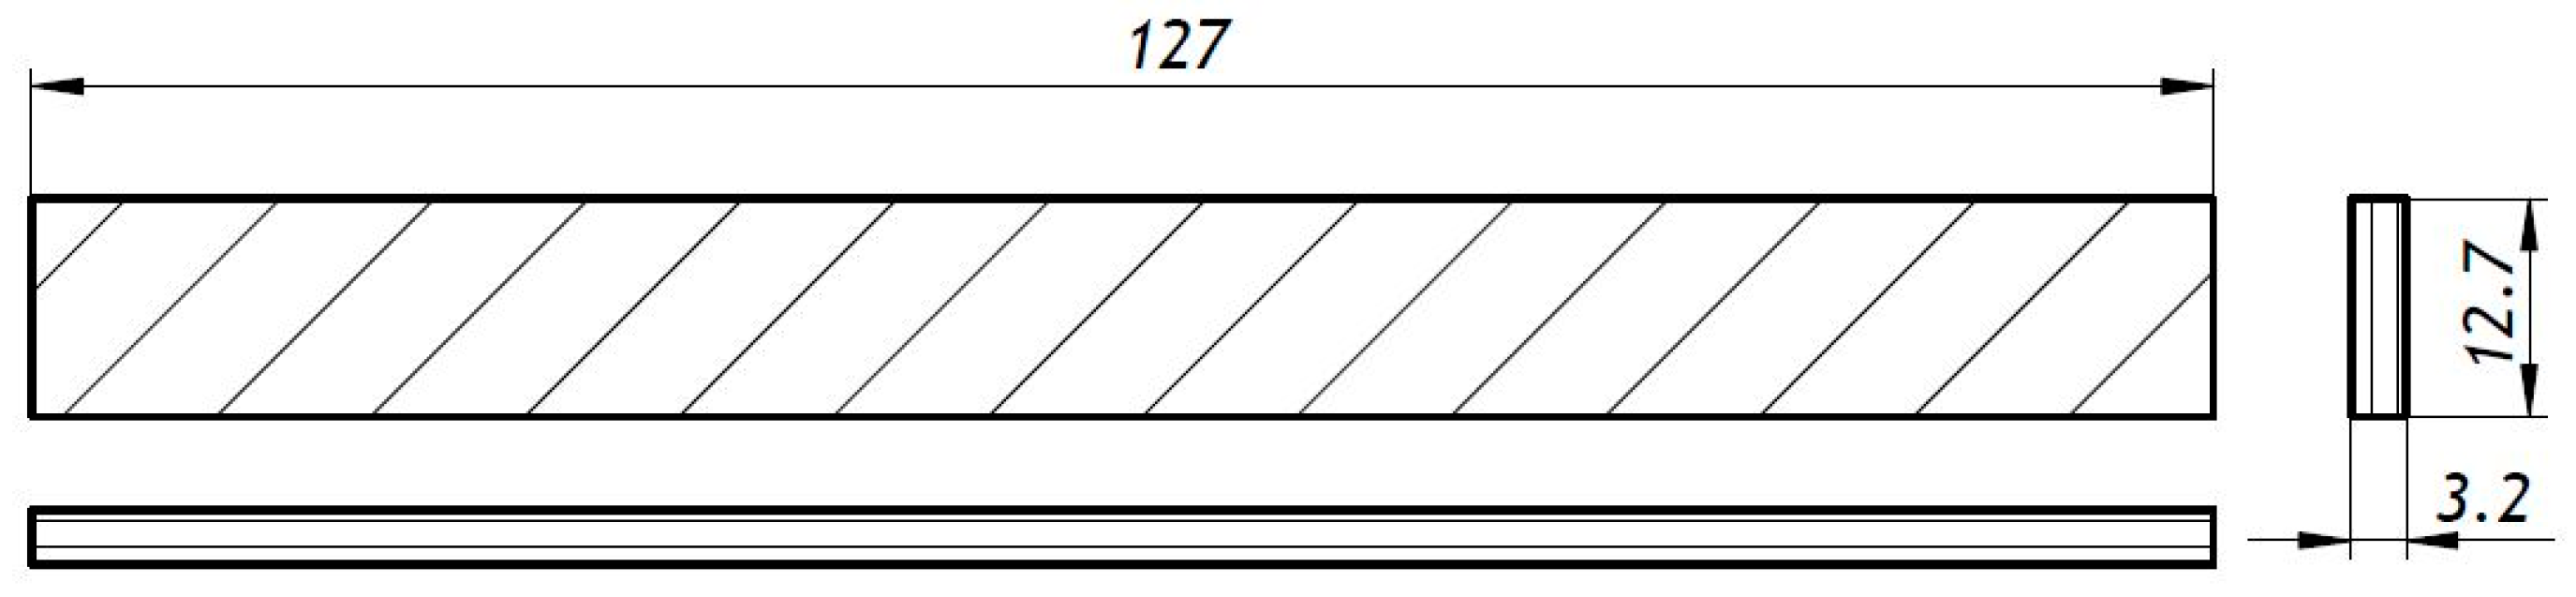
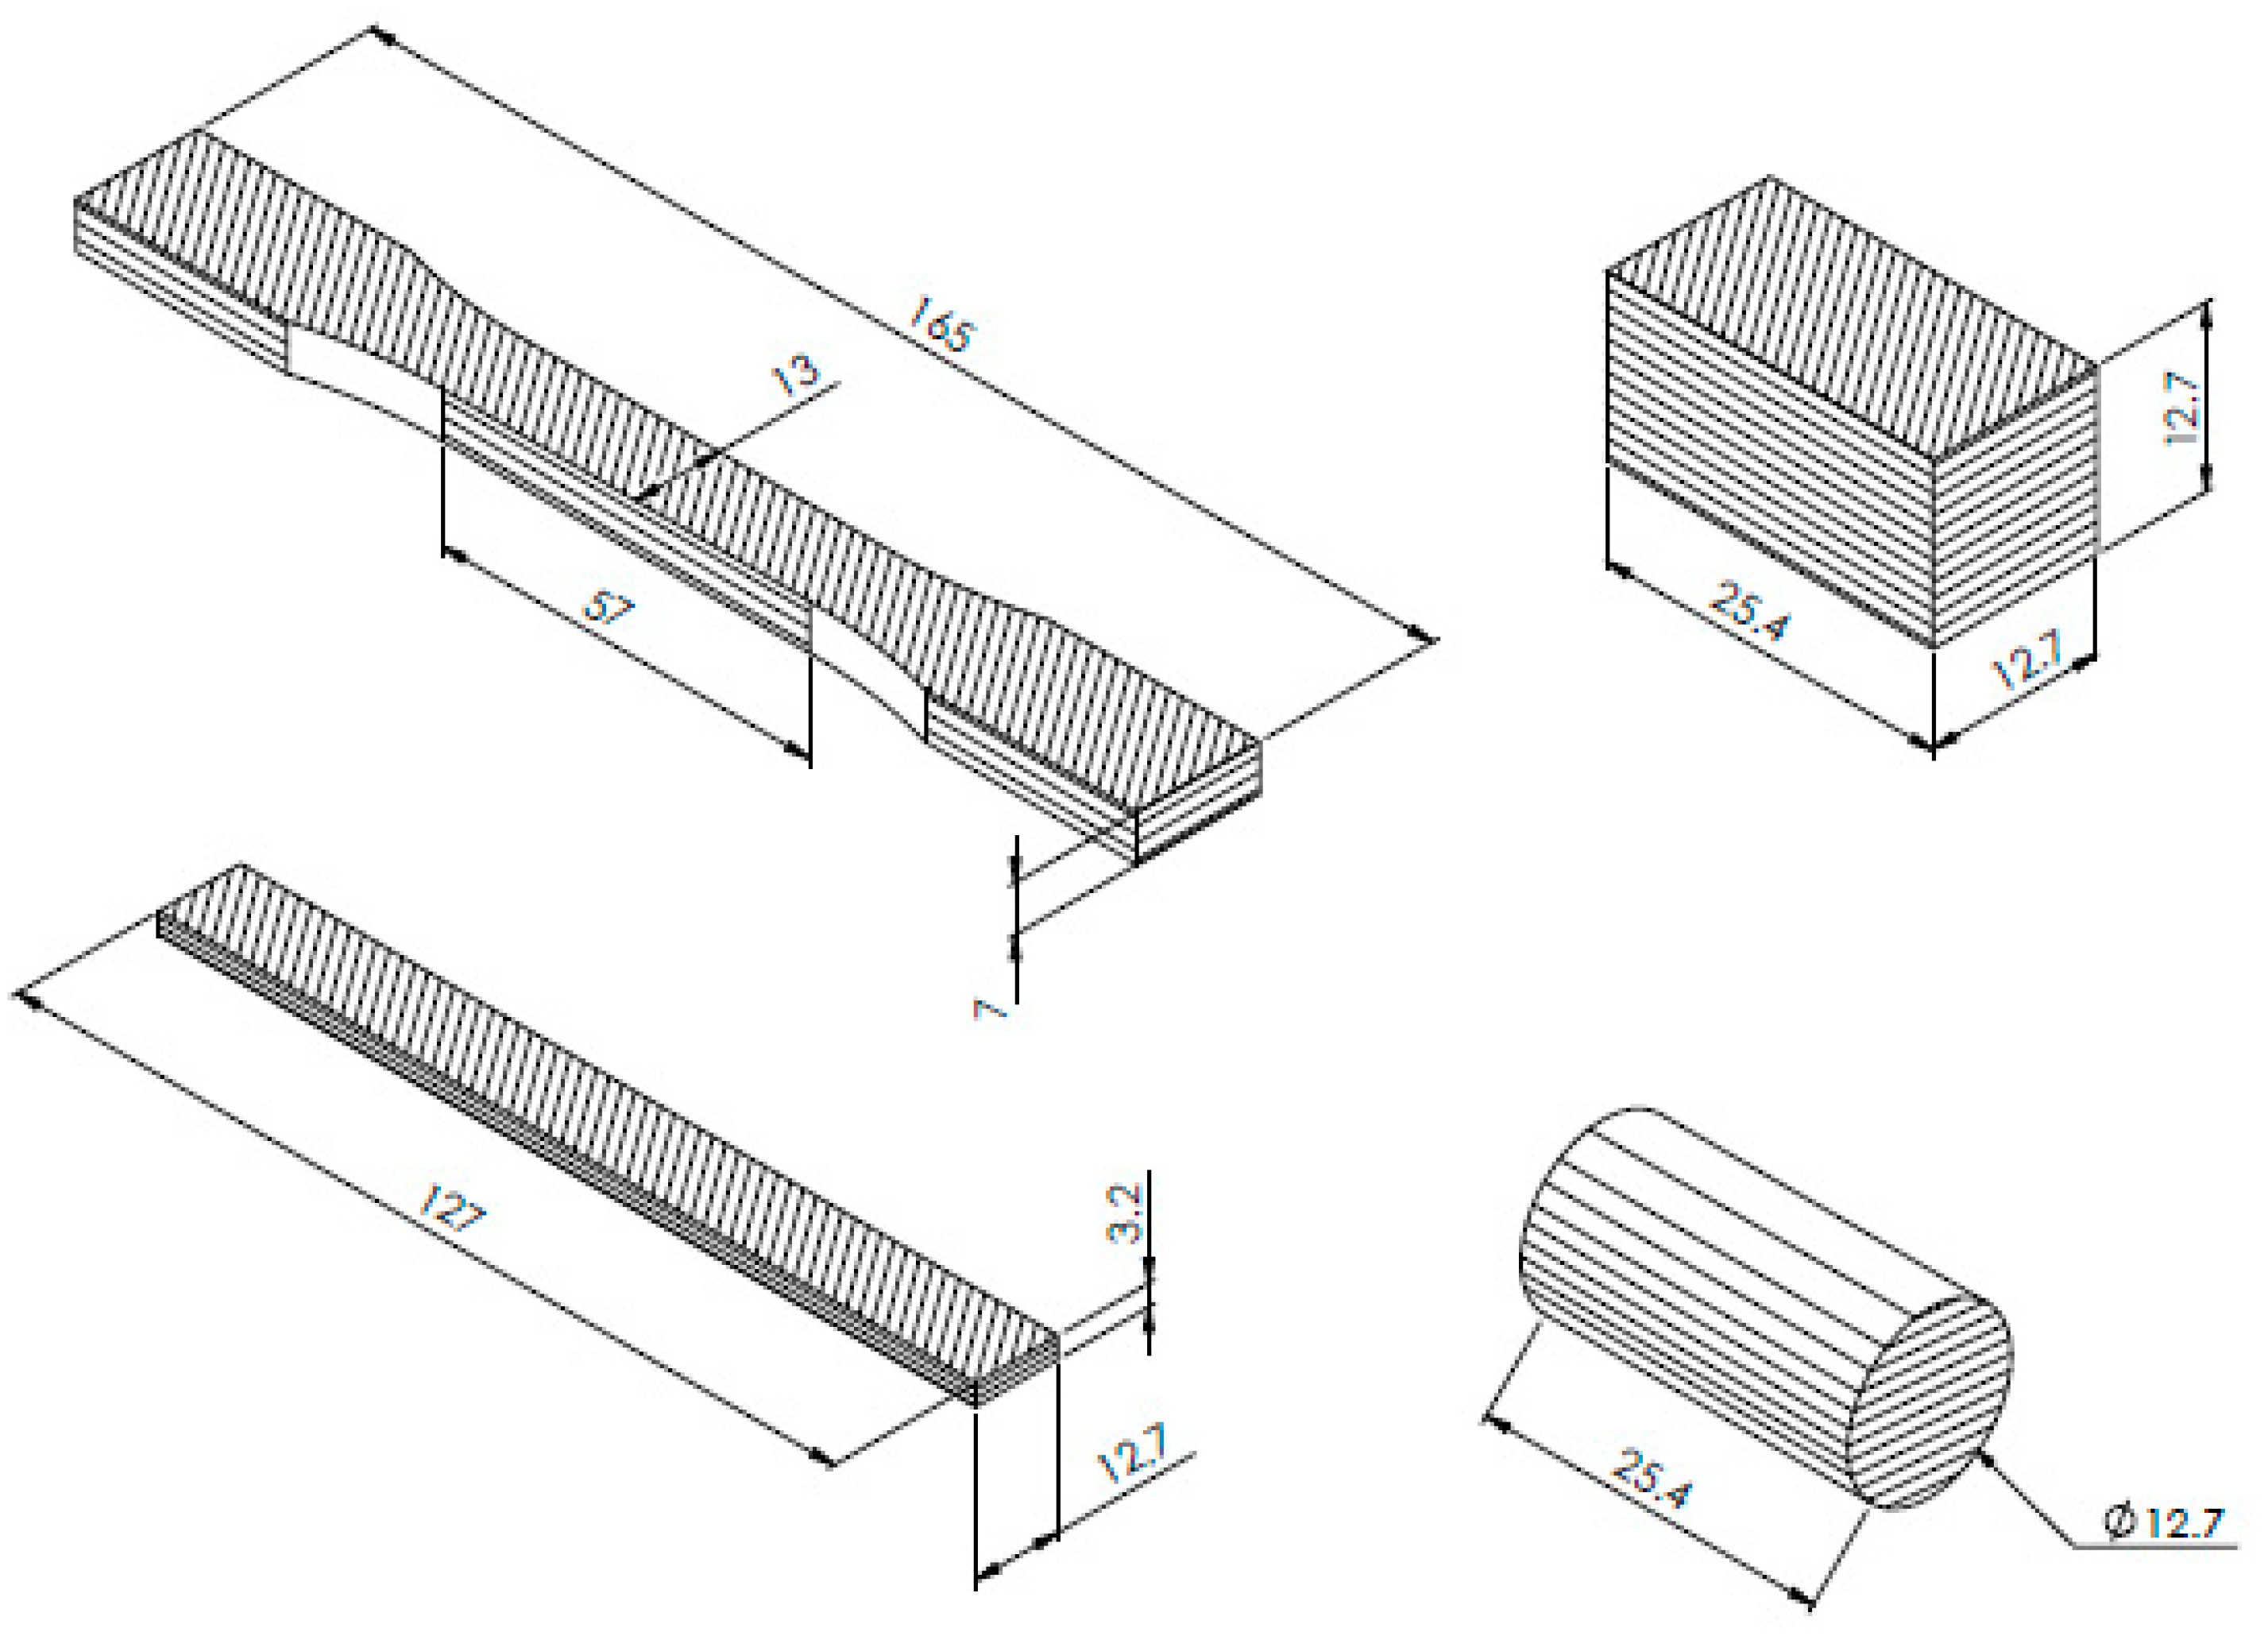
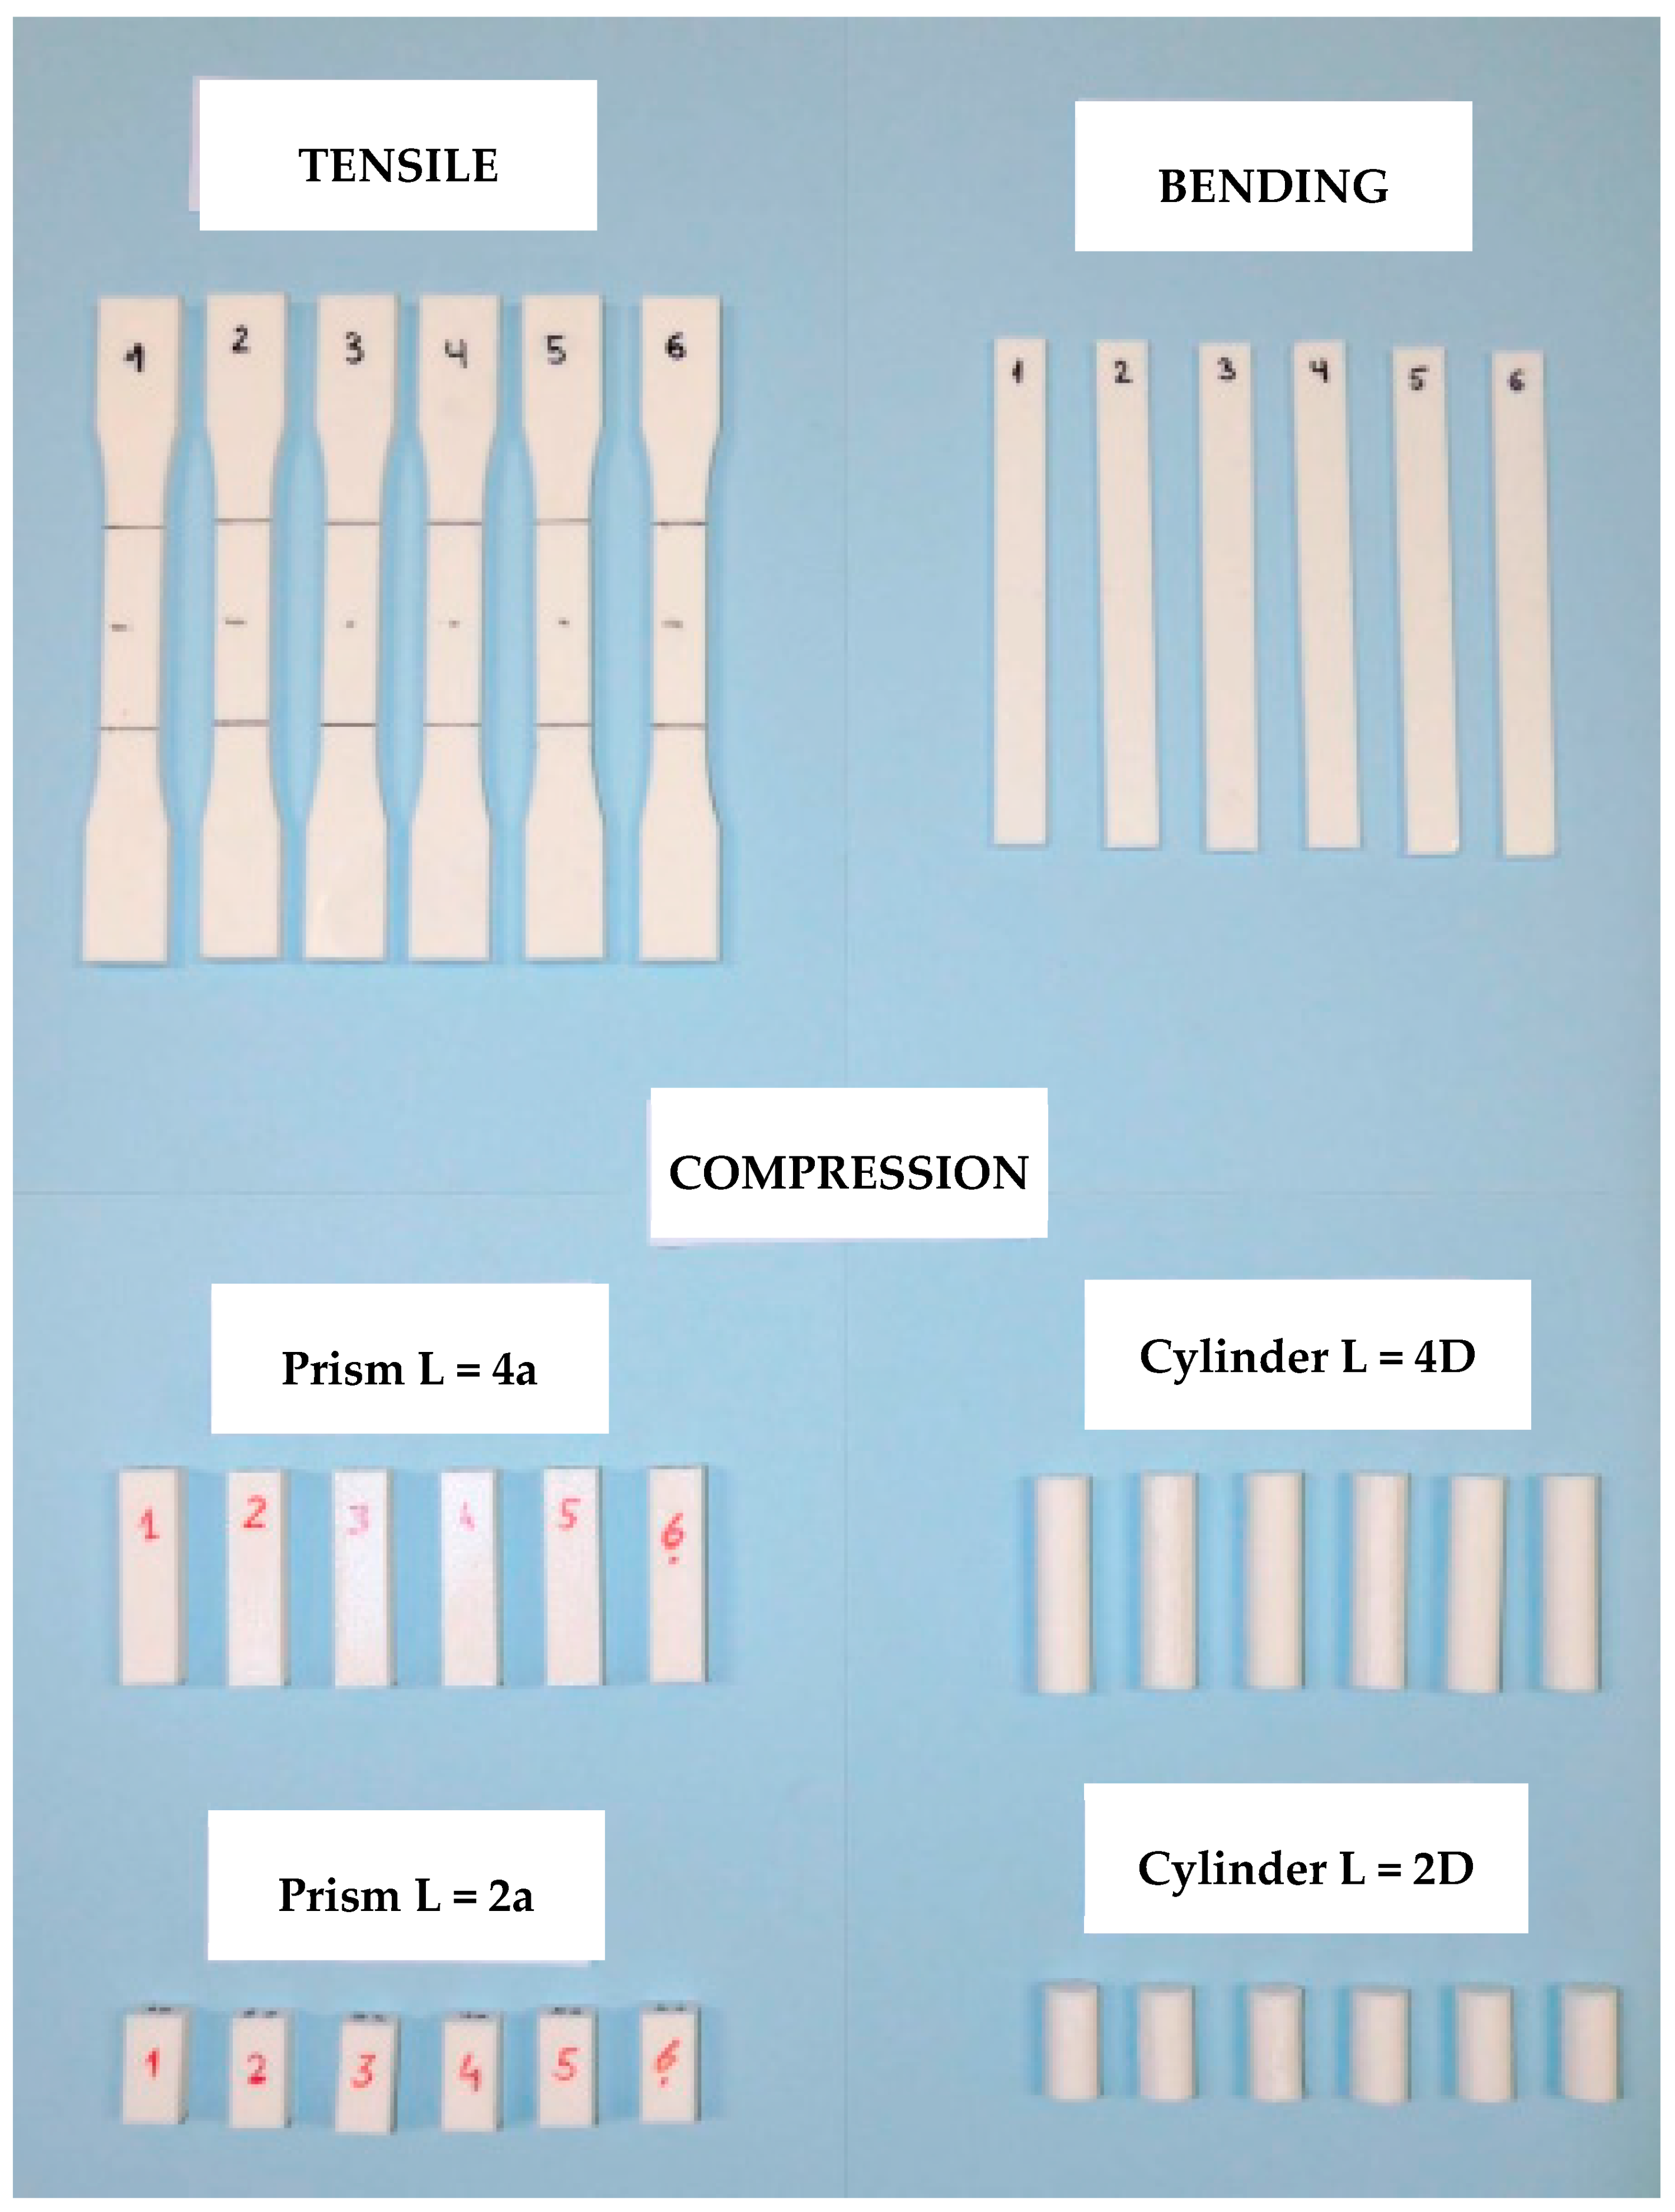
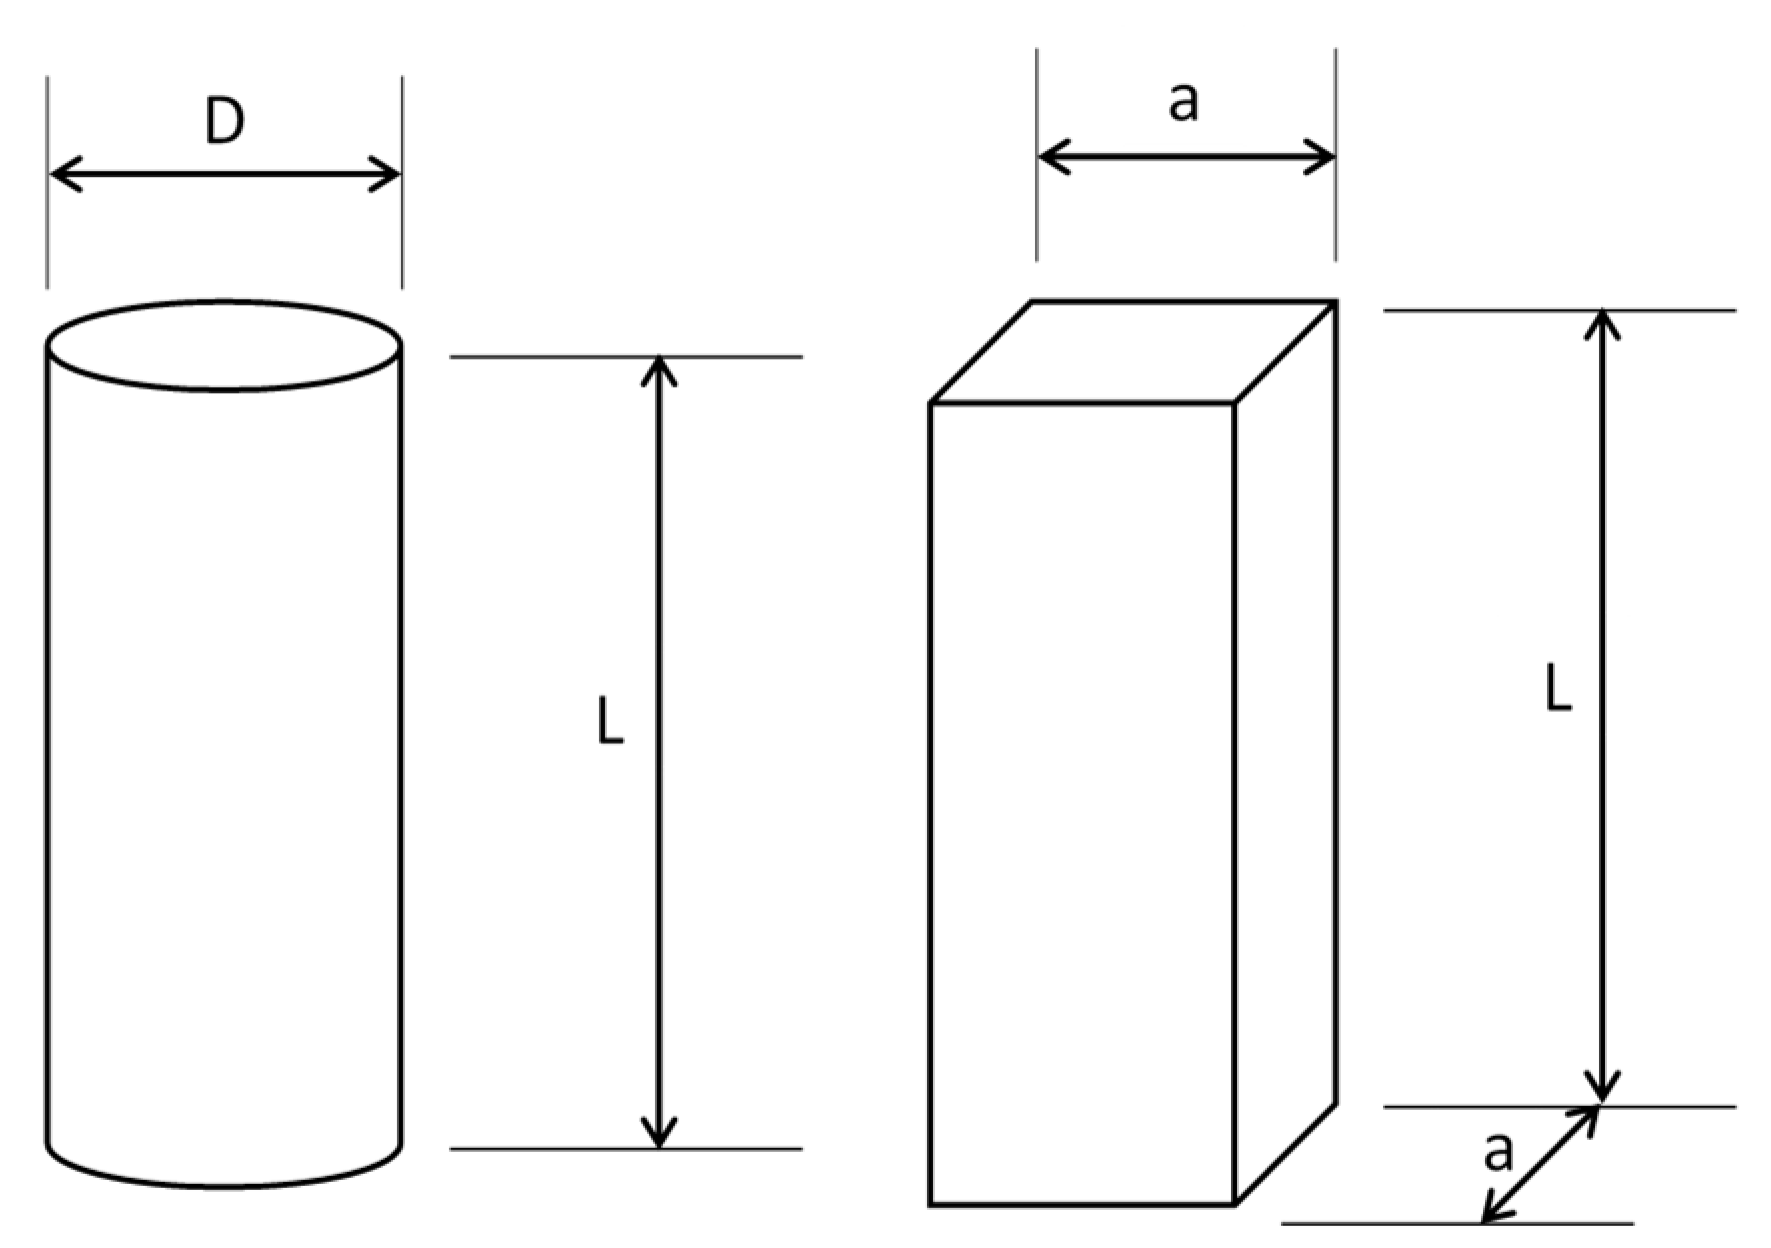
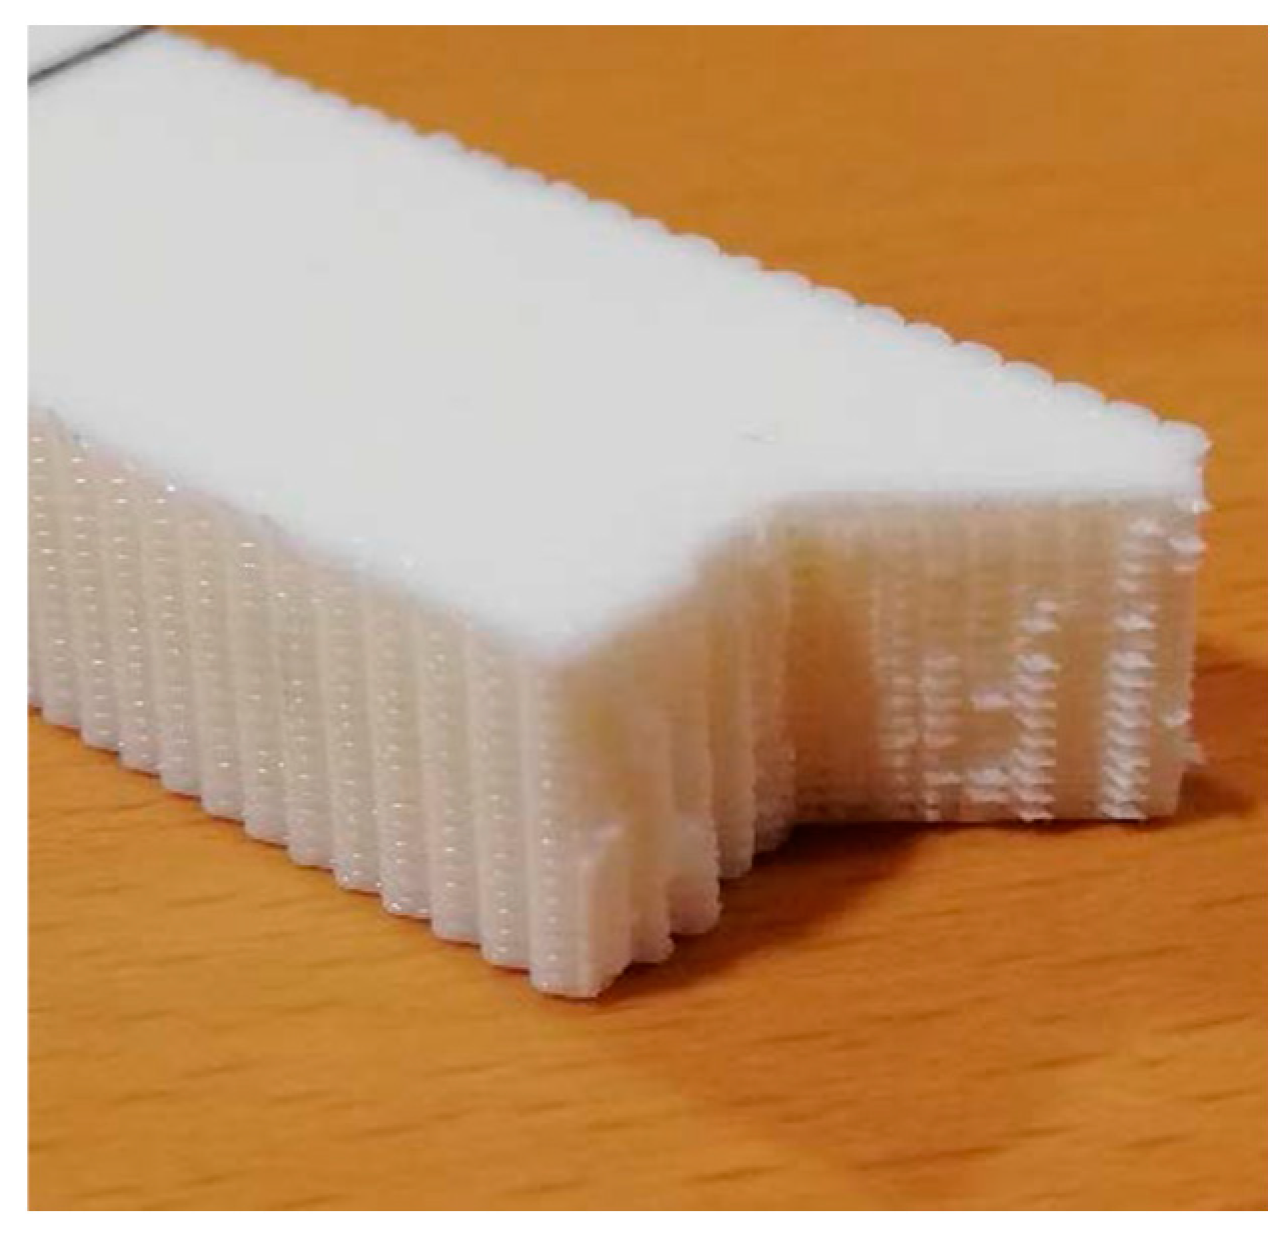
2.1. Specimens
2.2. Experimental Tests
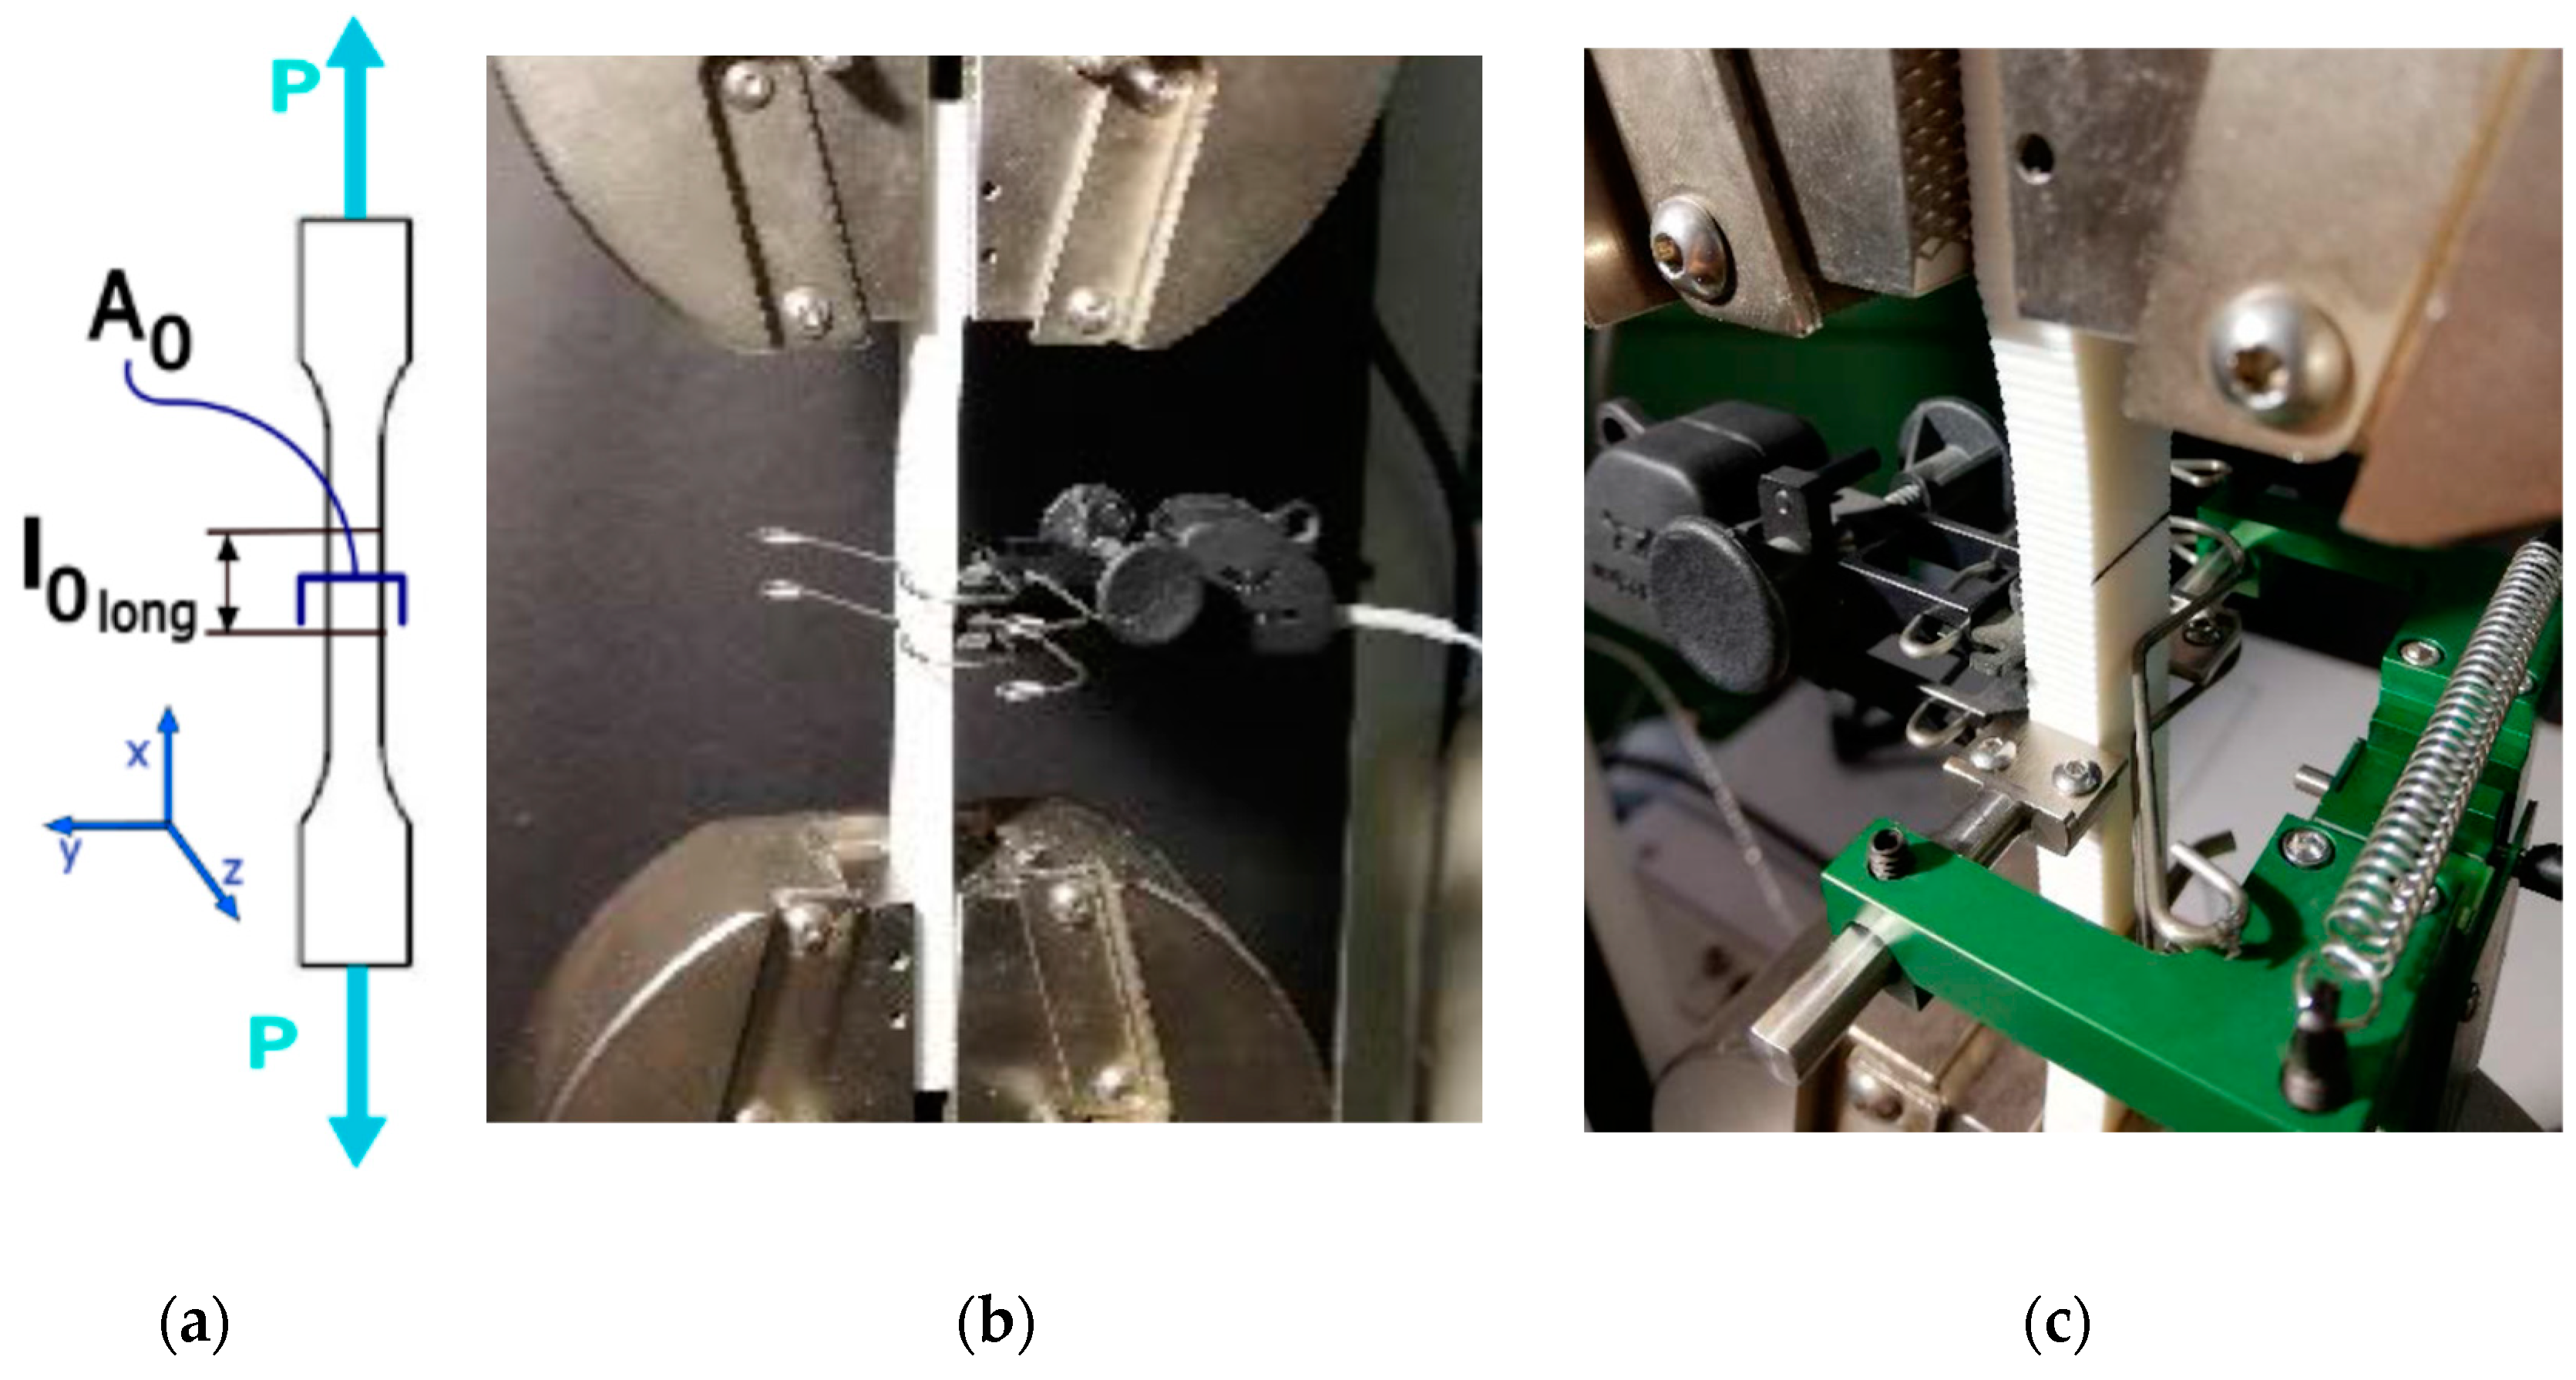
2.2.1. Tensile Test
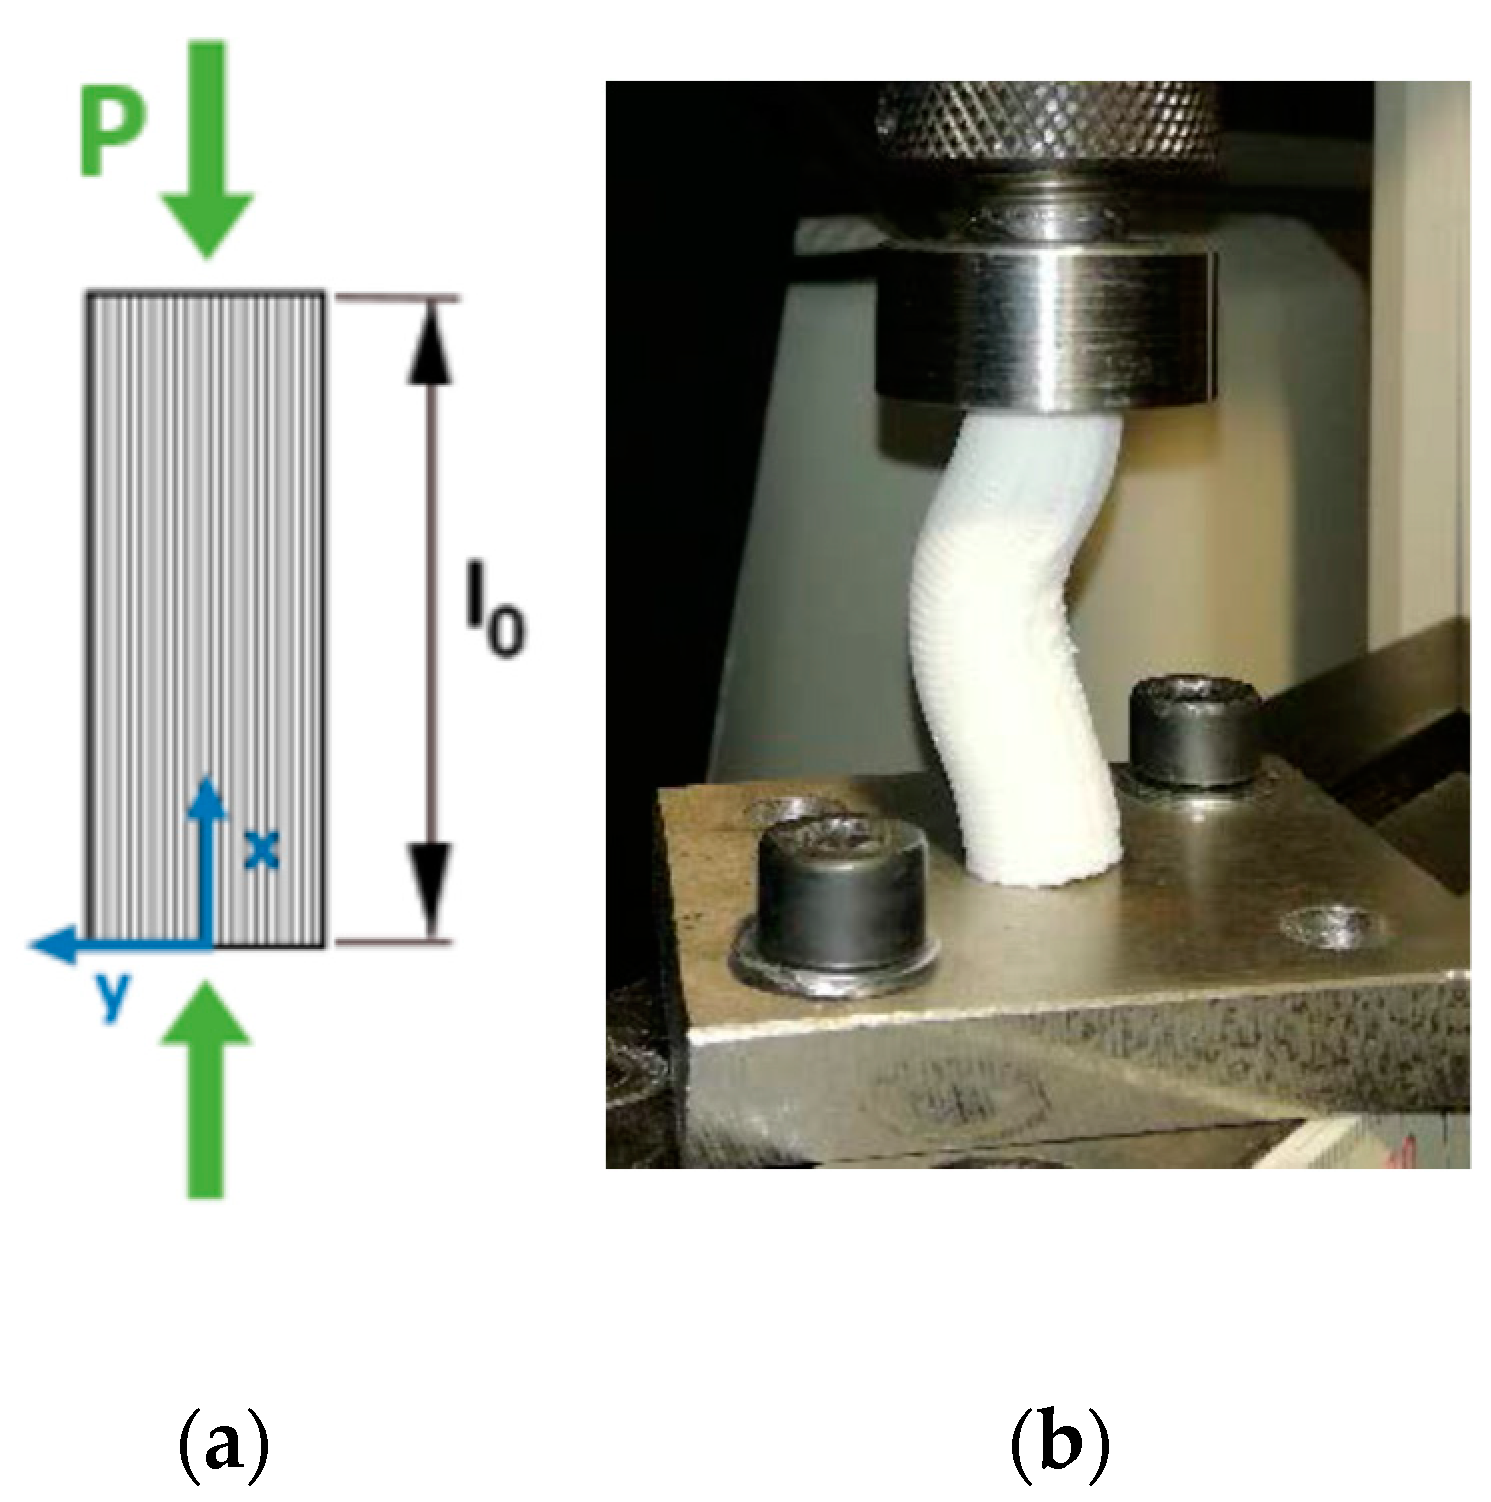
2.2.2. Compression Test
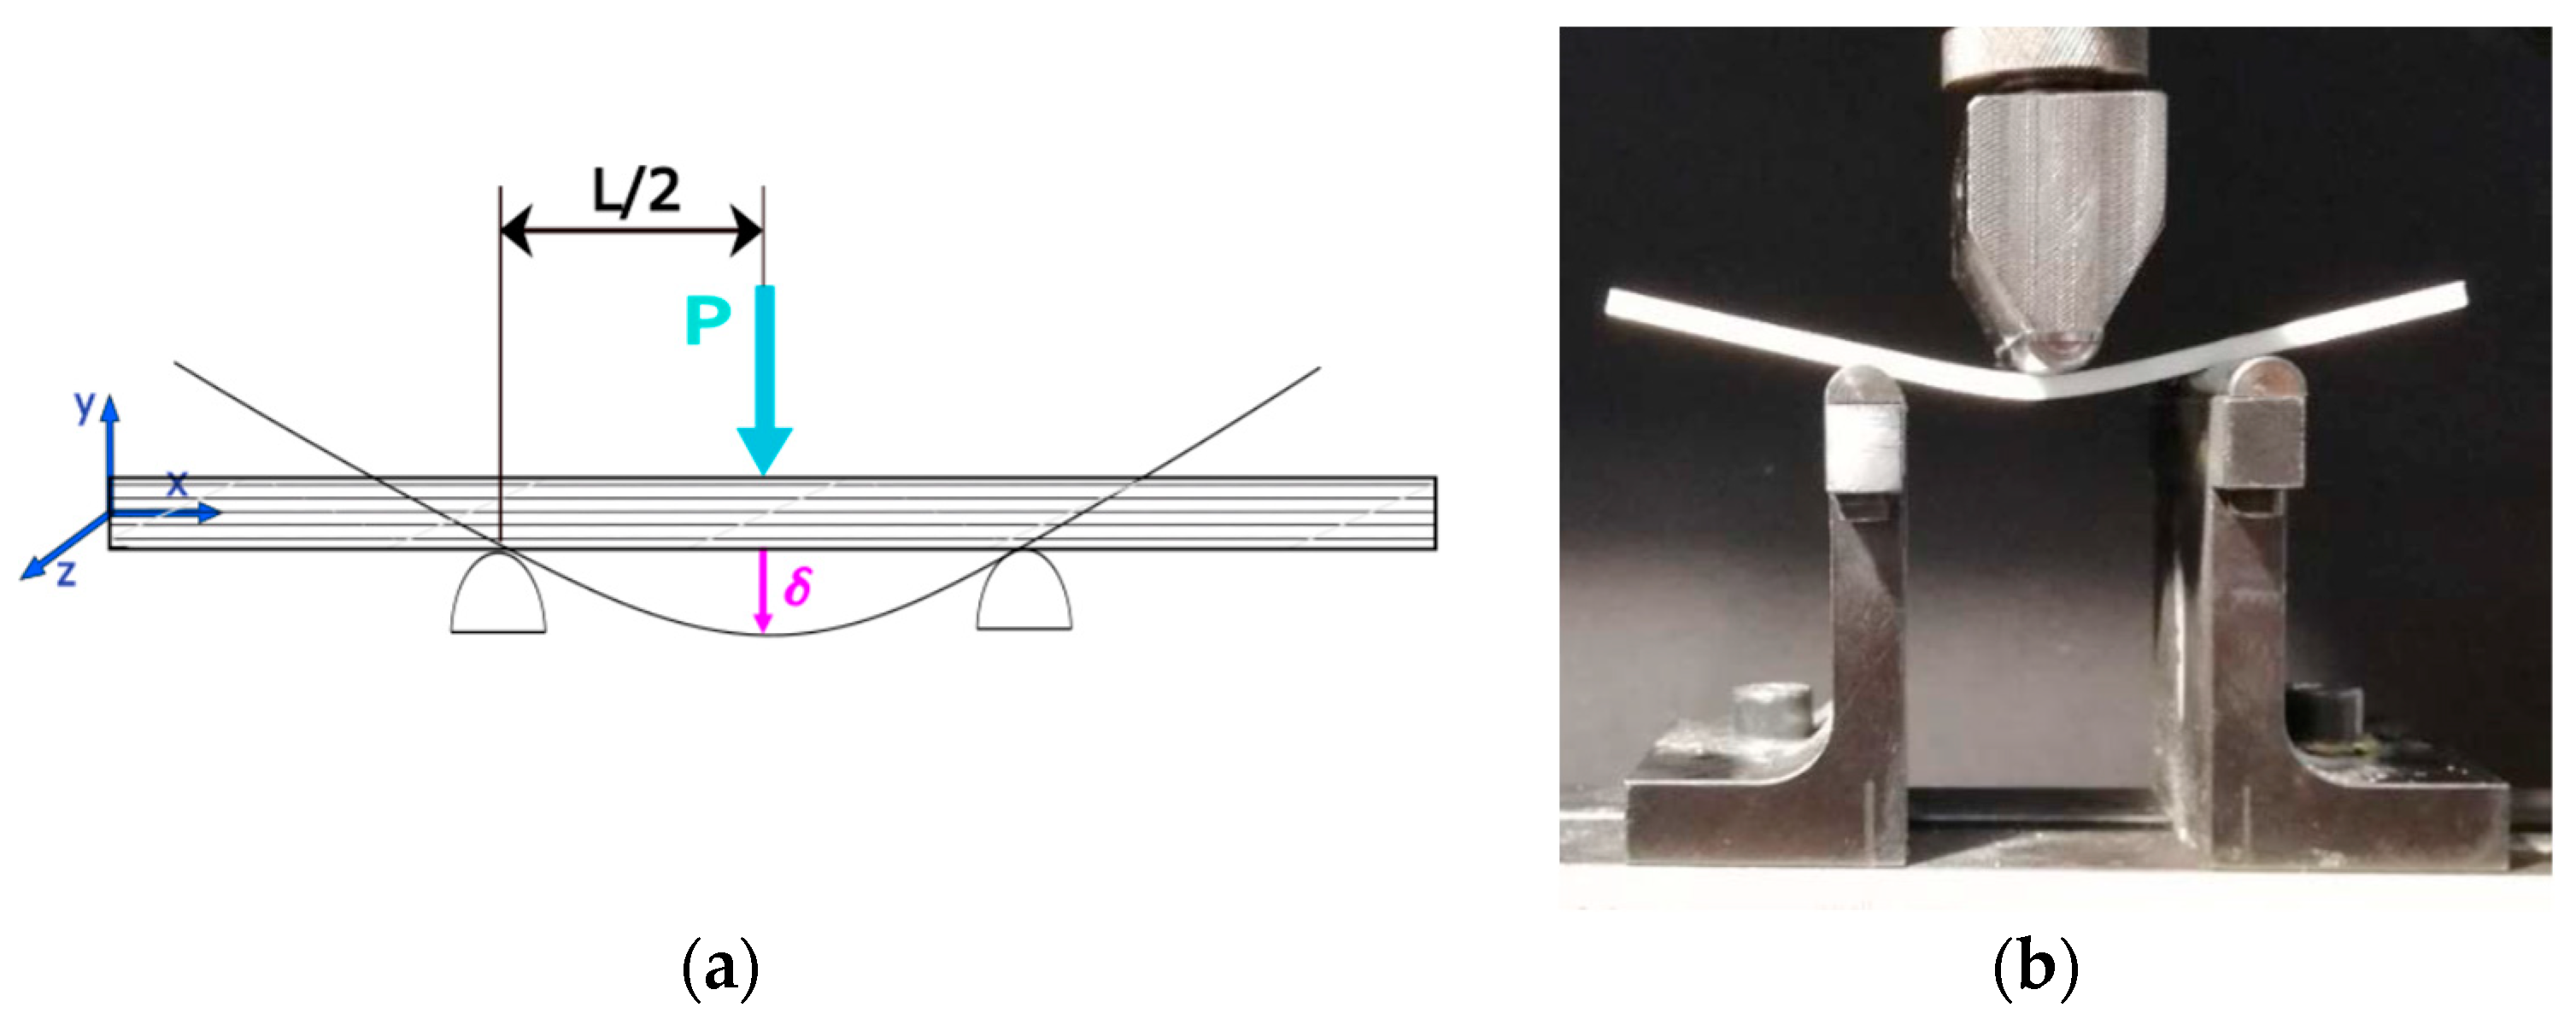
2.2.3. Three-Point Bending Test
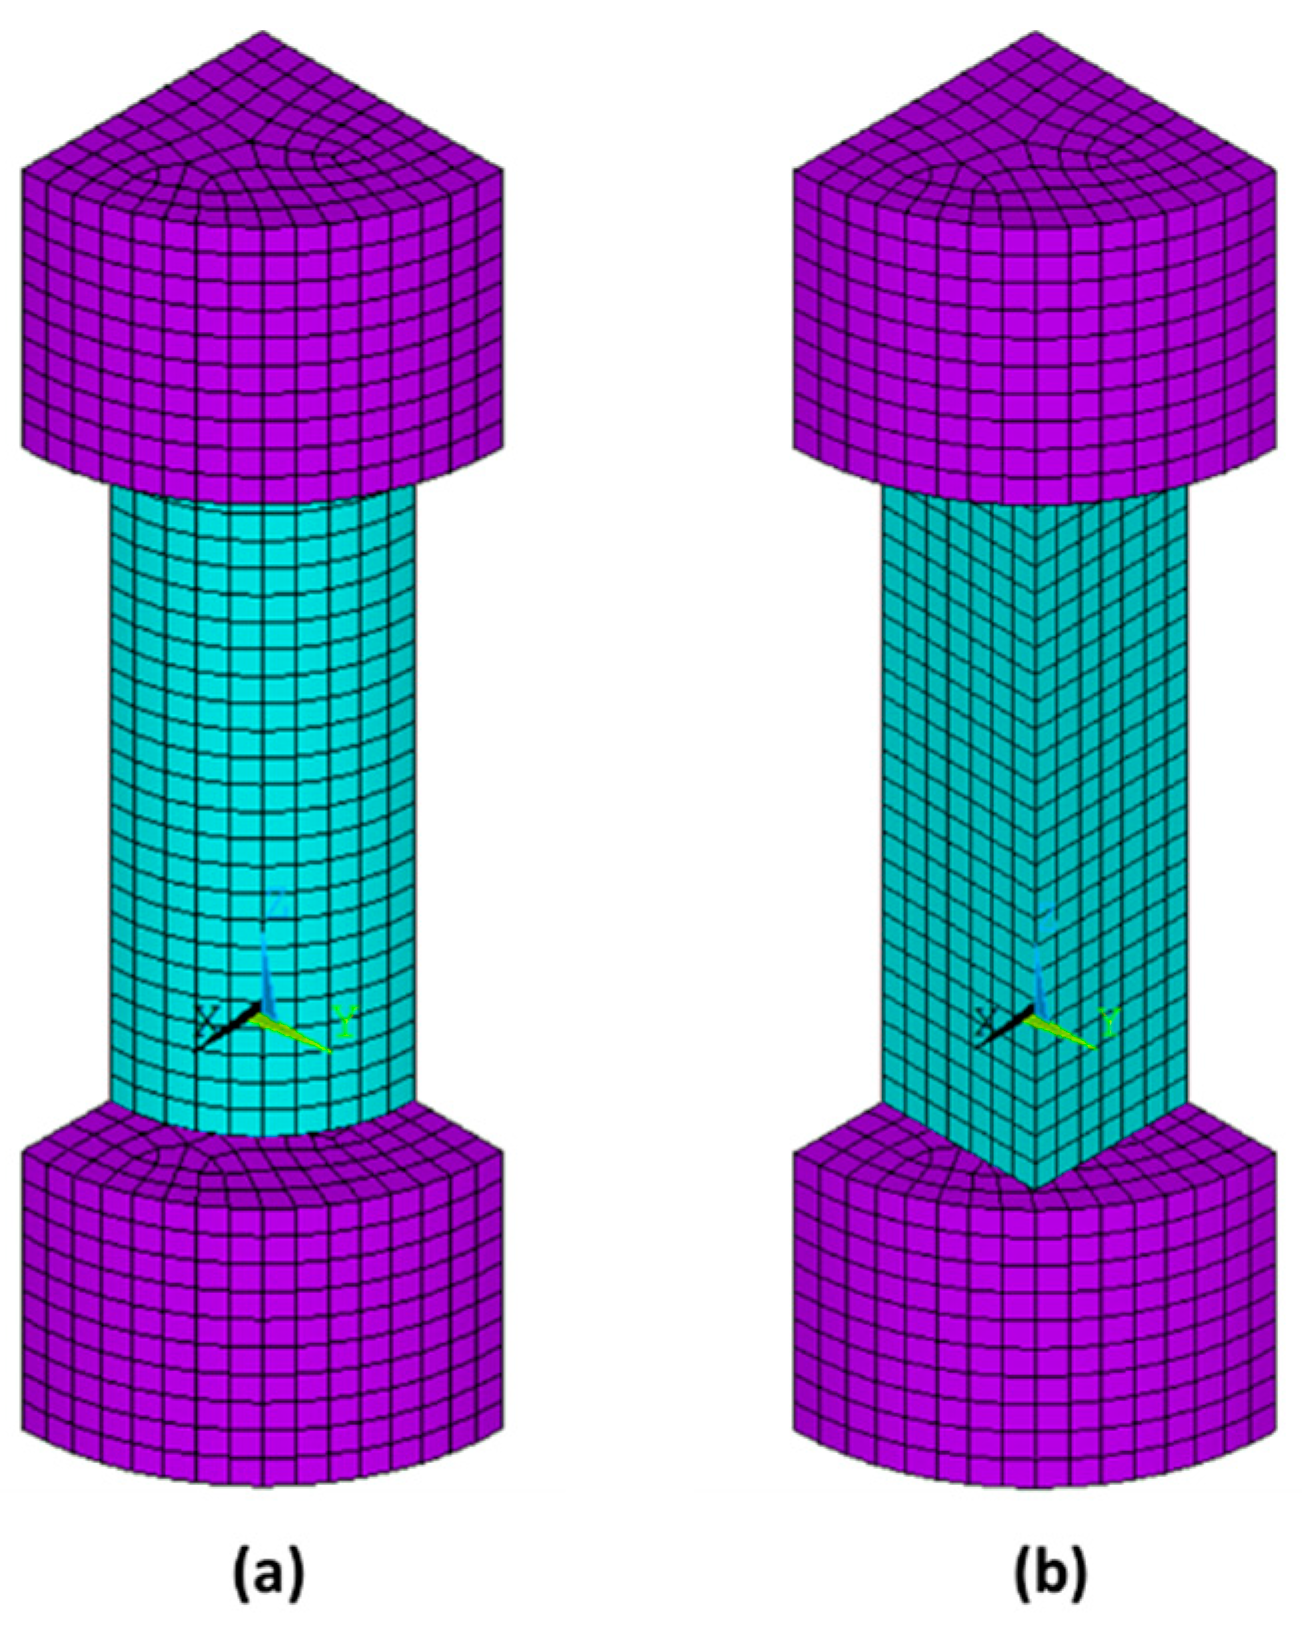
2.3. Numerical Test
- The simplified hypotheses assumed in the model were:
- Nominal dimensions were used to define the geometry of the sample
- The behaviour of the material was assumed to be linear, elastic and isotropic
- Neither the porosity of the material nor the manufacturing process was simulated. Figure 10 shows an enlarged image of the surface of one of the specimens, where the porosity and internal structure of the material is seen.
- Only a quarter of the specimen was modelled due to the symmetry of the analysis (Figure 11).
- Finite element Solid 186—3D, 20-node—was used for prismatic and cylindrical specimens;
- Material data (E,ν) found from experimental tests were introduced;
- The analysis was geometrically non-linear (GNA). Through an iterative process (Newton–Raphson), an equilibrium of forces was reached at each load step. The loading process was controlled by displacements.
3. Results
3.1. Results of Experimental Tests
3.1.1. Tensile Test Results
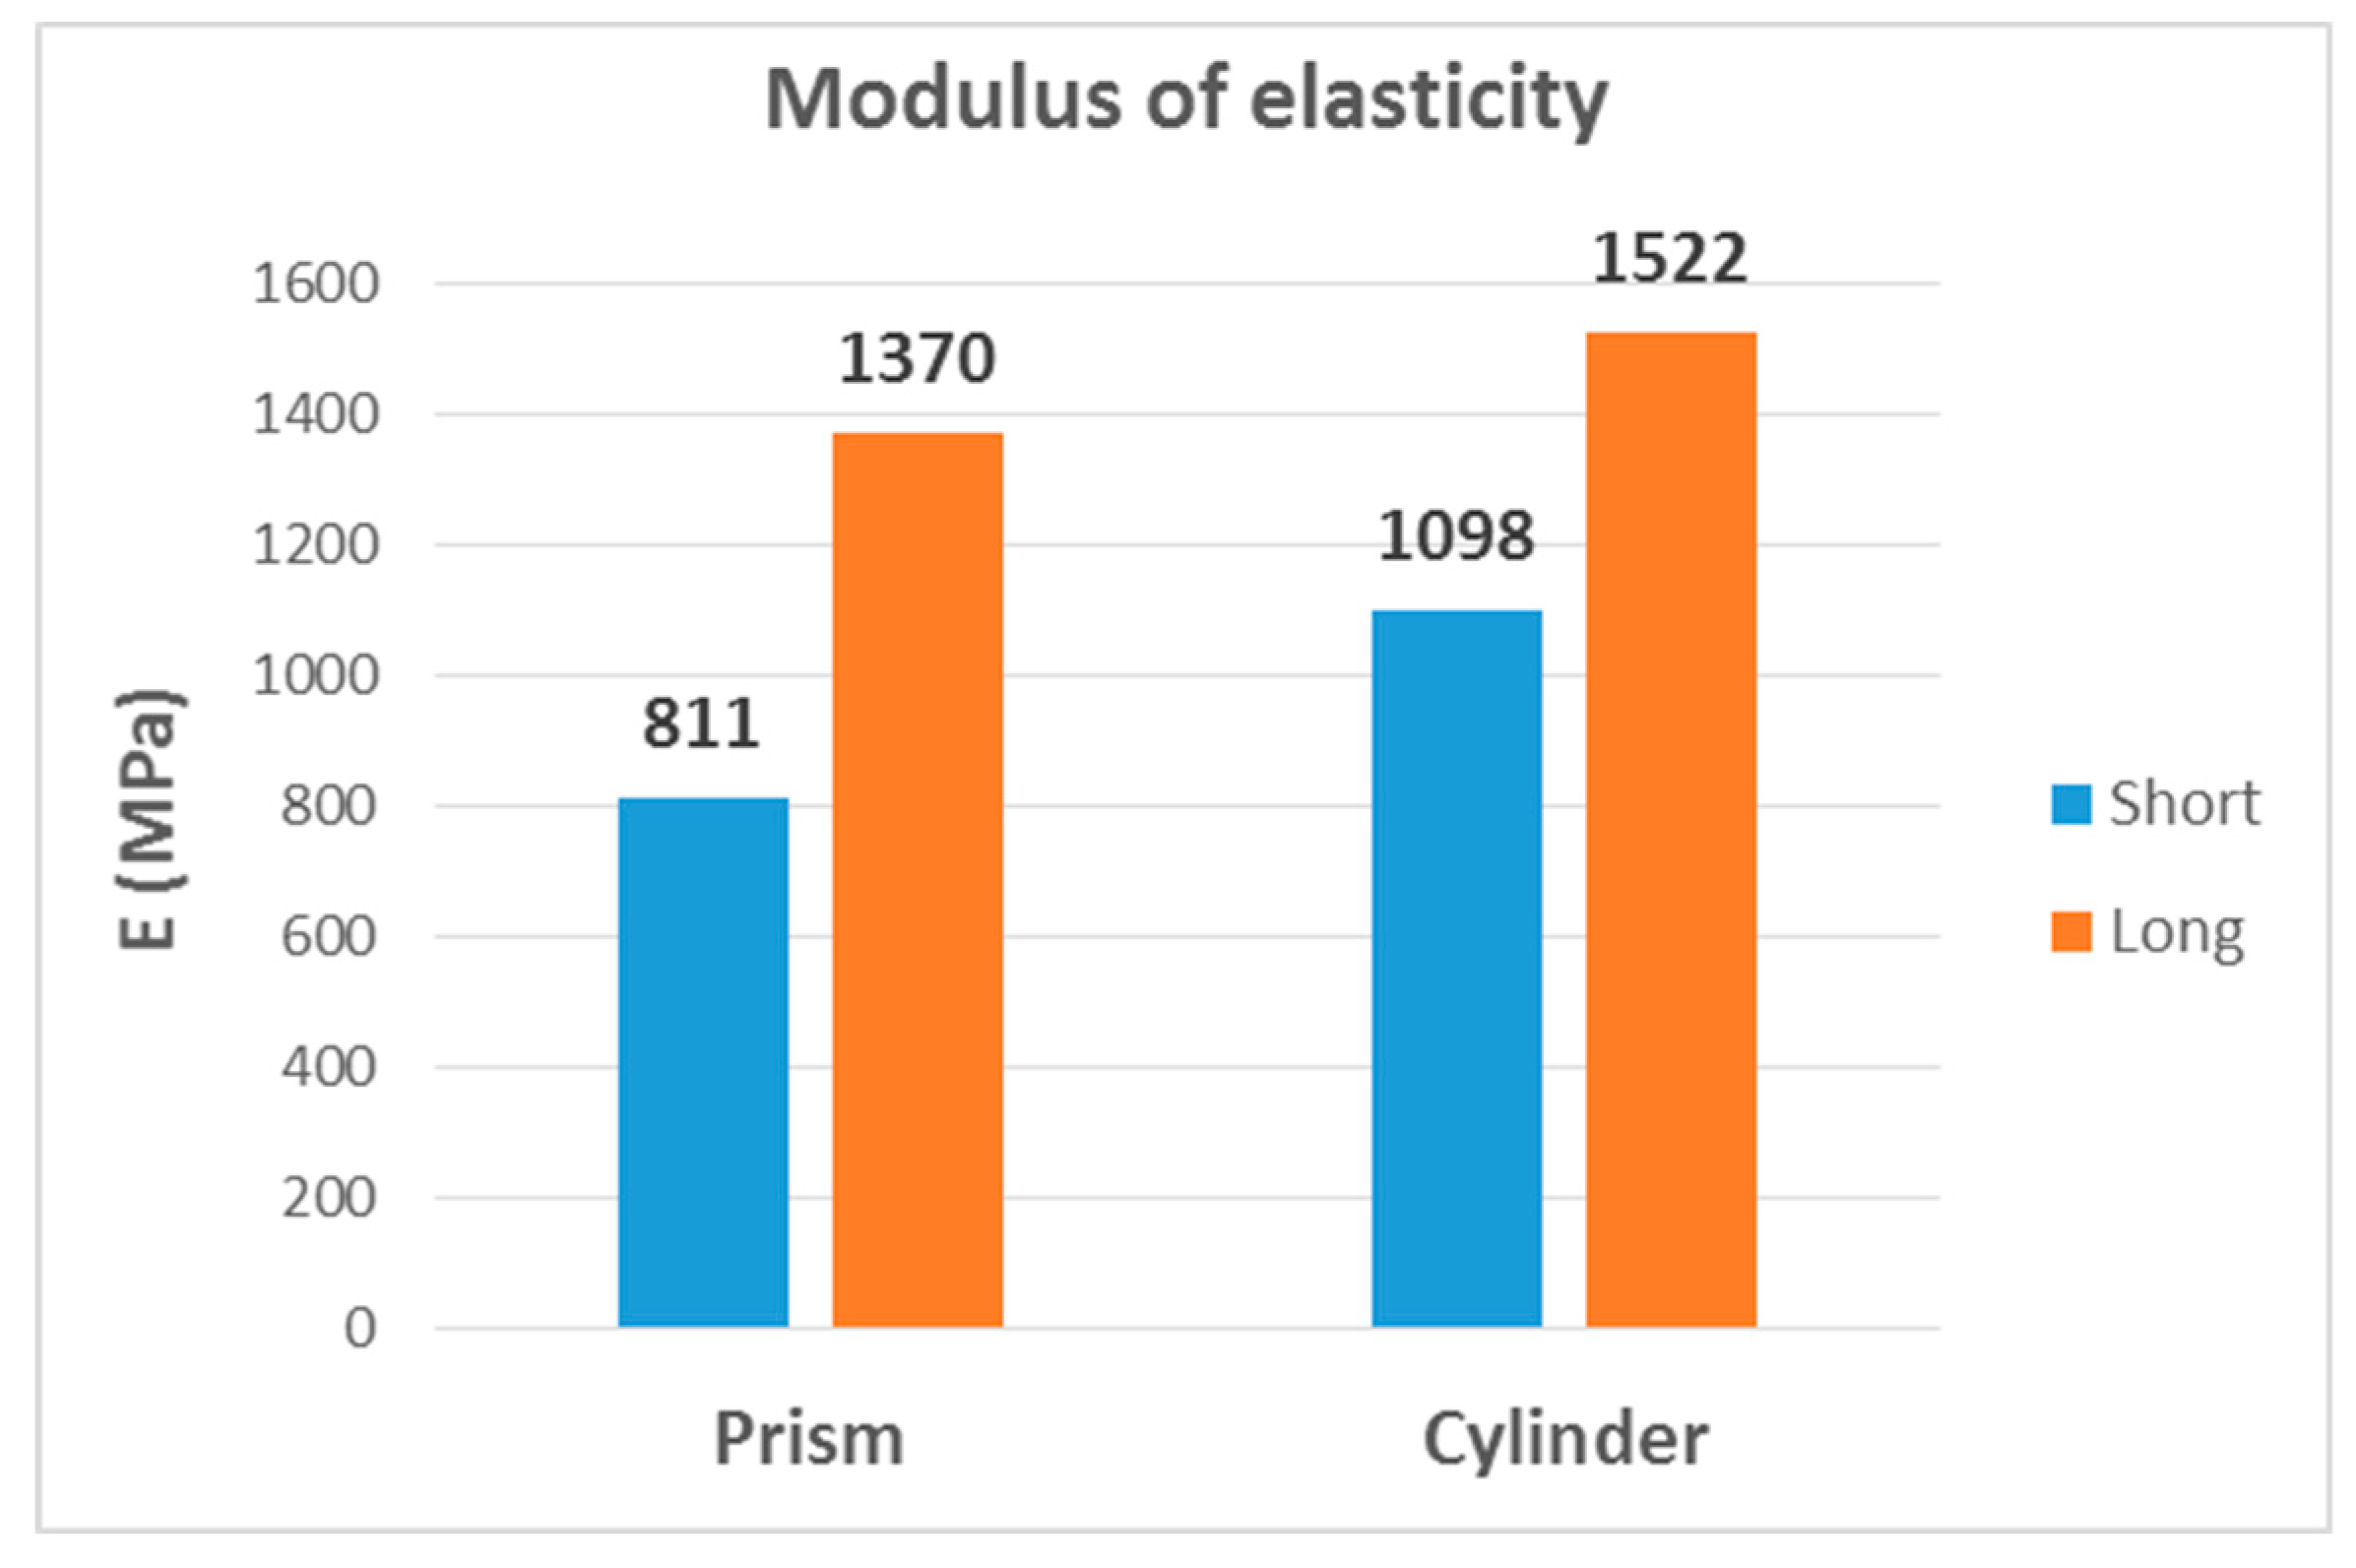
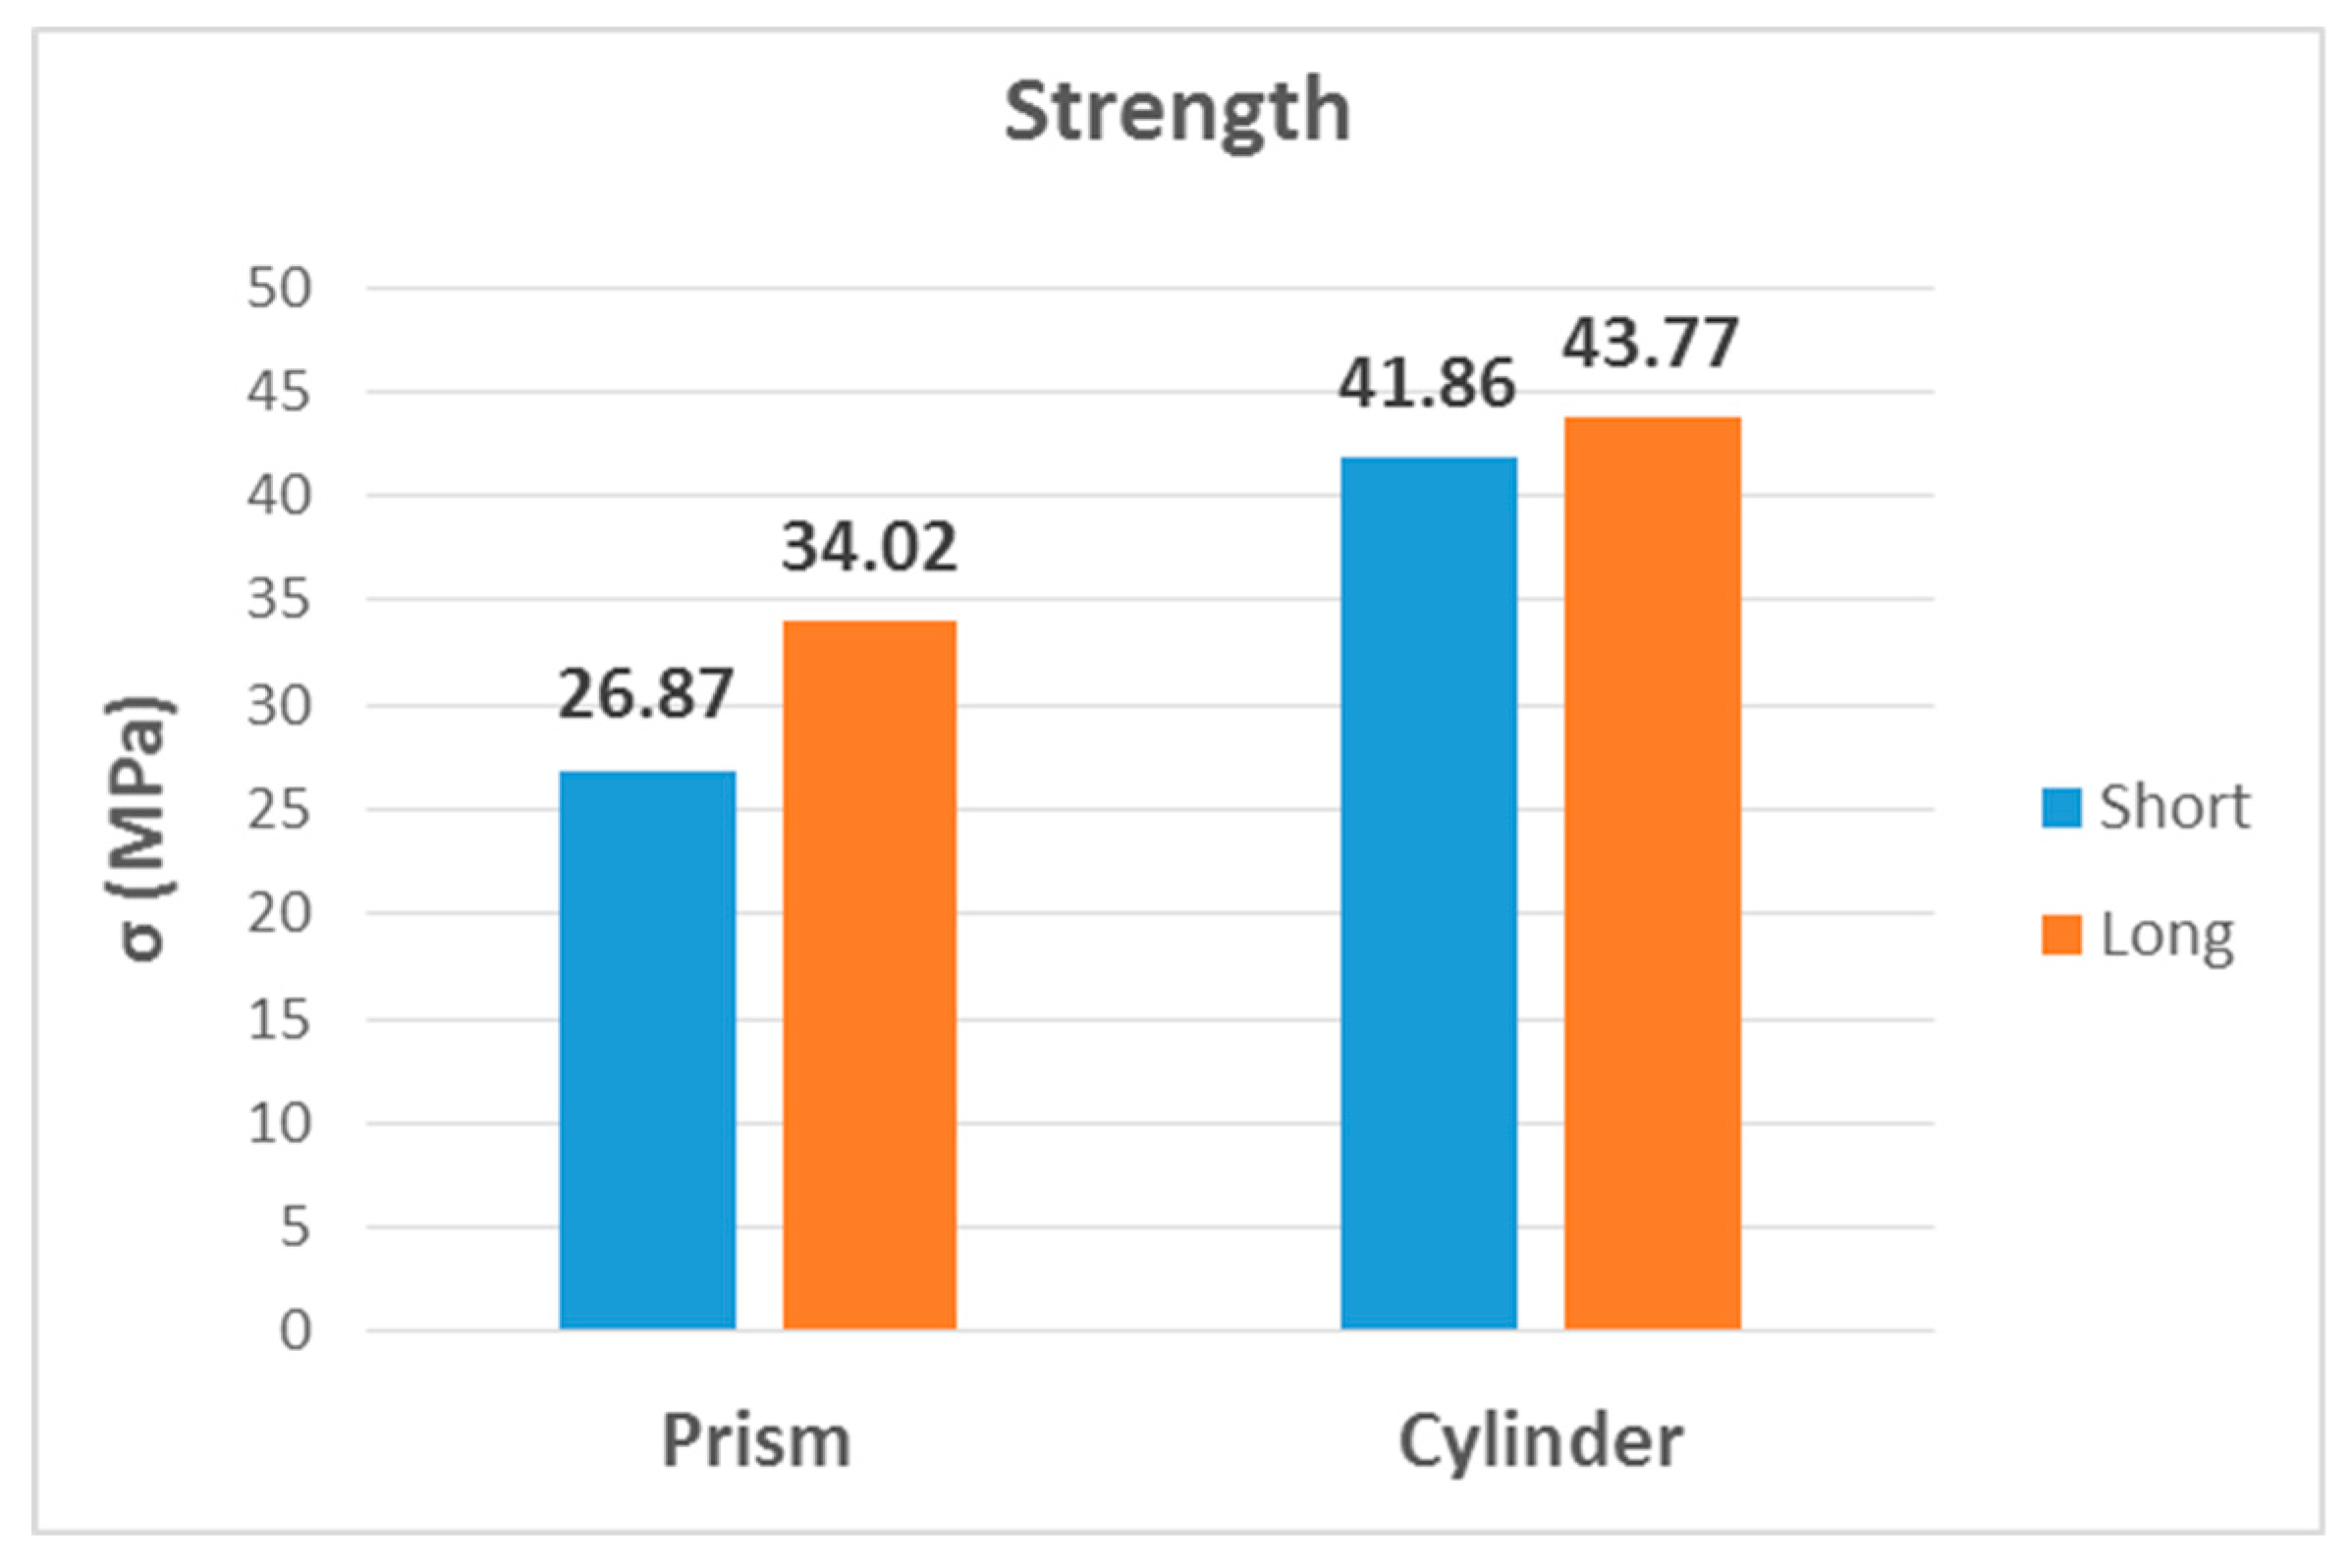
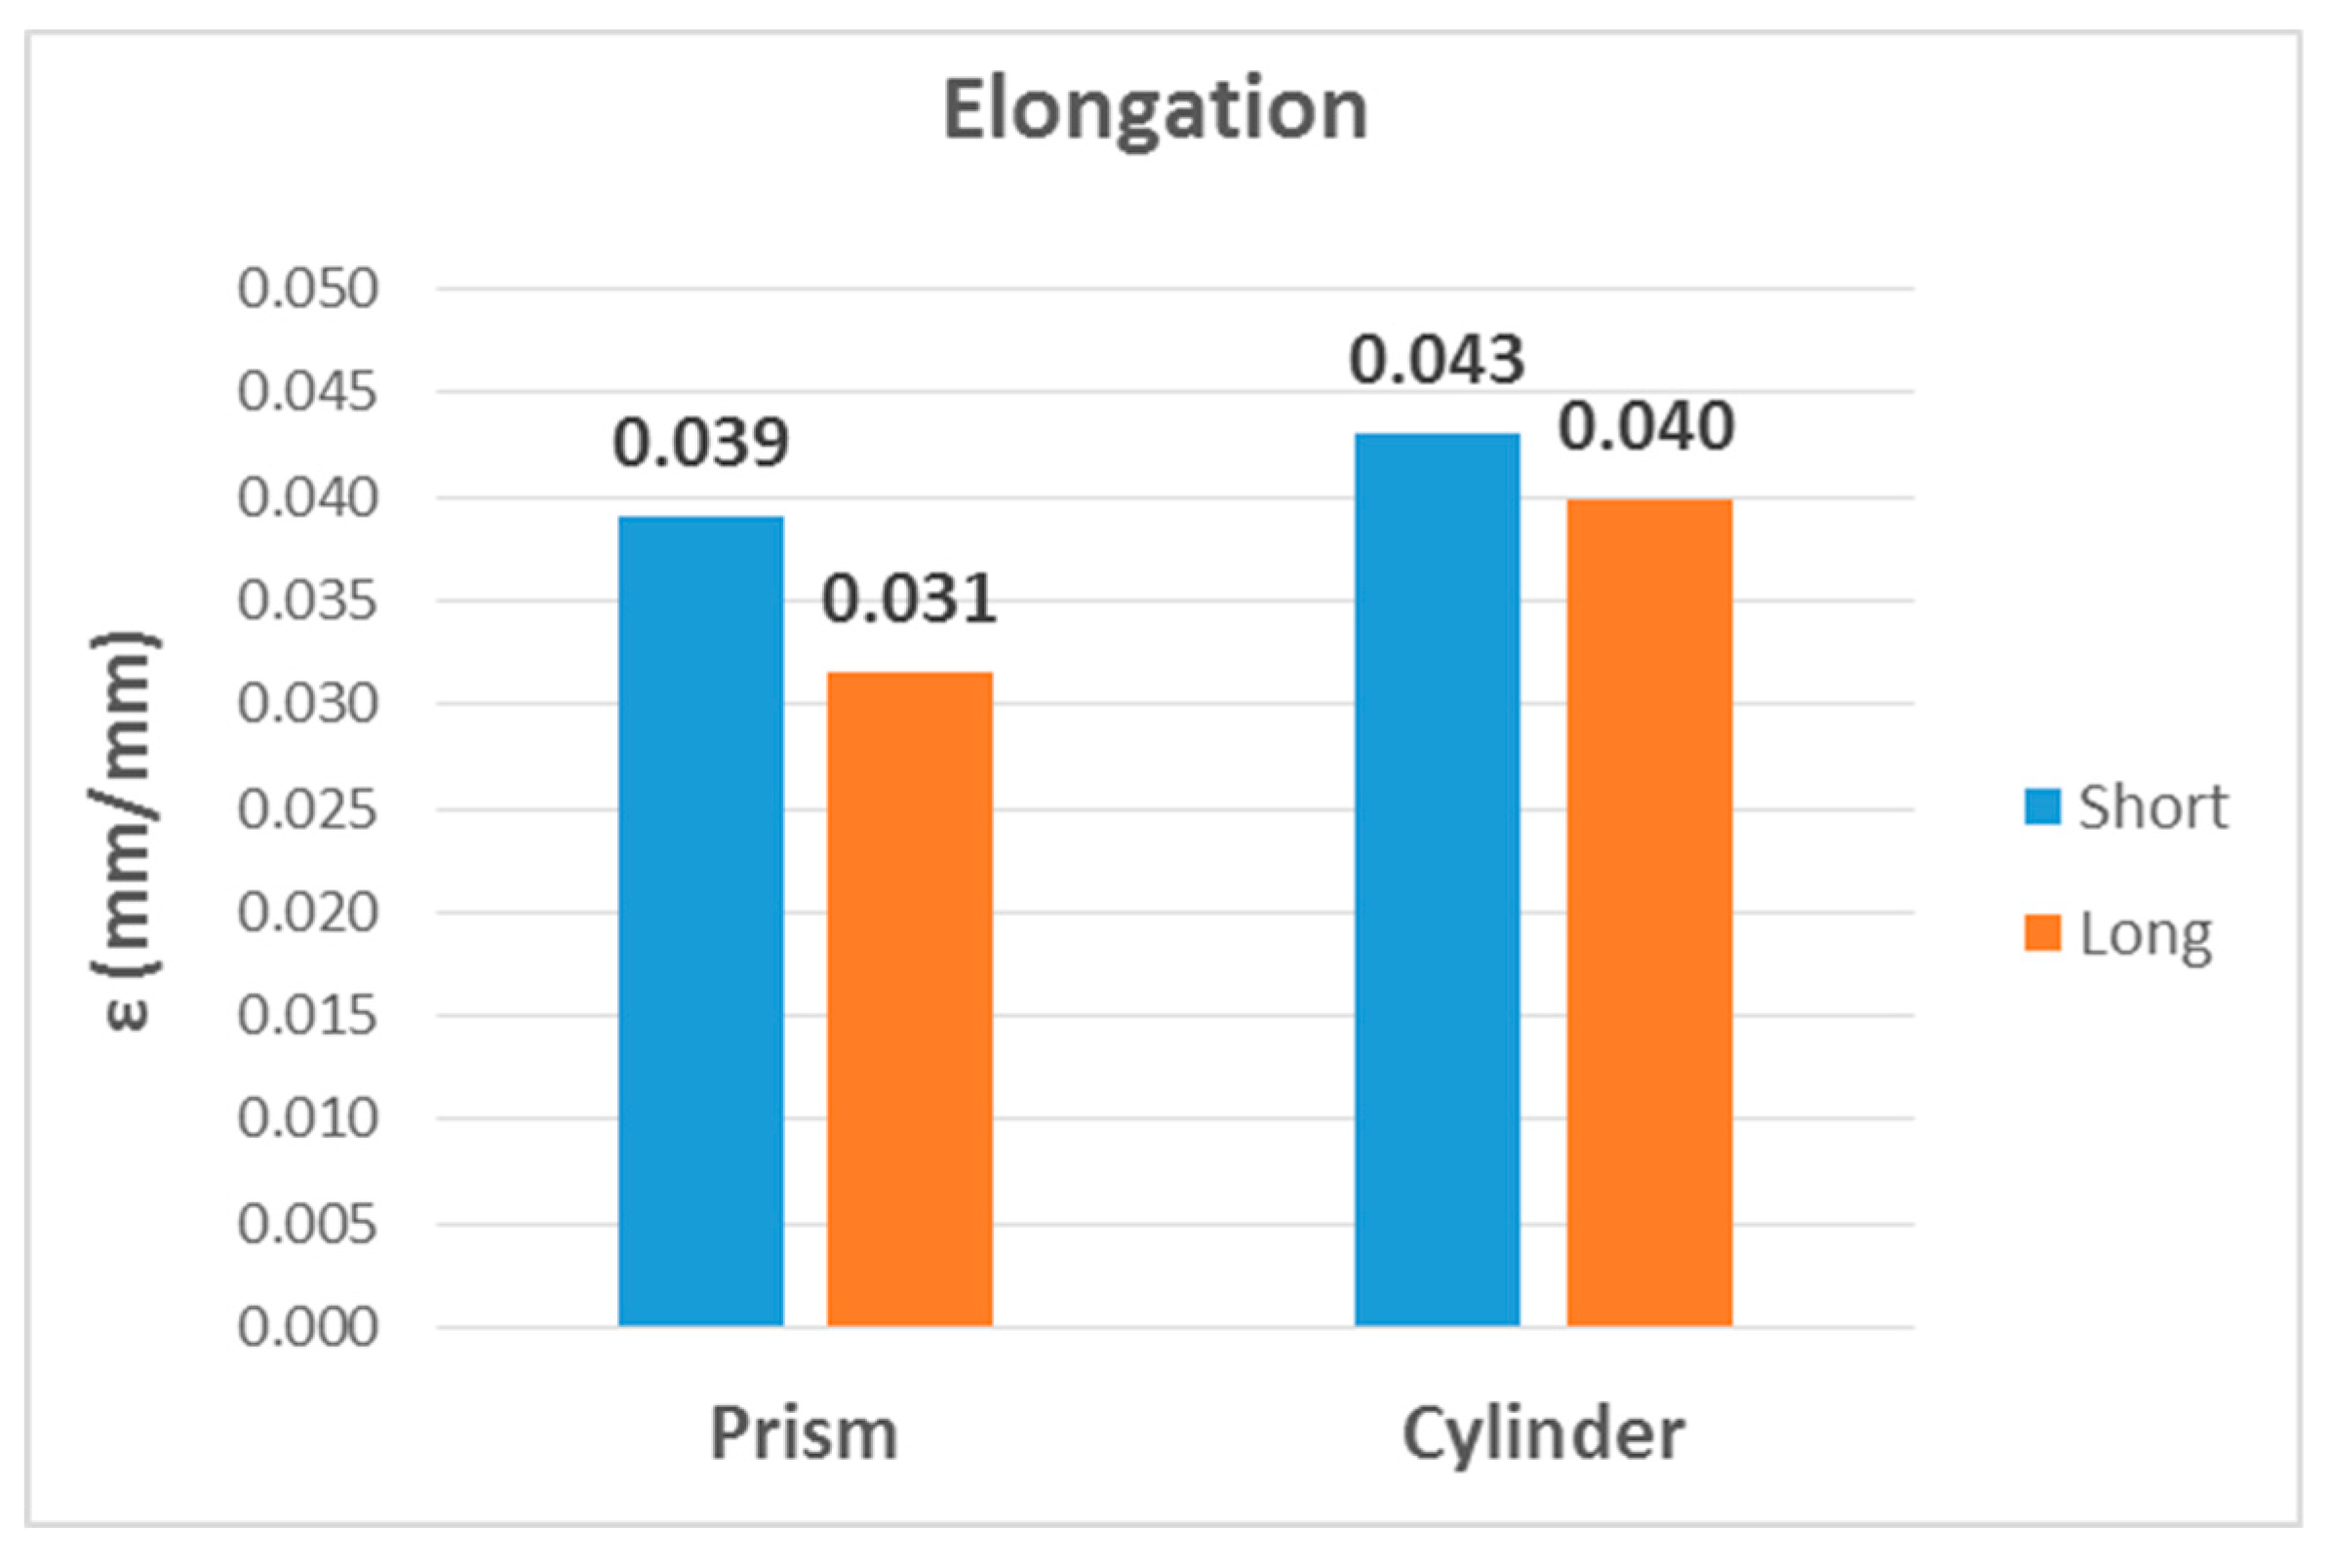
3.1.2. Compression Test Results
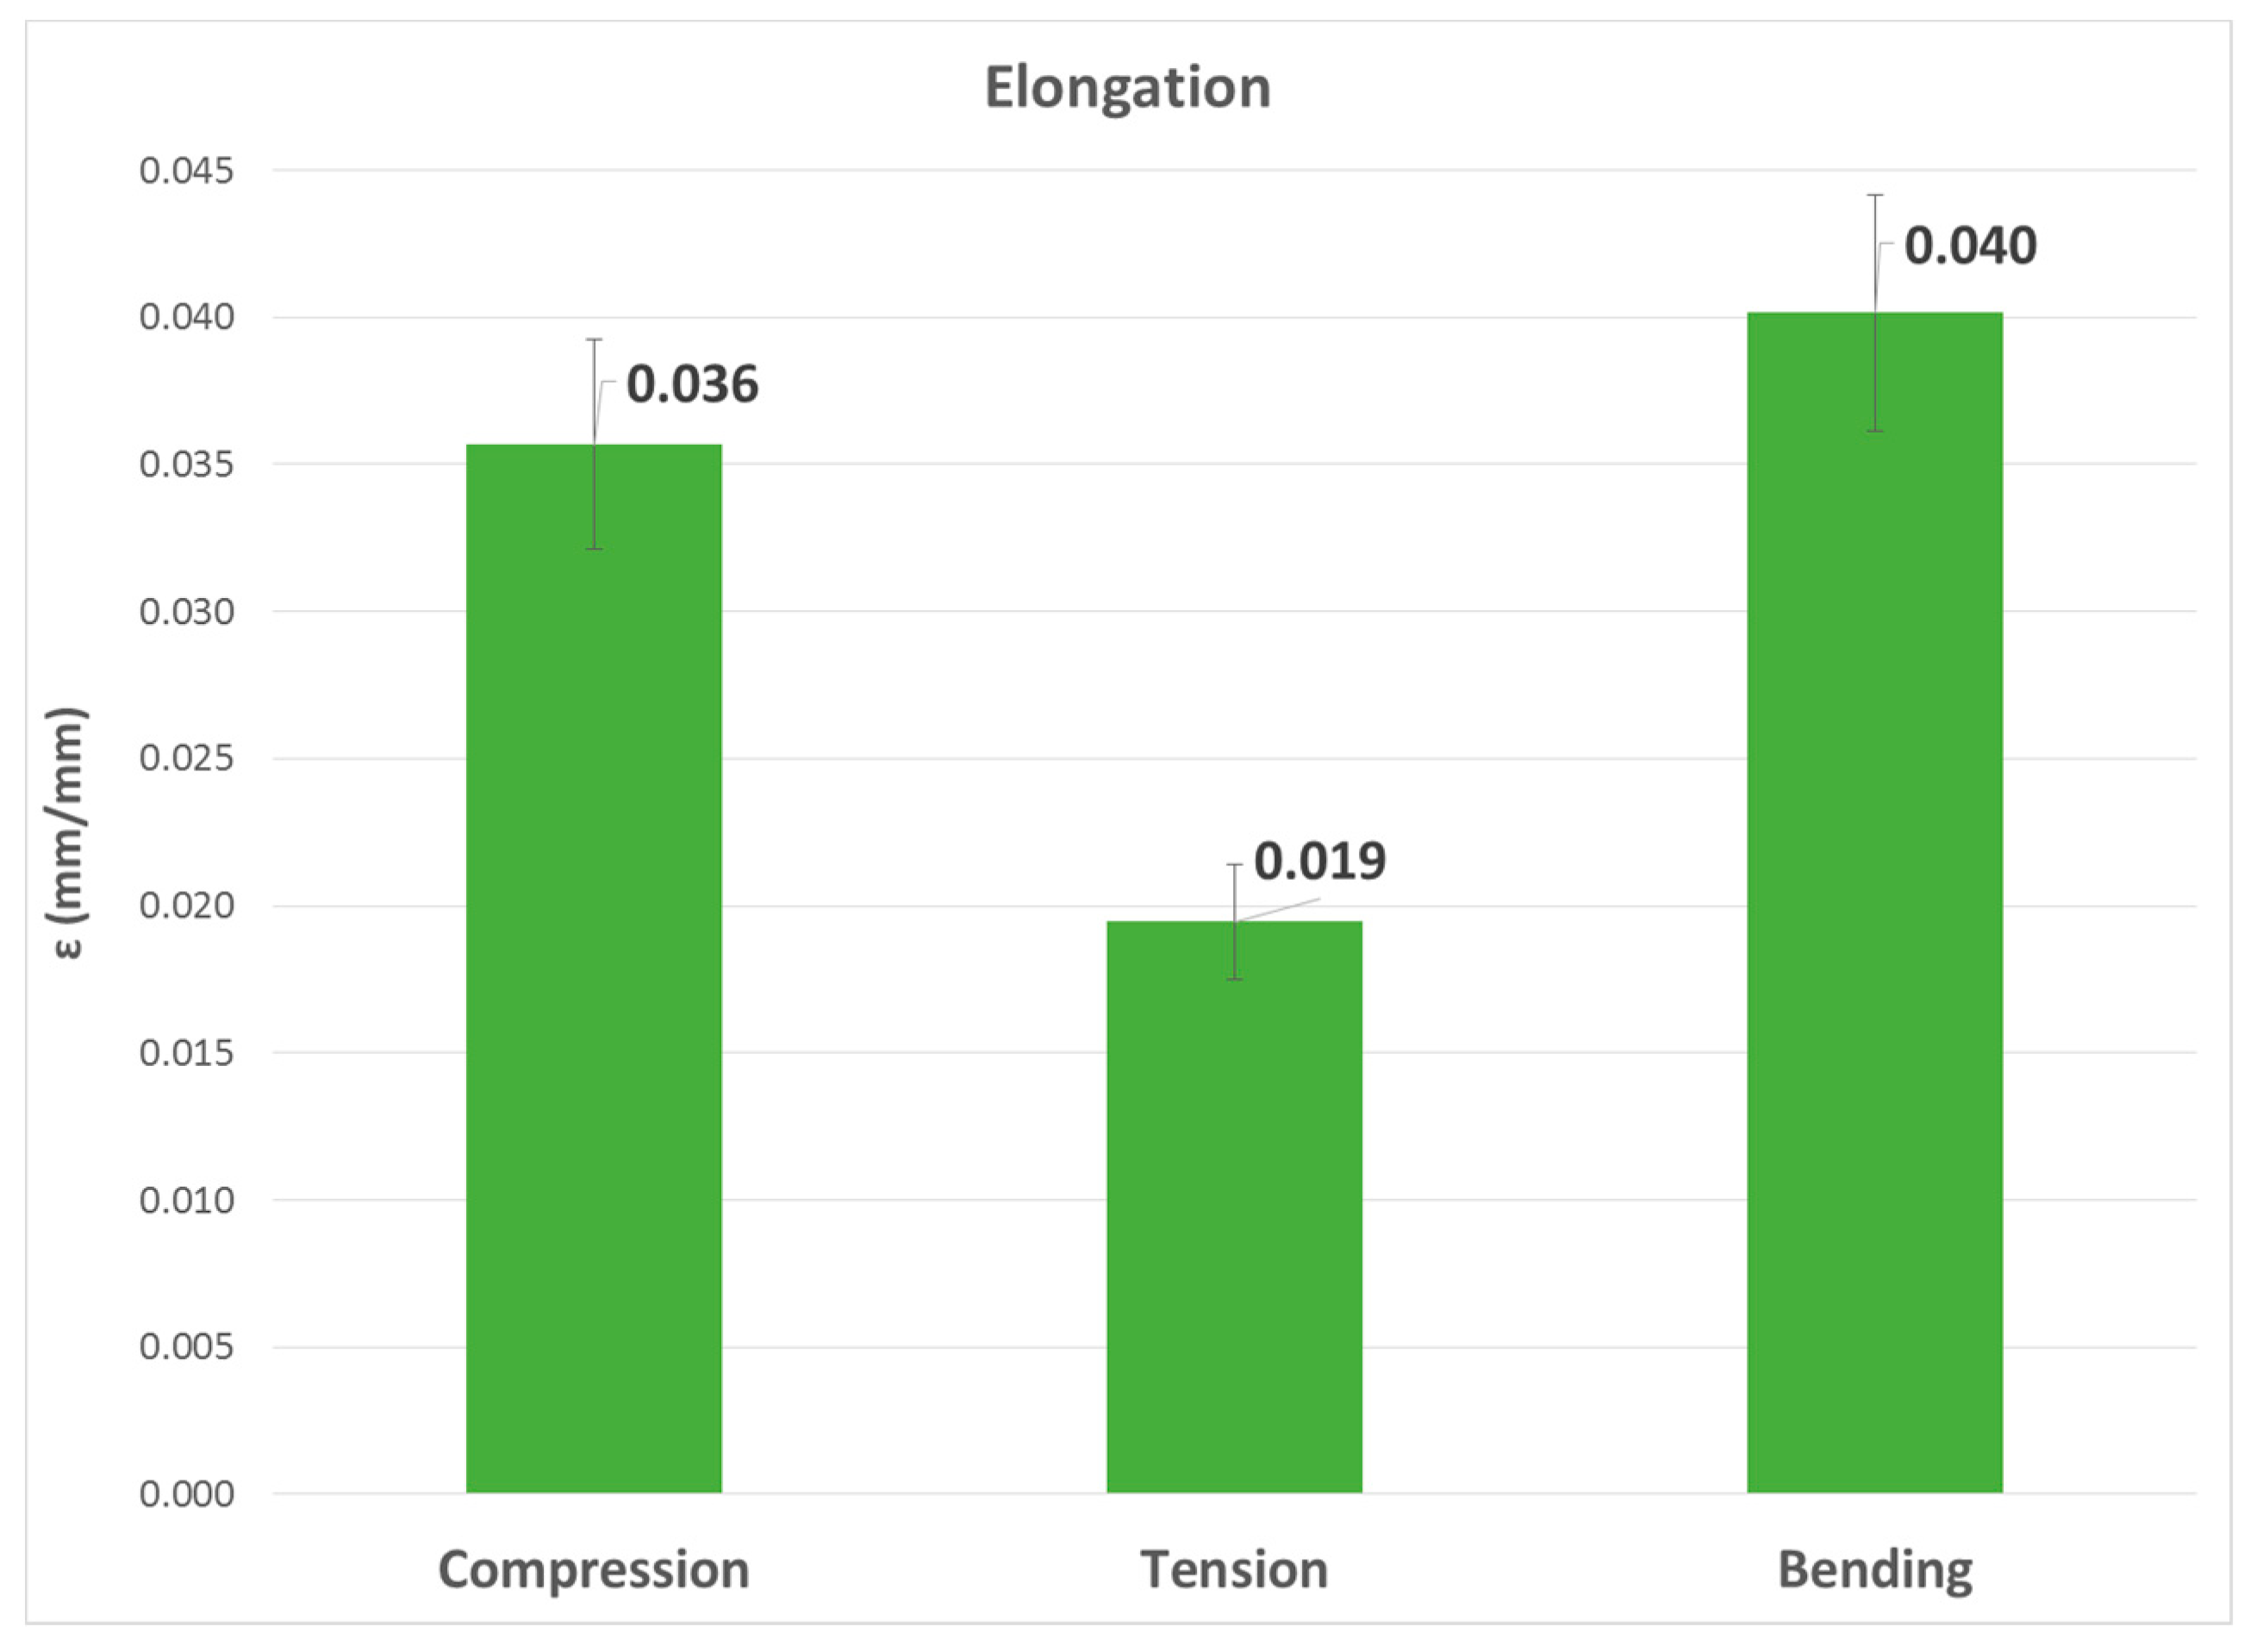
3.1.3. Bending Test Results
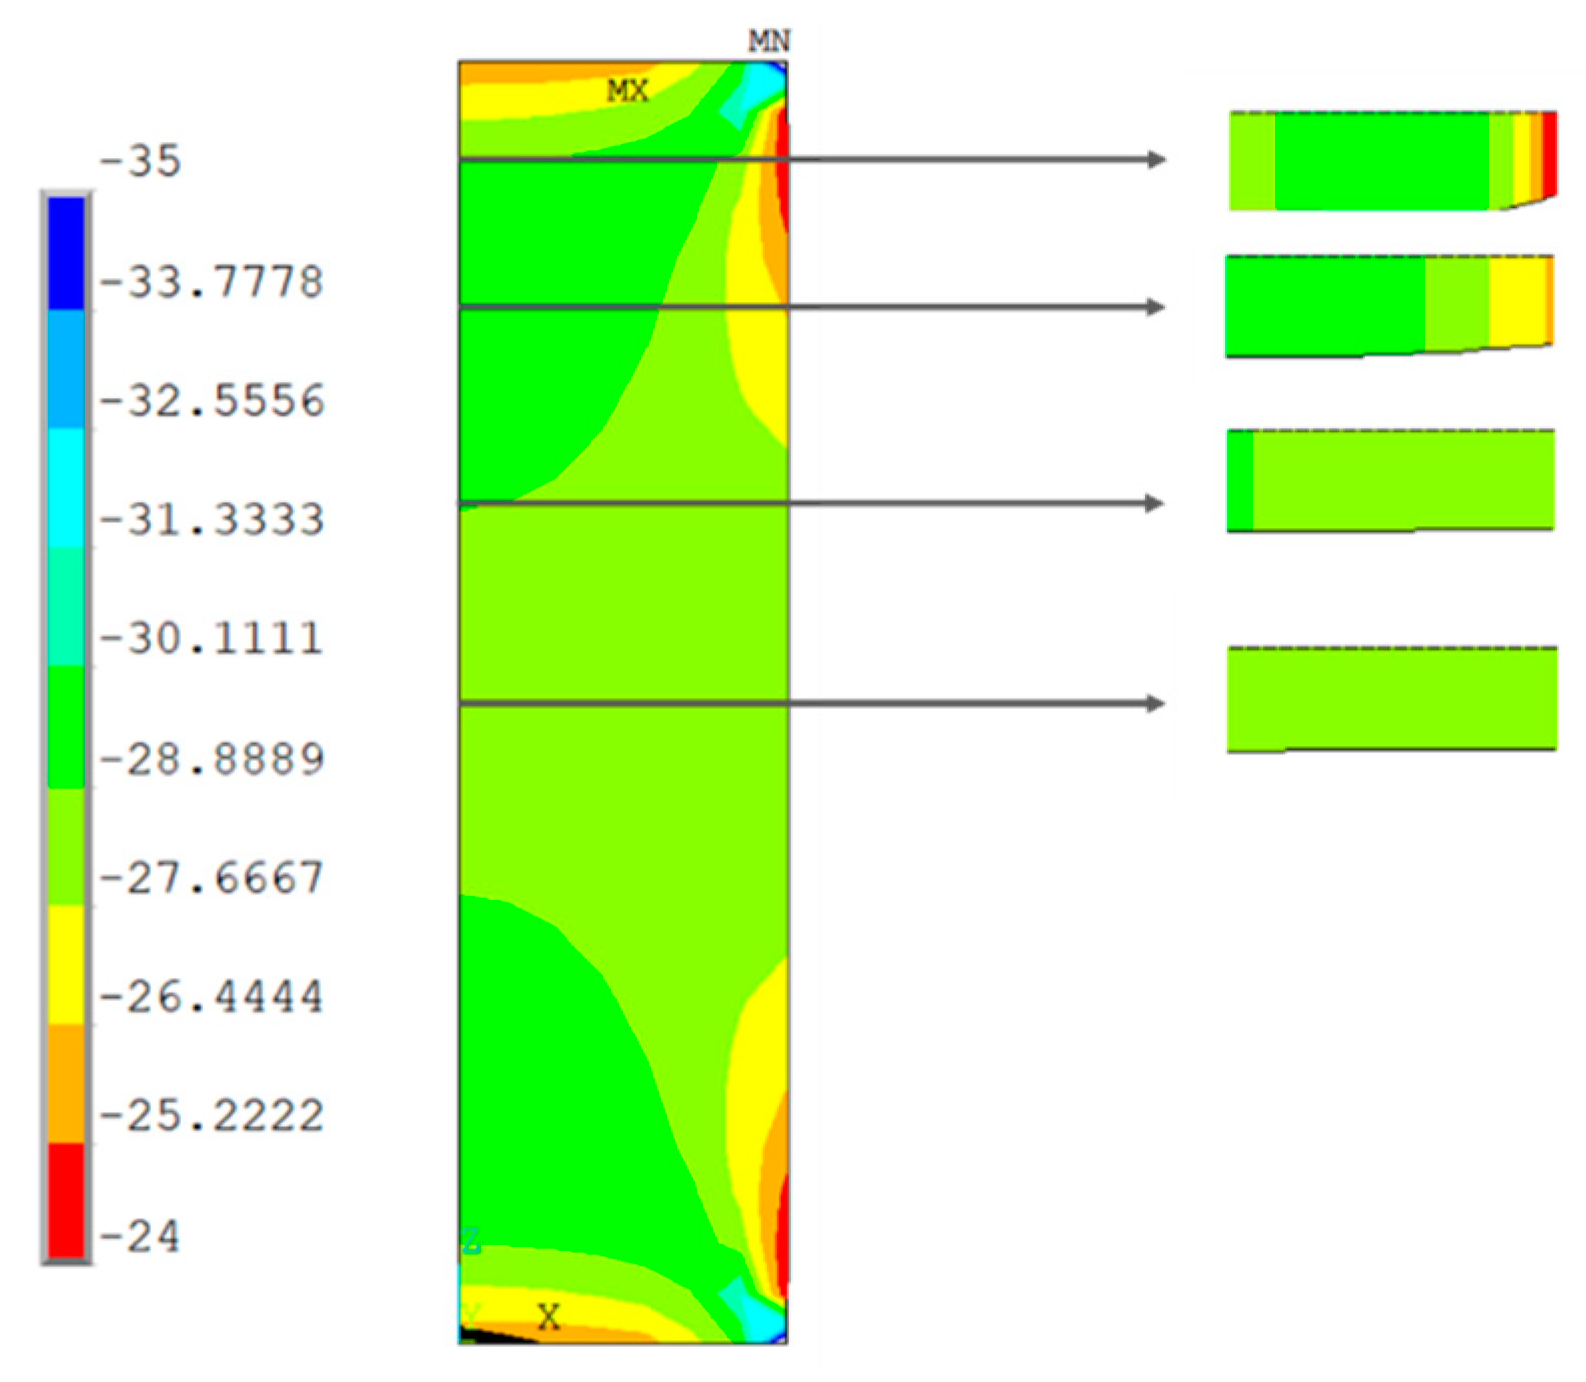
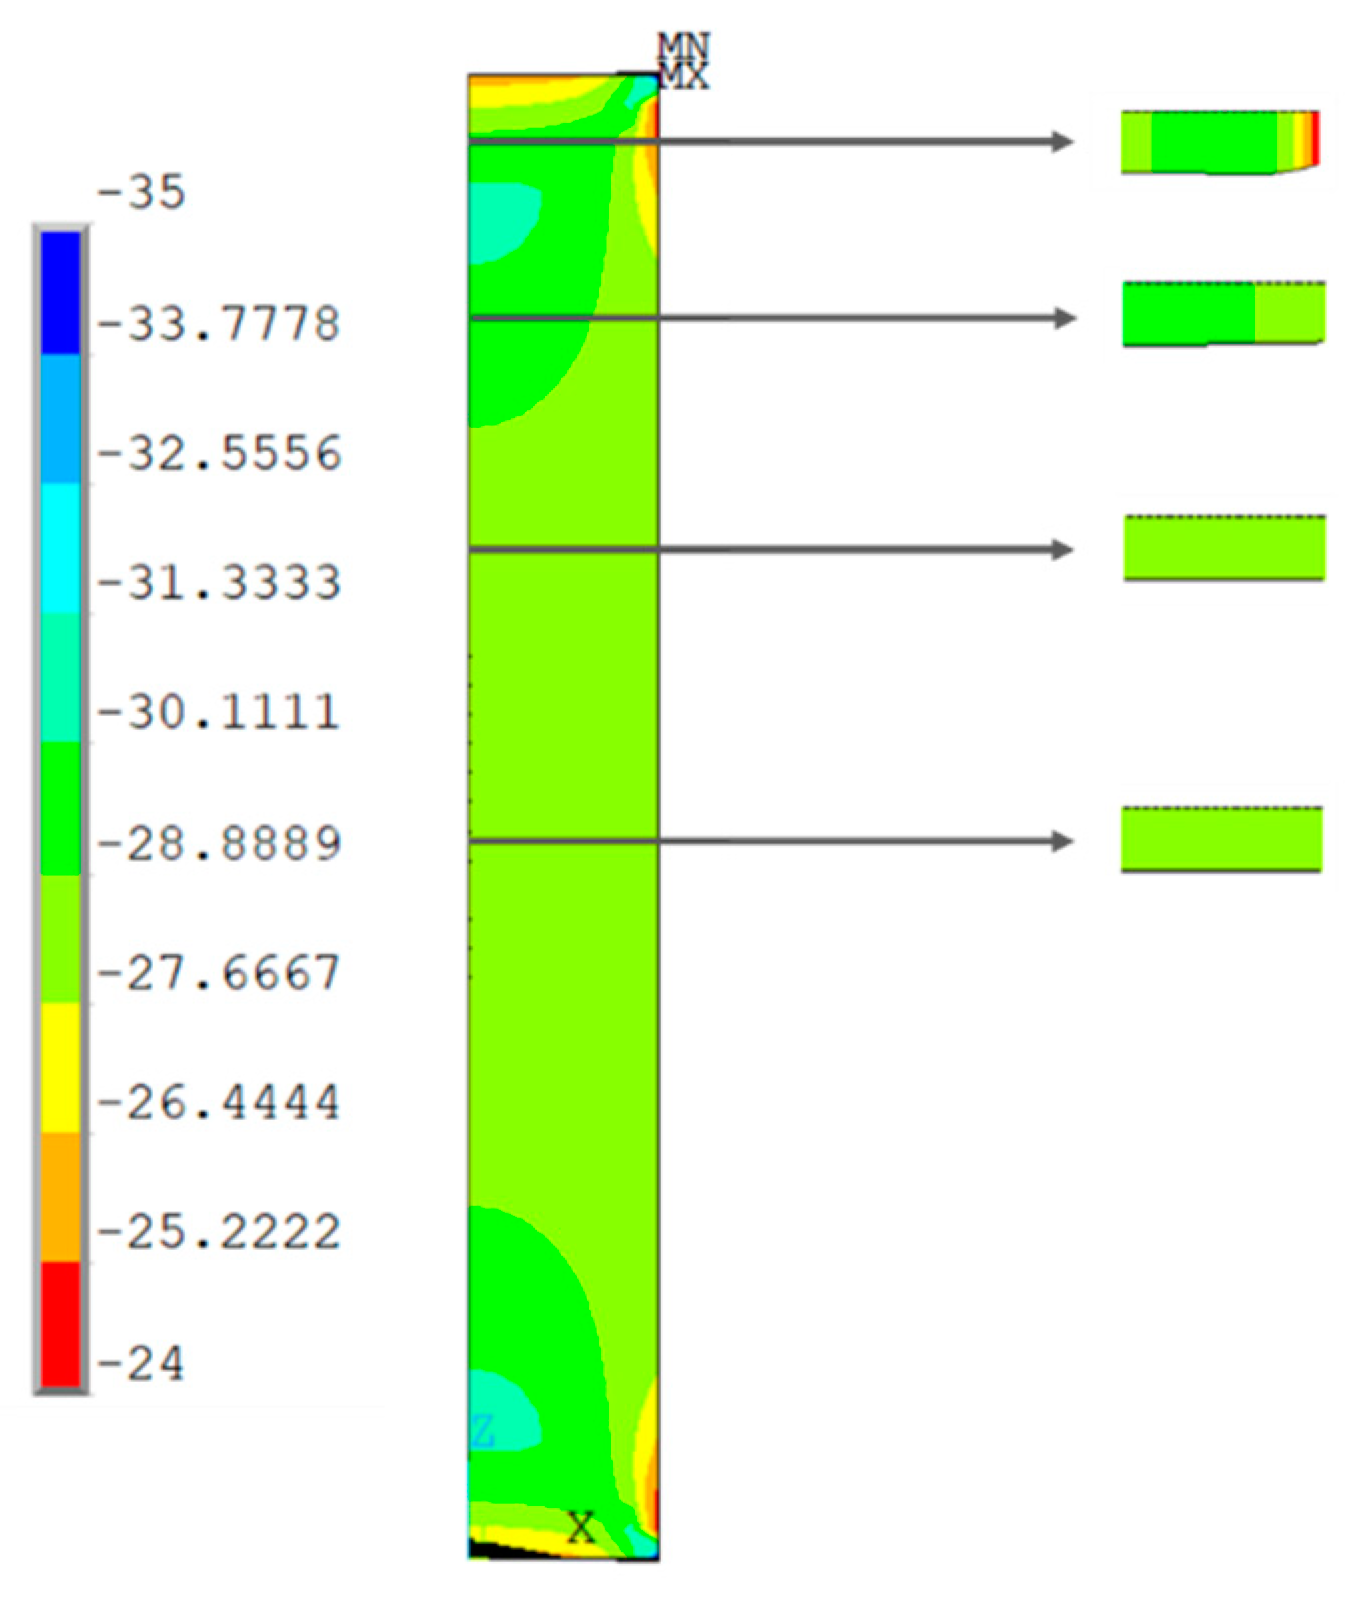
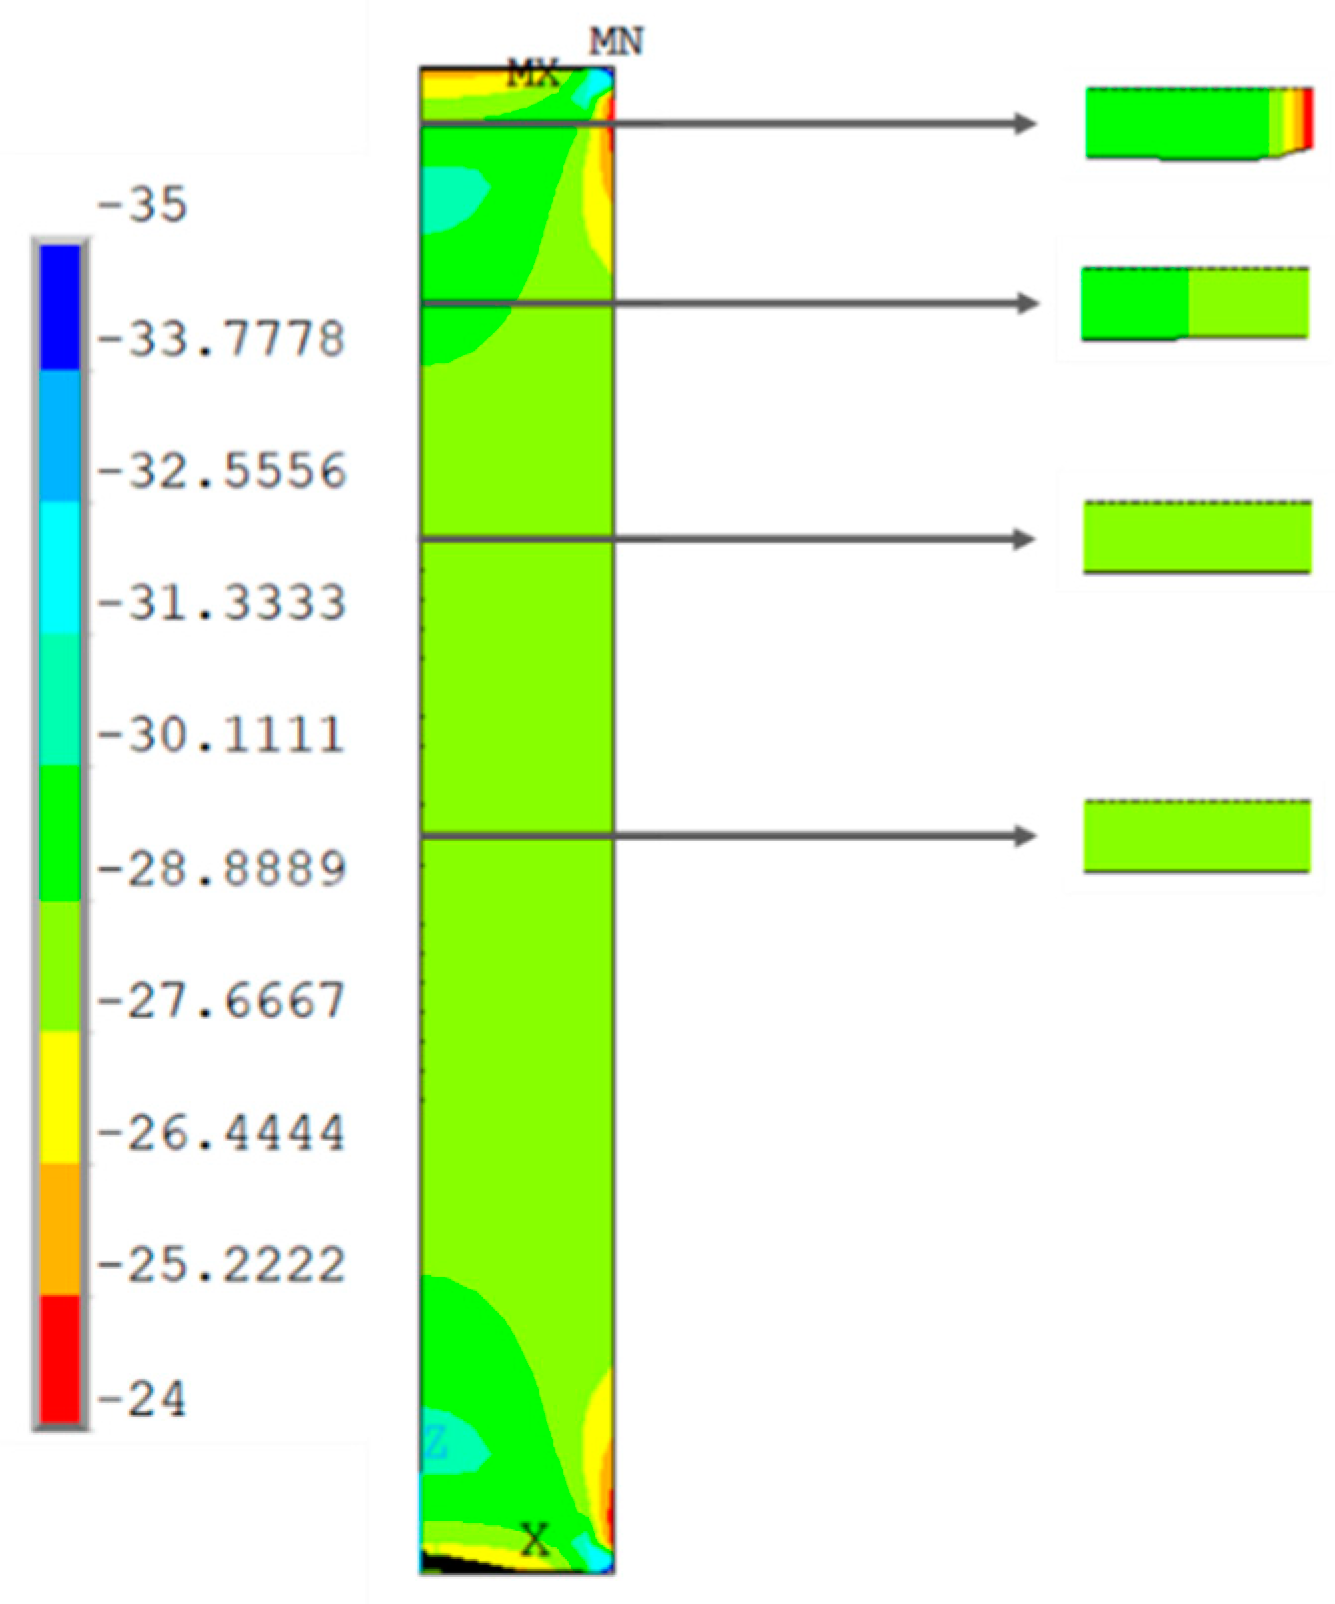
3.2. Numerical Testing Results (FE Analysis)
4. Discussion of Results
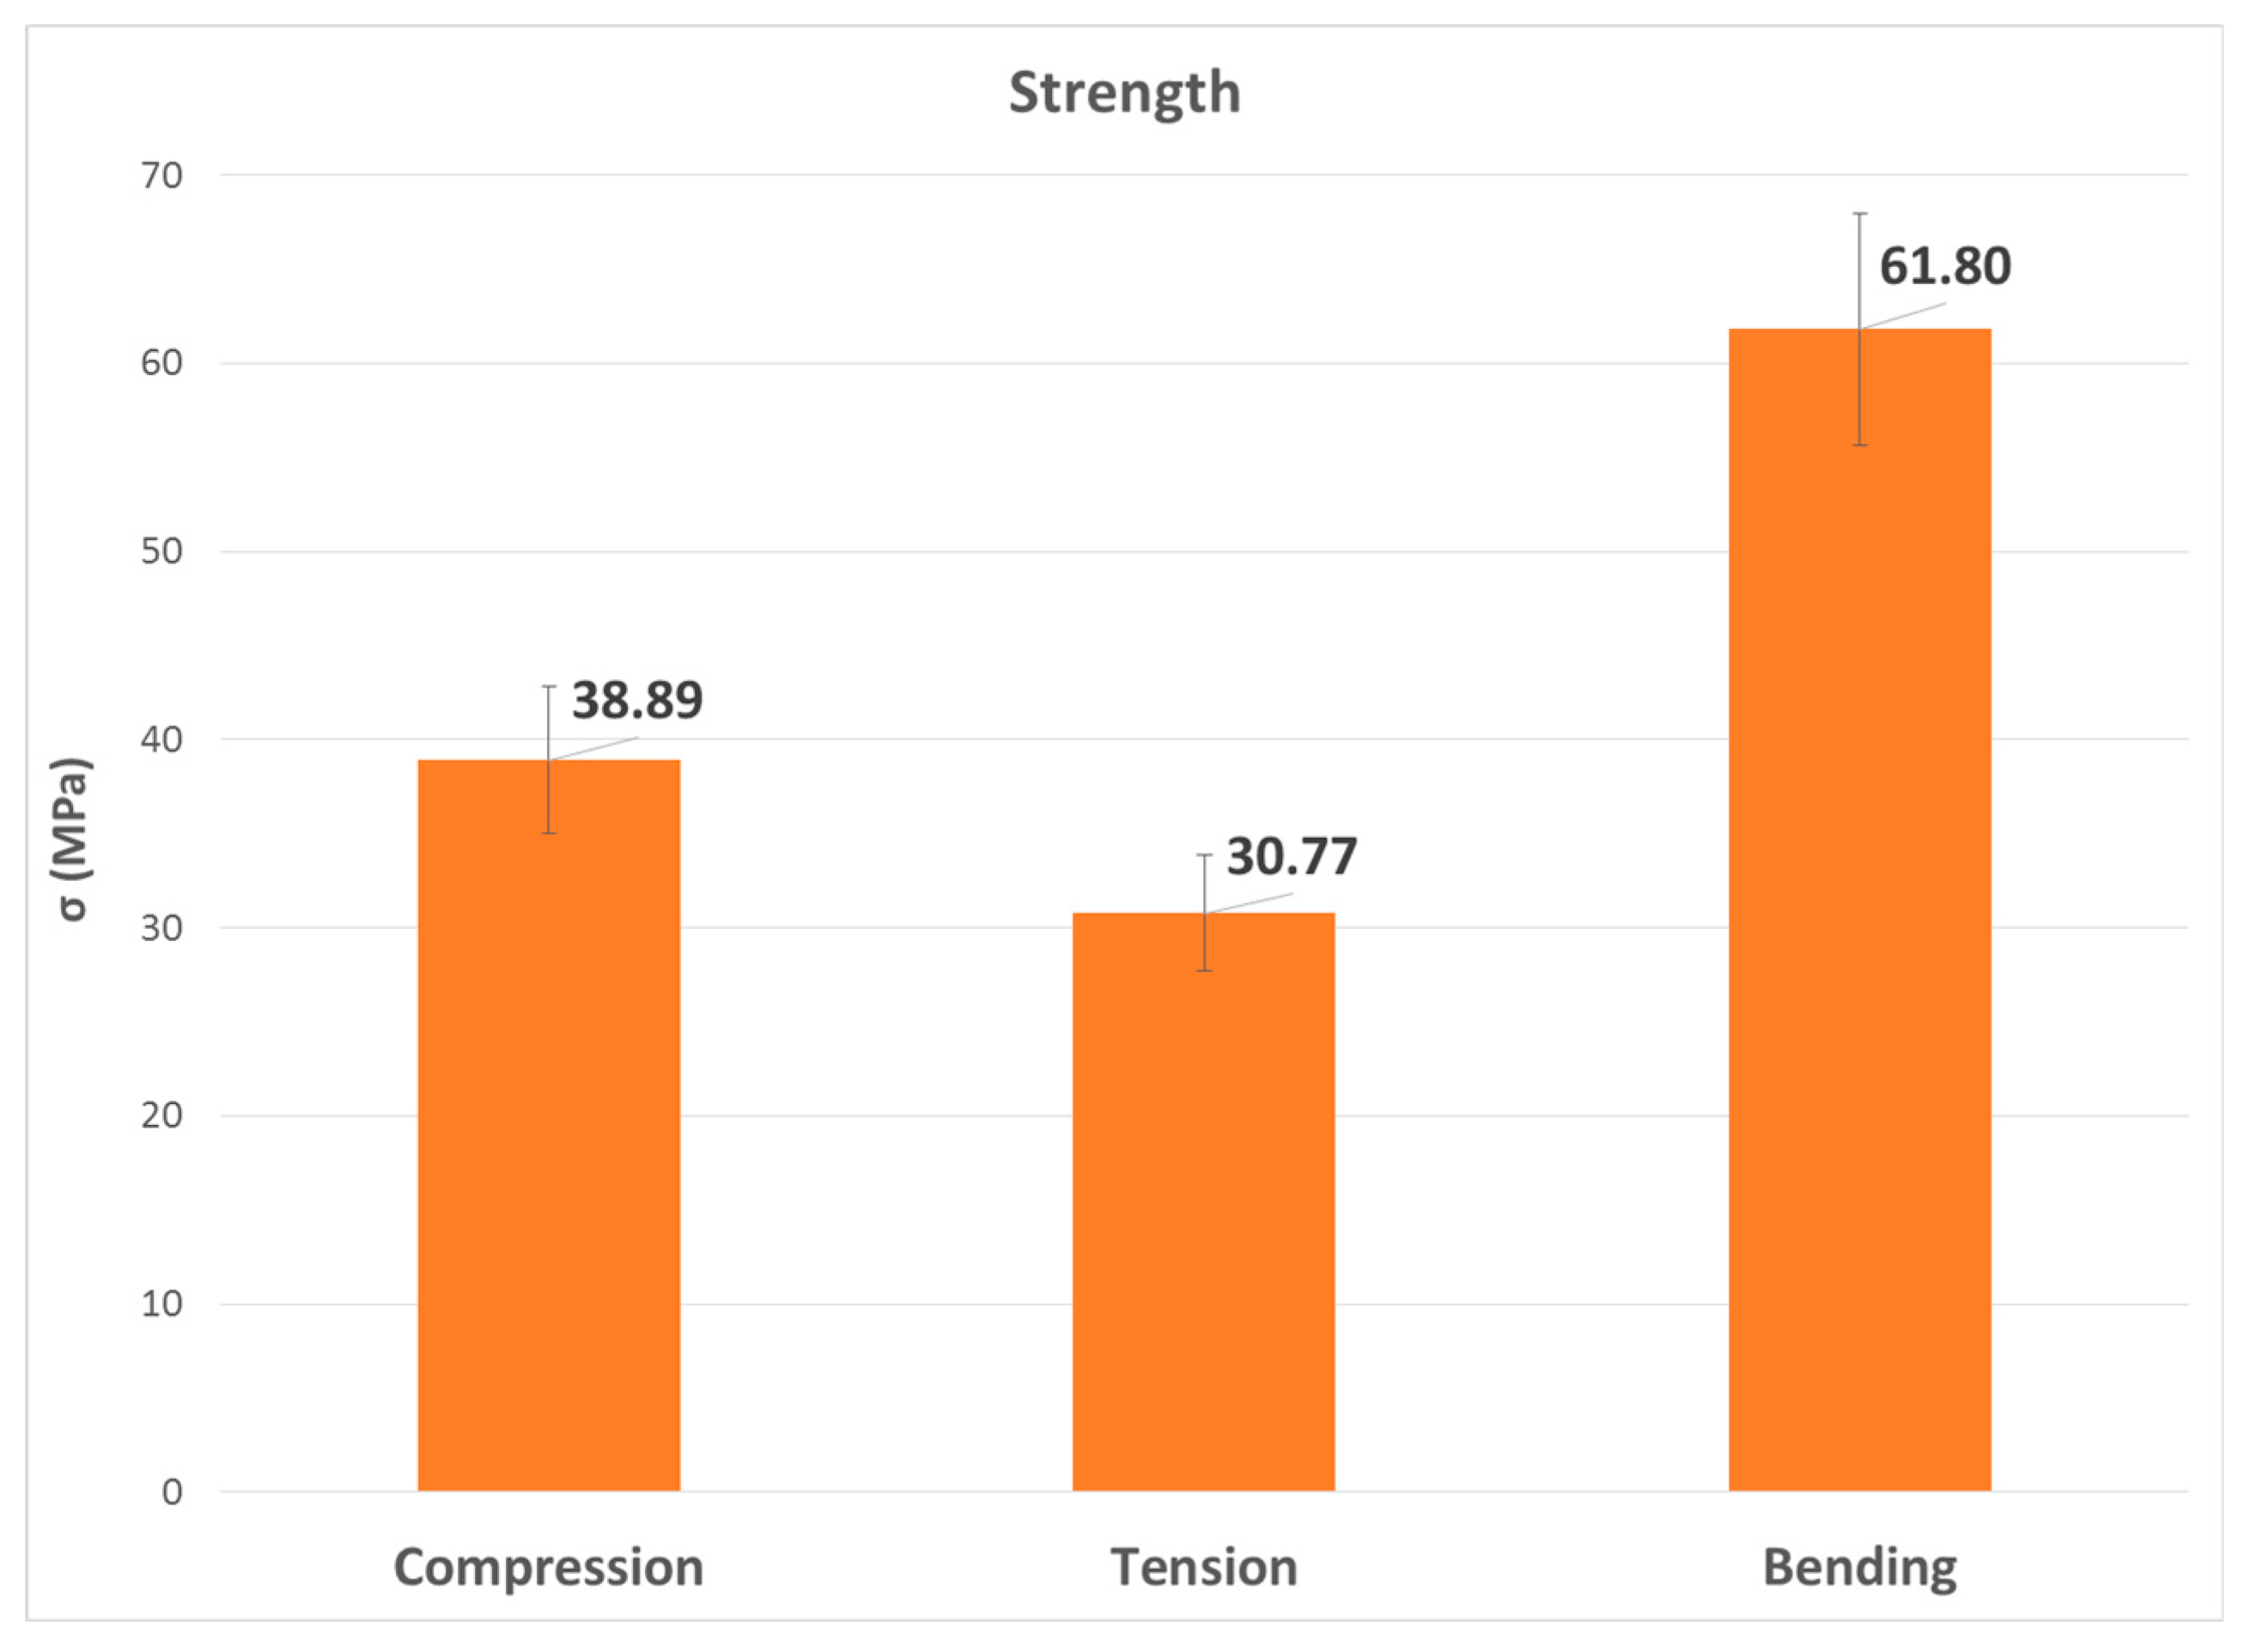
4.1. Experimental Tensile, Compression and Bending Tests
- The nominal definitions of stress (force per unit of initial area) and strain (increase in length per unit of the initial length of the extensometer) were changed to their true values (true stress—force per unit of area of the deformed section; true strain—logarithmic strain), assuming the constant volume hypothesis (the volume of the material remains constant during deformation), in order to consider the effect of the variation of the cross section during the tensile and compression tests.
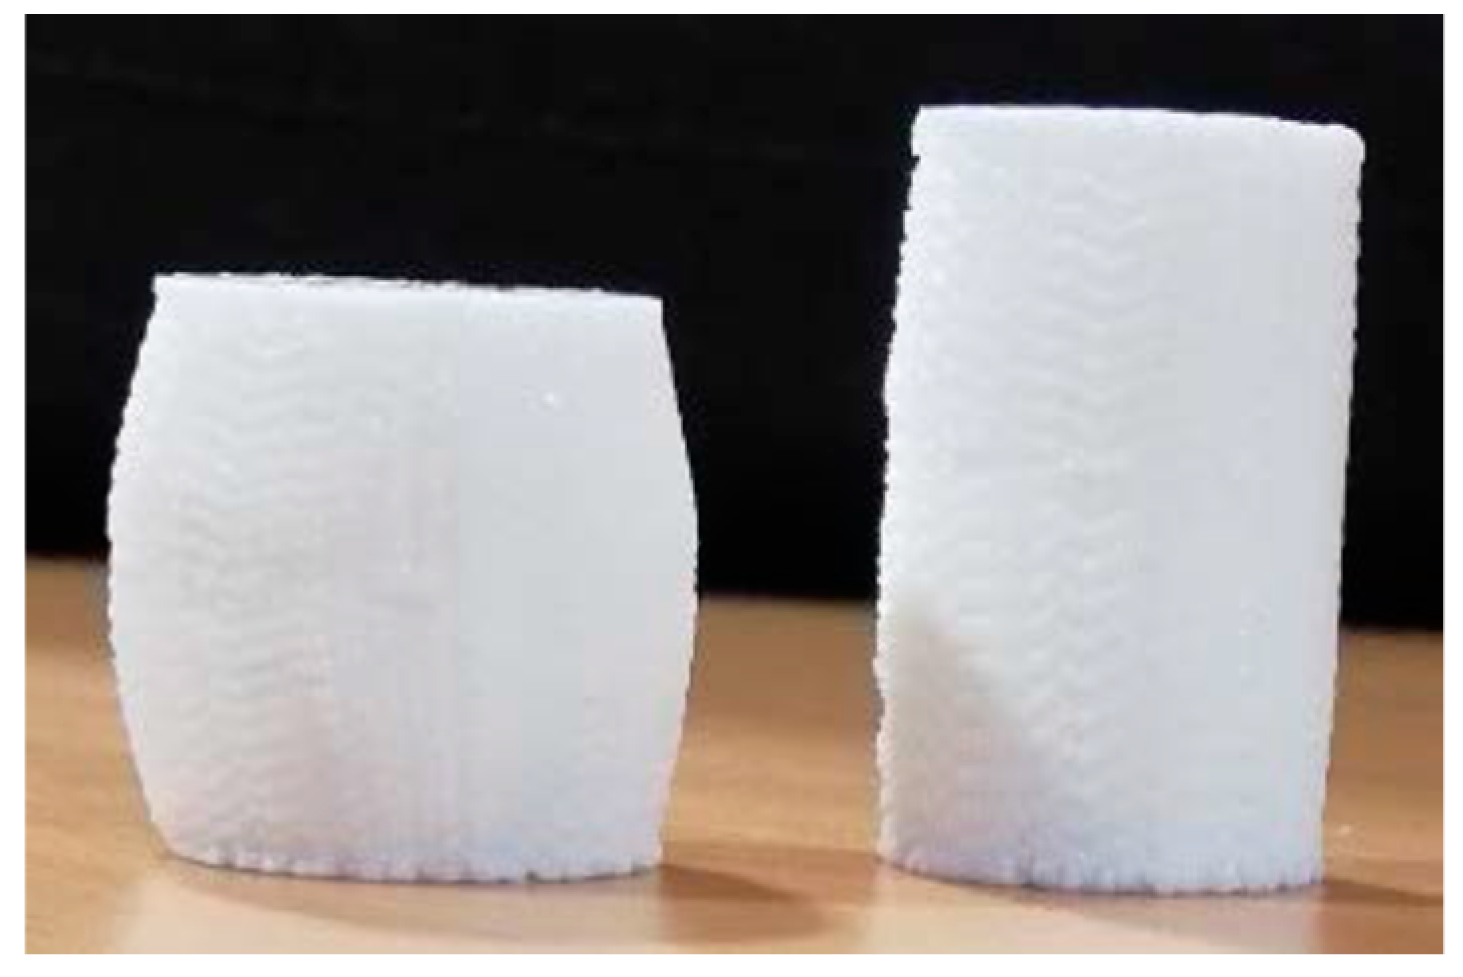
- The non-linearity in the initial phase of the stress–strain curve in the compression test was corrected for the long samples (L = 4D and L = 4a) by performing the toe compensation indicated in annex A1 of standard D695-02a. The parallelism between the faces of the samples was critical. This effect was more pronounced in short samples than in long samples.
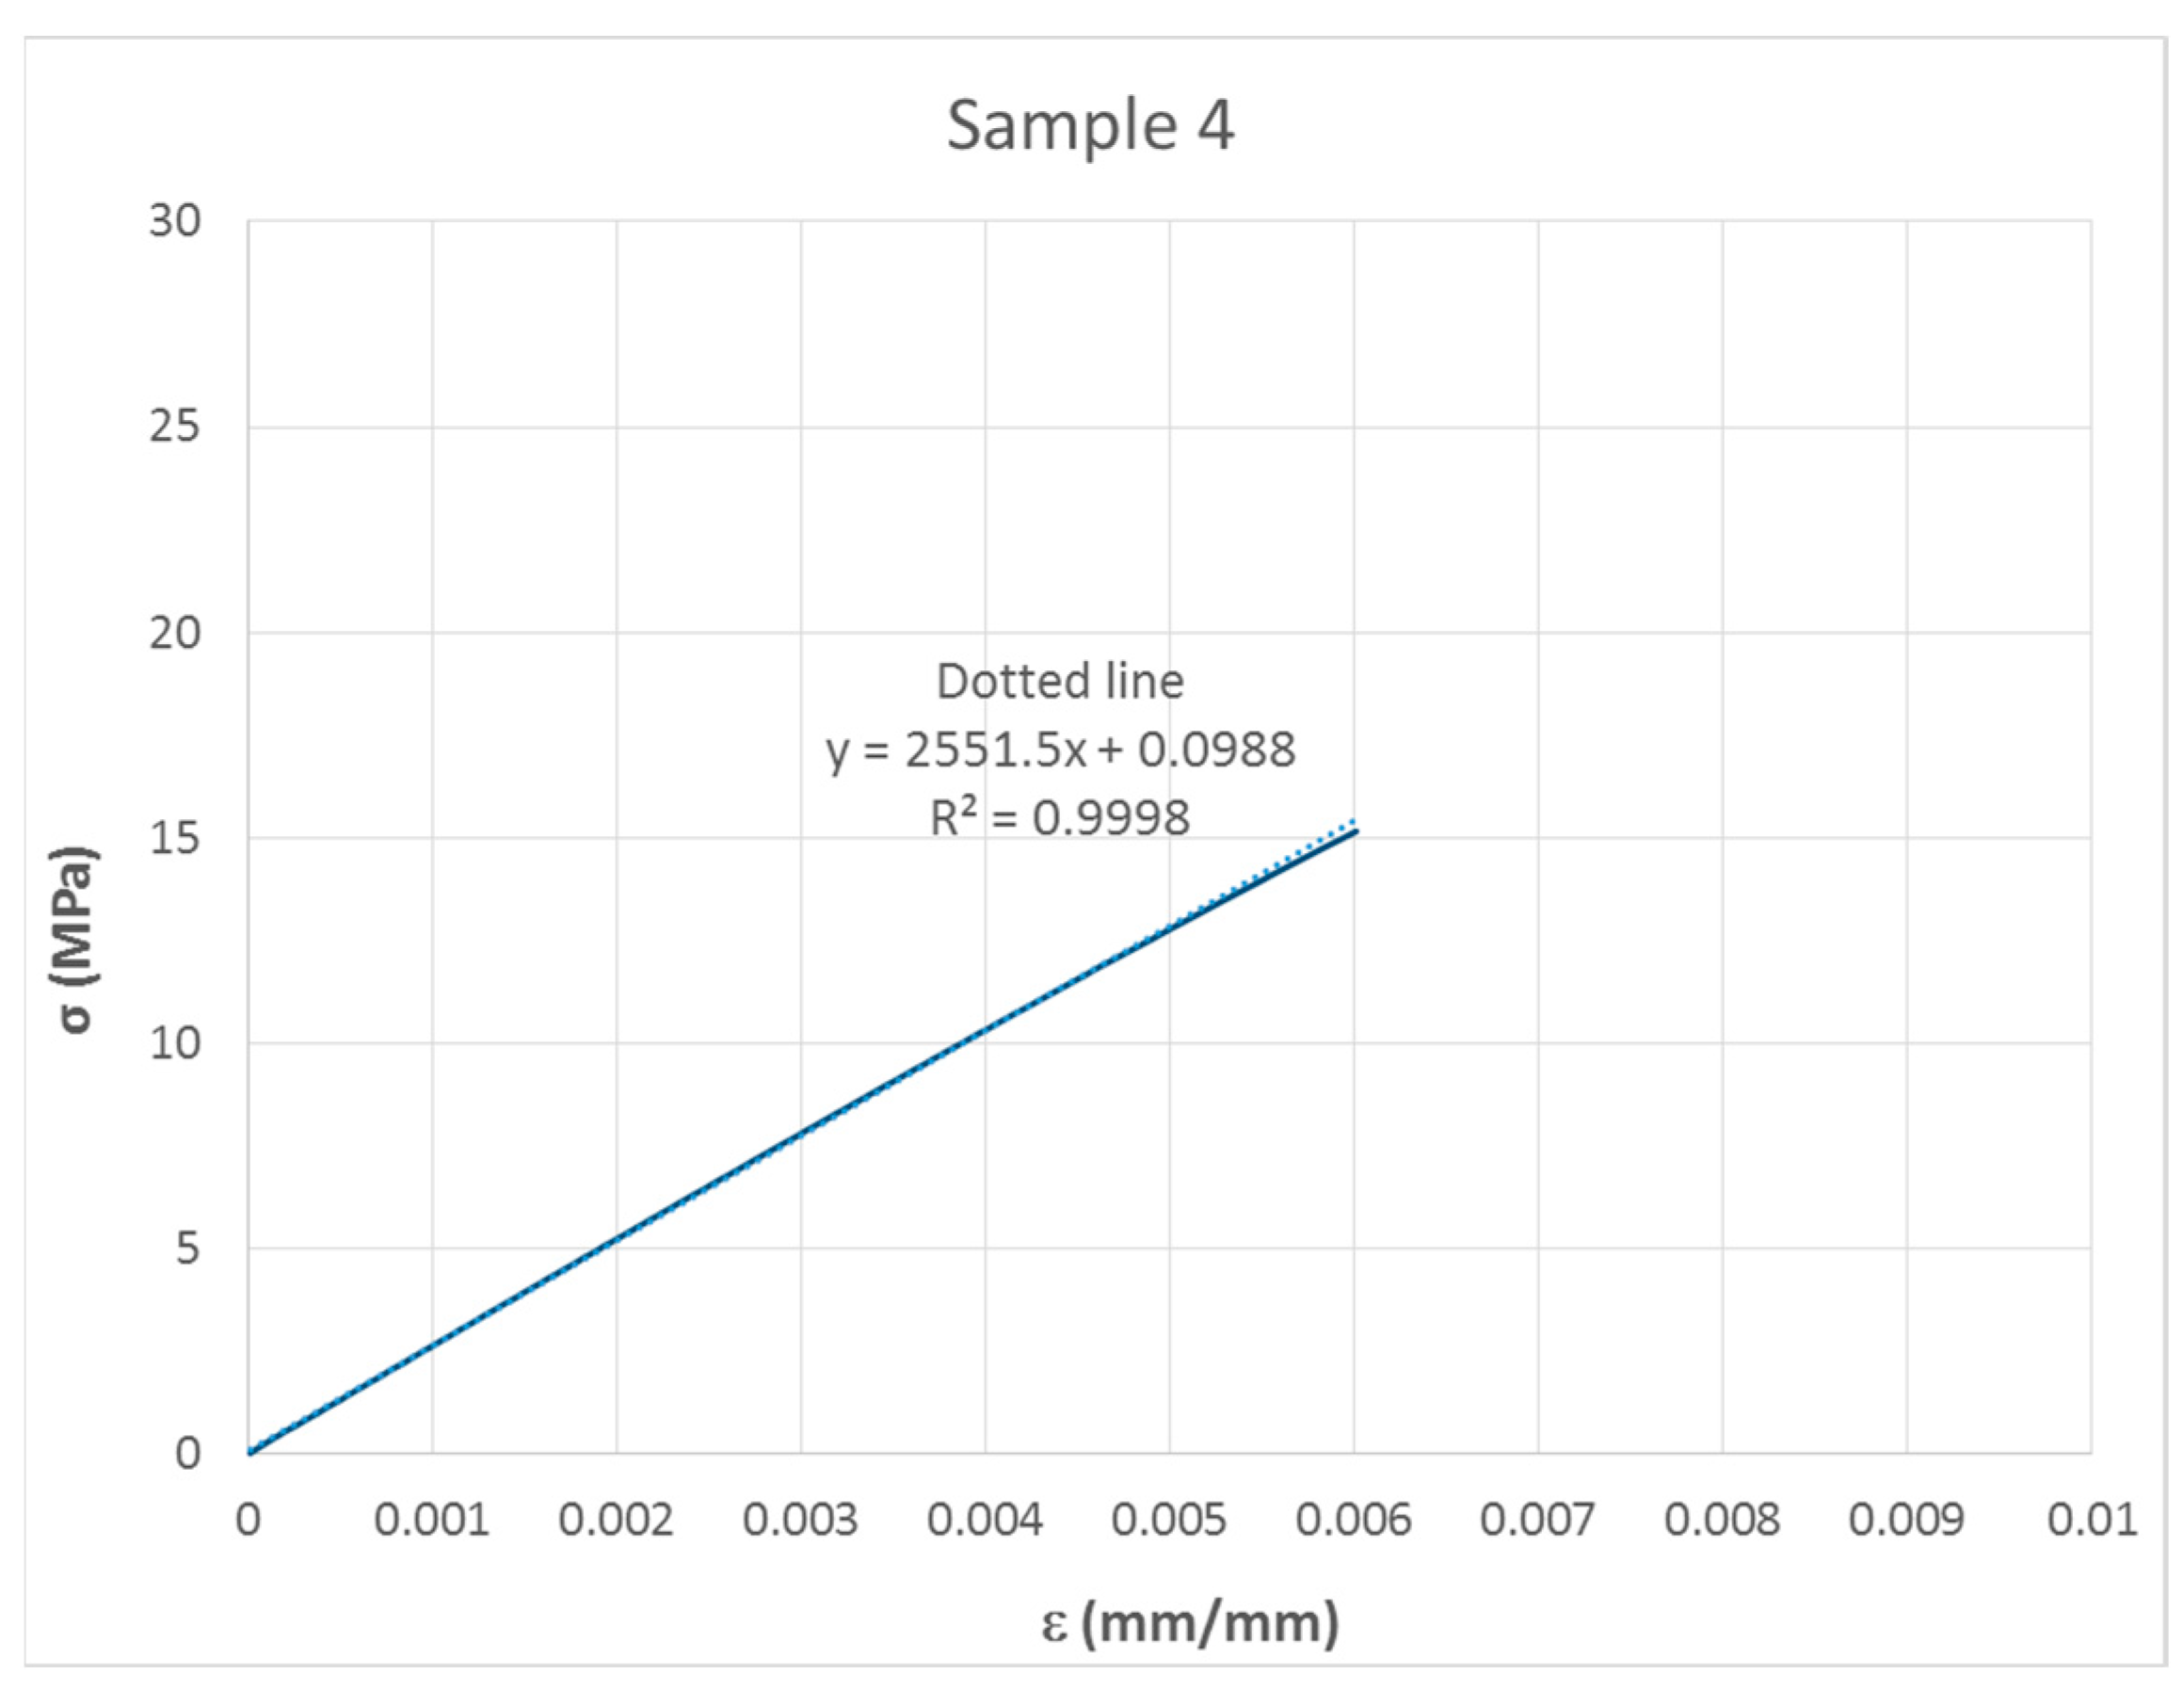
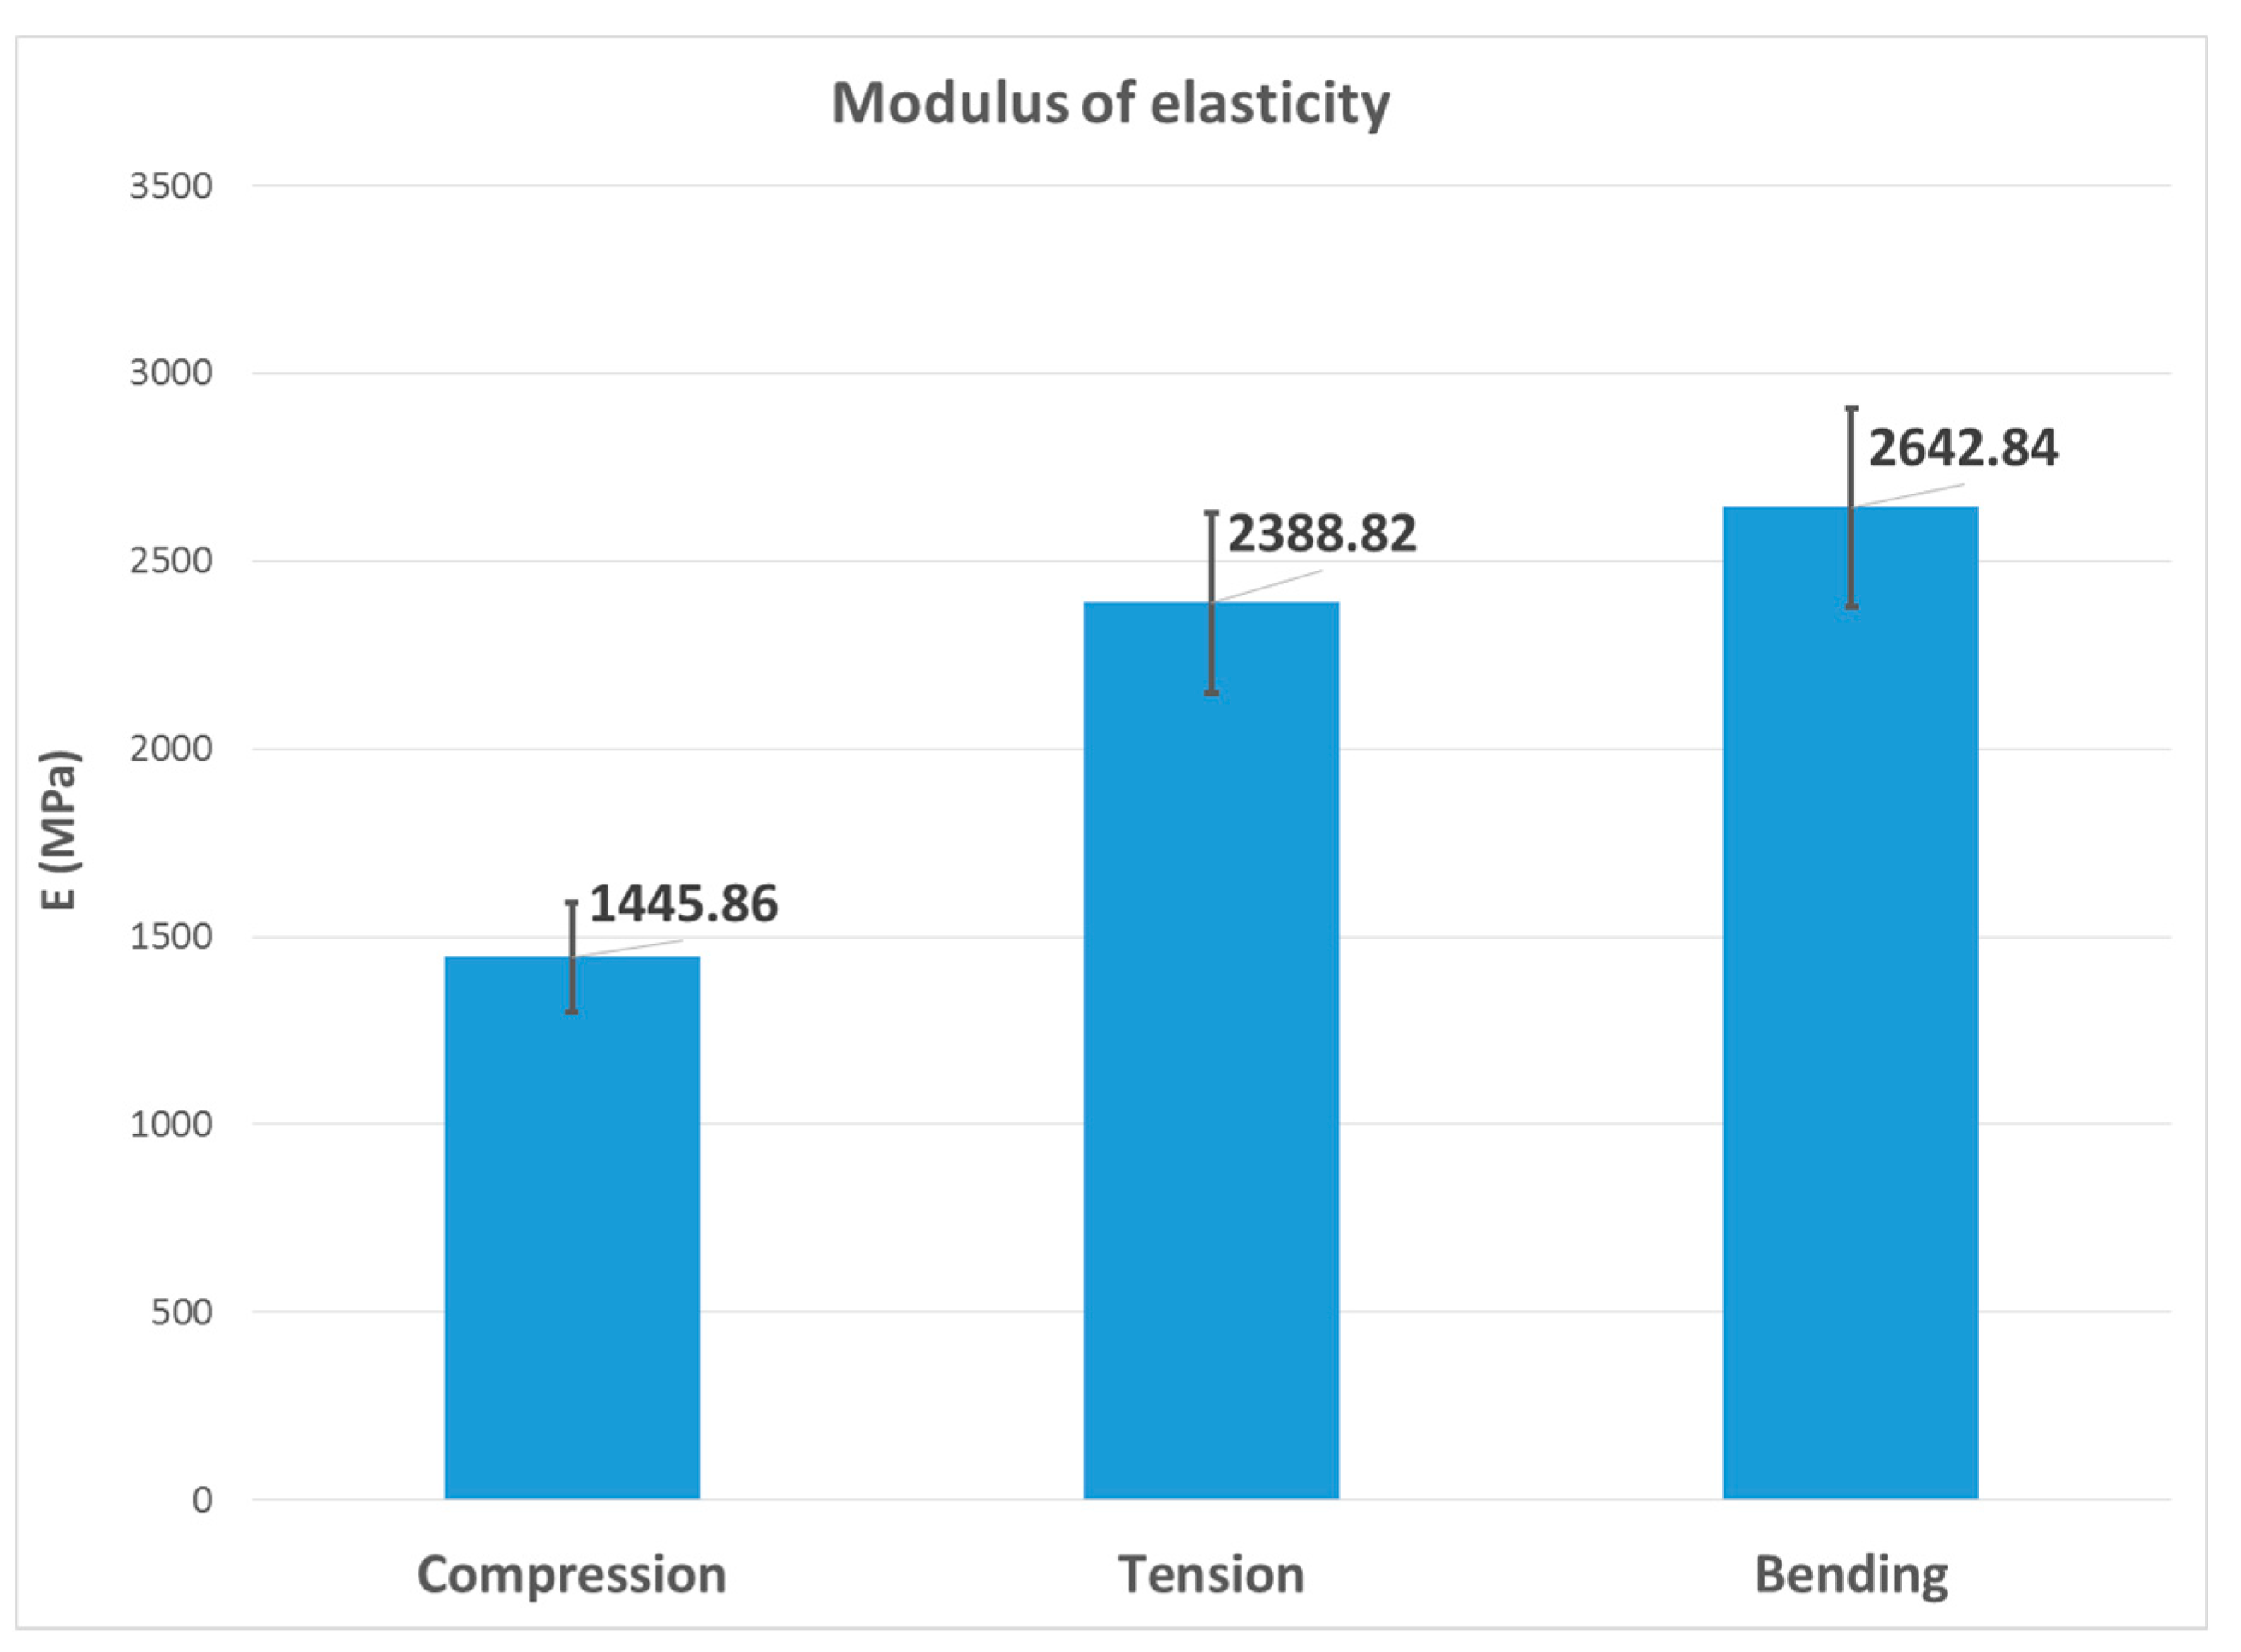
- Calculations of the initial elastic modulus were carried out for the three types of tests (tension, compression and bending) considering the linear part of the stress–strain curves (strain from 0 to 0.004 mm/mm).
4.2. Specific Analysis of the Compression Test
- (a)
- It was observed that the rectangular samples (2a and 4a) showed higher dispersion (in %) than the cylindrical ones (2D and 4D). Therefore, it is recommended the use of cylindrical specimens to determine the modulus E.
- (b)
- The difference between the mean value of the modulus of elasticity obtained from samples 4D and 4a was 11.0 %, whereas the difference between the mean value obtained from the 2D and 2a samples was 35.3%.
- (c)
- The flexibility of the testing machine caused an increase in the displacement between the compression plates, which implied obtaining an elastic modulus lower than the real modulus of the material. Although the compression test standard ASTM D695-02a did not provide for correction for this effect, the actual modulus E can be calculated from the measured modulus E’ by using the following Equation:
- (d)
- Friction between the sample and the load plates of the machine limited the effect of Poisson at the ends of the sample, and caused a barrel shape, which altered the assumed uniform distribution of stresses and deformations, thus increasing the apparent elastic modulus. The barrel shape was observed in some of the specimens (see Figure 17). To verify the influence of this effect on the Young’s modulus, two finite element simulations of the compression tests were performed. In the first one, it was assumed that there was no friction, and in the second one, the friction completely blocked the sliding between both surfaces in contact. The sample stiffness variation (which is proportional to the Young’s modulus) is shown in Table 11, where the percentage compression stiffness variation is expressed with regard to the frictionless model.
5. Conclusions
Author Contributions
Funding
Acknowledgments
Conflicts of Interest
References
- Wohlers. Wohlers Report 2014: Additive Manufacturing and 3D Printing State of the Industry, Annual Worldwide Progress Report; Wohlers Associates Inc.: Fort Collins, CO, USA, 2014. [Google Scholar]
- Farah, S.; Anderson, D.G.; Langer, R. Physical and mechanical properties of PLA, and their functions in widespread applications-A comprehensive review. Adv. Drug Deliv. Rev. 2016, 107, 367–392. [Google Scholar] [CrossRef] [PubMed] [Green Version]
- Chen, L.; He, Y.; Yang, Y.; Niu, S.; Ren, H. The research status and development of additive manufacturing technology. Int. J. Adv. Manuf. Technol. 2017, 89, 3651–3660. [Google Scholar] [CrossRef]
- Srivastava, V.K. A Review on Advances in Rapid Prototype 3D Printing of Multi-Functional Applications. Sci. Technol. 2017, 7, 4–24. [Google Scholar]
- Chiulan, I.; Frone, A.N.; Brandabur, C.; Panaitescu, D.M. Recent Advances in 3D Printing of Aliphatic Polyesters. Bioengineering 2018, 5, 2. [Google Scholar] [CrossRef] [PubMed] [Green Version]
- Dizon, J.R.C.; Espera, A.H., Jr.; Chen, Q.; Advincula, R.C. Mechanical characterization of 3d-printed polymers (Review). Addit. Manuf. 2018, 20, 44–67. [Google Scholar] [CrossRef]
- Popescu, D.; Zapciu, A.; Amza, C.; Baciu, F.; Marinescu, R. FDM process parameters influence over the mechanical properties of polymer specimens: A review. Polym. Test 2018, 69, 157–166. [Google Scholar] [CrossRef]
- Tymrak, B.M.; Kreiger, M.; Pearce, J.M. Mechanical properties of components fabricated with open-source 3-D printers under realistic environmental conditions. Mater. Des. 2014, 58, 242–246. [Google Scholar] [CrossRef]
- Chacón, J.M.; Caminero, M.A.; García-Plaza, E.; Núñez, P.J. Additive manufacturing of PLA structures using fused deposition modelling: Effect of process parameters on mechanical properties and their optimal selection. Mater. Des. 2017, 124, 143–157. [Google Scholar] [CrossRef]
- Innofil. Comparable data sheet Innofil3D filaments. In Overview Mechanical Properties of Printed Test Specimens; Basf: Emmen, the Netherlands; Available online: https://www.innofil3d.com/wp-content/uploads/2016/06/Pro1_Comparison_Sheet_small.pdf (accessed on 6 May 2019).
- 3Faktur. FDM/FFF Materials: ABS and PLA; 3Faktur GmbH: Jena, Germany; Available online: https://3faktur.com/en/3d-printing-materials-technologies/fdm-materials-pla-and-abs/ (accessed on 6 May 2019).
- MakerBot. PLA and ABS Strength Data; MakerBot Industries LLC: New York, NY, USA; Available online: http://download.makerbot.com/legal/MakerBot_R__PLA_and_ABS_Strength_Data.pdf (accessed on 6 May 2019).
- SD3D. PLA Technical Data Sheet; SD3D Printing, Inc.: San Diego, CA, USA; Available online: https://www.sd3d.com/wp-content/uploads/2017/06/MaterialTDS-PLA_01.pdf (accessed on 22 July 2017).
- Ultimaker. PLA Technical Data Sheet; Ultimaker BV: Utrecht, the Netherlands; Available online: https://ultimaker.com/download/74599/UM180821%20TDS%20PLA%20RB%20V10.pdf (accessed on 6 May 2019).
- Lanzotti, A.; Grasso, M.; Staiano, G.; Martorelli, M. The impact of process parameters on mechanical properties of parts fabricated in PLA with an open-source 3-D printer. Rapid Prototyp. J. 2015, 21, 5. [Google Scholar] [CrossRef] [Green Version]
- Ahmed, M.; Islam, M.; Vanhoose, J.; Rahman, M. Comparisons of Elasticity Moduli of Different Specimens Made Through Three Dimensional Printing. 3D Print Addit. Manuf. 2017, 4, 105–109. [Google Scholar] [CrossRef]
- Cantrell, J.T.; Rohde, S.; Damiani, D.; Guranani, R.; DiSandro, L.; Anton, J.; Young, A.; Jerez, A.; Steinbach, D.; Kroese, C.; et al. Experimental characterization of the mechanical properties of 3D-printed ABS and polycarbonate parts. Rapid Prototyp. J. 2017, 23, 811–824. [Google Scholar] [CrossRef]
- Ferreira, R.T.L.; Amatte, I.C.; Dutra, T.A.; Bürger, D. Experimental characterization and micrography of 3D printed PLA and PLA reinforced with short carbon fibers. Compos. Part B Eng. 2017, 124, 88–100. [Google Scholar] [CrossRef]
- Johnson, G.A.; French, J.J. Evaluation of Infill Effect on Mechanical Properties of Consumer 3D Printing Materials. Int. J. Eng. Technol. Innov. 2018, 3, 179–184. [Google Scholar]
- Seol, K.S.U.; Zhao, P.; Shin, B.C.; Zhang, S.U. Infill Print Parameters for Mechanical Properties of 3D Printed PLA Parts. J. Korean Soc. Manuf. Process Eng. 2018, 17, 9–16. [Google Scholar] [CrossRef]
- Subramaniam, S.R.; Samykano, M.; Selvamani, S.K.; Ngui, W.K.; Kadirgama, K.; Sudhakar, K.; Idris, M.S. Preliminary investigations of polylactic acid (PLA) properties. In AIP Conference Proceedings; API: College Park, MD, USA, 2019. [Google Scholar]
- Song, Y.; Li, Y.; Song, W.; Lee, K.; Lee, K.Y.; Tagarielli, V.L. Measurements of the mechanical response of unidirectional 3D-printed PLA. Mater. Des. 2017, 123, 154–164. [Google Scholar] [CrossRef]
- Chamis, C.C. Analysis of the three-point-bend test for materials with unequal tension and compression properties. In NASA Technical Note TN D-7572; National Aeronautics and Space Administration: Washington, DC, USA, 1974. [Google Scholar]
- Vgenopoulos, D.; Sweeney, J.; Grant, C.A.; Thompson, G.P.; Spencer, P.E.; Caton-Rose, P.; Coates, P.D. Nanoindentation analysis of oriented polypropylene: Influence of elastic properties in tension and compression. Polymer 2018, 151, 197–207. [Google Scholar]
- Huang, T.; Pan, Q.X.; Jin, J.; Zheng, J.L.; Wen, P.H. Continuous constitutive model for bimodulus materials with meshless approach. Appl. Math. Model. 2019, 66, 41–58. [Google Scholar] [CrossRef]
- Kuznetsov, V.; Solonin, A.N.; Urzhumtsev, O.D.; Schilling, R.; Tavitov, A.G. Strength of PLA Components Fabricated with Fused Deposition Technology Using a Desktop 3D Printer as a Function of Geometrical Parameters of the Process. Polymers 2018, 10, 313. [Google Scholar] [CrossRef] [Green Version]
- Zhang, Q.; Mochalin, V.N.; Neitzel, I.; Hazeli, K.; Niu, J.; Kontsos, A.; Zhou, J.G.; Lelkes, P.I.; Gogotsi, Y. Mechanical properties and biomineralization of multifunctional nanodiamond-PLLA composites for bone tissue engineering. Biomaterials 2012, 33, 5067–5075. [Google Scholar] [CrossRef]
- Forster, A.M. Materials Testing Standards for Additive manufacturing of Polymer Materials: State of the Art and Standards Applicability. In Additive Manufacturing Materials; White, L., Ed.; Nova Science Publishers: Hauppauge, NY, USA, 2015. [Google Scholar]
- ASTM D638-02a. Standard Test Method for Tensile Properties of Plastics; ASTM: West Conshohocken, PA, USA, 2003. [Google Scholar]
- ASTM D695-02a. Standard Test Method for Compressive Properties of Rigid Plastic; ASTM: West Conshohocken, PA, USA, 2002. [Google Scholar]
- ASTM D790-02. Flexural Properties of Unreinforced and Reinforced Plastics and Electrical Insulating Materials; ASTM: West Conshohocken, PA, USA, 2002. [Google Scholar]
- Bagheri, A.; Buj, I.; Ferrer, M.; Pastor, M.M.; Roure, F. Determination of the Elasticity Modulus of 3D-Printed Octet-Truss Structures for Use in Porous Prosthesis Implants. Materials 2018, 11, 2420. [Google Scholar] [CrossRef] [Green Version]
- Brischetto, S.; Ferro, C.G.; Maggiore, P.; Torre, R. Compression Tests of ABS Specimens for UAV Components Produced via the FDM Technique. Technologies 2017, 5, 20. [Google Scholar] [CrossRef] [Green Version]
- Dhôte, J.X.; Comer, A.J.; Stanley, W.F.; Young, T.M. Investigation into compressive properties of liquid shim of aerospace bolted joints. Compos. Struct. 2014, 109, 224–230. [Google Scholar] [CrossRef]
- Lammens, N.; Kersemans, M.; DeBaere, I.; VanPaepegem, W. On the visco-elasto-plastic response of additively manufactured polyamide-12 (PA-12) through selective laser sintering. Polym. Test 2017, 57, 149–155. [Google Scholar] [CrossRef]
- Baich, L.J. Impact of Infill Design on Mechanical Strength and Production Cost in Material Extrusion Based Additive Manufacturing. Ph.D. Thesis, Youngstown State University, Youngstown, OH, USA, 2016. [Google Scholar]
- Sayre III, R. A Comparative Finite Element Stress Analysis of Isotropic and Fusion Deposited 3D Printed Polymer. Ph.D. Thesis, Rensselaer Polytechnic Institute, New York, NY, USA, 2014. [Google Scholar]
- ANSYS. Academic Research Mechanical, Release 19.1; ANSYS Inc.: Canonsburg, PA, USA, 2019. [Google Scholar]
- Bainbridge, J. 3D Printing Filament Properties. Available online: https://github.com/superjamie/lazyweb/wiki/3D-Printing-Filament-Properties (accessed on 4 June 2019).
- Mazzanti, V.; Malagutti, L.; Mollica, F. FDM 3D Printing of Polymers Containing Natural Fillers: A Review of their Mechanical Properties. Polymers 2019, 11, 1094. [Google Scholar] [CrossRef] [Green Version]


| Specification/Parameter | Value |
|---|---|
| Diameter (mm) | 2.85 |
| Specific gravity (ISO 1183) (g/cm3) | 1.24 |
| Tensile strength at yield (ISO 527) (MPa) | 70 |
| Strain at yield (ISO 527) (%) | 5 |
| Strain at break (ISO 527) (%) | 20 |
| Tensile modulus (ISO 527) (MPa) | 3120 |
| Melting temperature (ISO 11357) (°C) | 115 ± 35 |
| Glass transition temperature (ISO 11357) (°C) | 57 |
| Molecular weight (g/mol) | 1.598 × 10⁵ |
| Parameter | Value |
|---|---|
| Infill ratio (%) | 90 |
| Nozzle diameter (mm) | 0.4 |
| Printing temperature (°C) | 205 |
| Printing speed (mm/s) | 50 |
| Printing pattern | Rectangular |
| Raster angle (°) | 45 |
| Layer height (mm) | 0.1 |
| Specimen | Modulus of Elasticity E (MPa) | Tensile Strength σ (MPa) | Elongation at σ ε (mm/mm) | Poisson’s Ratio ν |
|---|---|---|---|---|
| 1 | 2200.7 | 31.13 | 0.019 | - |
| 2 | 2063.6 | 30.52 | 0.022 | - |
| 3 | 2776.4 | 30.78 | 0.015 | - |
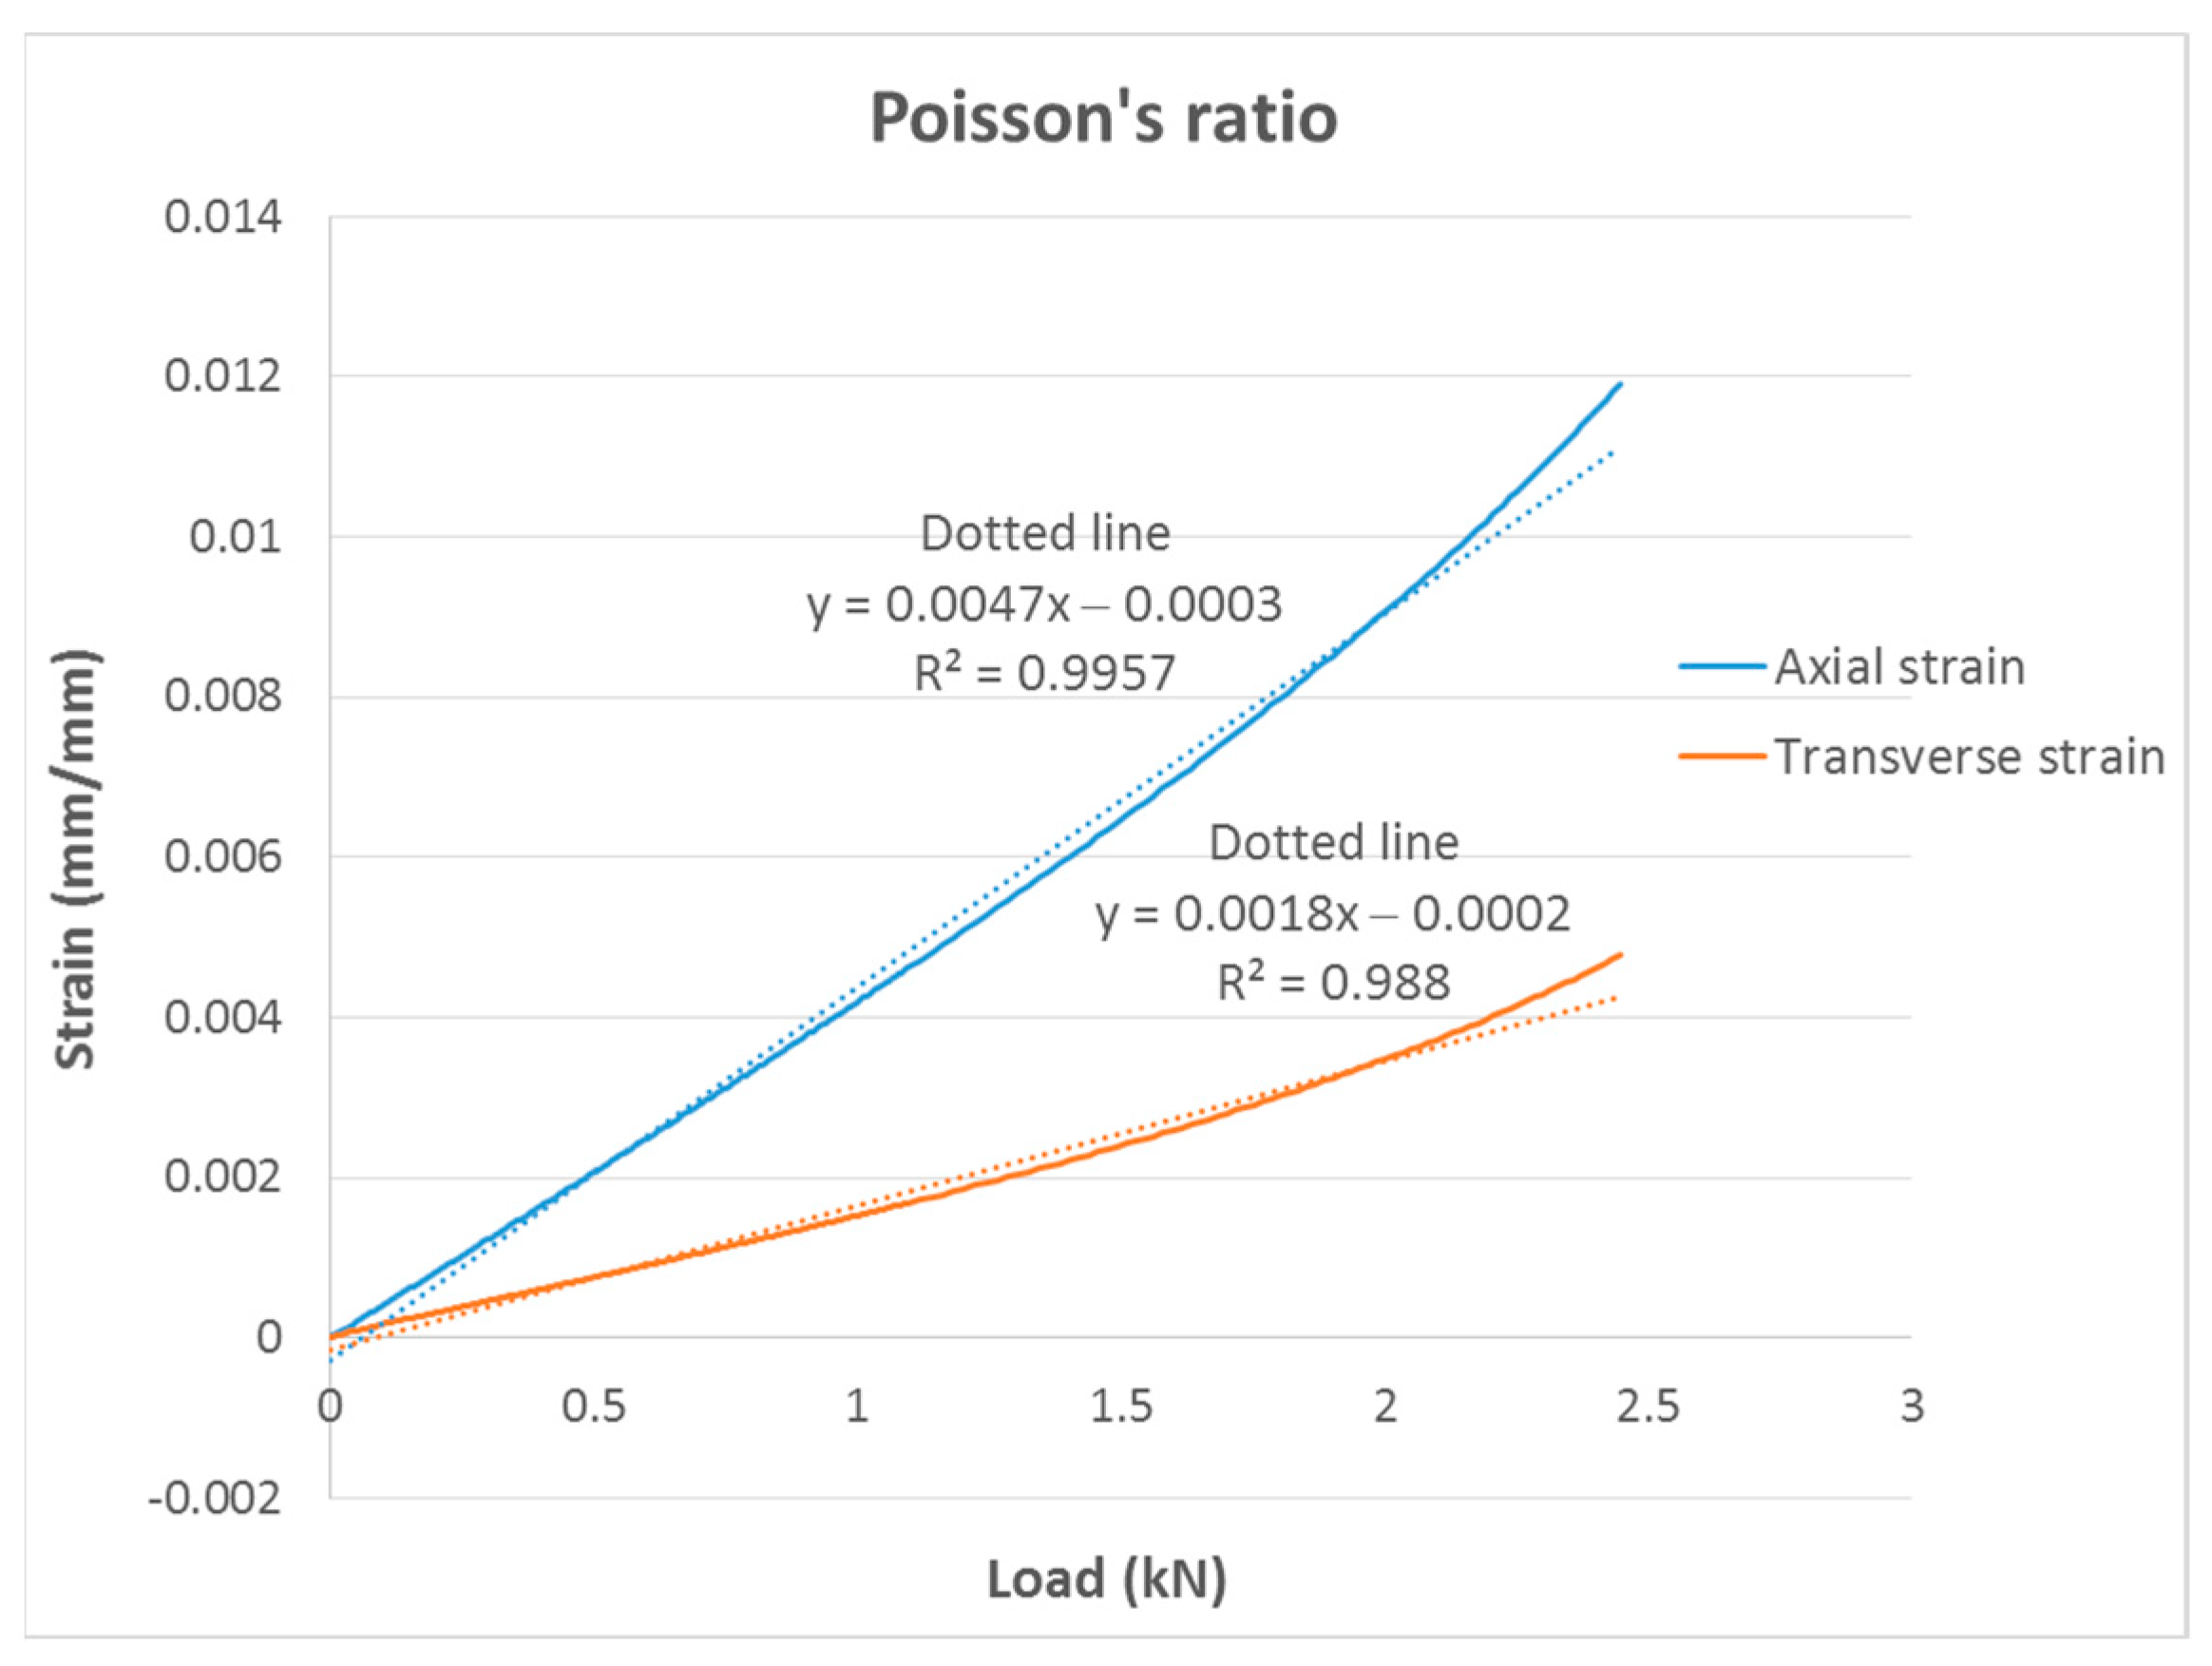
| 4 | 2551.5 | 30.84 | 0.018 | 0.38 |
| 5 | 2394.0 | 31.55 | 0.021 | 0.37 |
| 6 | 2346.7 | 29.82 | 0.021 | 0.36 |
| Mean | 2388.8 | 30.77 | 0.019 | - |
| SD | 252.8 | 0.59 | 0.002 | - |
| Specimen | E (MPa) | |||
|---|---|---|---|---|
| Prism (L = 2a) | Cylinder (L = 2D) | Prism (L = 4a) | Cylinder (L = 4D) | |
| 1 | 921.2 | 1076.1 | 1397.7 | 1472.4 |
| 2 | 799.6 | 1077.6 | 1458.4 | 1463.8 |
| 3 | 724.2 | 1099.2 | 1251.7 | 1516.2 |
| 4 | 816.4 | 1113.5 | 1453.0 | 1563.0 |
| 5 | 802.7 | 1097.6 | 1355.3 | 1564.5 |
| 6 | 802.4 | 1123.3 | 1304.9 | 1549.4 |
| Mean | 811.1 | 1097.9 | 1370.2 | 1521.5 |
| SD | 63.2 | 18.9 | 82.4 | 45.0 |
| Specimen | σ (MPa) | |||
|---|---|---|---|---|
| Prism (L = 2a) | Cylinder (L = 2D) | Prism (L = 4a) | Cylinder (L = 4D) | |
| 1 | 30.06 | 41.17 | 32.57 | 42.49 |
| 2 | 25.97 | 40.66 | 39.79 | 41.56 |
| 3 | 24.25 | 42.58 | 28.83 | 43.64 |
| 4 | 27.57 | 42.82 | 40.10 | 45.52 |
| 5 | 26.58 | 41.78 | 31.71 | 45.14 |
| 6 | 26.79 | 42.13 | 31.10 | 44.27 |
| Mean | 26.87 | 41.86 | 34.02 | 43.77 |
| SD | 1.92 | 0.83 | 4.76 | 1.53 |
| Specimen | ε (mm/mm) | |||
|---|---|---|---|---|
| Prism (L = 2a) | Cylinder (L = 2D) | Prism (L = 4a) | Cylinder (L = 4D) | |
| 1 | 0.041 | 0.043 | 0.026 | 0.042 |
| 2 | 0.039 | 0.043 | 0.035 | 0.038 |
| 3 | 0.039 | 0.044 | 0.029 | 0.041 |
| 4 | 0.038 | 0.043 | 0.036 | 0.042 |
| 5 | 0.038 | 0.043 | 0.031 | 0.043 |
| 6 | 0.039 | 0.042 | 0.032 | 0.033 |
| Mean | 0.039 | 0.043 | 0.031 | 0.040 |
| SD | 0.001 | 0.000 | 0.004 | 0.004 |
| Specimen | EB (MPa) | σf (MPa) | εf (mm/mm) |
|---|---|---|---|
| 1 | 2603.0 | 60.92 | 0.042 |
| 2 | 2657.4 | 63.19 | 0.043 |
| 3 | 2572.1 | 58.34 | 0.039 |
| 4 | 2900.2 | 67.26 | 0.036 |
| 5 | 2859.0 | 65.87 | 0.036 |
| 6 | 2265.4 | 55.22 | 0.043 |
| Mean | 2642.8 | 61.80 | 0.040 |
| SD | 229.0 | 4.57 | 0.003 |
| Test | E (MPa) | σ (MPa) | ε (mm/mm) | Farah et al. [2] | *Song et al. [22] |
|---|---|---|---|---|---|
| Compression | 1445.9 | 38.89 | 0.036 | - | 3200 ÷ 3880, 70.80 ÷ 71.94, − |
| Tensile | 2388.8 | 30.77 | 0.019 | 3700, 65.6, 0.04 | 3430 ÷ 3680, 29.79 ÷ 46.76, − |
| Flexural | 2642.8 | 61.80 | 0.040 | - | - |
| Specimen | E (MPa) | |||
|---|---|---|---|---|
| Tension | Compression L = 4D | Compression L = 4a | Bending | |
| 1 | 2497 | 1405 | 1405 | 2455 |
| 2 | 2282 | 1362 | 1375 | 2666 |
| 3 | 2845 | 1485 | 1225 | 2679 |
| 4 | 2599 | 1507 | 1441 | 2699 |
| 5 | 2478 | 1452 | 1353 | 2601 |
| 6 | 2388 | 1459 | 1276 | 2349 |
| Mean | 2515 | 1445 | 1346 | 2575 |
| SD | 194 | 53 | 81 | 142 |
| Specimen | E’ (Measured) (MPa) | E (Real) (MPa) | Variation (%) |
|---|---|---|---|
| L = 2a | 811.1 | 938 | 16 |
| L = 2D | 1097.9 | 1283 | 17 |
| L = 4a | 1370.2 | 1547 | 13 |
| L = 4D | 1521.5 | 1690 | 11 |
| Specimen | Variation in Stiffness (%) |
|---|---|
| L = 2a | 4.17 |
| L = 2D | 3.56 |
| L = 4a | 2.08 |
| L = 4D | 1.78 |
© 2019 by the authors. Licensee MDPI, Basel, Switzerland. This article is an open access article distributed under the terms and conditions of the Creative Commons Attribution (CC BY) license (http://creativecommons.org/licenses/by/4.0/).
Share and Cite
Pastor-Artigues, M.-M.; Roure-Fernández, F.; Ayneto-Gubert, X.; Bonada-Bo, J.; Pérez-Guindal, E.; Buj-Corral, I. Elastic Asymmetry of PLA Material in FDM-Printed Parts: Considerations Concerning Experimental Characterisation for Use in Numerical Simulations. Materials 2020, 13, 15. https://doi.org/10.3390/ma13010015
Pastor-Artigues M-M, Roure-Fernández F, Ayneto-Gubert X, Bonada-Bo J, Pérez-Guindal E, Buj-Corral I. Elastic Asymmetry of PLA Material in FDM-Printed Parts: Considerations Concerning Experimental Characterisation for Use in Numerical Simulations. Materials. 2020; 13(1):15. https://doi.org/10.3390/ma13010015
Chicago/Turabian StylePastor-Artigues, Ma-Magdalena, Francesc Roure-Fernández, Xavier Ayneto-Gubert, Jordi Bonada-Bo, Elsa Pérez-Guindal, and Irene Buj-Corral. 2020. "Elastic Asymmetry of PLA Material in FDM-Printed Parts: Considerations Concerning Experimental Characterisation for Use in Numerical Simulations" Materials 13, no. 1: 15. https://doi.org/10.3390/ma13010015