Considerations on the Applicability of Test Methods for Mechanical Characterization of Materials Manufactured by FDM


Abstract
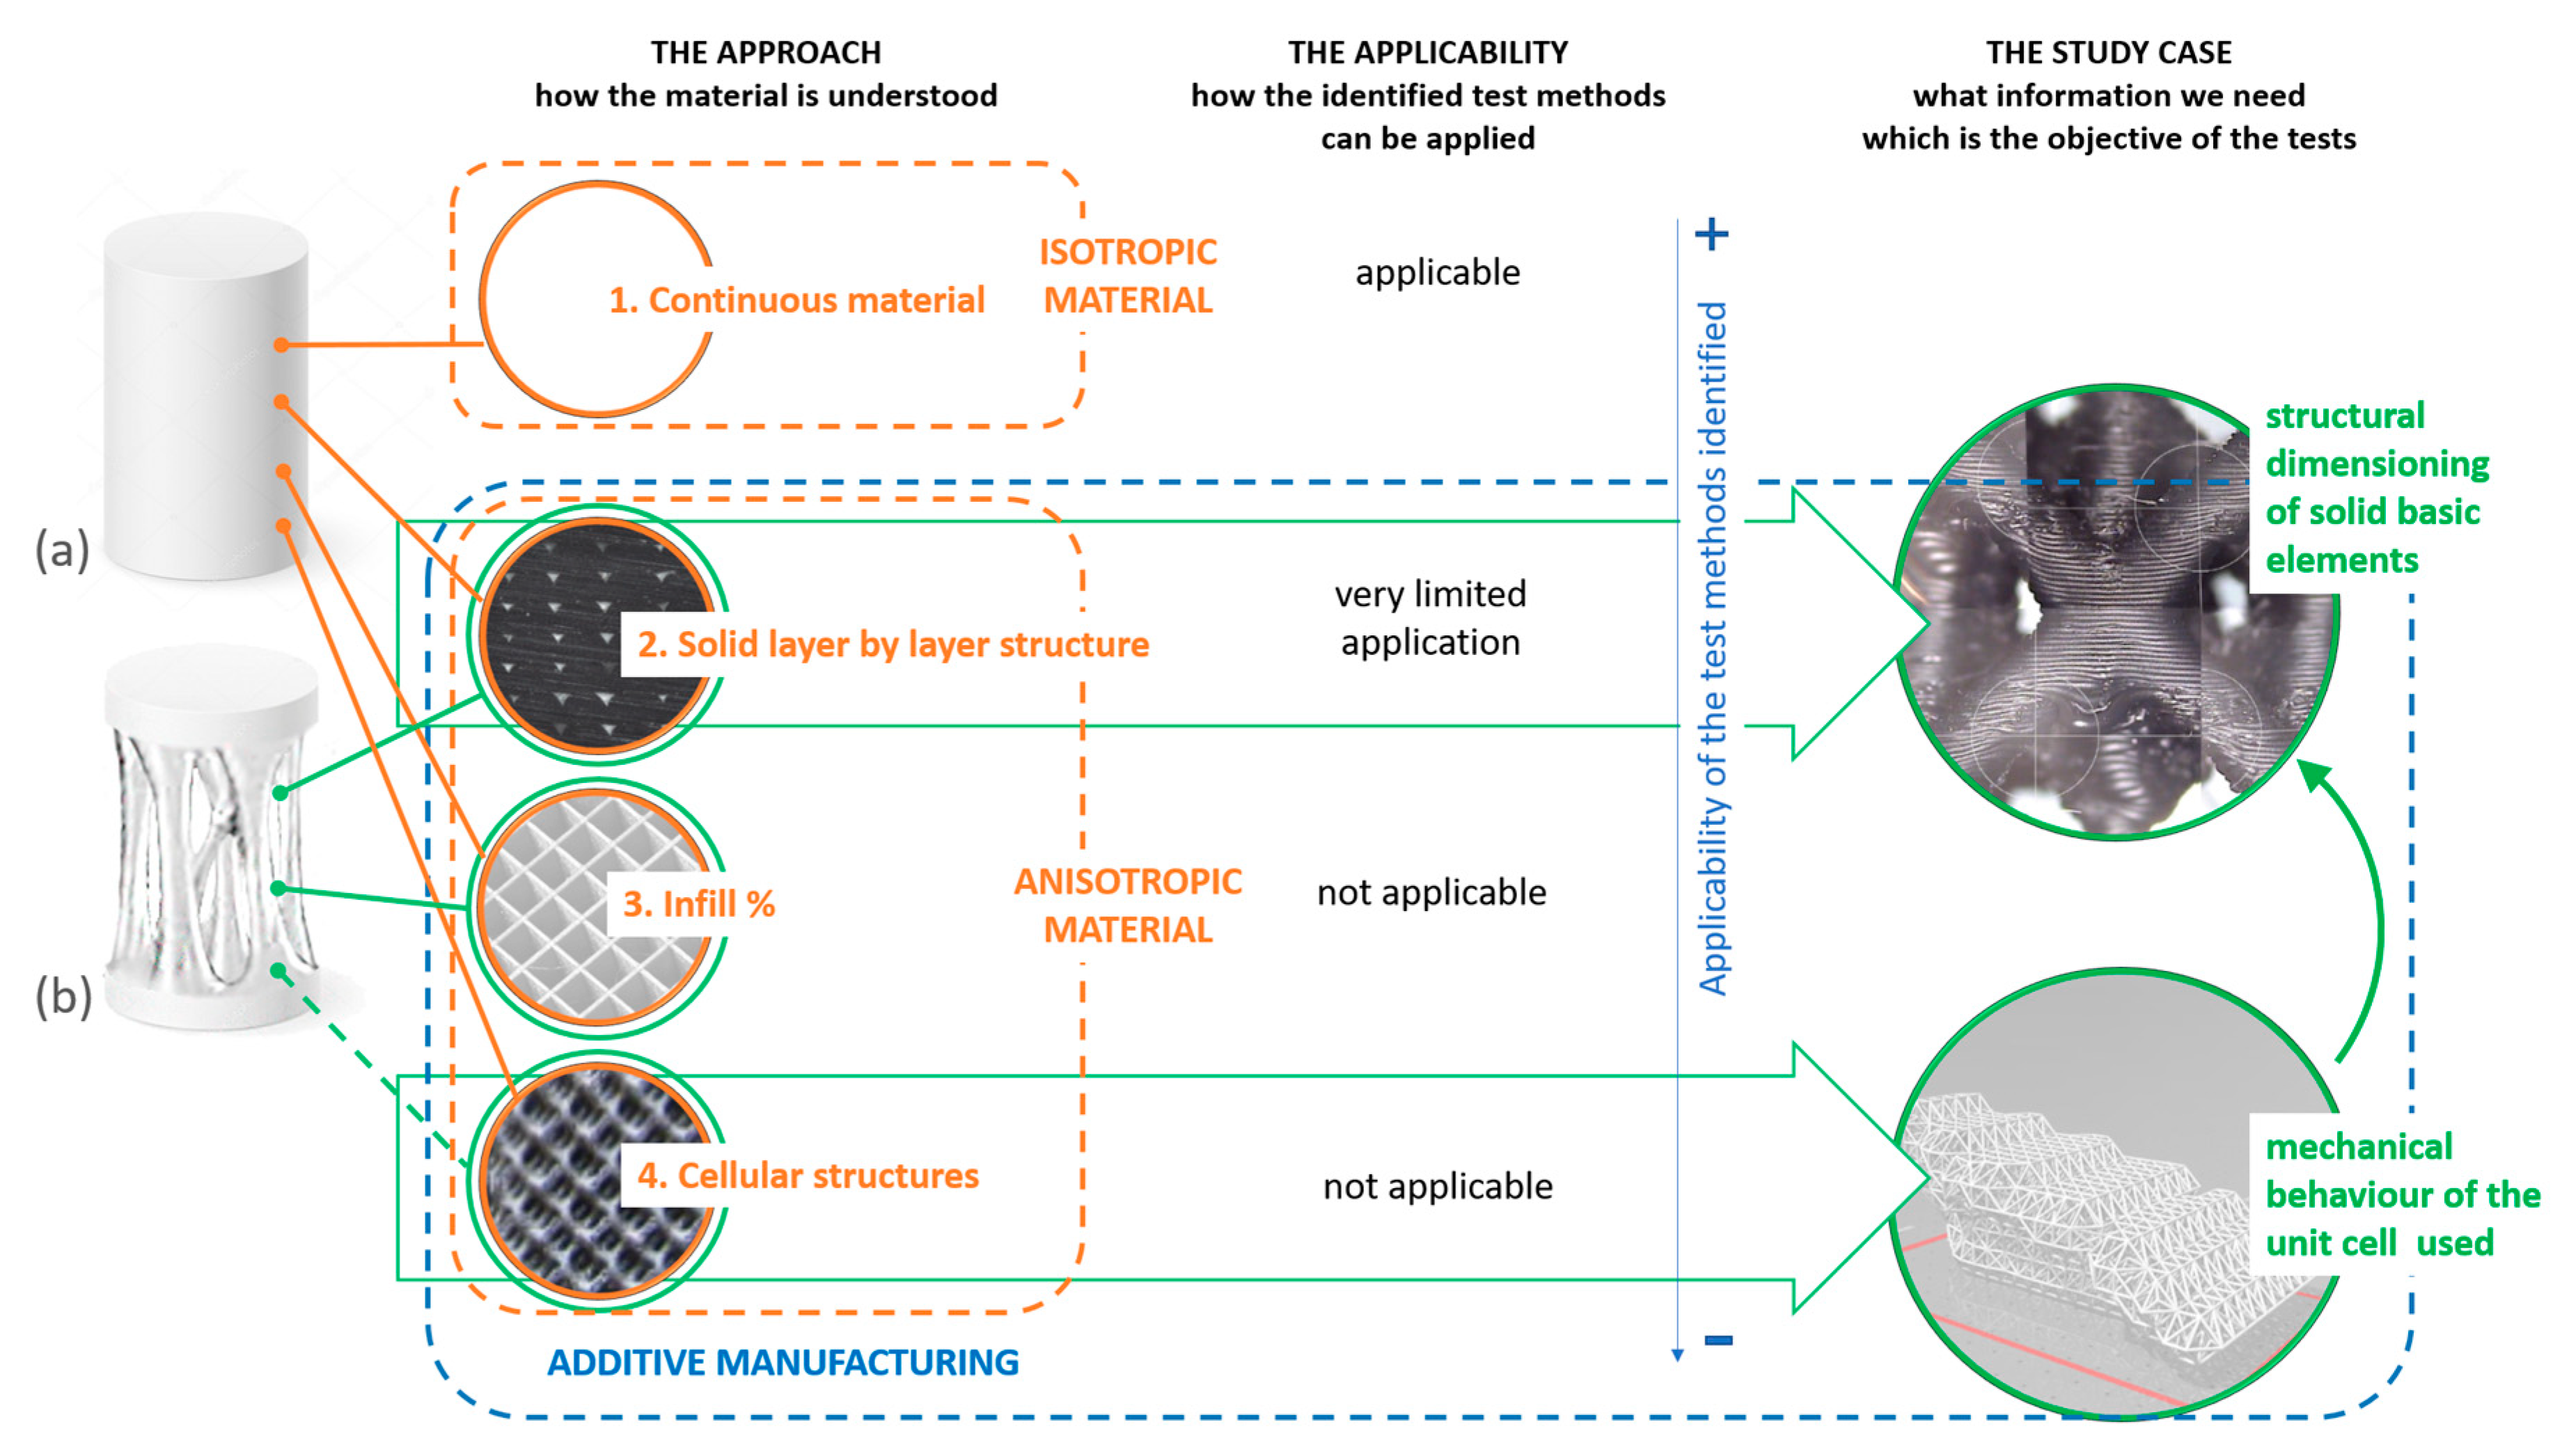
:1. Introduction
2. Materials and Methods
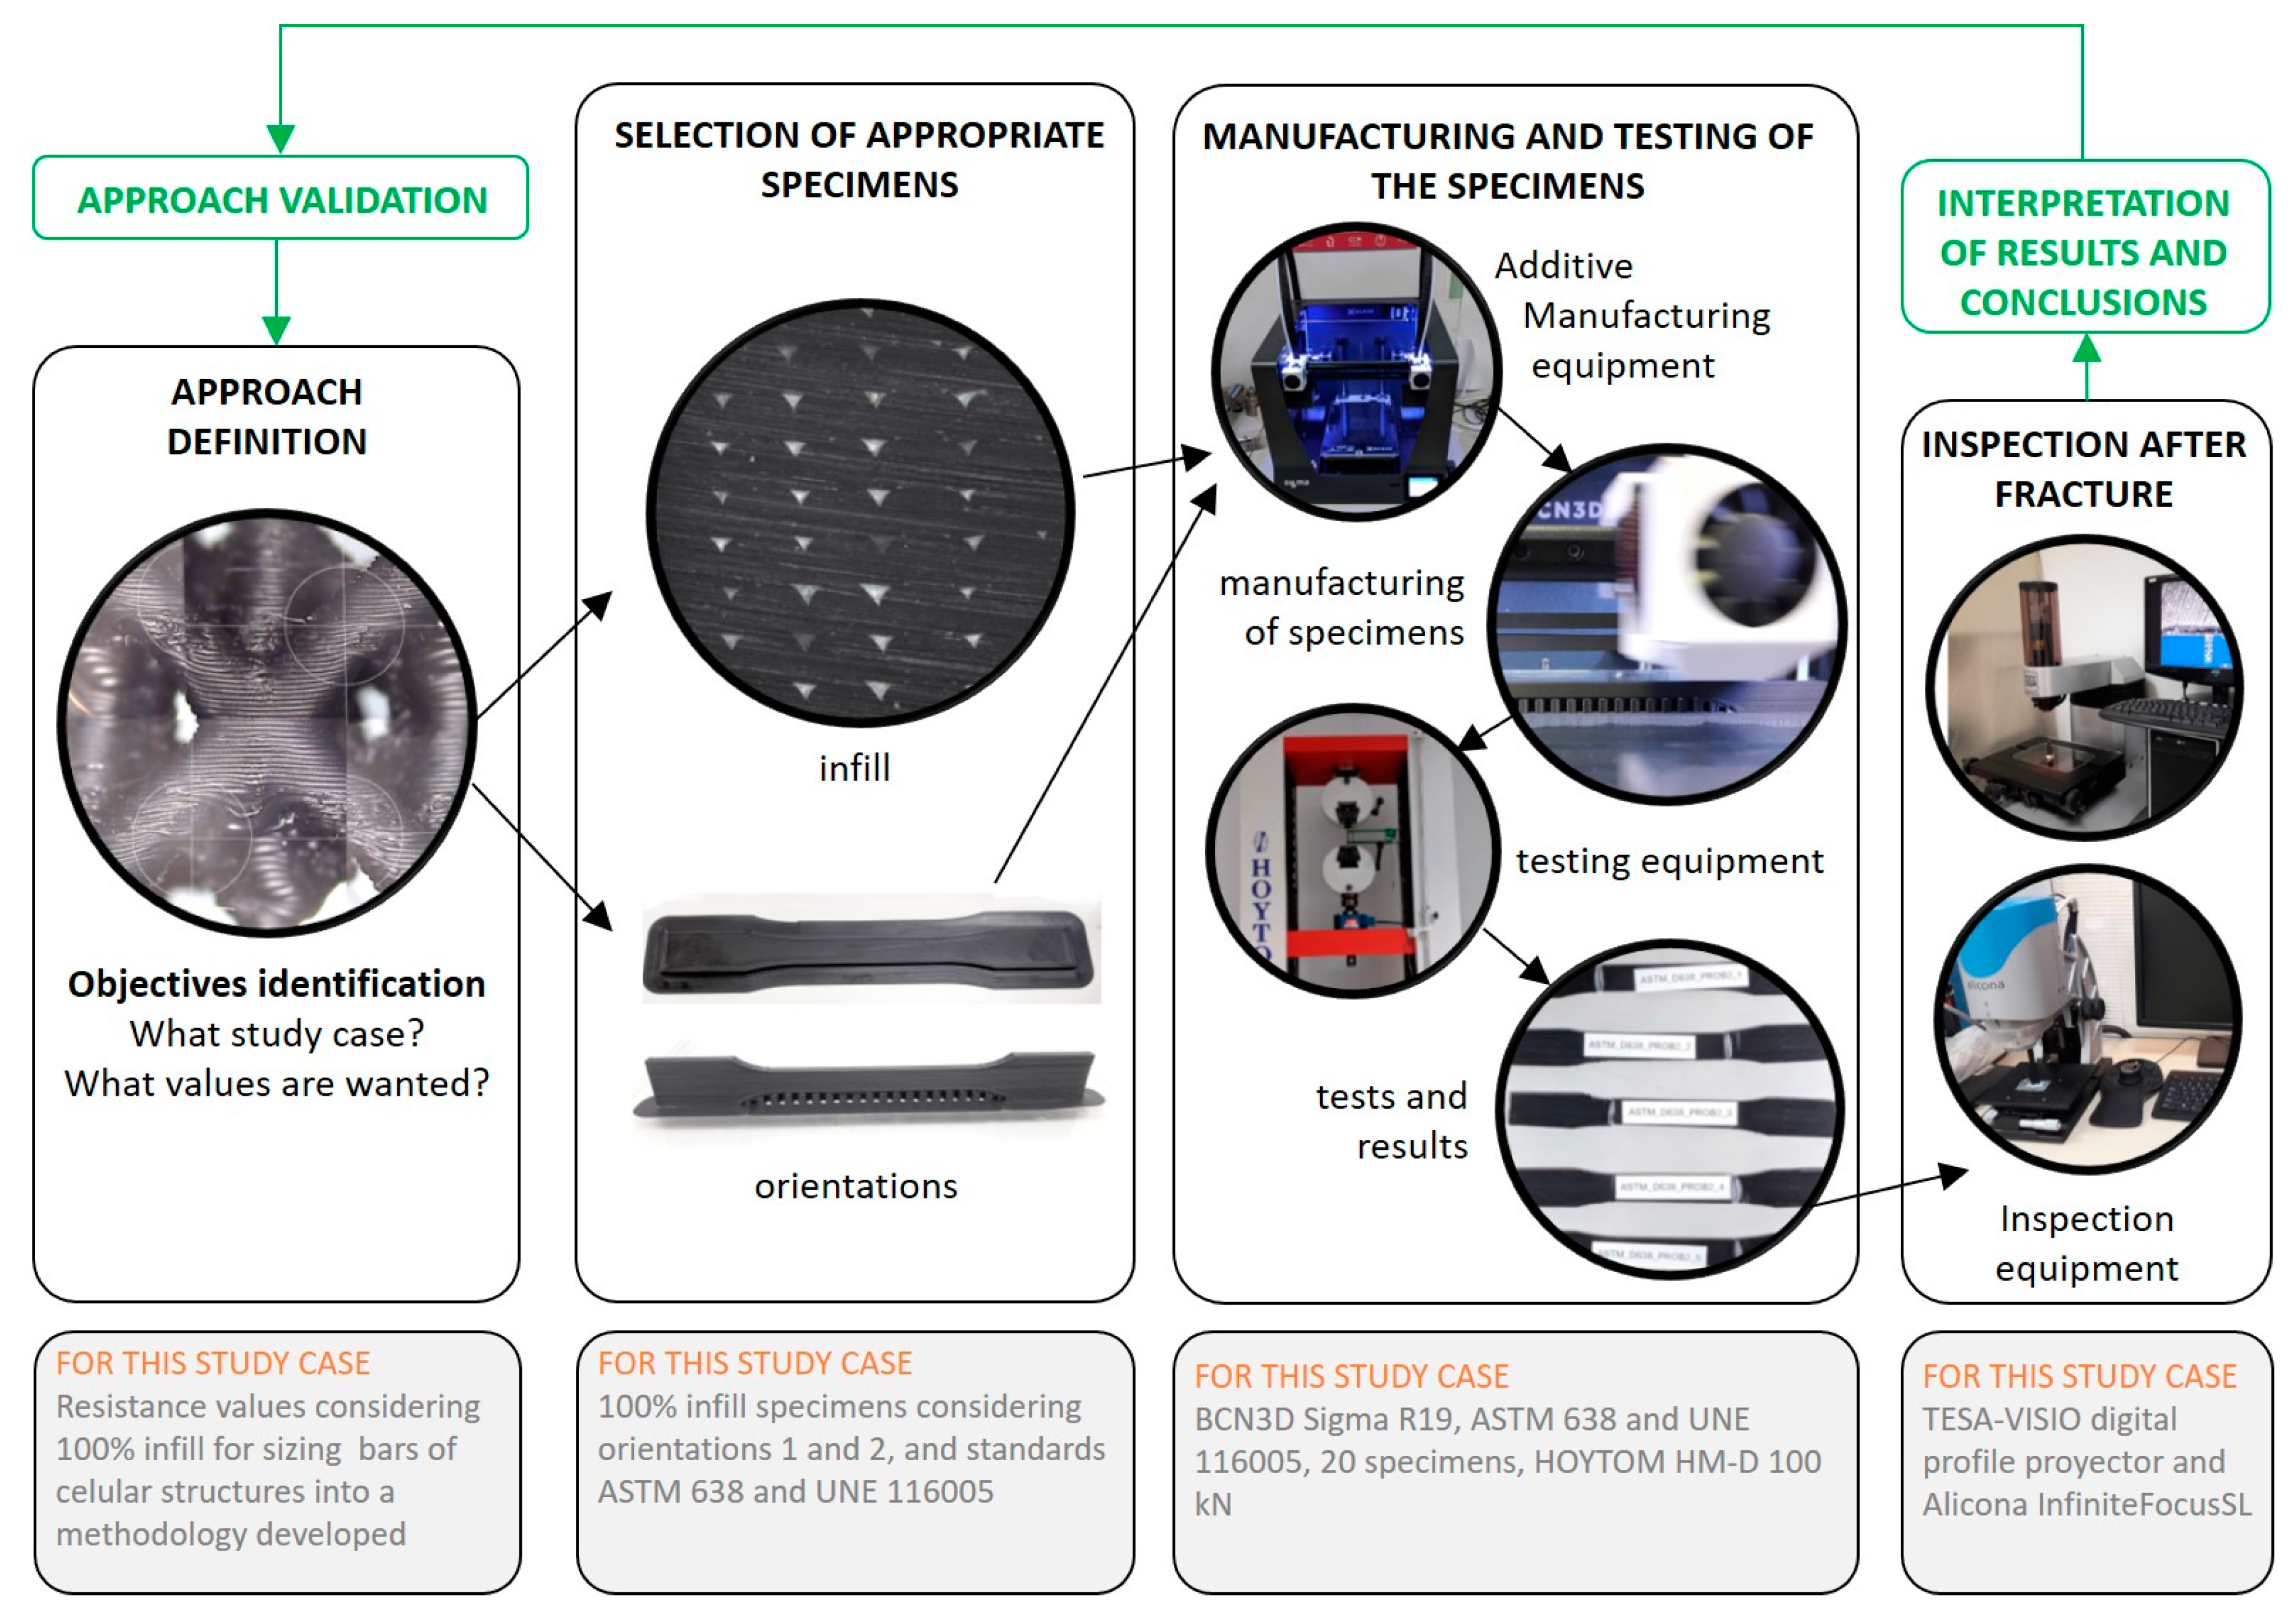
2.1. Work Methodology
2.2. Materials and Equipment
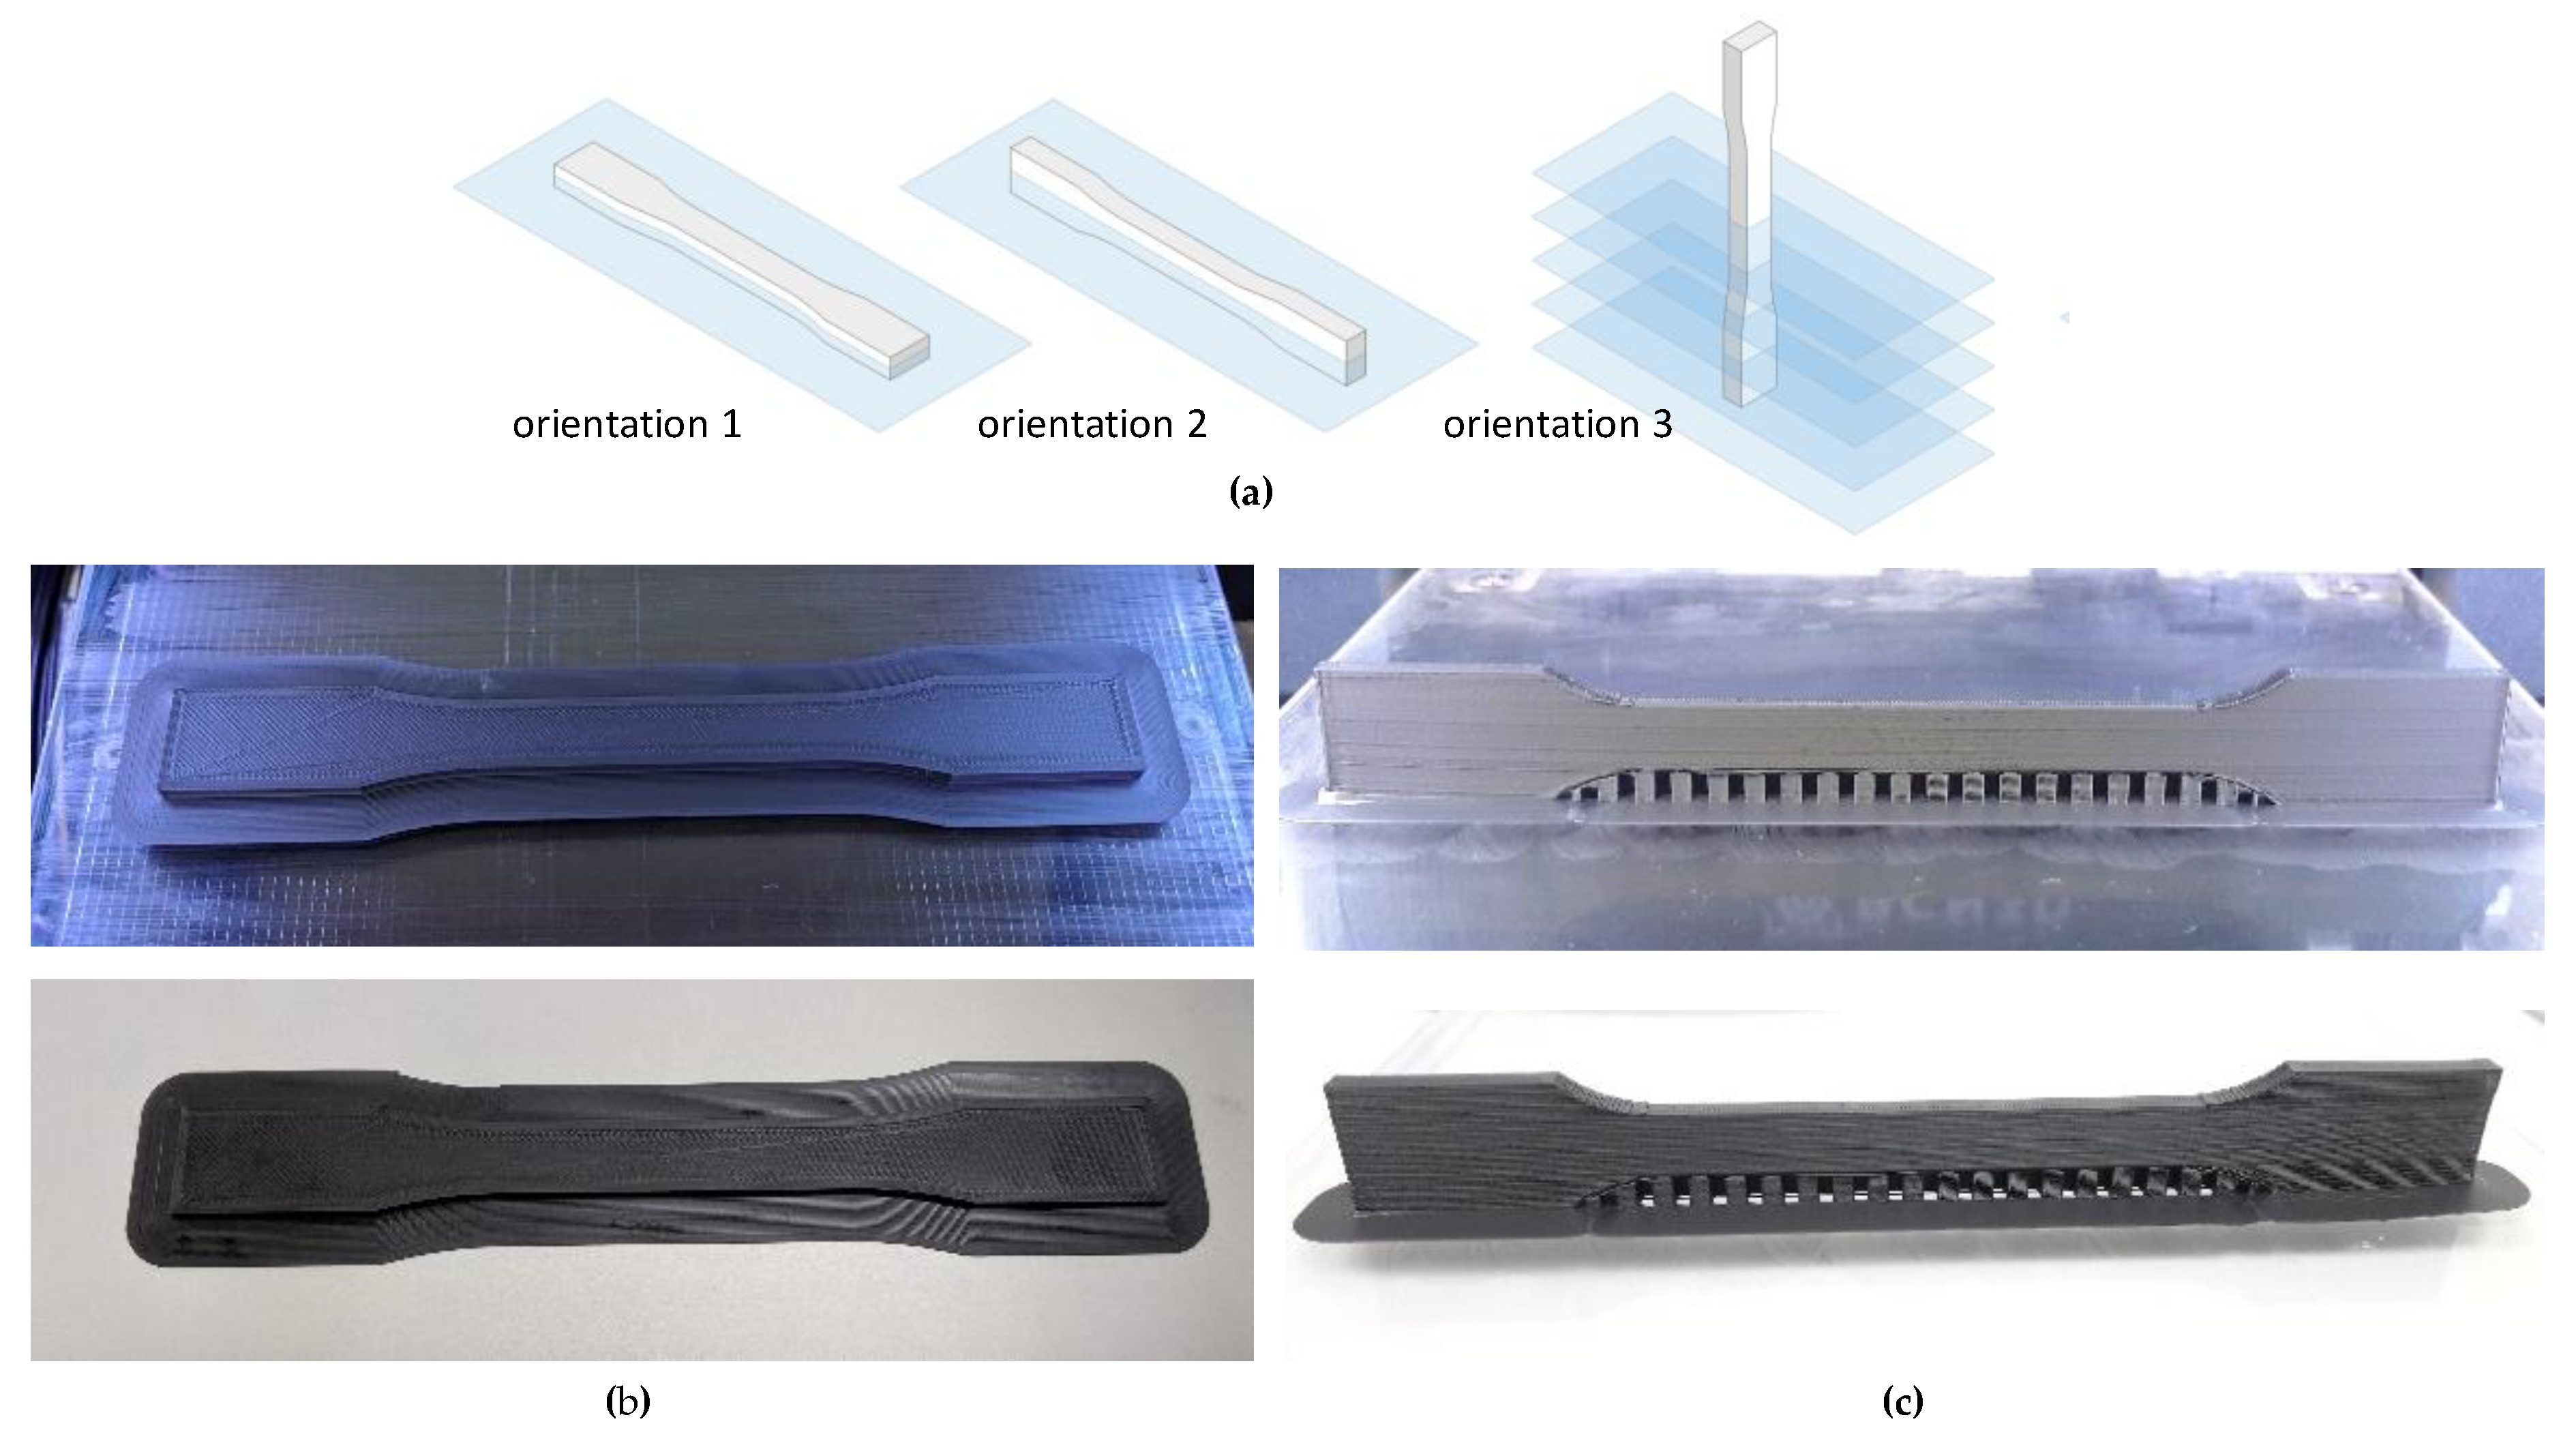
2.3. Printing Parameters and Definition of a Work Plan
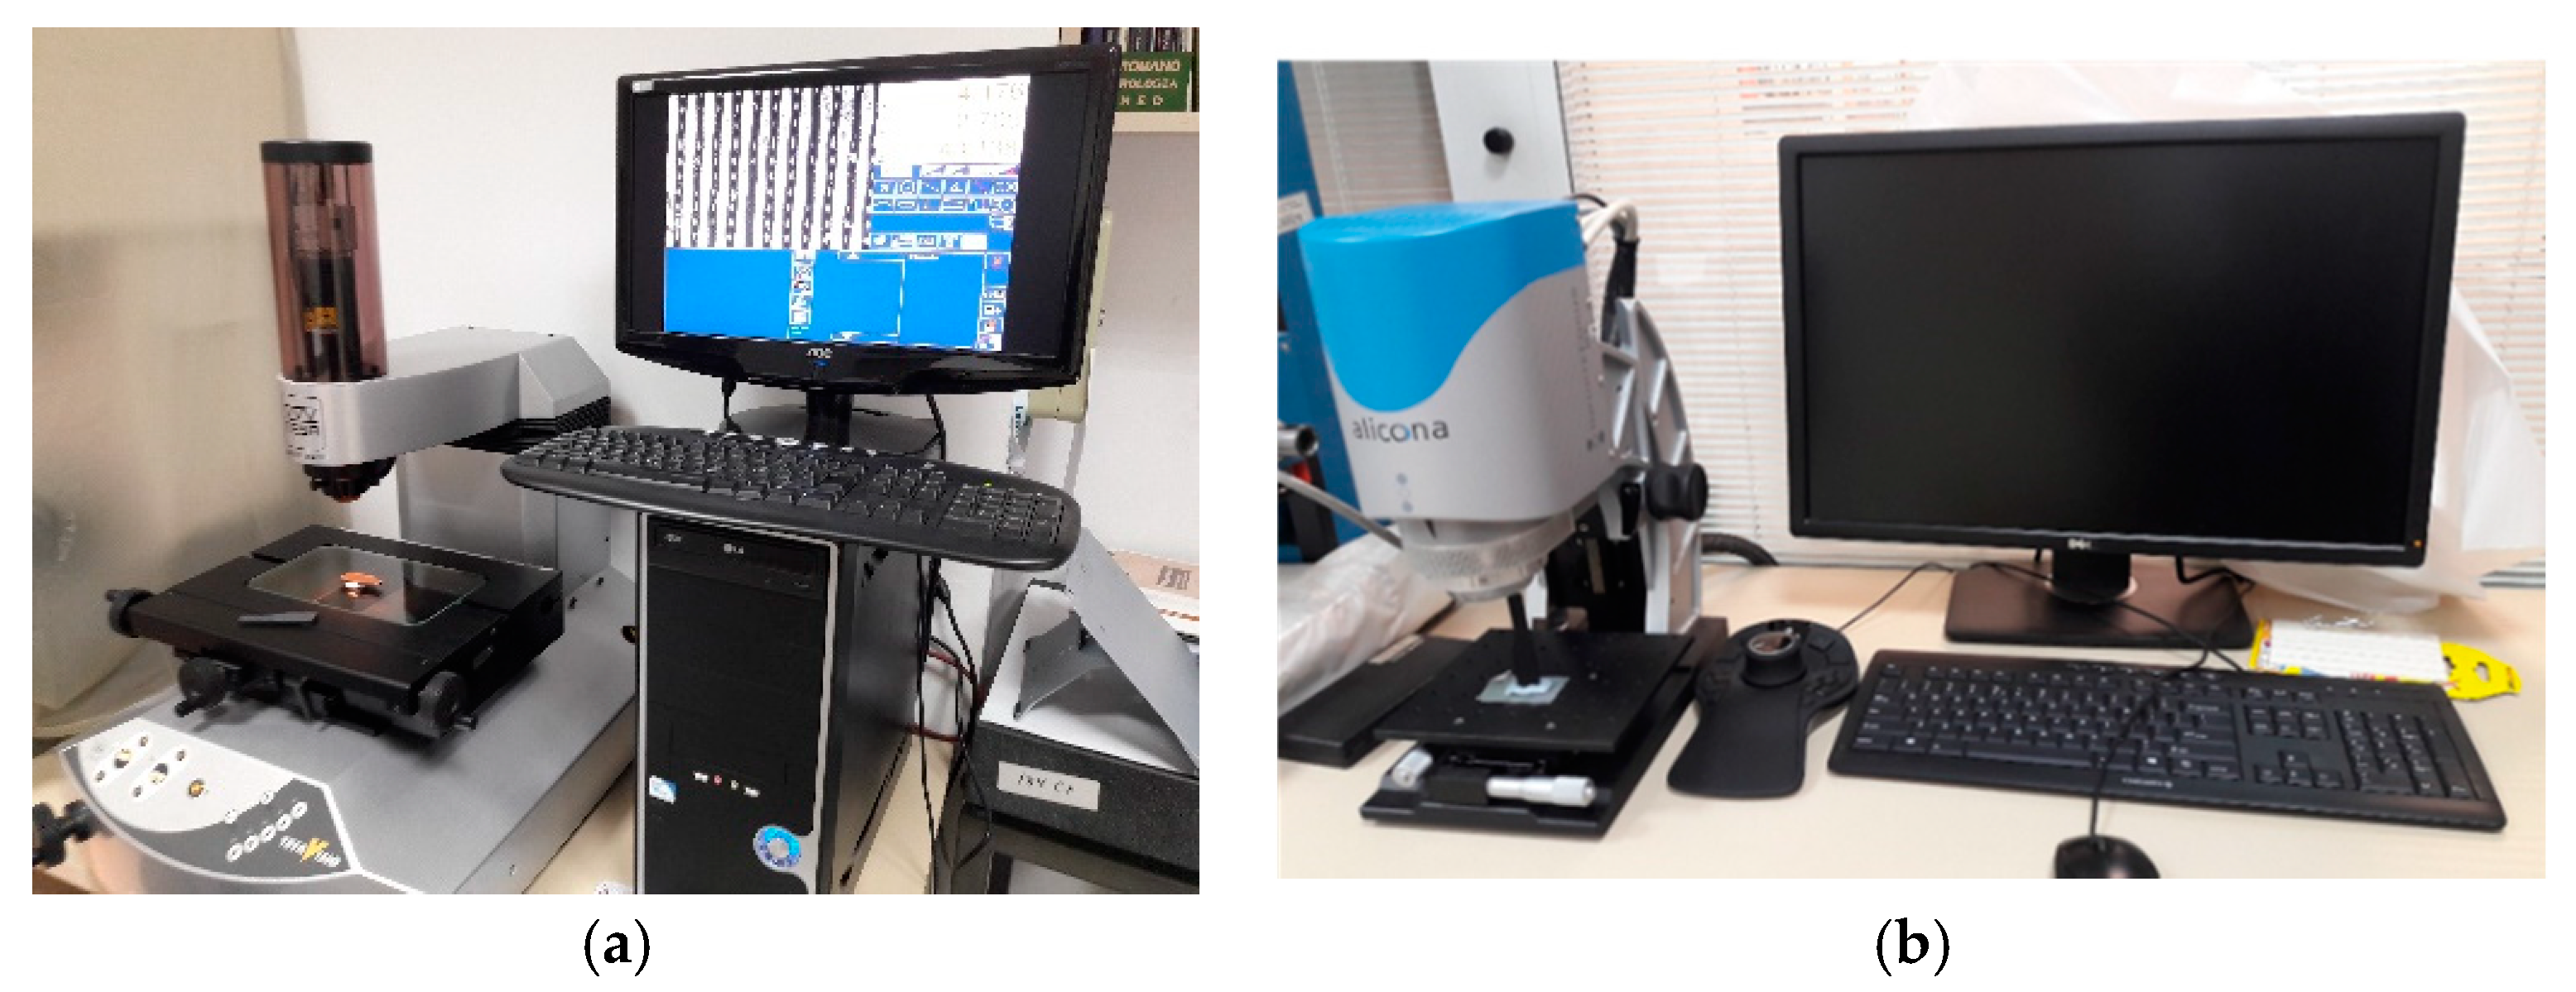
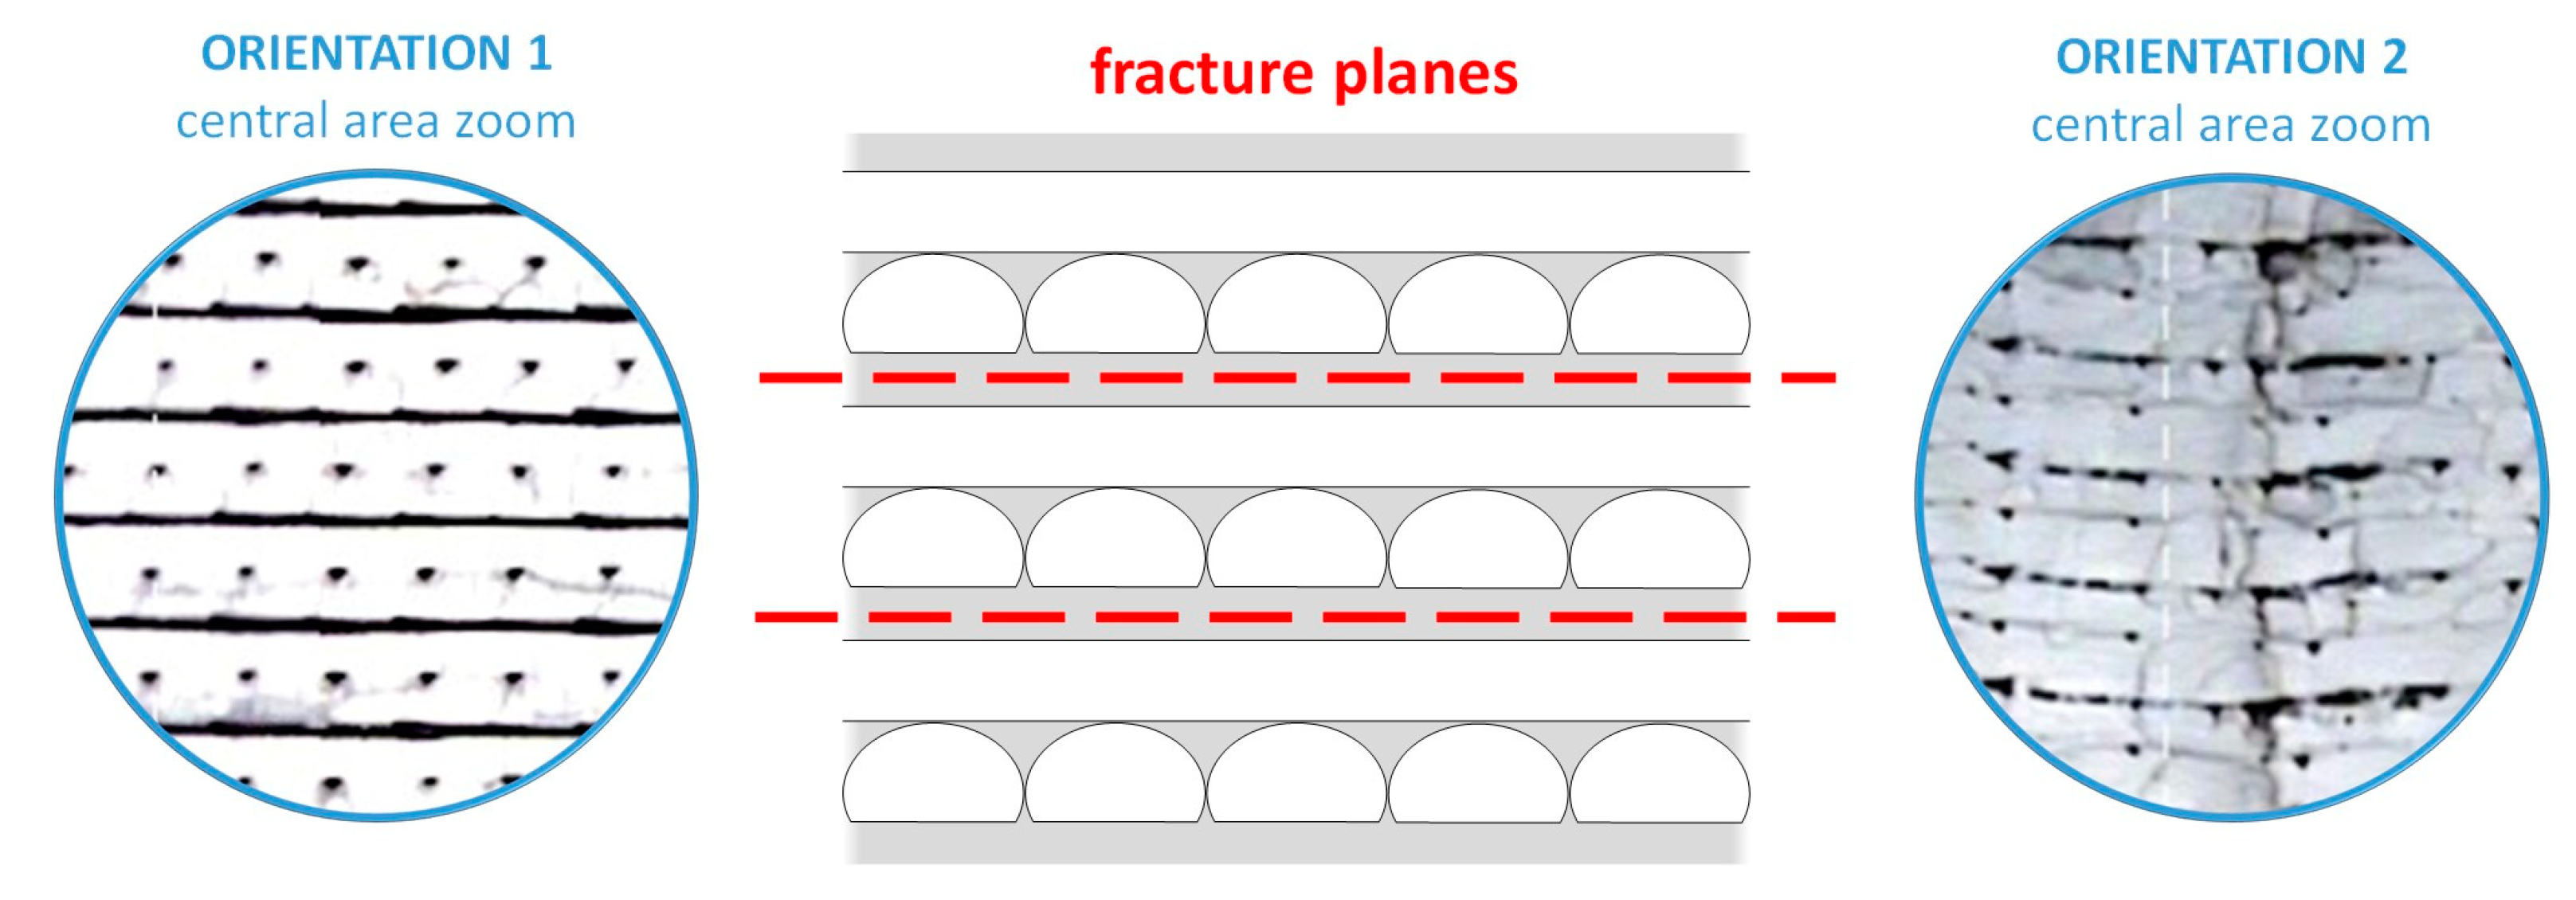
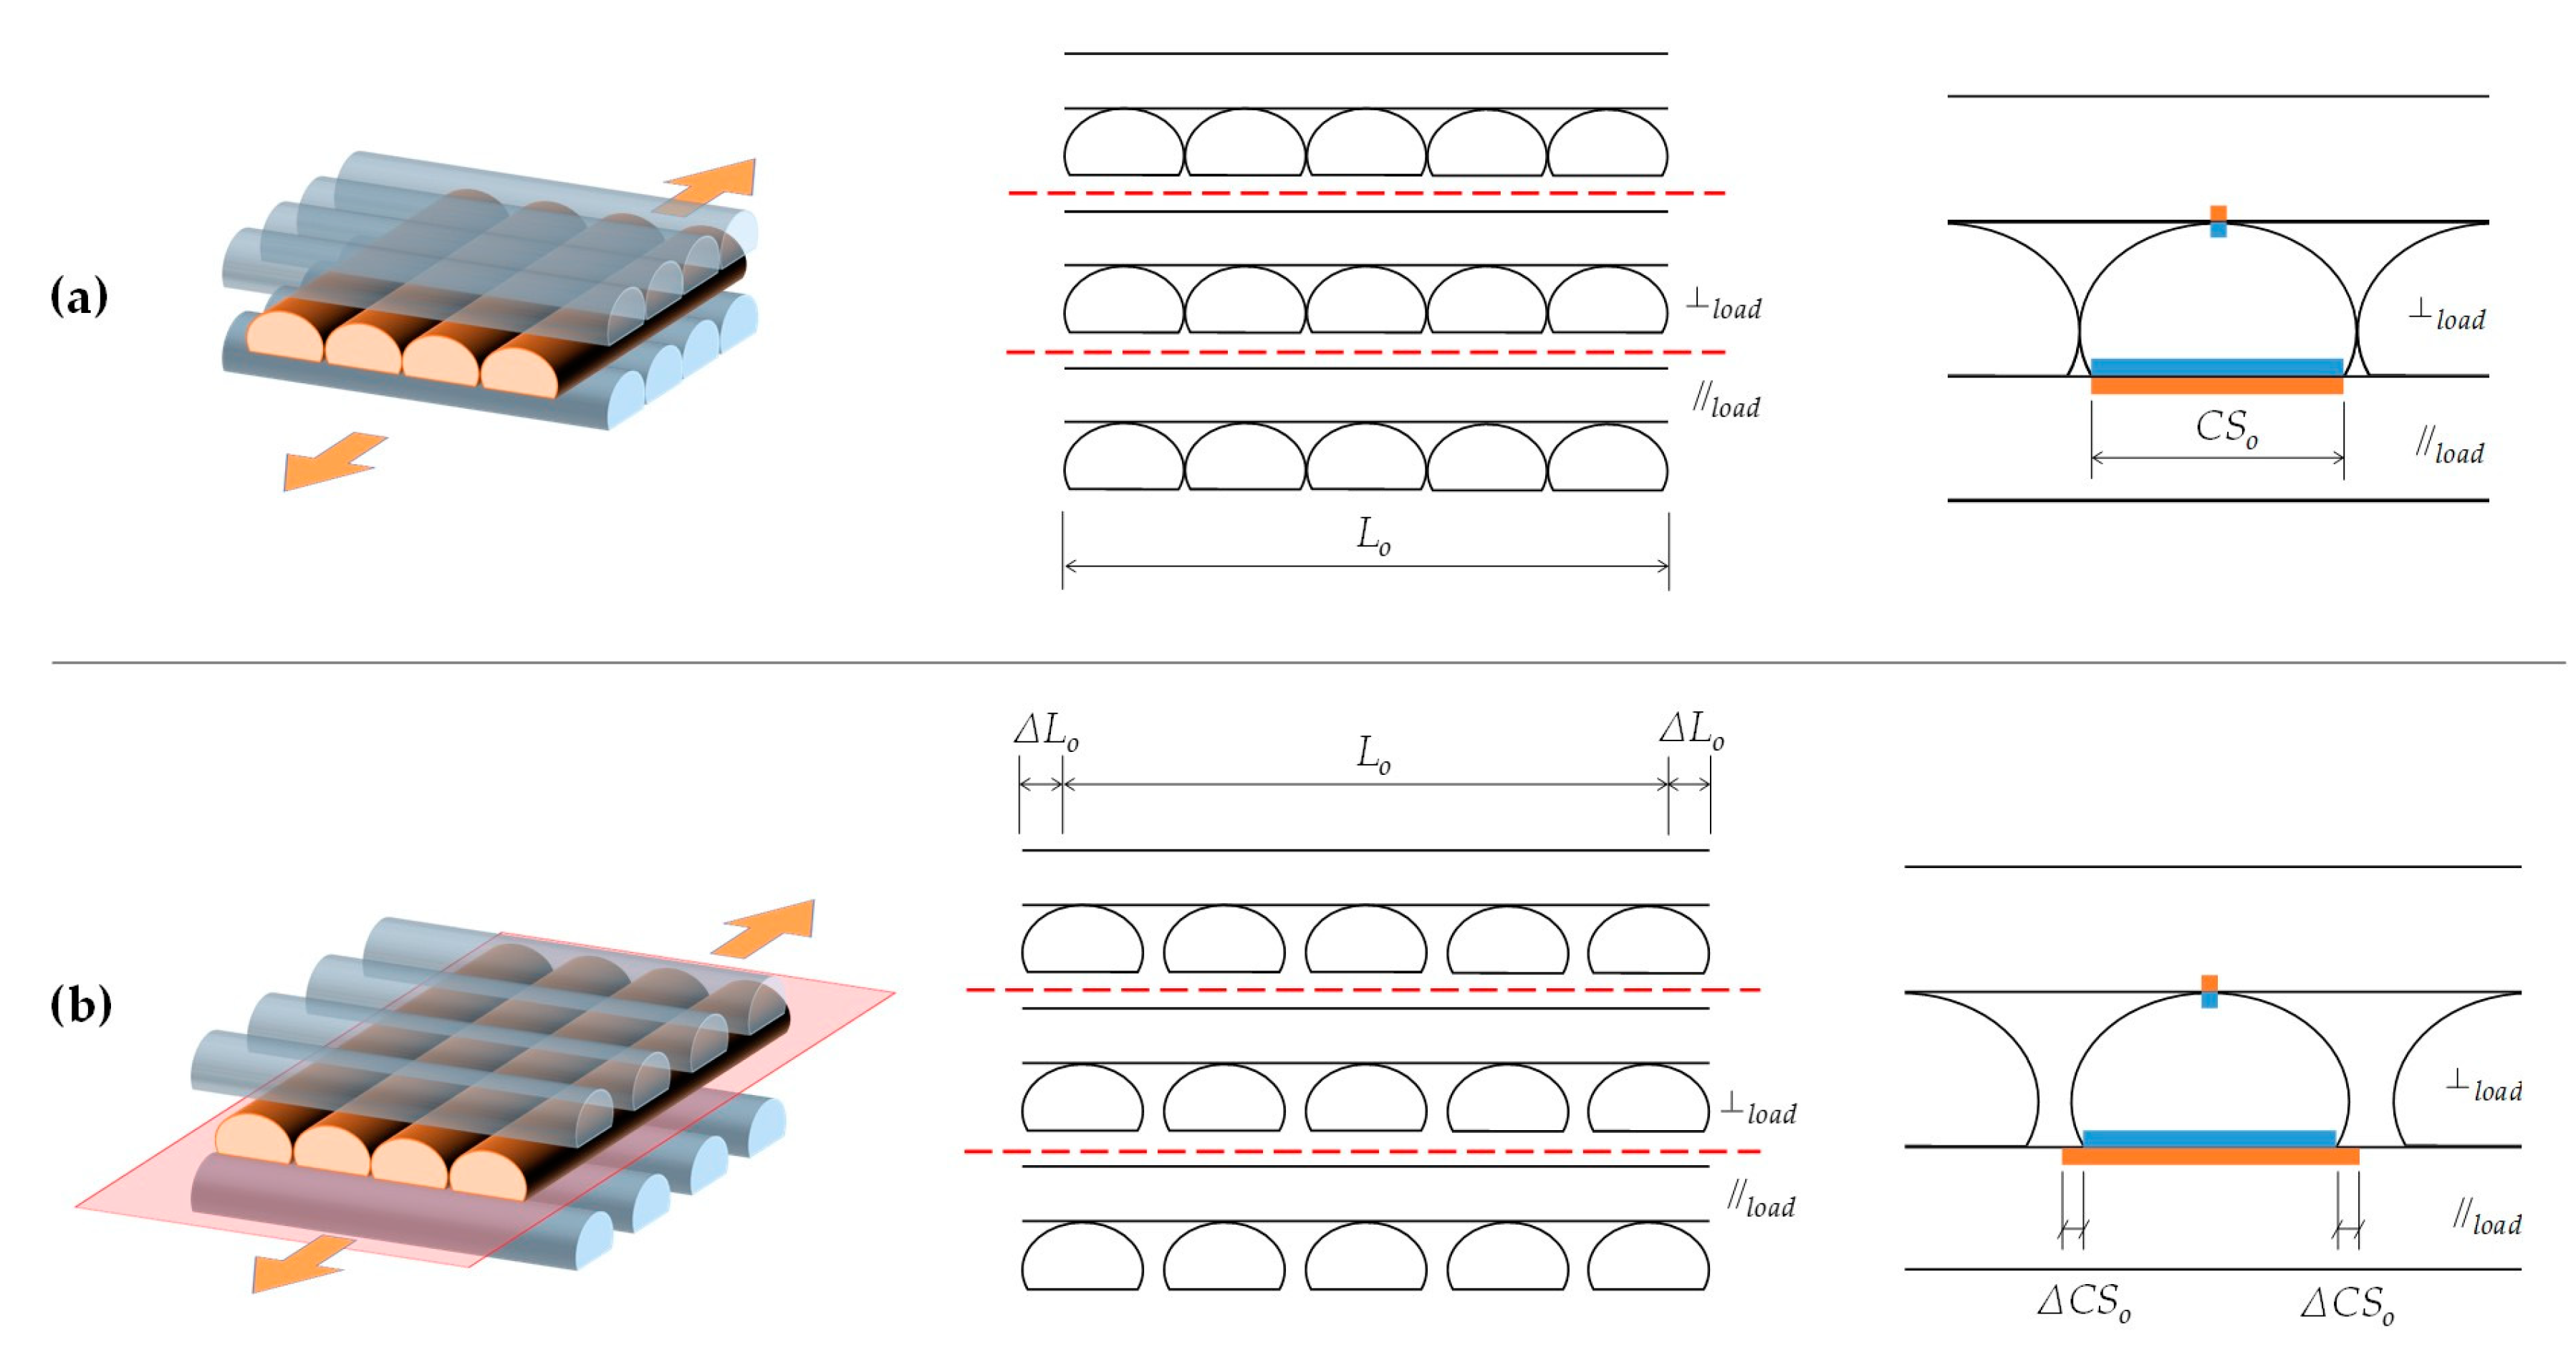
2.4. Experimental Procedure for Tensile Testing
- Fmax: the maximum force sustained by the specimen,
- Fbreak: the force sustained by the specimen at breakage,
- L0: original grip separation,
- ΔL: extension (change in grip separation).
3. Results and Discussion
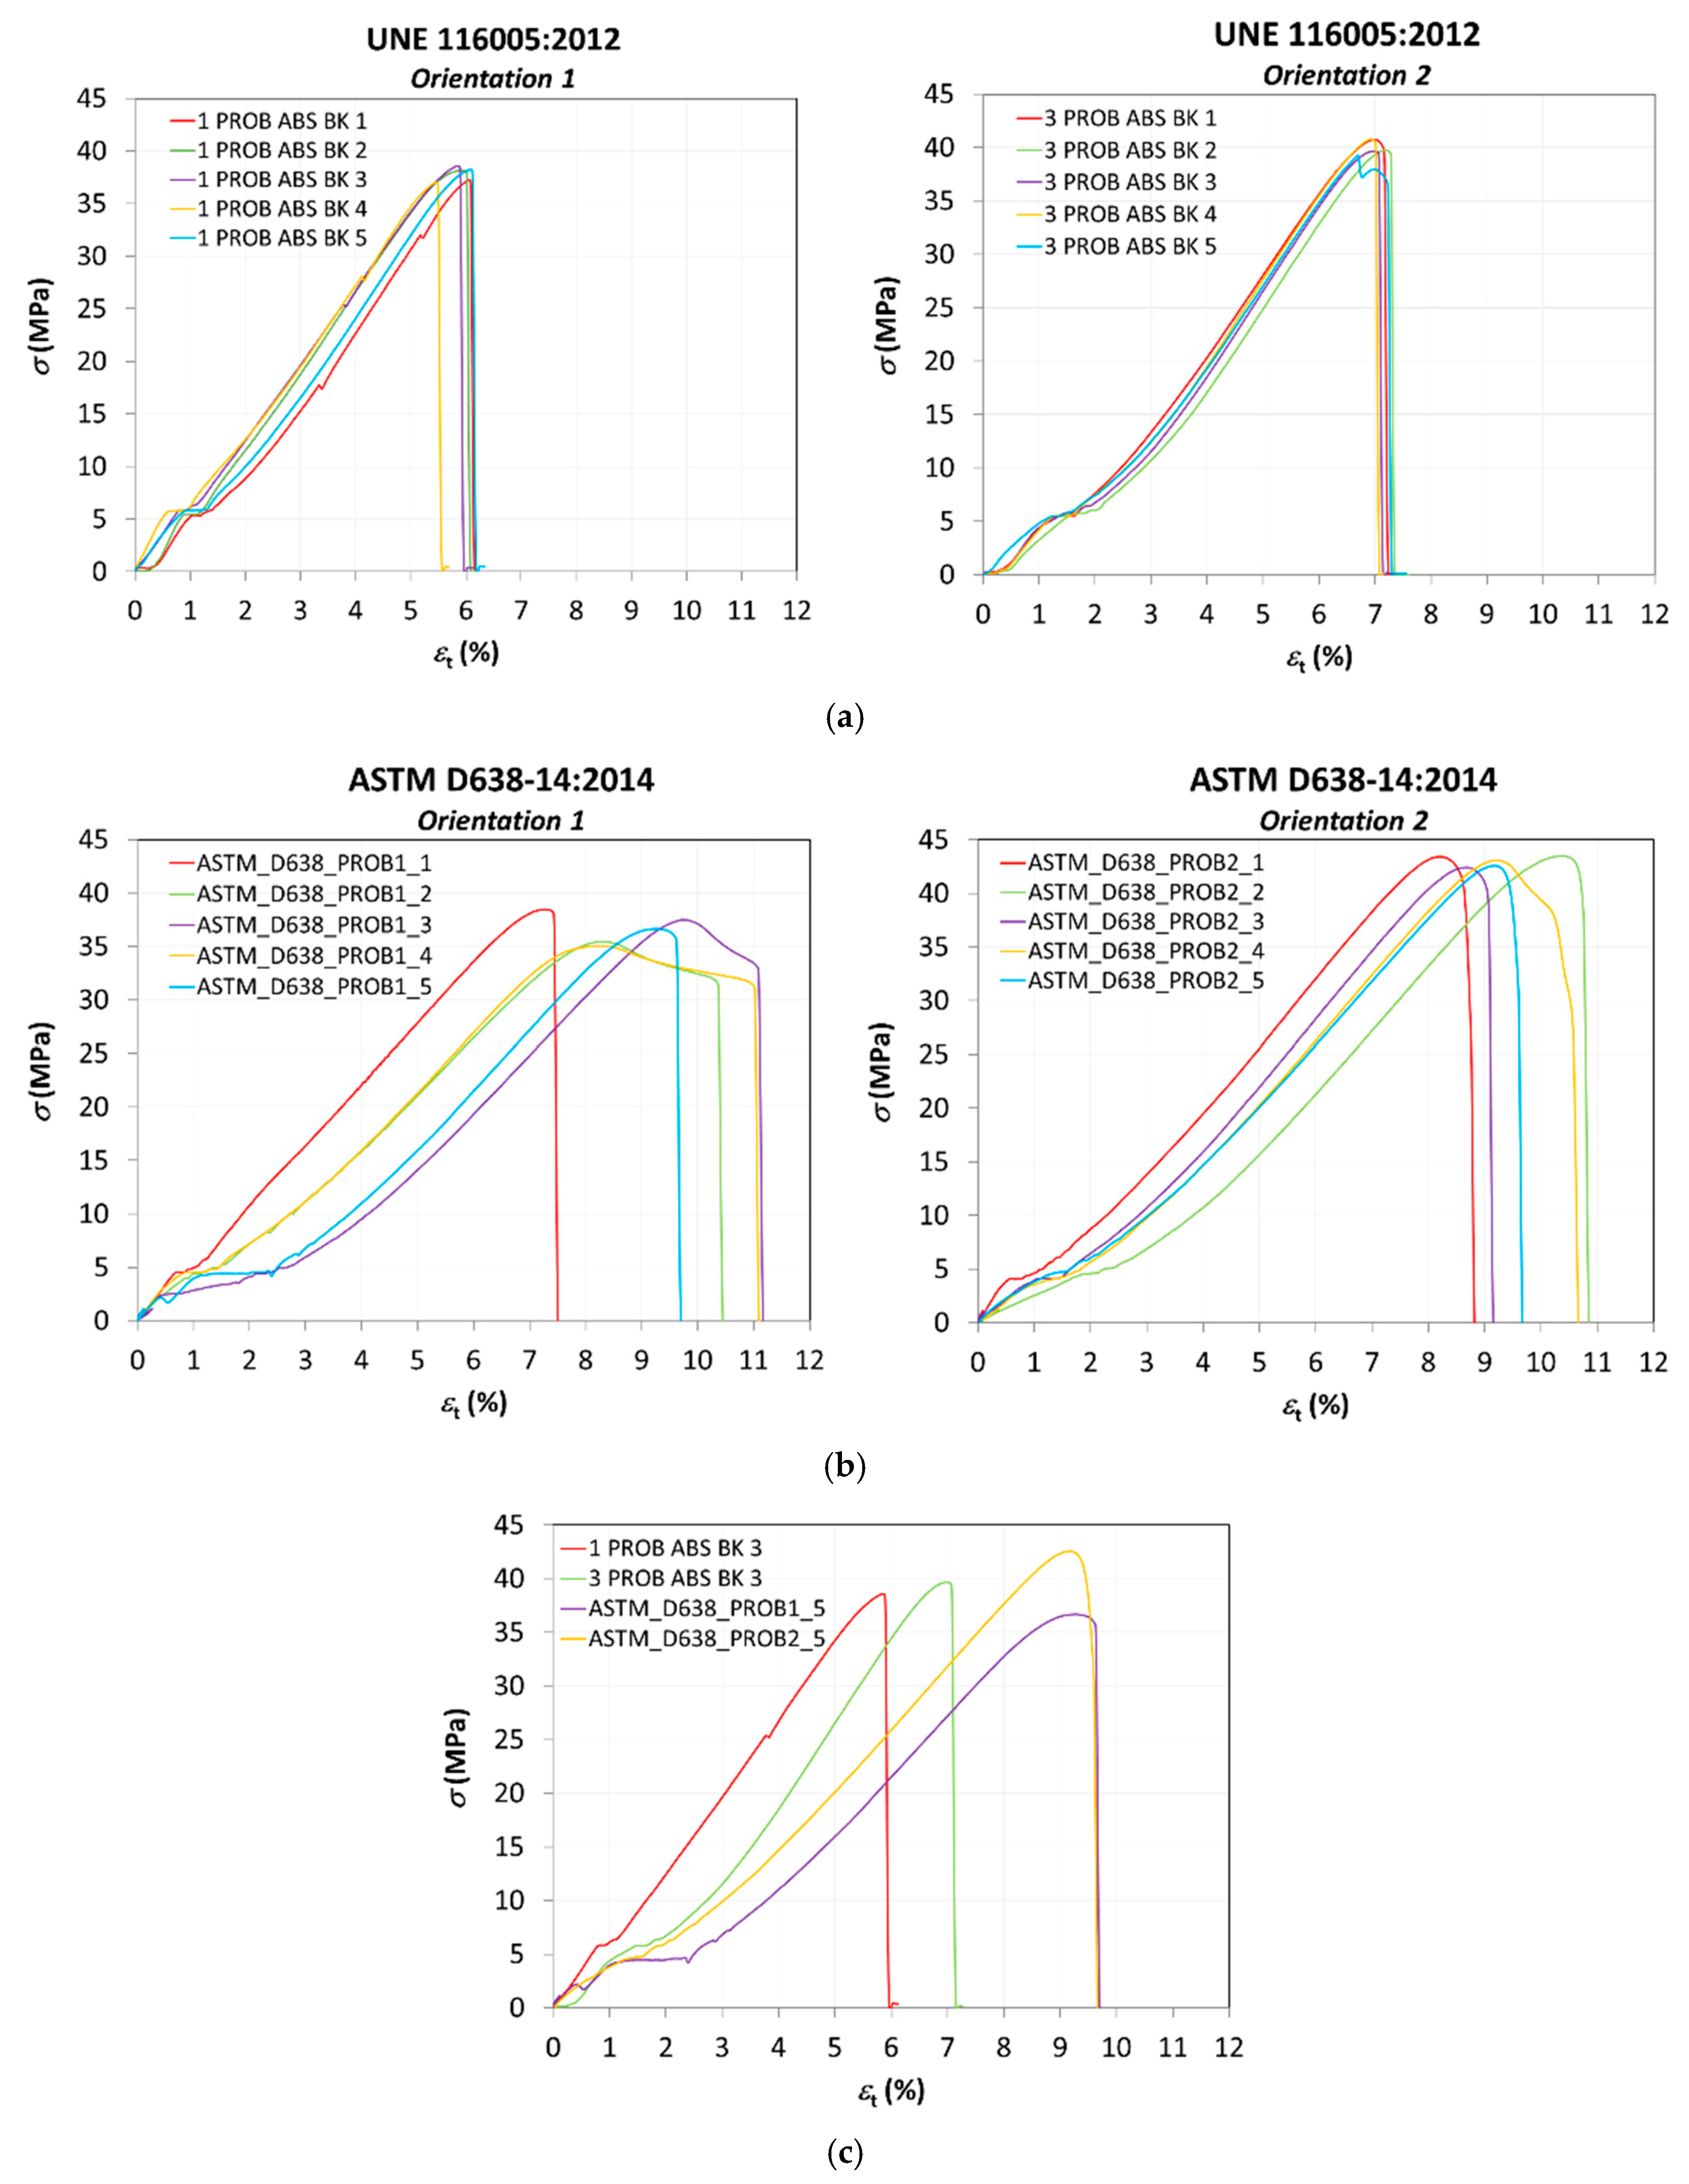
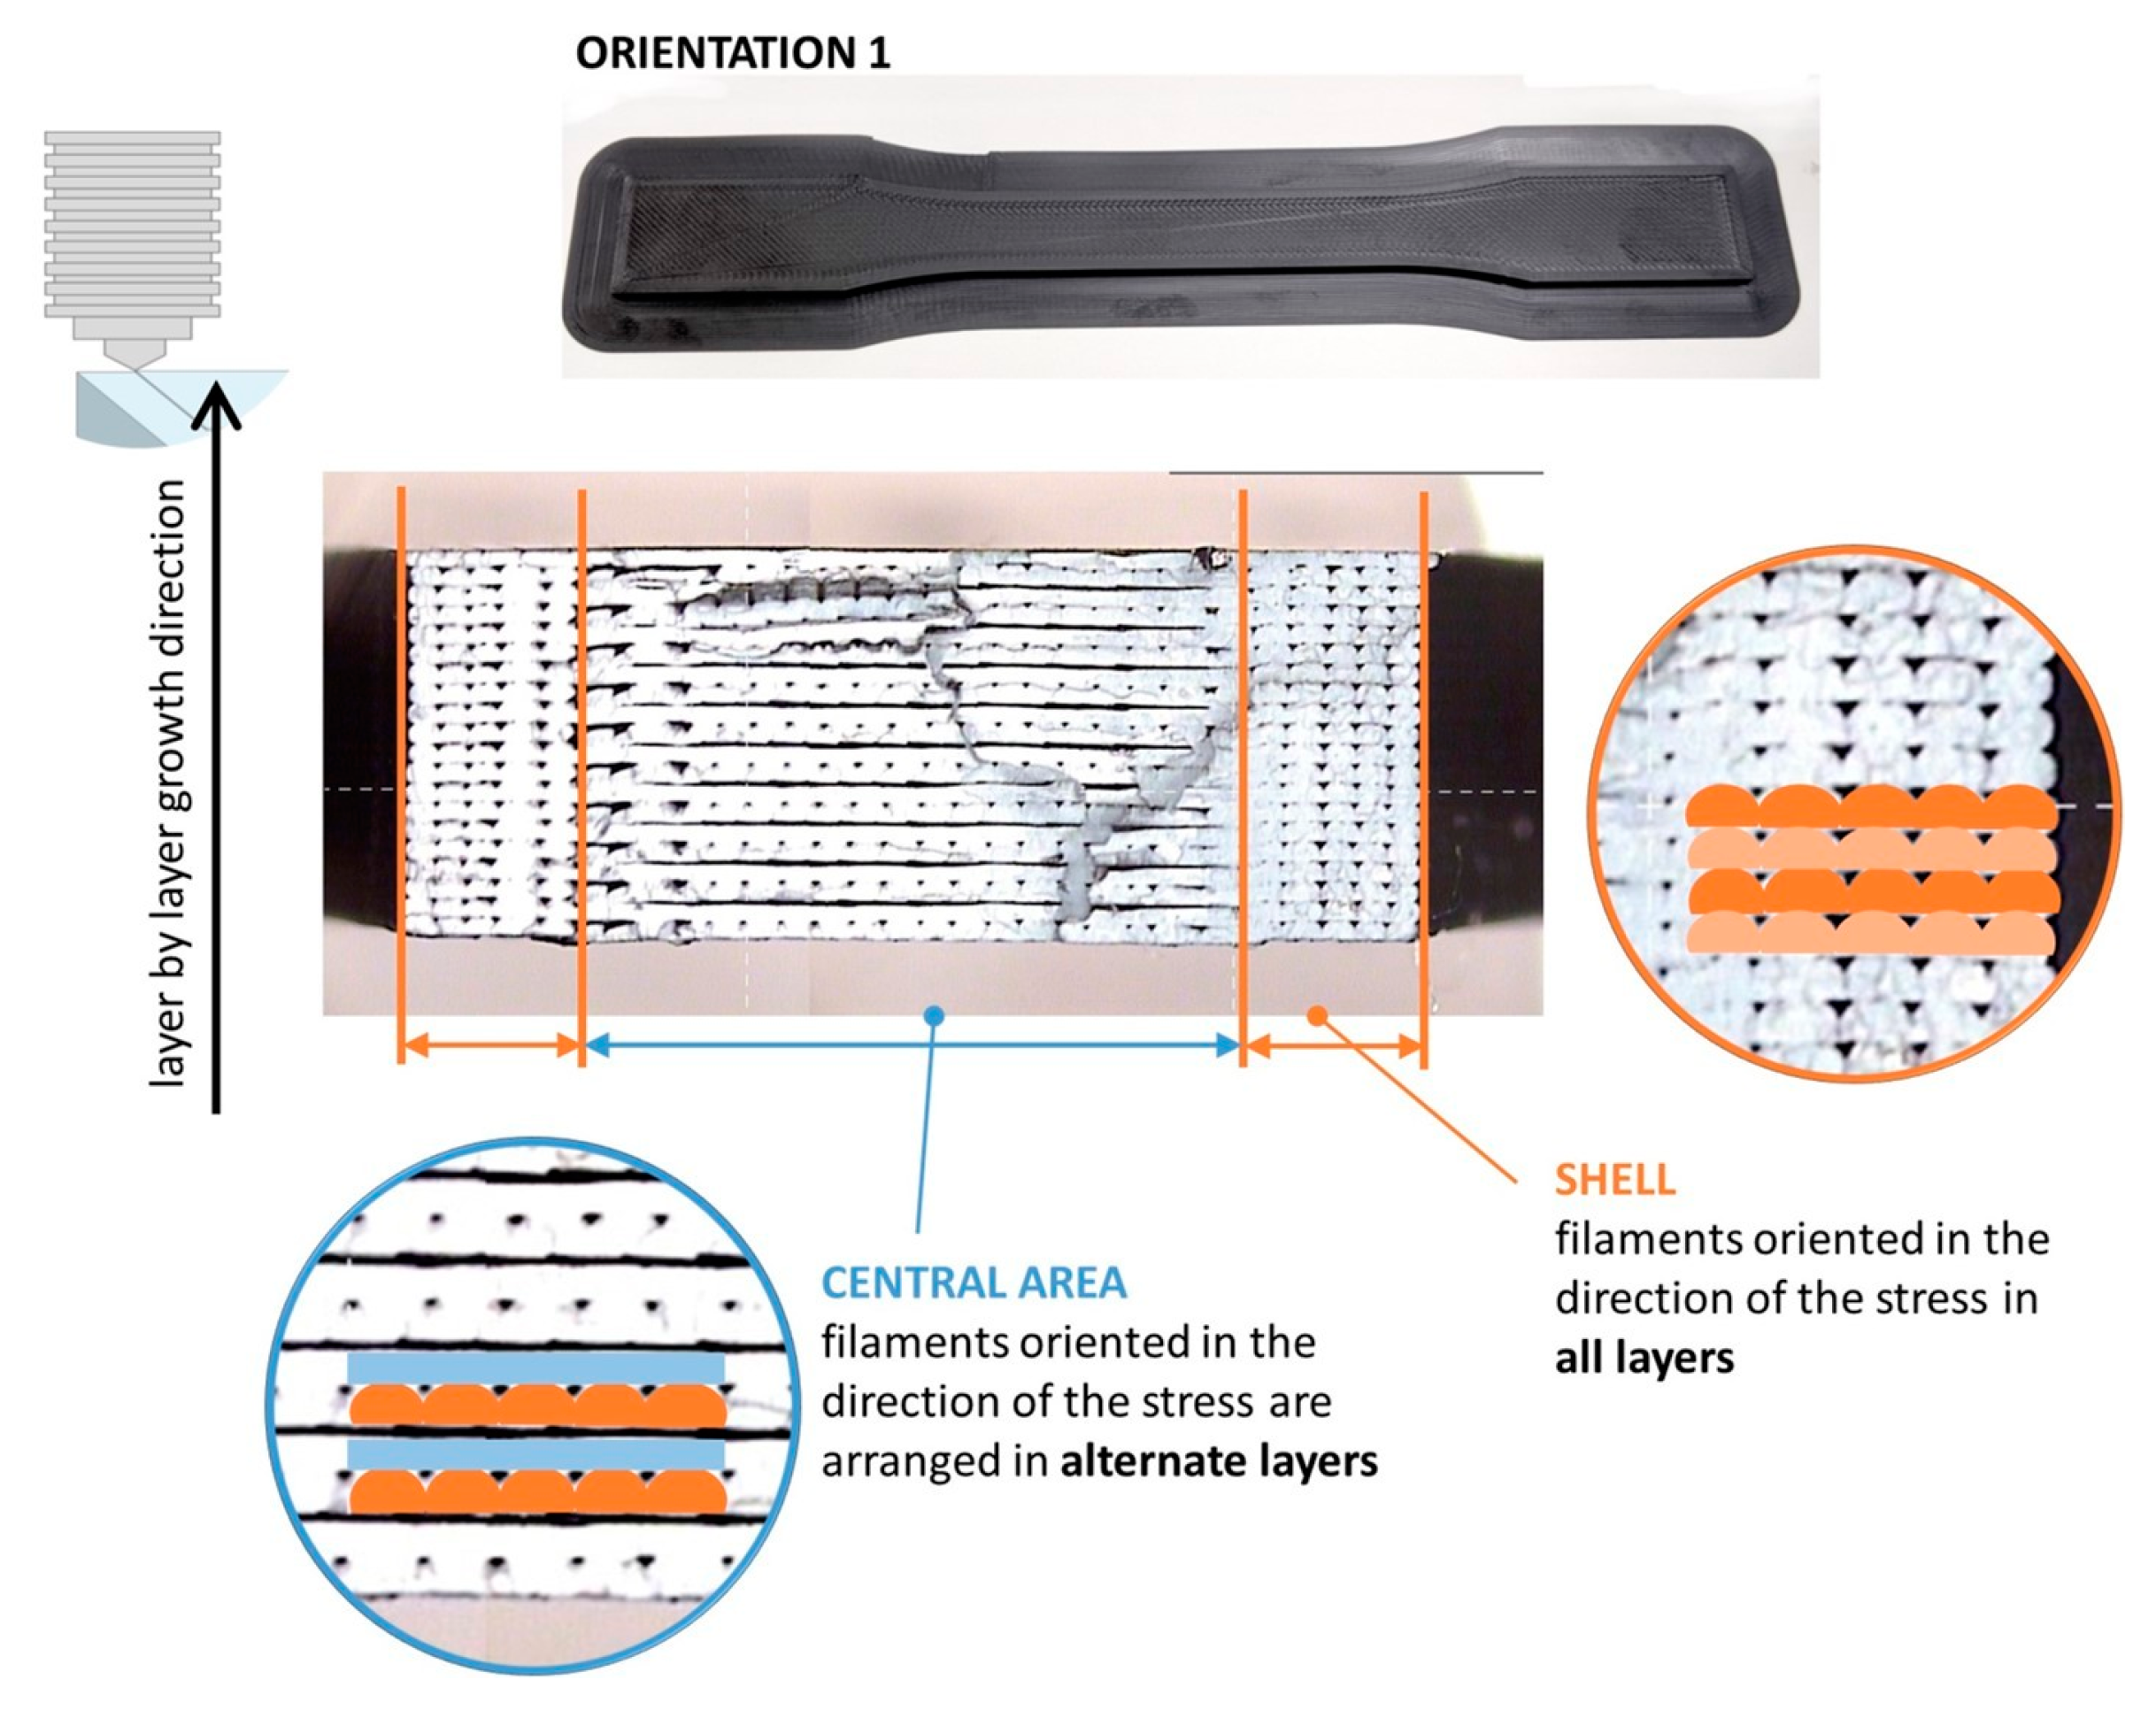
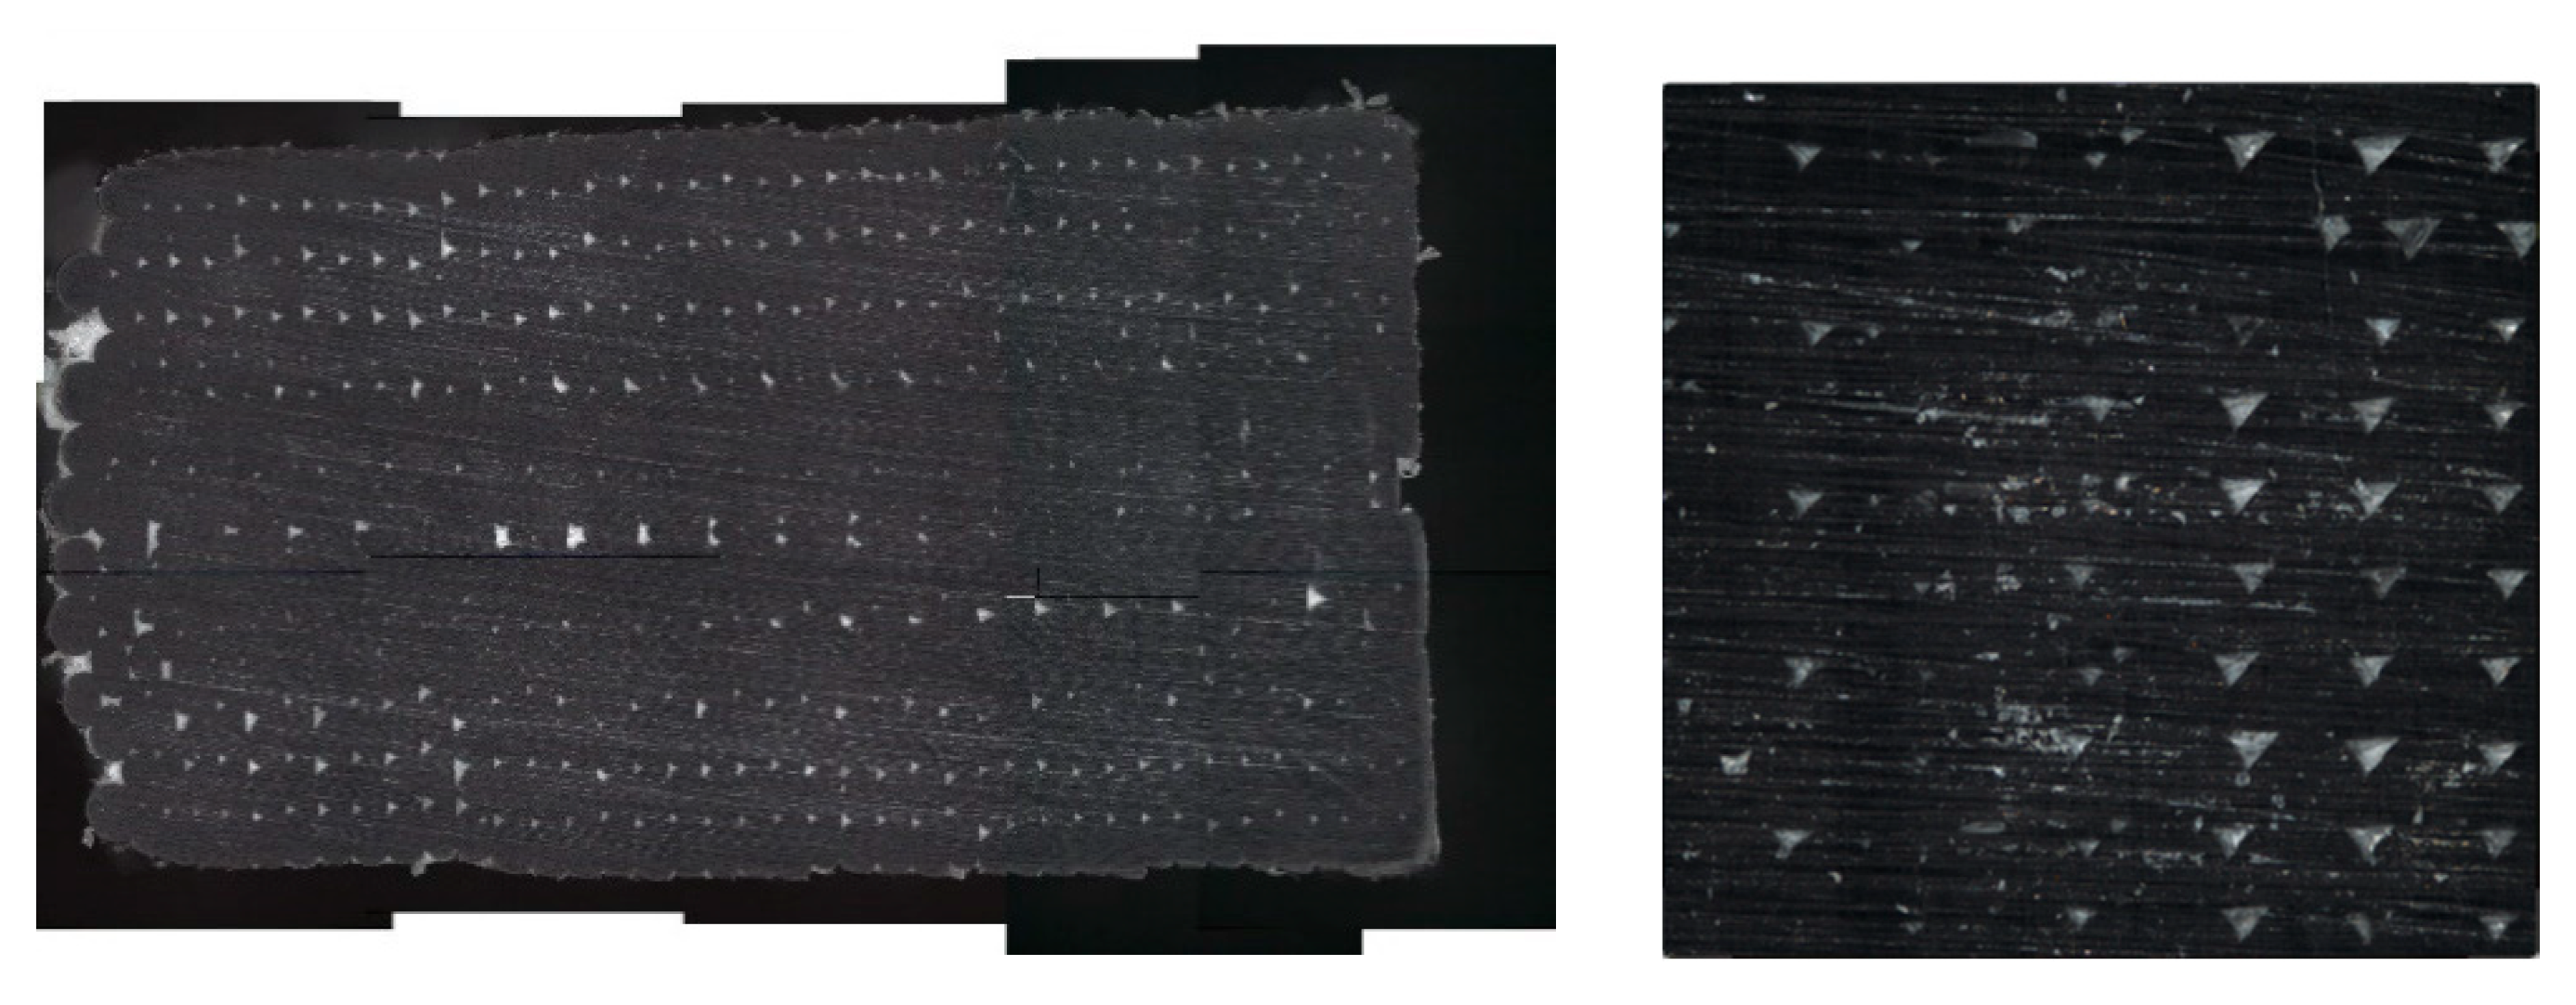
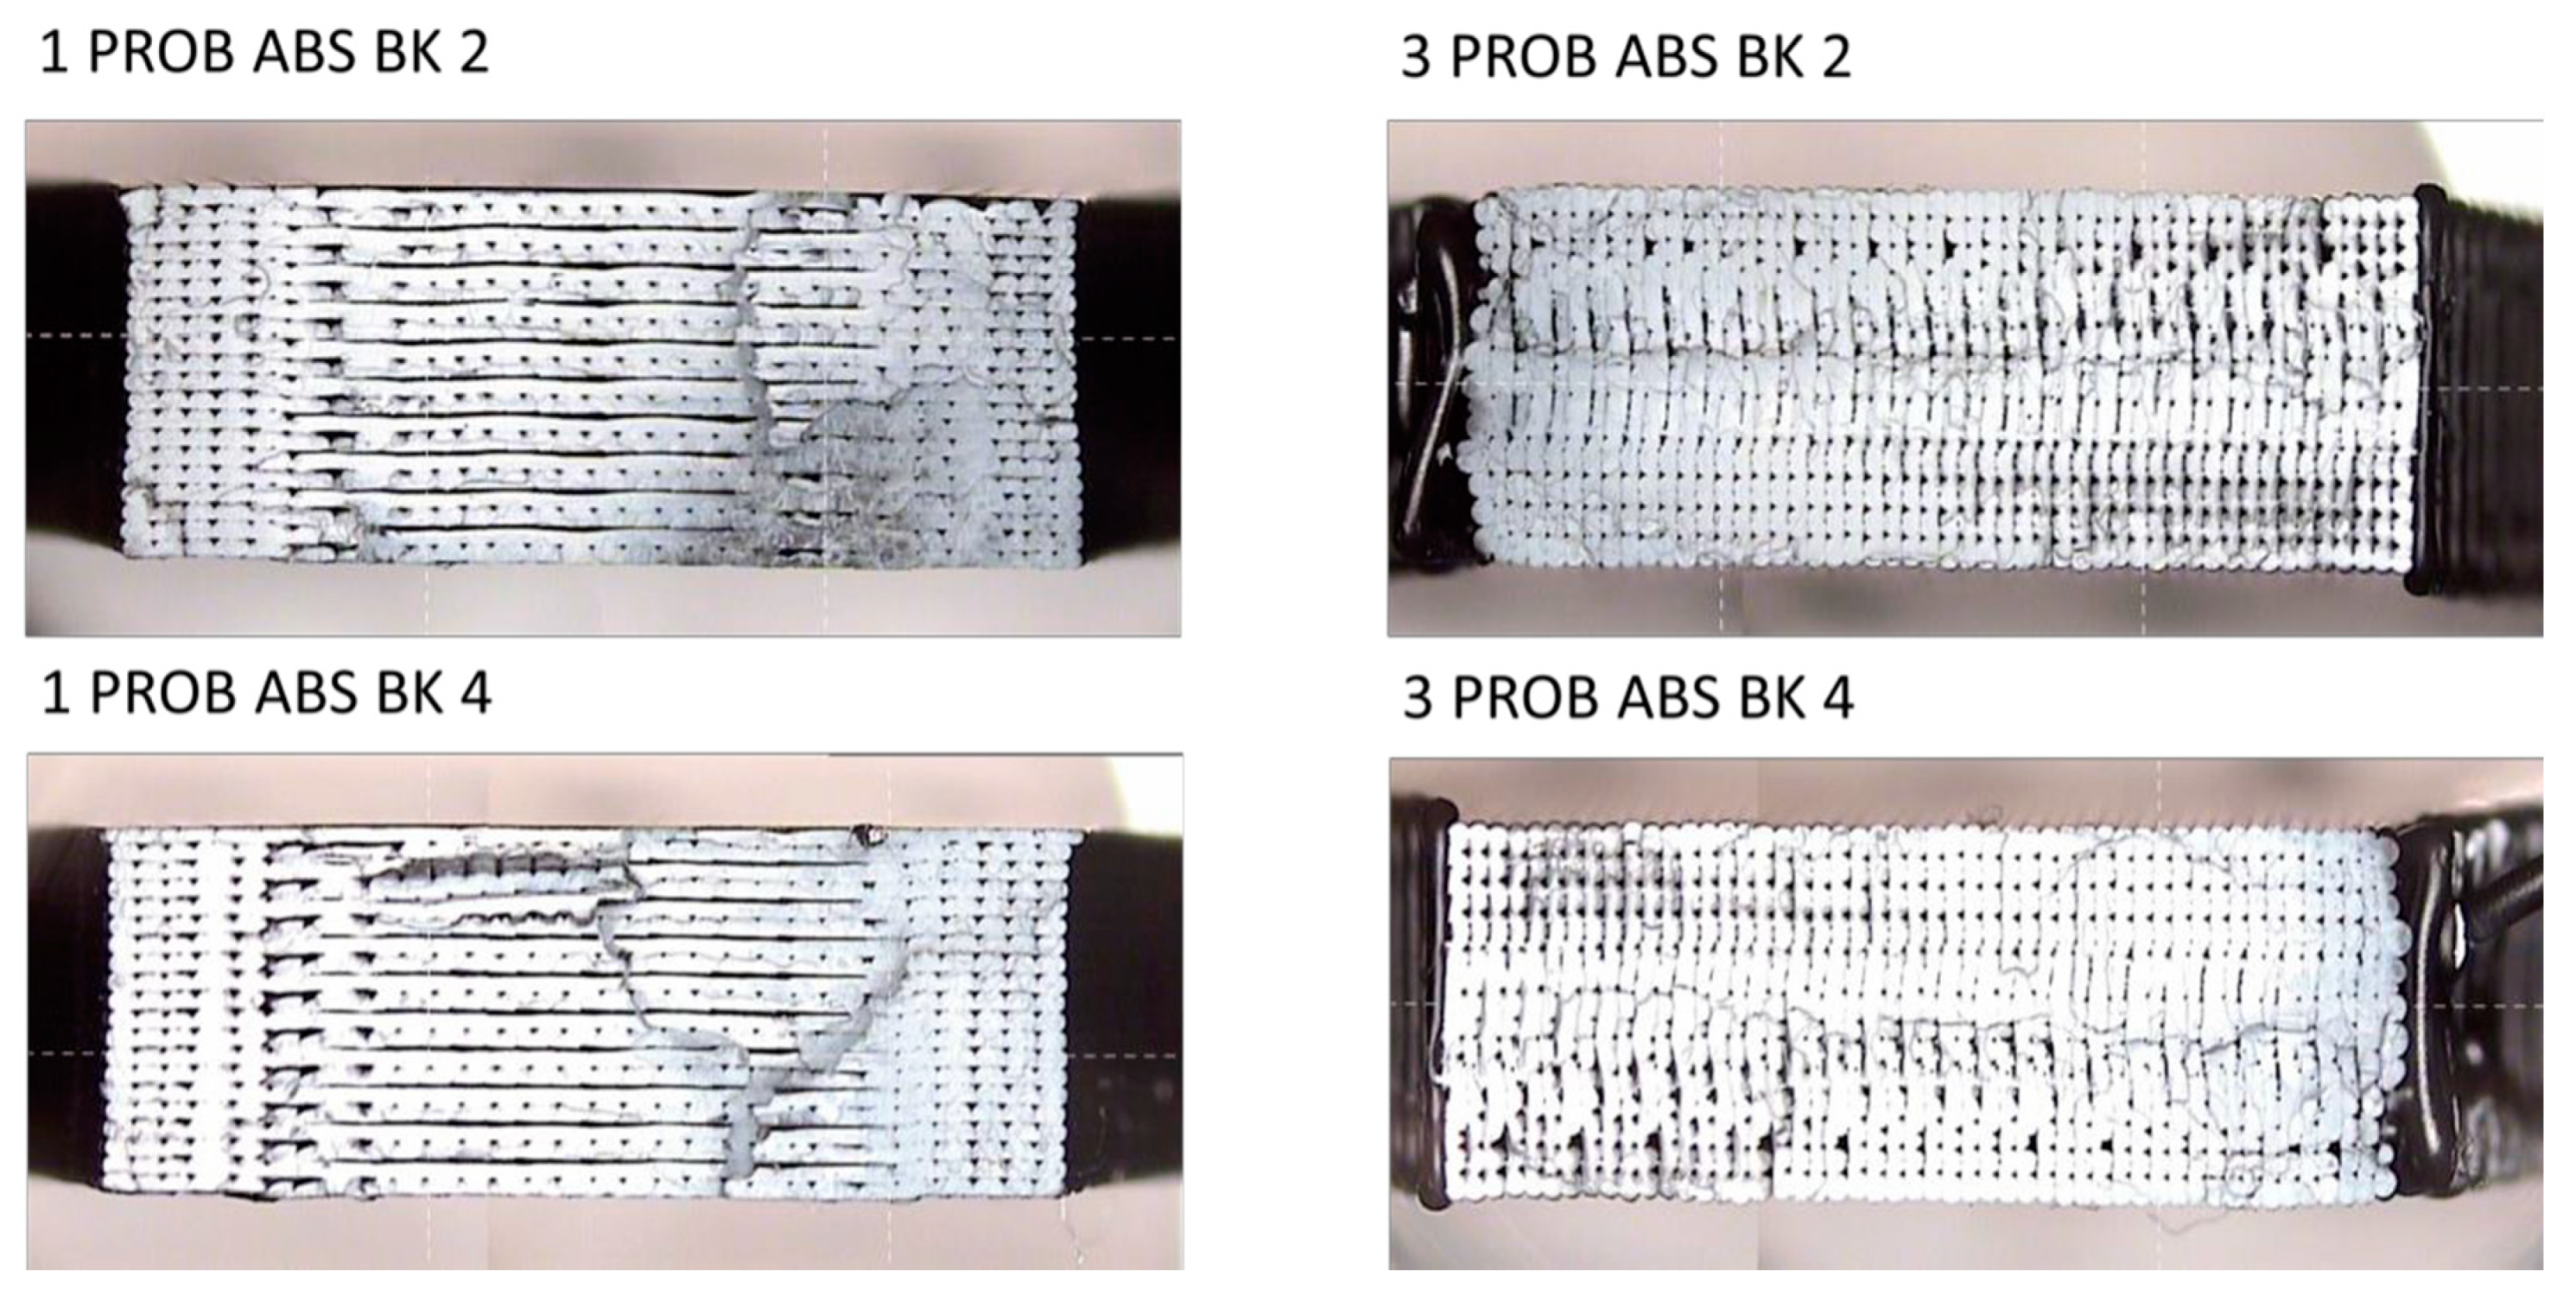
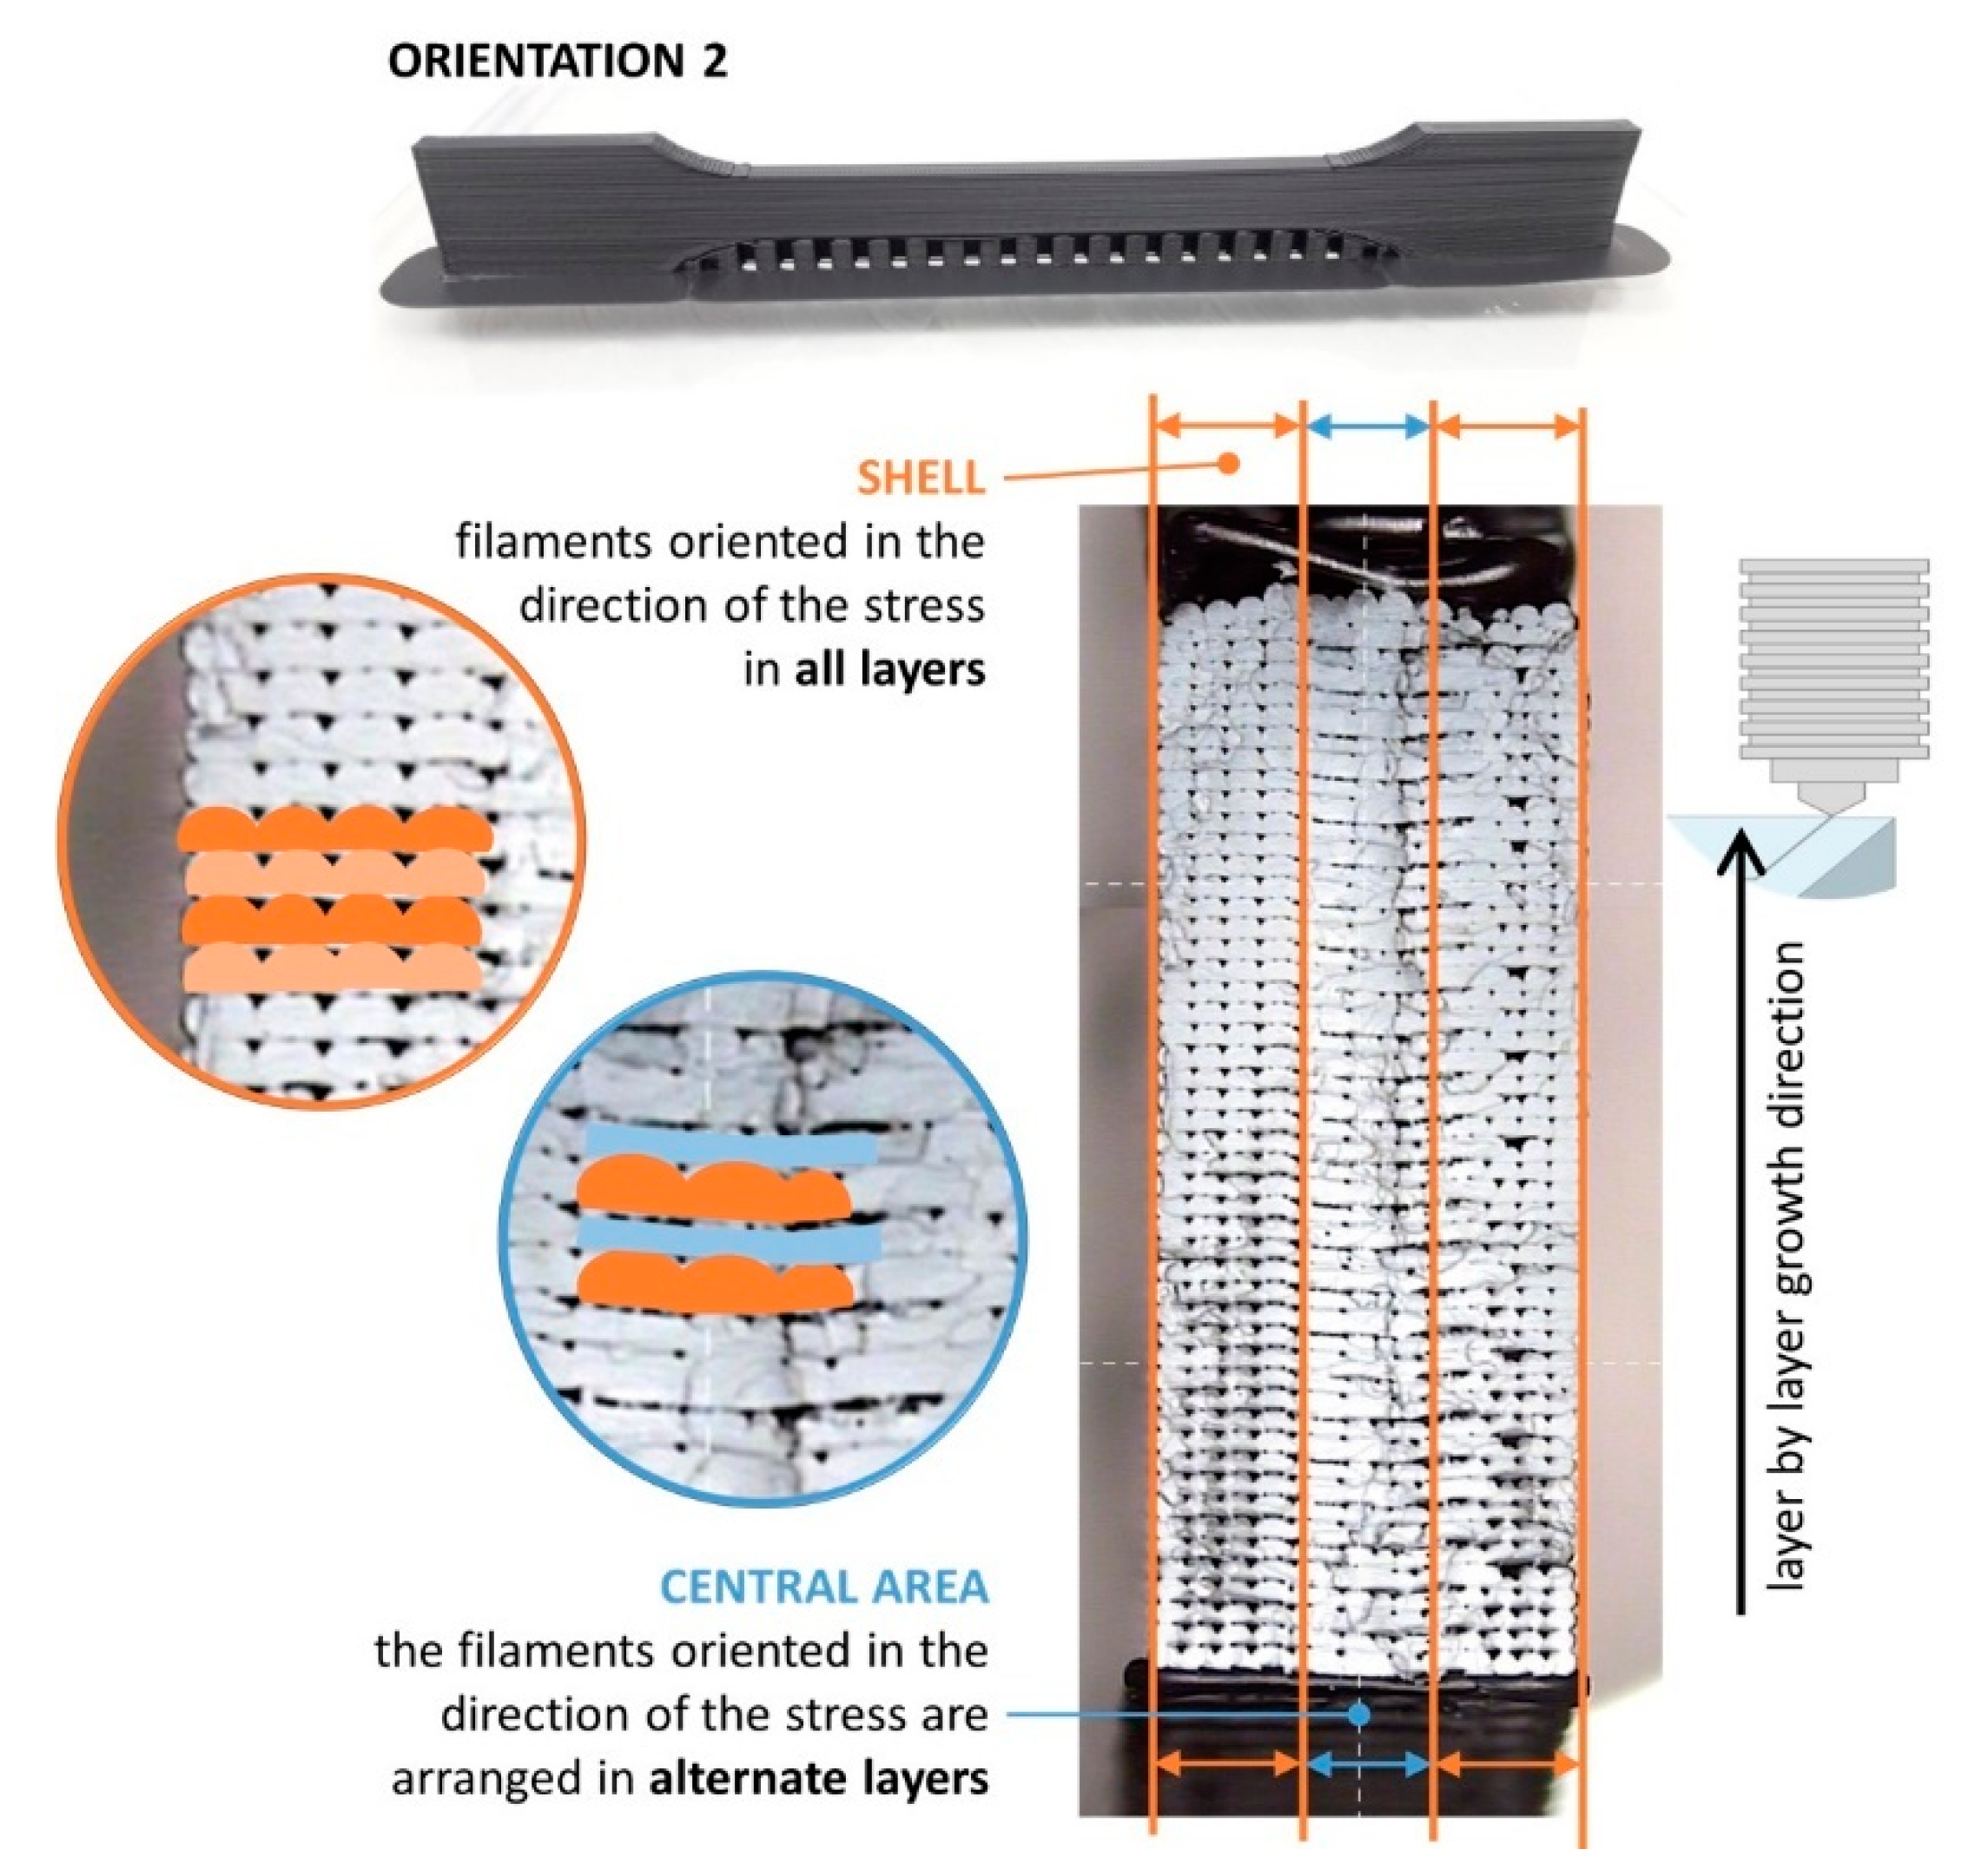
3.1. Mechanical Behavior of Solid Specimens
3.2. Comparative Analysis with Conventional Samples with Pattern Infill
4. Conclusions
Author Contributions
Funding
Acknowledgments
Conflicts of Interest
References
- Rodríguez-Panes, A.; Claver, J.; Camacho, A.M.; Sebastián, M.A. Análisis normativo y evaluación geométrica de probetas para la caracterización mecánica de piezas obtenidas por fabricación aditiva mediante FDM. In Actas del XXII Congreso Nacional de Ingeniería Mecánica; Pedrero, J.I., Ed.; UNED: Madrid, Spain, 2018. [Google Scholar]
- Popescu, D.; Zapciu, A.; Amza, C.; Baciu, F.; Marinescu, R. FDM process parameters influence over the mechanical properties of polymer specimens: A review. Polym. Test. 2018, 69, 157–166. [Google Scholar] [CrossRef]
- ISO 527-2:2012. Plastics-Determination of Tensile Properties-Part 2: Test Conditions for Moulding and Extrusion Plastics; International Organization for Standardization: Geneva, Switzerland, 2012. [Google Scholar]
- ASTM D638-14:2014. Standard Test Method for Tensile Properties of Plastics; ASTM International: West Conshohocken, PA, USA, 2014. [Google Scholar]
- ISO 17296-3:2014. Additive manufacturing-General Principles. Part 3: Main Characteristics and Corresponding Test Methods; International Organization for Standardization: Geneva, Switzerland, 2014. [Google Scholar]
- ISO/ASTM 52921:2013. Standard Terminology for Additive Manufacturing-Coordinate Systems and Test Methodologies; International Organization for Standardization: Geneva, Switzerland, 2013. [Google Scholar]
- AENOR/UNE 116005. Fabricación por adición de capas en materiales plásticos. Fabricación aditiva. Preparación de probetas; AENOR: Madrid, Spain, 2012. [Google Scholar]
- Ferro, C.G.; Brischetto, S.; Torre, R.; Maggiore, P. Characterization of ABS specimens produced via the 3D printing technology for drone structural components. Curved Layer. Struct. 2016, 3, 172–188. [Google Scholar] [CrossRef] [Green Version]
- Brischetto, S.; Ferro, C.G.; Maggiore, P.; Torre, R. Compression Tests of ABS Specimens for UAV Components Produced via the FDM Technique. Technologies 2017, 5, 20. [Google Scholar] [CrossRef] [Green Version]
- Banjanin, B.; Vladić, G.; Pál, M.; Baloš, S.; Dramićanin, M.; Rackov, M.; Kneţević, I. Consistency analysis of mechanical properties of elements produced by FDM additive manufacturing technology. Rev. Mater. 2018, 23, 4. [Google Scholar] [CrossRef]
- Chacón, J.M.; Caminero, M.A.; García-Plaza, E.; Núñez, P.J. Additive manufacturing of PLA structures using fused deposition modelling: Effect of process parameters on mechanical properties and their optimal selection. Mater. Des. 2017, 124, 143–157. [Google Scholar] [CrossRef]
- Tanikella, N.G.; Wittbrodt, B.; Pearce, J.M. Tensile strength of commercial polymer materials for fused filament fabrication 3D printing. Addit. Manuf. 2017, 15, 40–47. [Google Scholar] [CrossRef] [Green Version]
- Ćwikła, G.; Grabowik, C.; Kalinowski, K.; Paprocka, I.; Ociepka, P. The influence of printing parameters on selected mechanical properties of FDM/FFF 3D-printed parts. IOP Conf. Ser. Mater. Sci. Eng. 2017, 227, 1–11. [Google Scholar] [CrossRef]
- Kuznetsov, V.; Solonin, A.; Urzhumtsev, O.; Schilling, R.; Tavitov, A. Strength of PLA components fabricated with fused deposition technology using a desktop 3D printer as a function of geometrical parameters of the process. Polymers 2018, 10, 313. [Google Scholar] [CrossRef] [Green Version]
- Rajpurohit, S.R.; Dave, H.K. Analysis of tensile strength of a fused filament fabricated PLA part using an open-source 3D printer. Int. J. Adv. Manuf. Technol. 2019, 101, 1525–1536. [Google Scholar] [CrossRef]
- Zaldivar, R.J.; Witkin, D.B.; McLouth, T.; Patel, D.N.; Schmitt, K.; Nokes, J.P. Influence of processing and orientation print effects on the mechanical and thermal behavior of 3D-Printed ULTEM 9085 Material. Addit. Manuf. 2017, 13, 71–80. [Google Scholar] [CrossRef]
- García-Domínguez, A.; Claver-Gil, J.; Sebastián, M.A. Proposals for the optimization of pieces produced by additive manufacturing. Dyna 2018, 94, 293–300. [Google Scholar] [CrossRef] [Green Version]
- García-Domínguez, A. Metodología para la optimización de piezas producidas por fabricación aditiva en estrategias de mass customization (unpublished Doctoral Dissertation). Ph.D. Thesis, Universidad Nacional de Educación a Distancia (UNED), Madrid, Spain, 2019. [Google Scholar]
- Chen, W.; Zheng, X.; Liu, S. Finite-element-mesh based method for modeling and optimization of lattice structures for additive manufacturing. Materials 2018, 11, 2073. [Google Scholar] [CrossRef] [PubMed] [Green Version]
- Hussein, A.Y. The Development of Lightweight Cellular Structures for Metal Additive Manufacturing. Ph.D. Thesis, University of Exeter, Devon, UK, 2013. [Google Scholar]
- Mahmoud, D.; Elbestawi, M. Lattice Structures and Functionally Graded Materials Applications in Additive Manufacturing of Orthopedic Implants: A Review. J. Manuf. Mater. Process. 2017, 1, 13. [Google Scholar] [CrossRef]
- Maliaris, G.; Sarafis, E. Mechanical behavior of 3D printed stochastic lattice structures. In Proceedings of the 8th International Conference on Materials Structure and Micromechanics of Fracture, Brno, Czech Republic, 27–29 June 2016. [Google Scholar]
- Panda, B.N. Design and development of cellular structure for Additive Manufacturing. Master’s Thesis, Instituto Superior Técnico, Universidade de Lisboa, Lisbon, Portugal, 2015. [Google Scholar]
- Weeger, O.; Boddeti, N.; Yeung, S.; Kaijima, S.; Dunn, M.L. Digital Design and Manufacture of Soft Lattice Structures. Addit. Manuf. 2019, 25, 39–49. [Google Scholar] [CrossRef]
- Vannutelli, R. Mechanical Behavior of 3D Printed Lattice-Structured Materials. Master’s Thesis, Youngstown State University, Youngstown, OH, USA, 2017. [Google Scholar]
- Rodríguez-Panes, A.; Claver, J.; Camacho, A. The Influence of Manufacturing Parameters on the Mechanical Behaviour of PLA and ABS Pieces Manufactured by FDM: A Comparative Analysis. Materials 2018, 11, 1333. [Google Scholar] [CrossRef] [PubMed] [Green Version]
- Masood, S.H.; Mau, K.; Song, W. Tensile properties of processed fdm polycarbonate material. Mater. Sci. Forum 2010, 654–656, 2556–2559. [Google Scholar] [CrossRef]
- Wu, W.; Geng, P.; Li, G.; Zhao, D.; Zhang, H.; Zhao, J. Influence of Layer Thickness and Raster Angle on the Mechanical Properties of 3D-Printed PEEK and a Comparative Mechanical Study between PEEK and ABS. Materials 2015, 8, 5834–5846. [Google Scholar] [CrossRef]
- Aliheidari, N.; Tripuraneni, R.; Ameli, A.; Nadimpalli, S. Fracture resistance measurement of fused deposition modeling 3D printed polymers. Polym. Test. 2017, 60, 94–101. [Google Scholar] [CrossRef]
- Ziemian, C.; Sharma, M.; Ziemian, S. Anisotropic mechanical properties of ABS parts fabricated by fused deposition modelling. In Mechanical Engineering; Murat, G., Ed.; IntechOpen: Rijeka, Croatia, 2012; pp. 159–180. ISBN 978-953-51-0505-3. [Google Scholar]
- Chacón, J.M.; Caminero, M.A.; Núñez, P.J.; García-Plaza, E.; García-Moreno, I.; Reverte, J.M. Additive manufacturing of continuous fibre reinforced thermoplastic composites using fused deposition modelling: Effect of process parameters on mechanical properties. Compos. Sci. Technol. 2019, 181, 107688. [Google Scholar] [CrossRef]
- Li, J.; Yang, S.; Li, D.; Chalivendra, V. Numerical and experimental studies of additively manufactured polymers for enhanced fracture properties. Eng. Fract. Mech. 2018, 204, 557–569. [Google Scholar] [CrossRef]
- Tymrak, B.M.; Kreiger, M.; Pearce, J.M. Mechanical properties of components fabricated with open-source 3-D printers under realistic environmental conditions. Mater. Des. 2014, 58, 242–246. [Google Scholar] [CrossRef]


| Material (Manufacturer) | Color | Tensile Strength (MPa) | Hardness, HB (MPa) | Modulus of Elasticity (GPa) | Density (kg/m3) |
|---|---|---|---|---|---|
| ABS (BCN3D) | Black | 45 | 97 | 2.3 | 1040 |
| Characteristic | Value |
|---|---|
| Maximum printing volume (mm3) | 210(x) × 297(y) × 210(z) |
| Firmware | BCN3D Sigma – Marlin |
| Nozzle diameter (mm) | 0.3 mm/0.4 mm (Standard)/0.5 mm (Special)/0.6 mm/0.8 mm/1.0 mm |
| Resolution (mm) | 0.05–0.5 |
| Maximum printing velocity (mm/s) | 50 |
| Maximum displacement velocity (mm/s) | 200 |
| Material | Extruder Temp. (°C) | Bed Temp. (°C) | Wall/Infill Speed (mm/s) | Layer Height (mm) | Adhesion Platform | Retraction Dist. (mm)/Speed (mm/s) | Wall/Infill Pattern |
|---|---|---|---|---|---|---|---|
| ABS (BCN3D) | 260 | 90 | 50 | 0.1 | YES (8 mm) | 4/40 | Solid |
| Standard | Orientation 1 | Orientation 2 |
|---|---|---|
| UNE 116005:2012 | 1 PROB ABS BK 1 | 3 PROB ABS BK 1 |
| 1 PROB ABS BK 2 | 3 PROB ABS BK 2 | |
| 1 PROB ABS BK 3 | 3 PROB ABS BK 3 | |
| 1 PROB ABS BK 4 | 3 PROB ABS BK 4 | |
| 1 PROB ABS BK 5 | 3 PROB ABS BK 5 | |
| ASTM D638–14:2014 | ASTM_D638_PROB1_1 | ASTM_D638_PROB2_1 |
| ASTM_D638_PROB1_2 | ASTM_D638_PROB2_2 | |
| ASTM_D638_PROB1_3 | ASTM_D638_PROB2_3 | |
| ASTM_D638_PROB1_4 | ASTM_D638_PROB2_4 | |
| ASTM_D638_PROB1_5 | ASTM_D638_PROB2_5 |
| Nomenclature | Layer Height (mm) | Orientation | Infill (%) |
|---|---|---|---|
| S1 | 0.1 | 1 | 20 |
| S2 | 0.1 | 1 | 50 |
| S3 | 0.1 | 2 | 20 |
| Group | Nomenclature | εt (%) Mean (Standard Deviation) | σy (MPa) Mean (Standard Deviation) | σU (MPa) Mean (Standard Deviation) |
|---|---|---|---|---|
| UNE 116005:2012 (Orientation 1) | UNE-O1 | 5.89 (0.26) | 37.82 (0.66) | 37.82 (0.66) |
| UNE 116005:2012 (Orientation 2) | UNE–O2 | 7.05 (0.11) | 39.65 (1.42) | 39.64 (1.42) |
| ASTM D638–14:2014 (Orientation 1) | ASTM–O1 | 9.87 (1.57) | 36.61 (1.42) | 33.38 (3.03) |
| ASTM D638–14:2014 (Orientation 2) | ASTM–O2 | 9.61 (0.86) | 43.00 (0.49) | 40.09 (2.38) |
| Group | Nomenclature | εt (%) | σy (MPa) | σU (MPa) |
|---|---|---|---|---|
| ASTM D638–14:2014 (Orientation 1) | ASTM–O1 | 9.87 | 36.61 | 33.38 |
| S1 | 5.09 | 26.56 | 25.83 | |
| S2 | 4.90 | 33.21 | 32.06 | |
| ASTM D638–14:2014 (Orientation 2) | ASTM–O2 | 9.61 | 43.00 | 40.09 |
| S3 | 4.54 | 24.38 | 24.38 |
© 2019 by the authors. Licensee MDPI, Basel, Switzerland. This article is an open access article distributed under the terms and conditions of the Creative Commons Attribution (CC BY) license (http://creativecommons.org/licenses/by/4.0/).
Share and Cite
García-Domínguez, A.; Claver, J.; Camacho, A.M.; Sebastián, M.A. Considerations on the Applicability of Test Methods for Mechanical Characterization of Materials Manufactured by FDM. Materials 2020, 13, 28. https://doi.org/10.3390/ma13010028
García-Domínguez A, Claver J, Camacho AM, Sebastián MA. Considerations on the Applicability of Test Methods for Mechanical Characterization of Materials Manufactured by FDM. Materials. 2020; 13(1):28. https://doi.org/10.3390/ma13010028
Chicago/Turabian StyleGarcía-Domínguez, Amabel, Juan Claver, Ana María Camacho, and Miguel A. Sebastián. 2020. "Considerations on the Applicability of Test Methods for Mechanical Characterization of Materials Manufactured by FDM" Materials 13, no. 1: 28. https://doi.org/10.3390/ma13010028