Article

Preparation of Mesoporous Mn–Ce–Ti–O Aerogels by a One-Pot Sol–Gel Method for Selective Catalytic Reduction of NO with NH3

1
School of Materials Science and Engineering, Shanghai Institute of Technology, Shanghai 201418, China
2
State Key Laboratory of Chemical Engineering, East China University of Science and Technology, Shanghai 200237, China
*
Authors to whom correspondence should be addressed.
Materials 2020, 13(2), 475; https://doi.org/10.3390/ma13020475
Submission received: 12 December 2019 / Revised: 8 January 2020 / Accepted: 14 January 2020 / Published: 19 January 2020
(This article belongs to the Special Issue Heterogeneous Catalysts Synthesis and Characterization)

Abstract

:
Novel Mn–Ce–Ti–O composite aerogels with large mesopore size were prepared via a one-pot sol–gel method by using propylene oxide as a network gel inducer and ethyl acetoacetate as a complexing agent. The effect of calcination temperature (400, 500, 600, and 700 °C) on the NH3–selective catalytic reduction (SCR) performance of the obtained Mn–Ce–Ti–O composite aerogels was investigated. The results show that the Mn–Ce–Ti–O catalyst calcined at 600 °C exhibits the highest NH3–SCR activity and lowest apparent activation energy due to its most abundant Lewis acid sites and best reducibility. The NO conversion of the MCTO-600 catalyst maintains 100% at 200 °C in the presence of 100 ppm SO2, showing the superior resistance to SO2 poisoning as compared with the MnOx–CeO2–TiO2 catalysts reported the literature. This should be mainly attributed to its large mesopore sizes with an average pore size of 32 nm and abundant Lewis acid sites. The former fact facilitates the decomposition of NH4HSO4, and the latter fact reduces vapor pressure of NH3. The NH3–SCR process on the MCTO-600 catalyst follows both the Eley–Rideal (E–R) mechanism and the Langmuir–Hinshelwood (L–H) mechanism.

Graphical Abstract

1. Introduction

Nitrogen oxides (NOx), as major air pollutants from the combustion of fossil fuels, cause serious environmental problems, such as acid rain, photochemical smog, and ozone depletion [1,2]. At present, many denitration technologies have been developed to remove NOx to meet stringent legislation requirements, such as selective catalytic reduction (SCR) [1,2,3,4,5,6], selective non-catalytic reduction (SNCR) [7], and absorption [8], among which the selective catalytic reduction with NH3 (NH3–SCR) is one of the most promising approaches for NOx removal owing to its high denitration efficiency and relatively low cost. Vanadium–titanium catalysts are the most commonly used catalysts currently in industry to remove NOx from stationary sources, including V2O5–WO3/TiO2 and V2O5–WO3(MoO3)/TiO2 [9,10,11,12]. However, to satisfy the working conditions of the V-based catalysts, the current SCR denitration device has to be installed upstream of the electrostatic precipitator and the desulfurization device to avoid the deactivation of catalysts by high-concentration fly ash, alkali metals, and SO2 [13], to increase the life time of the catalysts and to reduce the operating costs of denitration. In addition, the V-based catalysts have some inevitable disadvantages, such as the toxicity of VOx, a narrow operating temperature window (300–400 °C), and a low N2 selectivity [6,14,15]. Therefore, it is of great practical importance to develop catalysts with high catalytic activity and good SO2 resistance under low-temperature conditions (<200 °C).
The MnOx–based catalysts have been considered as promising candidates for NO removal by the NH3–SCR method owing to their inherent environmentally benign nature and superior catalytic activity [13,14,15,16,17,18,19,20,21]. As an additive, CeO2 can further enhance the catalytic activity of MnOx in the low temperature range because of its unique oxygen storage capacity and redox performance [22,23]. In addition, CeO2 can enhance the SO2 tolerance of MnOx–based catalysts, because CeO2 can preferentially react with SO2 to reduce the sulfation of MnOx at the expense of the active CeO2 component [24]. Extensive efforts have also been made to further improve the SO2 resistance of MnOx–CeO2 catalysts, such as inhibiting the SO2 adsorption/oxidation and enhancing the adsorption of active intermediate species by introducing functional promoters [25]. Due to the relatively weak interaction between TiO2 and SO2, TiO2 can act as a protective constituent to inhibit the adsorption of SO2; especially, the coating of a TiO2 shell on MnOx–CeO2 is demonstrated to be a good method to improve the SO2 resistance of the catalysts [1,26]. Moreover, modification with Co, Ni, Fe, and Zn can increase the formation of nitrate species and NO2 on the surface of the MnOx–CeO2 catalysts, thereby enhancing the SO2 resistance [4,13,27]. In addition, it is proved that the pore texture also plays an important role in SO2 resistance of the catalysts [28,29,30,31]. Soh et al. suggested that the increase of pore size and specific surface area for V2O5/Al2O3 catalysts can reduce the deactivation rate of active sites [29]. Similarly, Guo et al. investigated the SO2 tolerance of Fe2O3/SBA-15 catalysts with different pore sizes and found that the decomposition temperature of NH4HSO4 on the catalyst surface decreased by 40 °C when the pore size of the SBA-15 support increased from 4.8 to 11.8 nm, due to the fact that a larger pore size can produce a higher vapor pressure, thus facilitating the decomposition of NH4HSO4 [30]. Ma et al. also found that the hollow-structured CeO2–TiO2 catalyst exhibited a better SO2 resistance when it had a larger cavity [31].
At present, the MnOx–CeO2–TiO2 catalysts are prepared by several approaches, including the hydrothermal [26], sol–gel [24], wet impregnation [32] and co-precipitation methods [33], which show good low-temperature NH3–SCR performance. However, the catalytic activities in the presence of SO2 are still limited, probably due to their relatively small pore size. In this work, Mn–Ce–Ti–O composite aerogels with larger mesoporous pore sizes were prepared via a one-pot sol–gel method followed by calcination at different temperatures from 400 to 700 °C. The NH3–SCR catalytic activities with and without SO2 and H2O were investigated. The mechanisms were discussed based on the characterization results of X-ray diffraction (XRD), N2 adsorption, X-ray photoelectron spectroscopy (XPS), H2–temperature programmed reduction (H2–TPR), NH3–temperature programmed desorption (NH3–TPD), and in-situ diffuse reflectance infrared Fourier transform spectra (DRIFTS).

2. Materials and Methods

2.1. Catalyst Preparation

The Mn–Ce–Ti–O composite aerogel was prepared via a one-pot sol-gel method by using propylene oxide as a network gel inducer and ethyl acetoacetate as a complexing agent. The molar ratios of (Ti + Mn + Ce) to propylene oxide and ethyl acetoacetate were 1:5.5 and 1:0.3, respectively. Specific steps were as follows. Ethyl acetoacetate was added dropwise to 95 mL of anhydrous ethanol at a rate of 1 drop/s under magnetic stirring, and the mixed solution was put in an ice bath. Then, 0.1 mol of TiCl4 was added dropwise to the above solution by a syringe, and 0.04 mol of Mn(NO3)2 4H2O and 0.007 mol of Ce(NO3)3·6H2O were added with consecutive stirring until they were completely dissolved. Finally, propylene oxide was added dropwise under continuous stirring for 30 min to obtain a yellow transparent sol. The sol was poured into an ampule (30 mL), sealed, aged in a 30 °C water bath for 2 days, and then aged in a 70 °C water bath for 5 days to obtain a wet gel. The wet gel was subjected to solvent displacement with n-hexane for 12 h, followed by supercritical drying in n-hexane at 240 °C and 6.0 MPa for 1 h with a heating rate of 1 °C min−1·to obtain the precursor of Mn–Ce–Ti–O composite aerogel. The precursor aerogel was calcined at 400, 500, 600, and 700 °C for 3 h with a heating rate of 5 °C min−1, respectively, to obtain the Mn–Ce–Ti–O composite aerogels, which were denoted as MCTO-x, where x represents the calcination temperatures.

2.2. Catalyst Characterization

The thermal stability of the MCTO-0 was tested by thermogravimetry-differential scanning calorimetry (TG–DSC) on a Netzsch STA 449 analyzer under air from room temperature to 800 °C with a heating rate of 10 °C min−1. The XRD patterns of samples were examined on a D/max 2200PC diffractometer using Cu Kα radiation as the source (λ = 0.15406 nm) with a 2θ range of 5–80° at a scan rate of 8°·min−1. The N2 adsorption-desorption curves were tested to analyze the specific surface area and pore texture of the samples at 77 K on a Micrometrics ASAP 2020 apparatus. Prior to each test, the samples were degassed at 200 °C for 12 h under vacuum. The specific surface area was calculated using the Brunauer–Emmett–Teller (BET) equation, and the pore size distribution and pore volume were calculated based on the density function theory (DFT) model. The morphology of samples was observed by scanning electron microscopy (SEM) with a FEI Quanta 200 FEG microscope. The XPS spectra of the samples were obtained on a Thermo Fisher Scientific ESCALAB 250Xi system using Al Kα as the radiation source at 300 W under ultrahigh vacuum (8 × 10⁻⁸ Pa). The C1s peak (284.8 eV) was used as a standard to calibrate the precise binding energy of Mn 2p, Ce 3d, Ti 2p, and O 1s. The H2–TPR and NH3–TPD experiments were performed on a Micrometrics AutoChem II 2920 instrument; 100 mg of samples were firstly pretreated at 200 °C for 1 h in an Ar atmosphere with a total flow rate of 30 mL·min−1, and then cooled to 50 °C. For H2–TPR, the pretreated catalysts were heated to 800 °C in a 10 vol. % H2/Ar mixture gas (30 mL·min−1) at a heating rate of 10 °C min−1. The H2 consumption of the reduction process was recorded by a thermal conductivity detector (TCD). For NH3–TPD, the pretreated samples were placed in a mixture gas of NH3/Ar (10 vol. % of NH3) with a total flow rate of 50 mL·min−1 for 1 h until saturation to ensure a sufficient adsorption of NH3 on the catalyst surfaces. Then pure N2 was blown in for 30 min to remove the non-adsorbed NH3. Finally, the samples were placed in an He atmosphere with a flow rate of 50 mL·min−1 to carry out NH3 desorption at a heating rate of 10 °C min−1 from 50 °C to 800 °C to obtain the NH3–TPD curves. The in-situ DRIFTS were collected on an FTIR spectrometer (Thermo Fisher Nicolet iZ10) equipped with a smart collector and an MCT/A detector that was cooled by liquid nitrogen. Before each test, the catalysts were pretreated at 350 °C for 2 h under N2 with a flow rate of 50 mL·min−1 and cooled down to 200 °C. The background spectrum was collected in N2 atmosphere and automatically deducted from the sample spectrum. In the transient NH3–SCR performance experiment, the MCTO-600 catalyst was firstly exposed to 500 ppm of NH3 (or 500 ppm of NO + 5 vol. % O2) stream for 30 min at 200 °C, then purged with He for 30 min, and finally subjected to 500 ppm of NO + 5 vol. % O2 (or 500 ppm of NH3) to obtain the time-varying DRIFTS. All spectra were collected by accumulating 32 scans at a resolution of 4 cm−1.

2.3. Catalytic Activity Measurement

The NH3–SCR activity of catalysts was evaluated by a fixed-bed reactor (id: 7.5 mm), in which 0.5 mL of catalysts with 40–80 mesh was fixed by quartz sand (40–60 mesh) and glass wool. The feed-gas consisted of 500 ppm NO, 500 ppm NH3, 5 vol. % O2, 5 vol. % H2O (when used), 100 ppm SO2 (when used), and N2 balance, with a total flow rate of 120 mL·min−1, corresponding to the gas hourly space velocity (GHSV) of 14,400 h−1. The catalyst reaction temperature was controlled from 120 to 320 °C with a heating rate of 5 °C min−1 from 20 °C to the reaction temperatures and held for 30 min to reach a steady state for data collection. The concentrations of NO and NO2 were measured by the chemiluminescence method with an Eco Physics CLD 62s NO/NOx analyzer, and the concentration of N2O was detected by gas chromatography using a Techcomp GC 7900 apparatus.
The NO conversion (x) and the N2 selectivity (S) were calculated using the Equations (1) and (2), respectively [6,9].
x = [ N O ] i n [ N O ] o u t [ N O ] o u t × 100 %
S = ( 1 [ N 2 O ] o u t [ N O x ] i n [ N O x ] o u t ) × 100 %
where [NO]insignifies the inlet concentration of NO, [NO]out stands for the outlet concentration of NO, and [N2O]out is the outlet concentration of N2O.
In addition, in order to better evaluate the catalytic activity of Mn–Ce–Ti–O aerogels, a steady state kinetics investigation on these catalysts was conducted. The calculation of the reaction rate constant K (cm3·g−1·s−1) is based on the assumption that [NH3] is a zero-order reaction and [NO] is a first-order reaction [2,34]. The K is calculated by the Equation (3):
K = V ln ( 1 x ) w
where K is the reaction rate constant (cm3·g−1·s−1), V means the total flow rate (mL·min−1) of the simulated flue gas, w represents the mass (g) of the catalyst, and x is the NO conversion. The apparent activation energy could be obtained by using the Arrhenius equation, as given by Equation (4) as follows:
K   =   K 0 e E a R T
where Ea represents the apparent activation energy of catalysts, which could be calculated from the slope of the ln(K) versus 1000/T curves.
To compare the intrinsic activity of the catalysts at different calcination temperatures, turnover frequency (TOF) was calculated using Equation (5) [14,35]. TOF represents the number of NO conversion at a single active site (Mn atom) per unit time; its value is a measure of the catalytic reaction rate on a catalyst. In general, the calculation of TOF requires the conversion of a reactant to be at a relatively low level (<15%) [36,37]. Reaction conditions were as follows: T = 160, 180, 200, or 220 °C, 500 ppm of NO, 500 ppm of NH3, 5 vol. % of O2, balance N2, total flow rate = 240 mL·min−1, GHSV ≈ 200,000 h−1.
T O F = ( P V R T ) x w × β M n M M n
where P, V, R, T, x, w, βMn, and MMn represents the standard atmospheric pressure (101 KPa), the NO flow rate (0.12 mL·min−1), the gas constant (8.314 J·mol−1·K−1), the reaction temperature (K), the NO conversion at each temperature, the mass of the catalyst (0.02 g), the atomic percentage of Mn on the surface of the catalyst by XPS, and the relative atomic mass of Mn (54.94 g·mol−1), respectively.

3. Results and Discussion

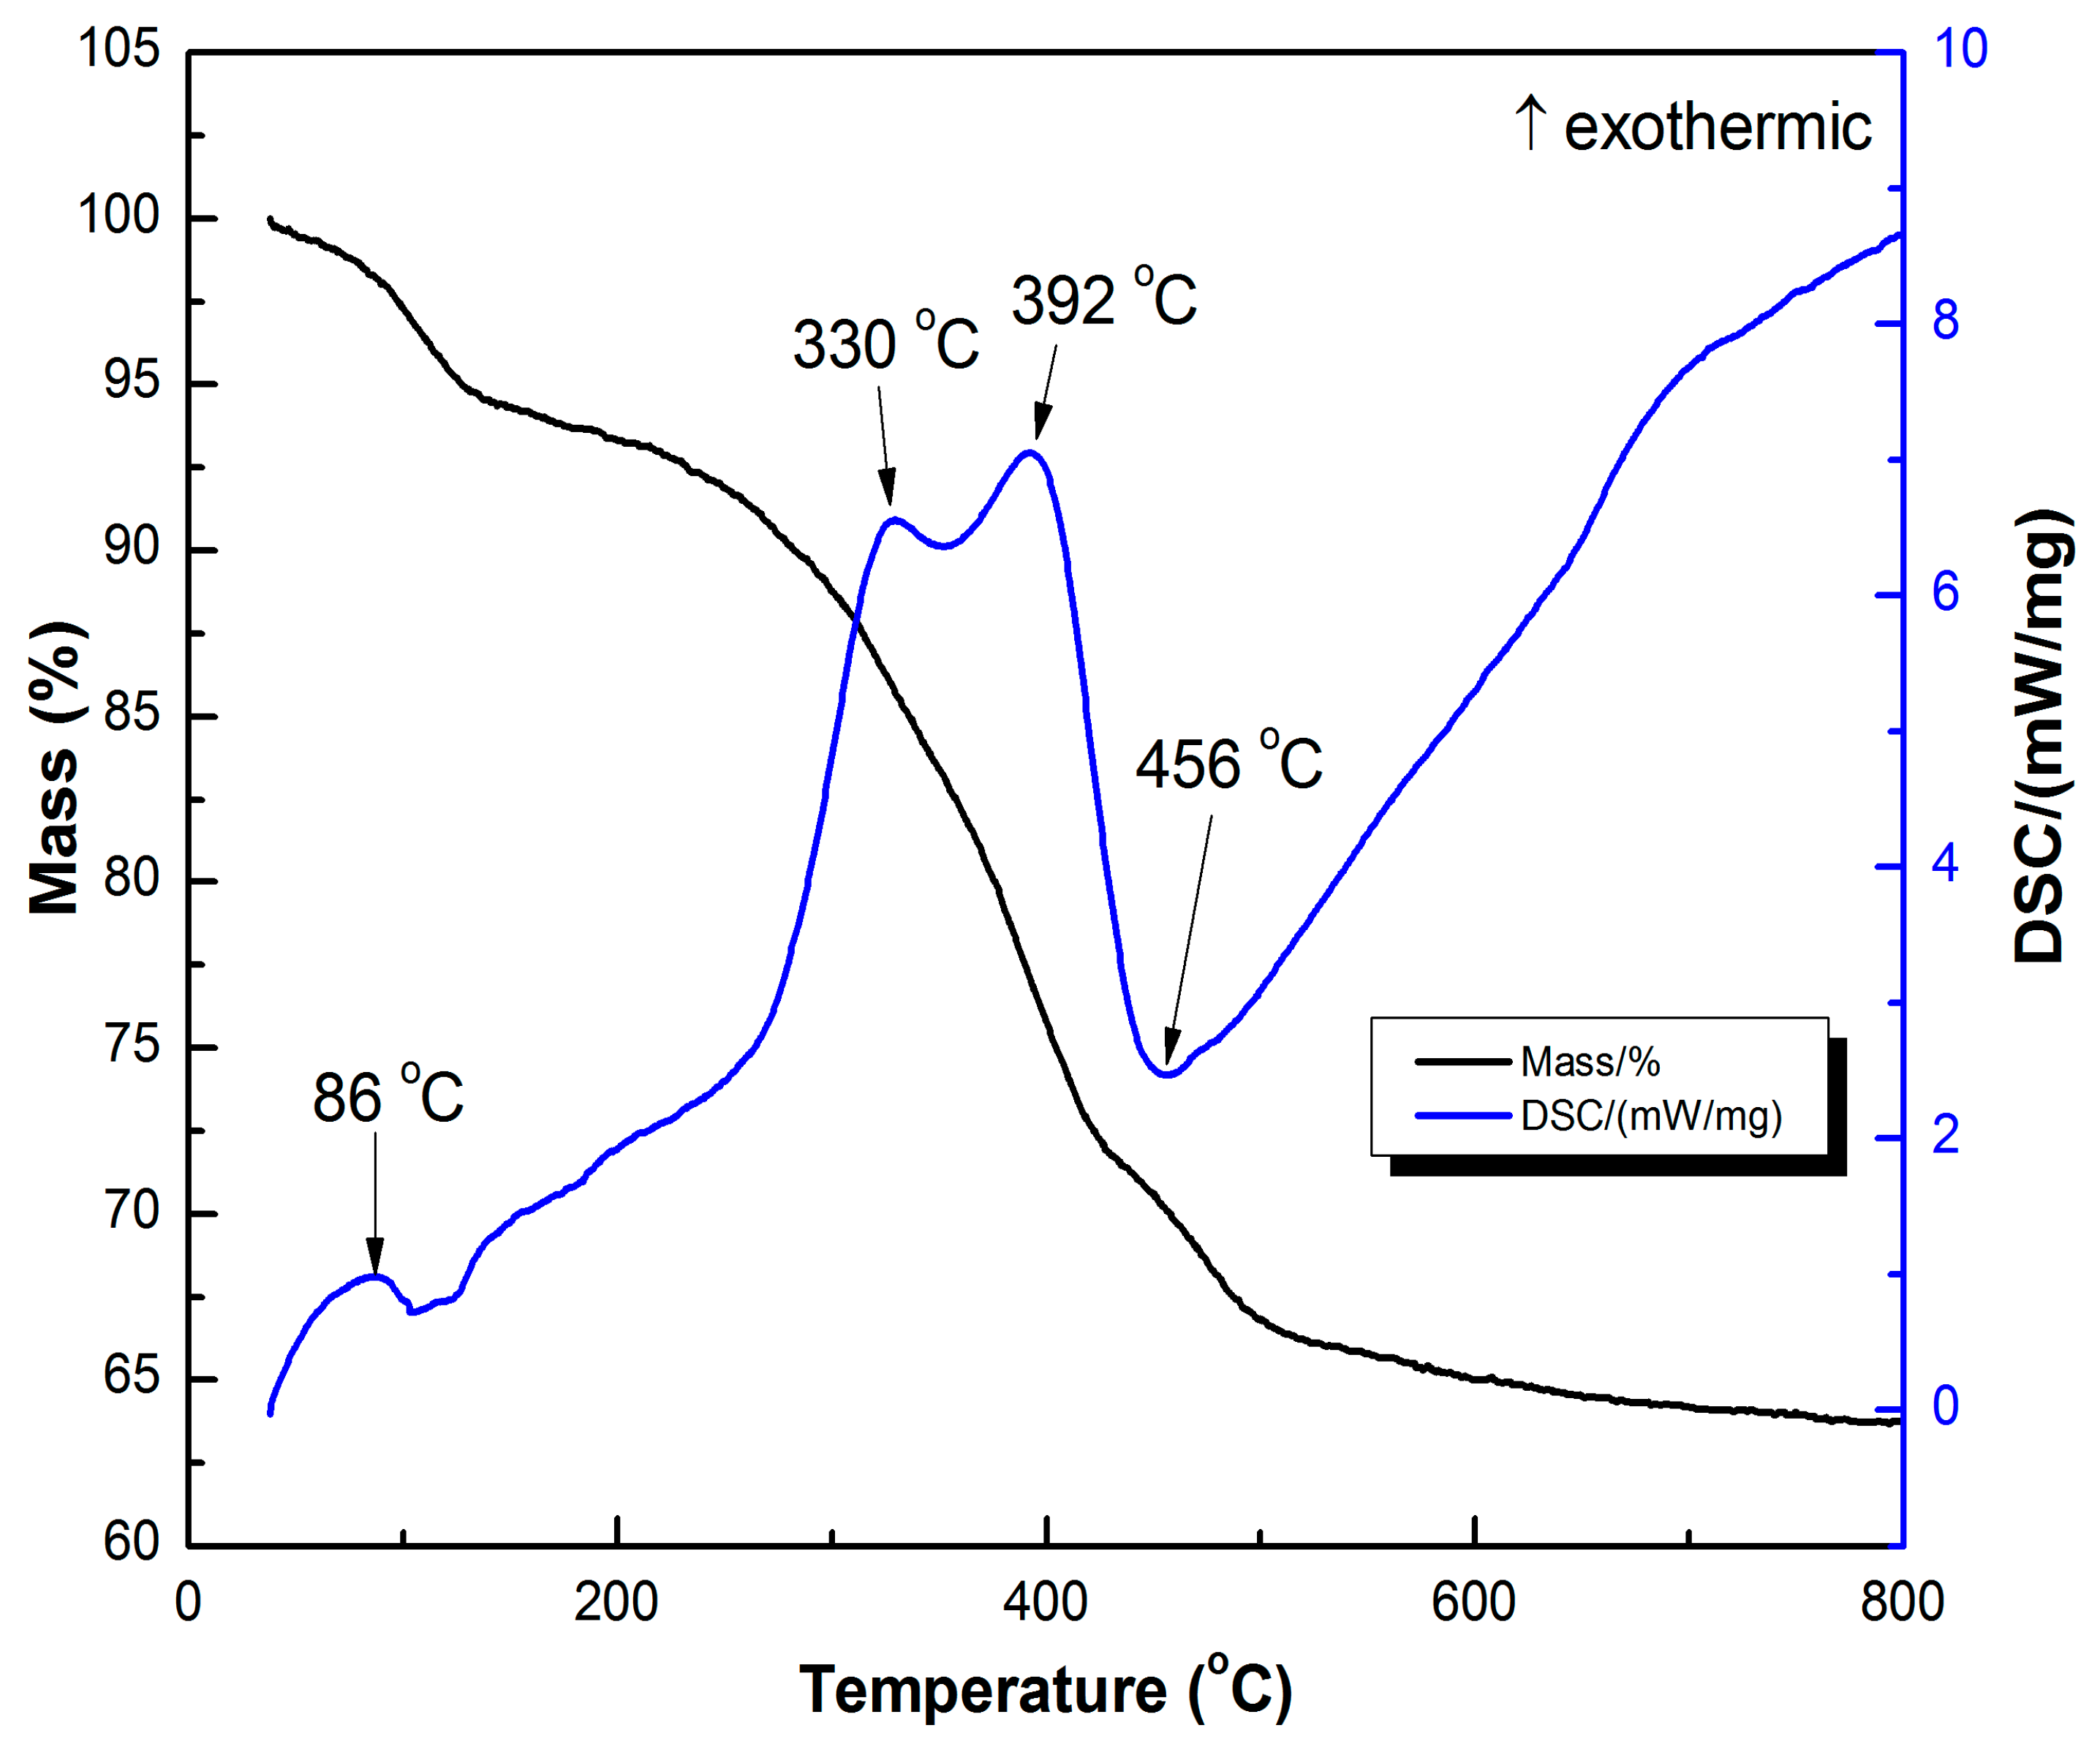
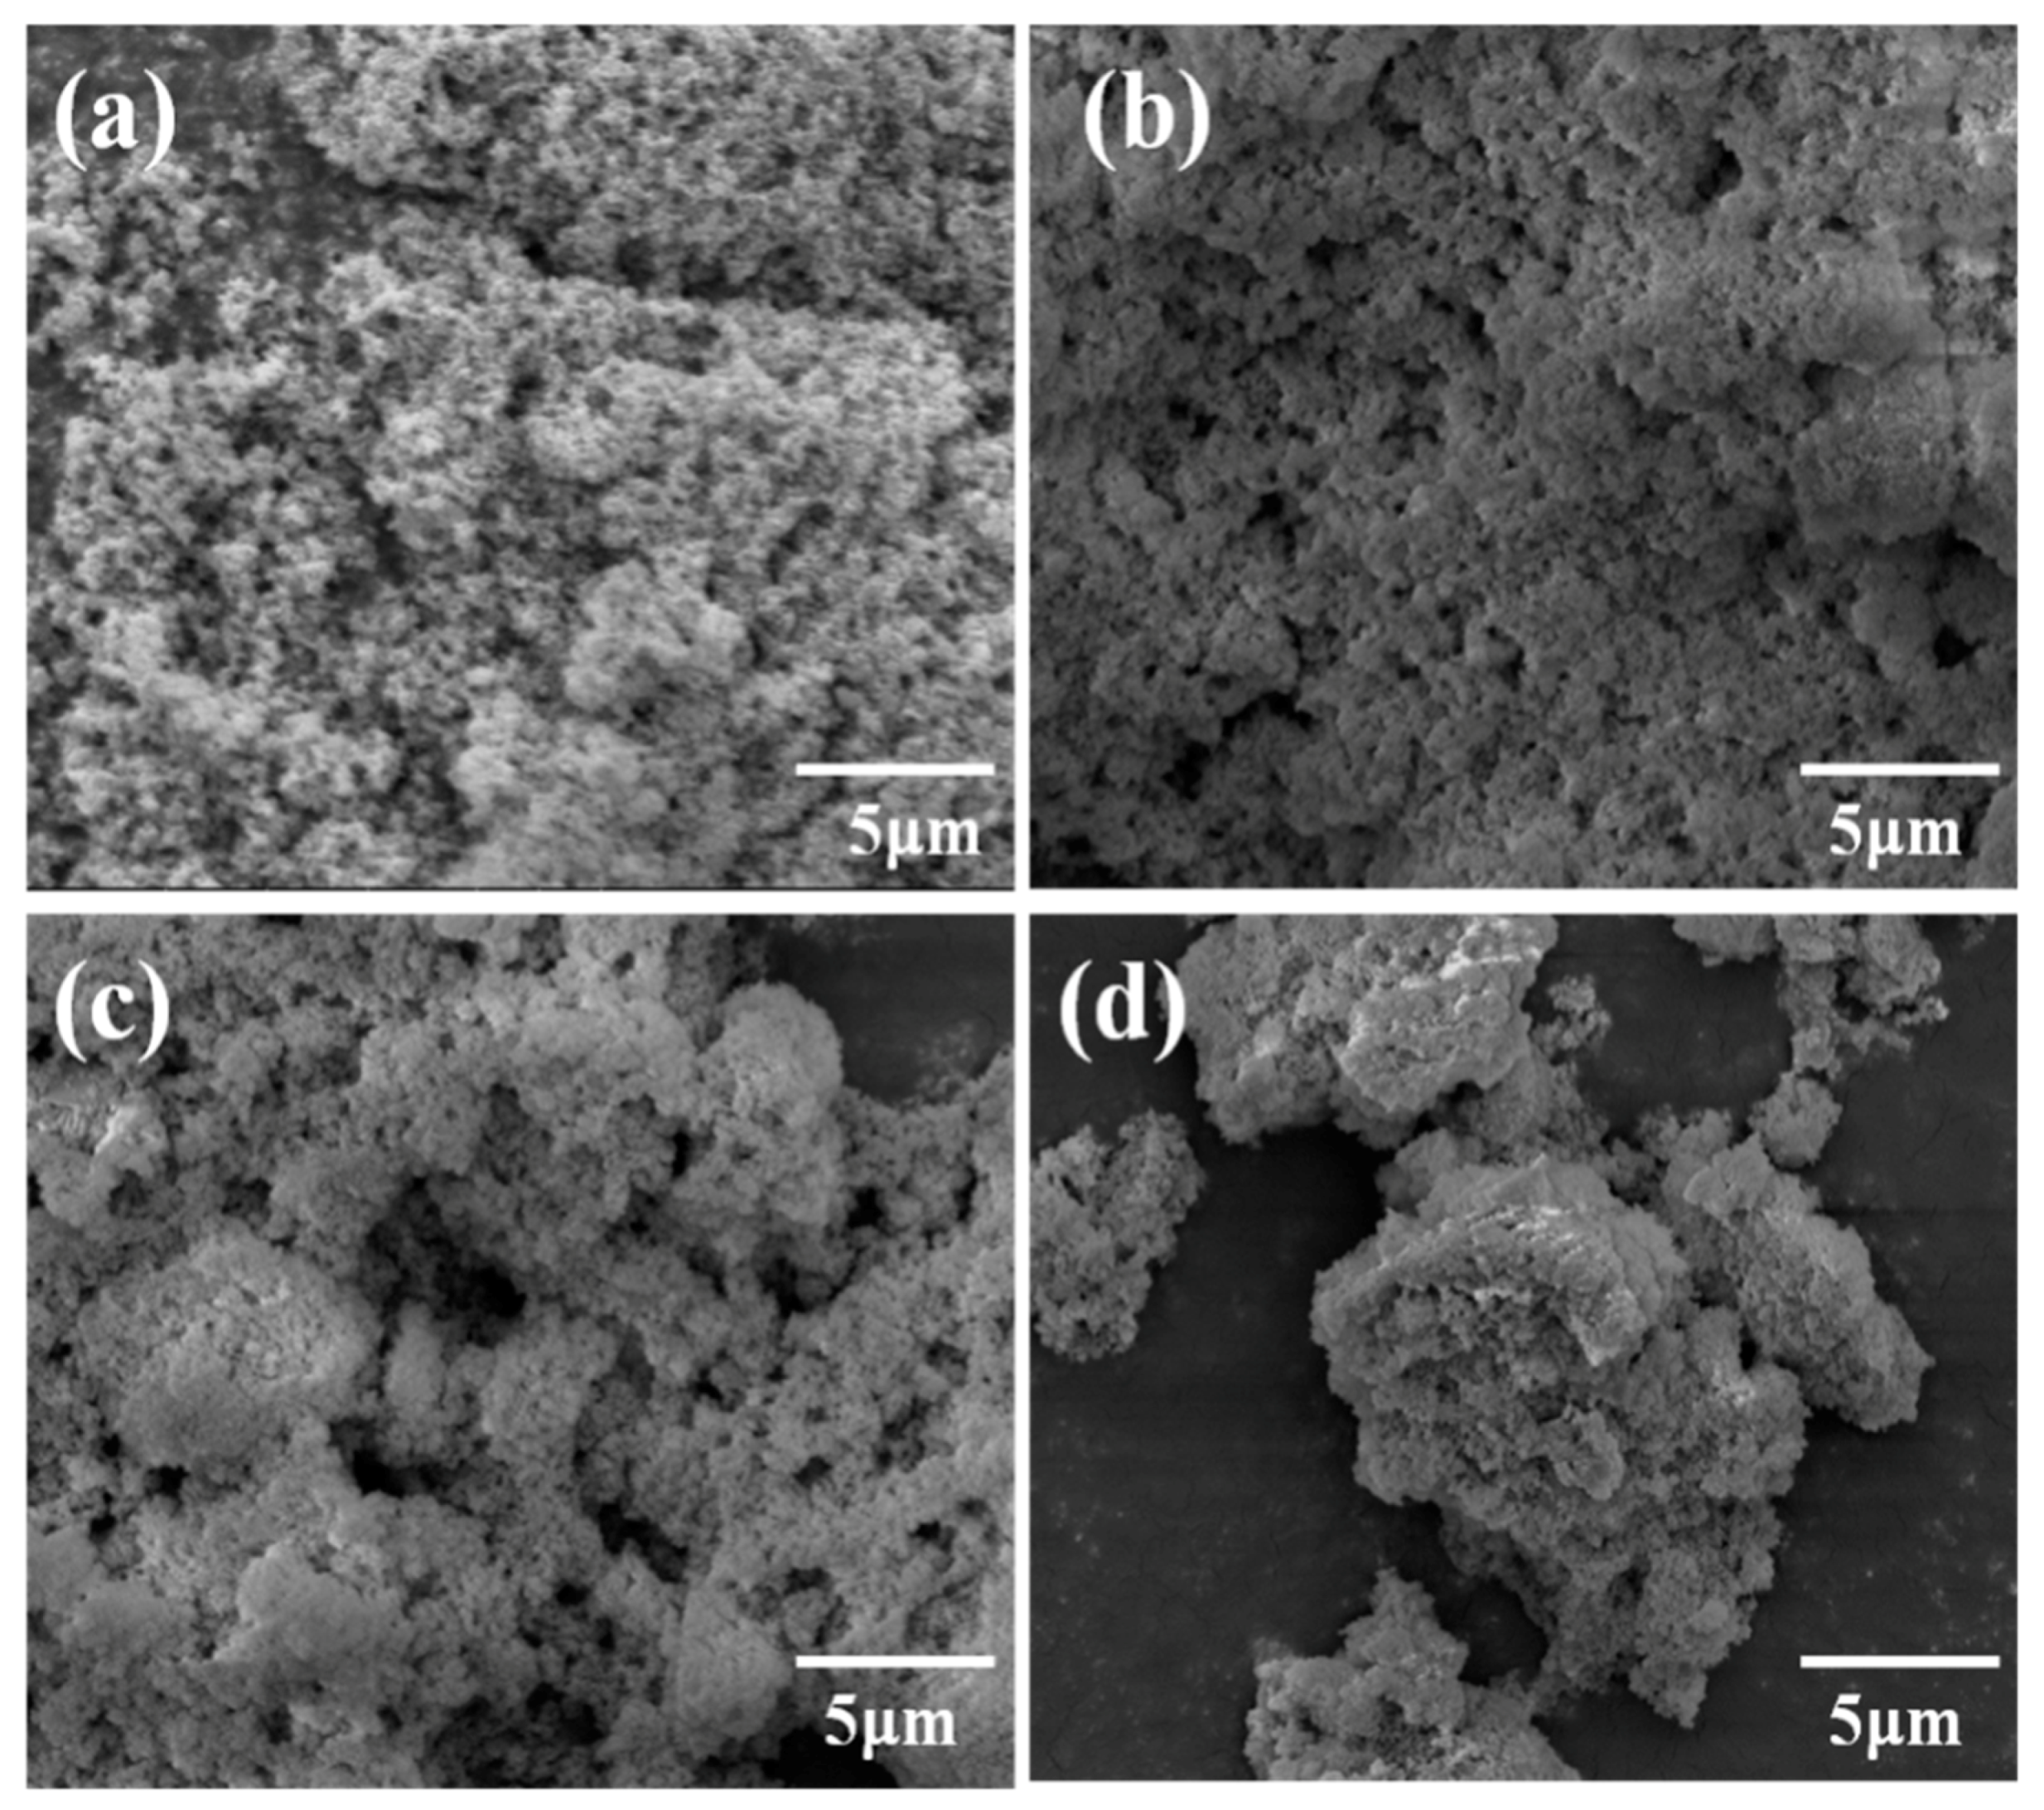
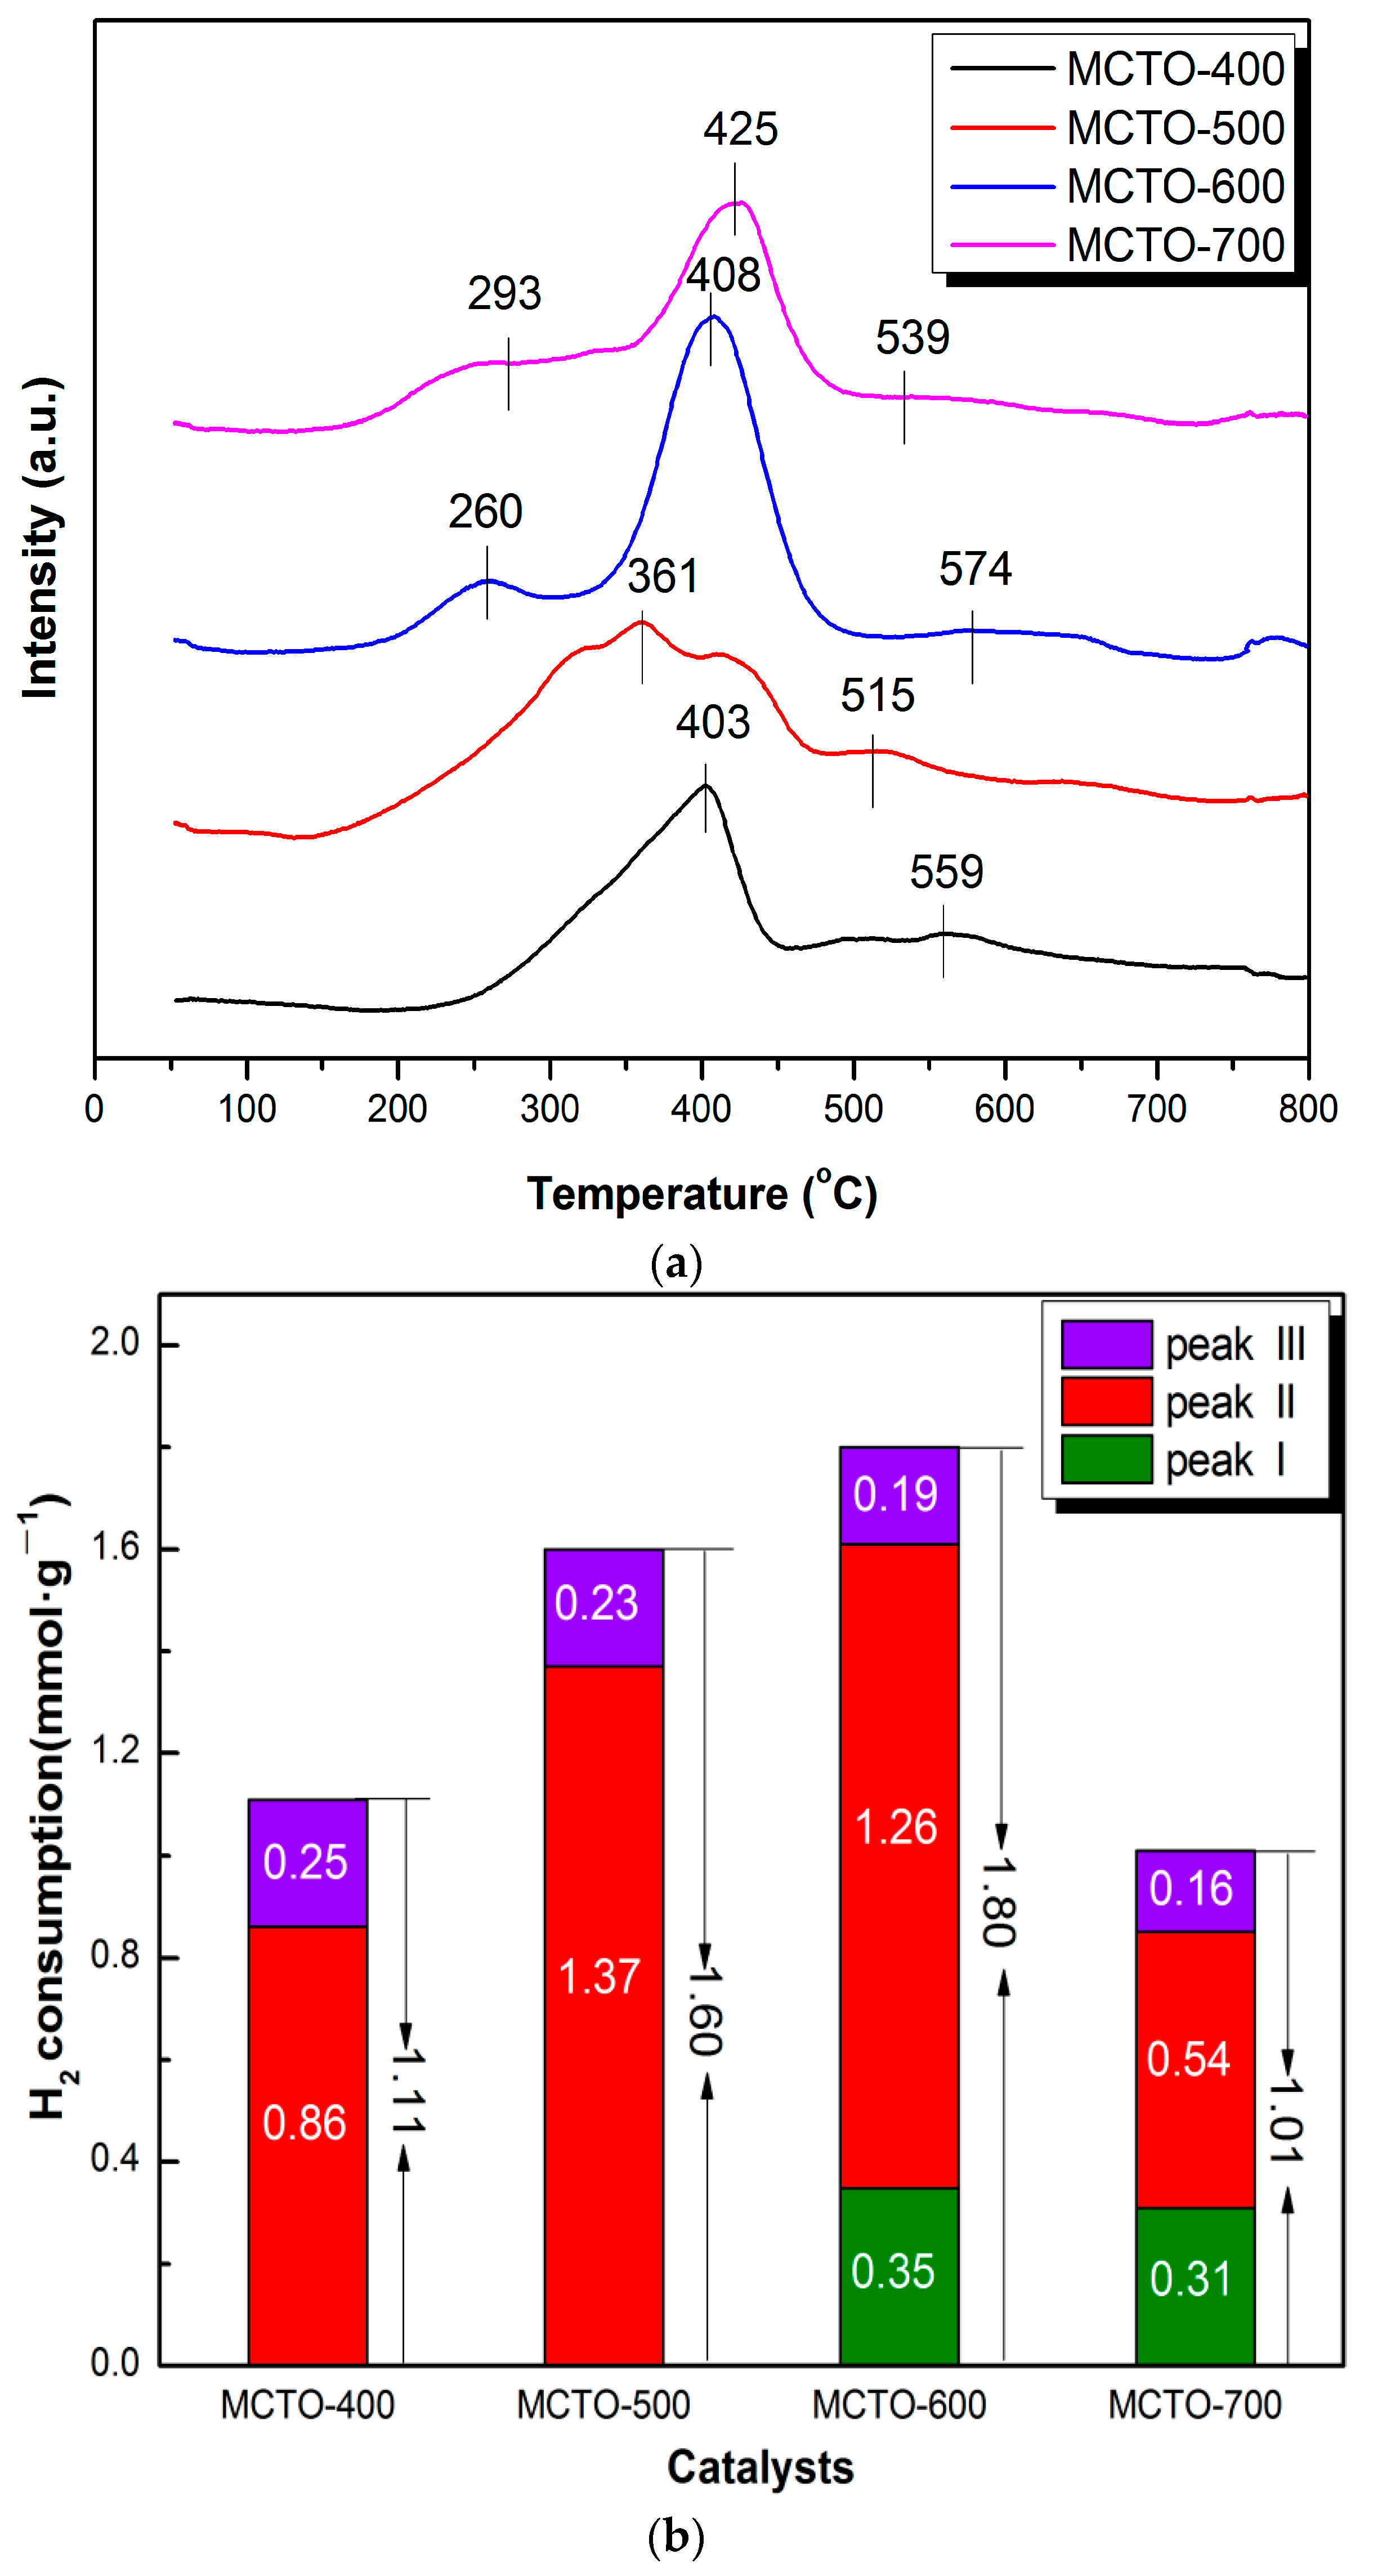
3.1. Catalyst Characterization

The TG–DSC curve of the MCTO-0 aerogel under air was tested to study its thermal decomposition behavior, which contained three mass loss stages, as shown in Figure 1. The first mass loss stage below 120 °C with an exothermic peak at 86 °C was due to the desorption of adsorbed water. The second mass loss stage in the range of 120–400 °C with two exothermic peaks at 330 °C and 392 °C was detected, which could be attributed to the removal of organic matter and the decomposition of metal oxide precursor. In addition, an endothermic peak at 456 °C was observed for the third mass loss step from 400 to 600 °C. There were mass loss and mass gain involved at this step. The former was caused by carbon burn-off in the temperature range of 400–600 °C, which was 8.2 wt % (from XPS results), and the latter was from the oxidation of Mn3O4 to Mn2O3 (2Mn3O4 + 1/2O2 = 3Mn2O3), which was 3.5 wt %. Therefore, a mass loss was observed at this step.
The XRD patterns of the MCTO-0, MCTO-400, MCTO-500, MCTO-600, and MCTO-700 are shown in Figure 2. The diffraction peaks at 25.3°, 37.8°, 38.6°, 48.1°, 51.0°, 55.1°, 62.7°, 68.9°, 70.3°, and 75.3° were observed for MCTO-0 sample, which were attributed to anatase TiO2 (JCPDS 21-1272) [11]. The characteristic peaks of the Mn3O4 phase (JCPDS 24-0734) at 28.9°, 32.3°, 38.0°, and 59.8° and the Mn2O3 phase (JCPDS 33-0900) at 32.3°, 35.6°, and 62.3° were detected for the calcined products [38]. In addition, the diffraction peaks for the CeO2 phase with a cubic fluorite structure (JCPDS 34-0394) at 28.8°, 48.2°, and 56.7° appeared for samples MCTO-600 and MCTO-700 [4]. The mean crystallite sizes of the above different phases were calculated using the Scherrer formula, as shown in Table 1; it could be seen that the increase of calcination temperature resulted in the gradual increase in crystallite sizes for the above metal oxides. Significantly, according to the results of below XPS and H2–TPR, MnO2 species were found on the surface of all samples. However, one could not see any standard peaks ascribed to MnO2 in XRD patterns, suggesting that they were highly dispersed on the catalyst surface, which could be beneficial to the NH3–SCR activity.
To gain insight into the pore structure of the obtained catalysts, the N2 adsorption-desorption isotherms of the catalysts were examined, as shown in Figure 3a. All the isotherms exhibited a typical IV-type curve with an H3 hysteresis loop, suggesting the existence of mesoporous pores [39]. In addition, a high nitrogen uptake at high relative pressure over 0.95 was observed for all the samples, indicating the existence of macropores [40], in accordance with the bimodal pore size distributions displayed in Figure 3b. The smaller pores may have been formed by the primary nanoparticles and the larger pores by the secondary particles as a result of aggregation of the primary nanoparticles. With increases in the calcination temperature, the sintering of primary nanoparticles occurred, leading to their gradual disappearance. The secondary particles were relatively stable with increasing calcination temperature, but an apparent decrease of larger pores formed by secondary particles was found at 700 °C, indicating that sintering of the secondary particles occurred. This was why the NH3–SCR activity of the MCTO-700 was lower than that of the MCTO-600.
It can be seen from the Table 2, the BET and pore volume of the catalysts decreased gradually with increasing the calcination temperature. And it is noted that the BET surface area of the MCTO-600 was not the highest among the catalysts, indicating that the specific surface area may not play an important role on the NH3–SCR activity of MCTO-x catalysts [12]. Furthermore, the mean pore size of the MCTO-600 was largest among the catalysts due to the reduction of smaller pores below 20 nm while retaining larger pores above 20 nm.
Figure 4 shows the SEM images of Mn–Ce–Ti–O composite aerogels obtained at different calcination temperatures. It can be seen that the samples were composed by interconnected particles with a porous structure, and the particle size grew gradually with the increase of calcination temperature, showing an obvious particle agglomeration for the sample MCTO-700, in accordance with the above XRD and N2 adsorption–desorption results.
XPS technology was used to study the surface atomic content and chemical states of Mn, Ce, Ti, and O. As shown in Figure 5a, the Mn 2p spectra contained two main peaks at 653.5–653.8 eV and 641.5–641.7 eV, which could be attributed to Mn 2p1/2 and Mn 2p3/2, respectively. The deconvolution of Mn 2p1/2 peak could obtain three peaks assigned to Mn2+ (652.4 ± 0.2 eV), Mn3+ (653.8 ± 0.3 eV), and Mn4+ (654.9 eV ± 0.4), The Mn 2p3/2 could also be divided into three peaks ascribed to Mn2+ (641.1 ± 0.2 eV), Mn3+ (642.6 ± 0.3 eV), and Mn4+ (644.1 ± 0.4 eV) [20,21]. The XPS spectra of Ce 3d in Figure 5b could be divided into eight characteristic peaks, which were labeled as u (900.8–902.0 eV), u′ (903.3–904.0 eV), u″ (906.8–908.0 eV), u‴ (916.0–917.0 eV), v (882.0–882.4 eV), v′ (884.3–885.0 eV), v″ (887.9–888.4 eV), and v‴ (898.0–898.4 eV), The two peaks, u′ and v′, were attributed to Ce3+ species, whereas another six peaks belonged to Ce4+ species [14,38]. Two peaks, at ~464.5 eV and ~458.7 eV, were observed for the XPS spectra of Ti 2p, as shown in Figure 5c, which were attributed to Ti 2p3/2 and Ti 2p1/2, respectively, representing the characteristic Ti4+ species [11,14]. The XPS spectra of O1s in Figure 5d exhibited two doublet peaks at 531.1–531.8 eV and 529.3–529.8 eV, which were assigned to the surface chemisorbed oxygen (denoted as Oα) such as defect-oxide (O22− or O) and hydroxyl groups, and the lattice oxygen O2− (denoted as Oβ), respectively [11,41]. The relative contents of different valence states could be calculated from the ratios of peak areas of XPS spectra, as listed in Table 3.
As can be seen from Table 3, with the increase of the calcination temperature, the relative atomic ratios of Mn4+/Mn on the surface of MCTO-x catalyst increased firstly and then decreased, and the highest ratio of Mn4+/Mn was present on the surface of the MCTO-600, which showed that an appropriate calcination temperature was favorable for the formation of Mn4+. As the contents of the surface Mn element for the four samples were different, the absolute surface Mn4+ contents for the MCTO-400, MCTO-500, MCTO-600, and MCTO-700 were 1.40%, 1.53%, 1.35%, and 1.19%, respectively. This difference could be caused by sintering and motion of primary nanoparticles in calcination, which caused different accessibilities for X-rays for different samples. It has been proved that Mn4+ species and their redox cycle can accelerate the conversion of NO to NO2, thereby enhancing the low-temperature NH3–SCR performance via the “fast-SCR” path (2NH3 + NO + NO2 = 2N2 + 3H2O) [18], which displays a reaction rate 10 times higher than that of the standard SCR process [42]. The proportion of Ce3+/Ce and absolute Ce3+ content on the surface of the MCTO-600 reached 24.0% and 0.41%, respectively, which were the highest among the four catalysts investigated. Ce3+ could generate a charge imbalance to form oxygen vacancies and unsaturated chemical bonds on the surface of the catalysts and promote the migration of oxygen from the bulk to the surface, thus accelerating the oxidation of NO to NO2 to facilitate the SCR reaction [22,23]. It has been widely reported that Oα species are more active than Oβ species due to their higher mobility, and a high Oα/(Oα + Oβ) ratio favors the oxidation of NO to NO2 in NH3–SCR to enhance the low-temperature activity of the catalyst [18,43]. It is noted that the percentage of Oα species was the highest for the MCTO-400 among the catalysts, which may be due to the smallest crystallite sizes at the lowest calcination temperature. The highest ratio of Oα/(Oα + Oβ) on the surface of the MCTO-400 catalyst corresponded to the most abundant Brønsted acid sites from the NH3–TPD results. However, the MCTO-400 had the lowest NH3–SCR performance among the four catalysts investigated. In addition, when the calcination temperature reached 700 °C, Oα decreased sharply, which may be due to the growth of crystallite size. These suggest that the number of surface chemisorbed oxygen might not the determining fact for the NH3–SCR activity in this work.
The H2–TPR technique was used to explore the reduction performance of the MCTO-x catalyst, and the obtained H2–TPR profiles and corresponding H2 consumption are shown in Figure 6a,b. The peak at 200–300 °C (denoted as peak “I”) was assigned to MnO2→Mn2O3 for the MCTO-600 and MCTO-700. The peak at 300–500 °C (denoted as peak “II”) corresponded to Mn2O3→Mn3O4 for all samples. For the MCTO-400 and MCTO-500, the reduction at 200–300 °C corresponding to MnO2→Mn2O3 was not well resolved with no apparent peak found. This could be caused by a smaller number of the high valence Mn4+ at a lower calcination temperature. The peak at 500–600 °C (denoted as peak “III”) was attributed to the reduction of CeO2 to Ce2O3 or surface Mn–O–Ce species [22]. As shown in Figure 6b, as the calcination temperature increased, the total H2 consumption of the catalysts increased firstly and then decreased. The MCTO-600 had the best reducibility, but its absolute surface Mn4+ content was not the highest, which might be due to the fact that the accessibility of the X-ray for the surface of samples by XPS was different from that of the reactants, and that the former had a higher accessibility than the latter. With increases in the calcination temperature, the number of the high valence ions can increased, and therefore the total H2 consumption can increase. The decrease of the total H2 consumption beyond 600 °C can be caused by the growth of crystallite size due to sintering and the decrease of the number of available reducible species. As the total H2 consumption of the MCTO-600 exhibited the largest of 1.80 mmol g−1, therefore, its low-temperature NH3–SCR activity was the highest among the four samples, indicating that the reducibility of active species favored the improvement of the NH3–SCR activity [14,18,38].
It has been generally confirmed that the adsorption and activation of NH3 on the acid sites of the catalyst surface is a key step in the NH3–SCR, so the NH3–TPD test was used to study the number and the strength distribution of acid sites over the catalysts. As shown in Figure 7a, two evident peaks could be observed from the TPD profiles, namely peak “I” at 70–450 °C, ascribed to the NH3 desorption by weak and medium acid sites, and peak “II” at 450–800 °C, due to the desorption of NH3 at strong acidic sites. It was reported that the NH3 molecules coordinated on the Lewis acid sites show a stronger thermal stability than the NH4+ ions formed on the Brønsted acid sites [44]. Thus, it can be inferred that the peak “I” belonged to the desorption of NH3 on the Brønsted acid sites, and the peak “II” was attributed to the desorption of NH3 from the Lewis acid sites. It can be seen from Figure 7b that the amount of the surface Brønsted acid sites of MCTO-x gradually decreased with the increase of calcination temperature, and the order was as follows: MCTO-400 (0.45 mmol·g−1) > MCTO-500 (0.29 mmol·g−1) > MCTO-600 (0.15 mmol·g−1) > MCTO-700 (0.14 mmol·g−1). With increases in the calcination temperature, the MCTO-600 exhibited the highest amount of adsorbed NH3 on Lewis acid sites (0.46 mmol·g−1), which had a stronger ability to adsorb and activate NH3 than Brønsted acid sites to facilitate the NH3–SCR process [2,45]. However, when the calcination temperature reached 700 °C, the amount of Lewis acid sites on the catalyst surface also began to decrease, which indicated that the higher calcination temperature led to the reduction of both the Brønsted and Lewis acid sites, causing weak NH3 adsorption and activation. This might have been caused by the growth of crystallite size due to sintering and the decrease of the number of both the Brönsted and Lewis acid sites. The Brønsted acid sites were contributed to by –OH groups linked to Mn and Ce ions with different valences [46], which was why the amount of the surface Brønsted acid sites decreased with increases in the calcination temperature due to enhanced dehydration at high temperature. As MnO2 was in an amorphous state as indicated by XRD, the Brønsted acid sites were contributed to by Mn4+. The Lewis acid sites were mainly contributed to by the oxides of Mn3+, Mn2+, and Ce3+ in a dehydrated state [47]. As Mn2O3 and Mn3O4 were in crystalline states while Ce2O3 was in an amorphous state as indicated in XRD, the Lewis acid sites were mainly contributed to by Ce3+. The MCTO-600 had the highest amount of Ce3+, so it had the most abundant Lewis acid sites.
The in-situ DRIFTS was examined for the sample MCTO-600 in order to study the catalytic reaction mechanism of the Mn–Ce–Ti–O composite aerogel. During the experiment, NH3 was firstly pre-adsorbed at 200 °C for 30 min, then purged with He for 30 min, and finally NO + O2 was passed in for different times to obtain the results, as shown in Figure 8a. After the introduction of NH3, some NH3 species appeared on the surface of the MCTO-600 catalyst, including the coordinated NH3 on the Lewis acid sites (1172, 1594, 3267, 3391 cm−1) [48,49], the NH4+ adsorbed on Brønsted acid sites (1405 cm−1), and –NH2 (1540 cm−1) [48,50]. From the different intensities of the Lewis and Brønsted acid species, it was found that Lewis acid sites were dominant in the MCTO-600, in accordance with the NH3–TPD results. When NO + O2 was introduced, the peak intensity of NH3 (L) species on the catalyst surface gradually decreased and disappeared after 20 min. The bands of NH3 (B) species showed no significant change in strength after 60 min of NO + O2 introduction, indicating that it was Lewis, not Brønsted, acidity that contributed mainly to the NH3–SCR reaction under this condition; so the largest amount of Lewis acid sites on the surface of the MCTO-600 catalyst played an important role for its highest NH3–SCR activity. The peaks ascribed to the adsorbed NO appeared after 20 min, while the peaks attributed to NH3 (L) species disappeared. The –NH2 species, which may be the amides produced by the dehydrogenation of adsorbed NH3, completely disappeared within 2 min, because they could react directly with gaseous NO to form the intermediate state NH2NO, and finally rapidly decomposed into N2 and H2O [2,19]. This suggests that adsorbed NH3 (L) species reacted with gaseous NO and O2, indicating that the Eley–Rideal (E–R) mechanism [2] was involved in the NH3–SCR process. After introduction of NO + O2 for 30 min, the surface of the catalyst was covered by adsorbed NOx species, including bridging nitrate species (1251 cm−1) [11], monodentate nitrate species (1520 cm−1) [51], bidentate nitrate species (1558 cm−1) [15], and gaseous NO2 species (1604 cm−1) [48]. This suggests that the Langmuir–Hinshelwood (L–H) mechanism was also possible.
Similarly, the transient SCR reaction of NH3 with pre-adsorbed NO + O2 on the MCTO-600 catalyst was recorded by in-situ DRIFTS, and the results of the reaction at different times are shown in Figure 8b. After the MCTO-600 catalyst was pretreated by NO + O2, bridged nitrate species (1248 cm−1), monodentate nitrate species (1403 and 1530 cm−1), bidentate nitrate species (1580 cm−1), and gaseous NO2 (1604 cm−1) species appeared on the catalyst surface. The co-existence of NH3-adsorbed peaks (coordinated NH3–L species at 1182, 3262, and 3352 cm−1) and NO-adsorbed peaks (1403, 1528, and 1601 cm−1) was found after NH3 was introduced for 10 min, indicating that the Langmuir–Hinshelwood (L–H) mechanism was also involved in the NH3–SCR process [2]. When NH3 was introduced for less than 10 min, no peaks ascribed to adsorbed NH3 were found. This could be accounted for by the fact that the Lewis acid sites were abundant, which diluted the NH3–adsorbed species, and that fast reaction between the adsorbed NH3 and adsorbed NO occurred, leading to a low concentration of NH3–adsorbed species that were out of the limits of DRIFTS. This implies that the Langmuir–Hinshelwood (L–H) mechanism was involved in the NH3–SCR process as the activation energy for the Langmuir–Hinshelwood (L–H) mechanism was lower than that of the Eley–Rideal (E–R) mechanism [52].
In addition, a new band at 1258 cm−1 may belong to the surface ammonium nitrate, which originated from the dimerization of NO2 and the continuous reaction with NH3 and H2O [19,53]. It has been confirmed that NH4NO3 is also an important intermediate component in the NH3-SCR process, along the following reaction route: NH4NO3 + NO→NH4NO2 + NO2, NH4NO2→N2 + 2H2O [54]. The presence of NO2 species demonstrated that a high ratio of Mn4+/Mn facilitated the oxidation of NO to NO2.

3.2. Catalytic Performance

The NH3–SCR performance of Mn–Ce–Ti–O composite aerogels with different calcination temperatures is shown in Figure 9a. Almost no catalytic activity was observed for the uncalcined composite aerogel in the temperature range of 80–320 °C, showing only about 10% of NO conversion. However, the calcined products exhibited excellent low-temperature catalytic activity, and it was shown that the NO conversion increased with increases in the calcination temperature up to 600 °C and then decreases with further increases in the calcination temperature. The MCTO-600 exhibited the most excellent catalytic activity, achieving more than 80% of NO conversion at 160–320 °C and nearly 100% from 200–300 °C. Figure 9b shows the outlet N2O concentration and N2 selectivity on the MCTO-600 catalyst. One hundred percent of N2 selectivity was observed in the temperature range of 120–220 °C, whereas N2O was detected when the reaction temperature was above 220 °C, which may be because a part of NH3 was oxidized at high temperatures [26]; nevertheless, more than 90% of N2 selectivity was obtained at 240–320 °C.

3.3. Kinetics Parameters

As shown in Figure 10a–c, the calcination temperature had a certain influence on the reaction rate constant and Ea of the obtained catalysts. With increases in temperature, the reaction rate constant increased gradually (Figure 10b), reaching the highest for the MCTO-600 at each temperature (18.16 cm3·s−1·g−1 at 160 °C, 26.90 cm3·s−1·g−1 at 180 °C, 43.55 cm3·s−1·g−1 at 200 °C, 57.54 cm3·s−1·g−1 at 220 °C, and 82.34 cm3·s−1·g−1 at 240 °C). Furthermore, as the calcination temperature increased, the Ea of the catalyst decreased firstly and then increased as follows: MCTO-600 (35.75 kJ·mol−1) < MCTO-700 (45.36 kJ·mol−1) < MCTO-500 (50.71 kJ·mol−1) < MCTO-400 (51.41 kJ·mol−1) (Figure 10c), indicating the energy barrier of the NH3–SCR reactions on the MCTO-600 was the lowest, which was related to its best NH3–SCR performance. In addition, it should be mentioned that the Ea of Mn–Ce–Ti–O composite catalysts prepared by this work were relatively lower compared with the other reported catalysts, such as the commercial V-W/Ti catalyst (73.9 kJ·mol−1) [10], Fe–ZSM-5 (54 kJ·mol−1) [5], and WO3/Fe2O3 (62–66 kJ·mol−1) [37].
TOF was used to further compare the intrinsic activity of the catalysts at 160, 180, 200, and 220 °C, respectively, which was calculated based on the atomic percentage of Mn (the main active site) on the surface. As shown in Figure 11a,b, it can be seen that MCTO-600 presented the highest TOF value compared with that of MCTO-400, MCTO-500, and MCTO-700, which was 12.64 × 10⁻⁵·s−1 at 160 °C, 15.83 × 10⁻⁵·s−1 at 180 °C, 19.51 × 10⁻⁵·s−1 at 200 °C, and 35.57 × 10⁻⁵·s−1 at 220 °C, further demonstrating that NO conversion on the MCTO-600 was highest, in accordance with the results from the activation energy.

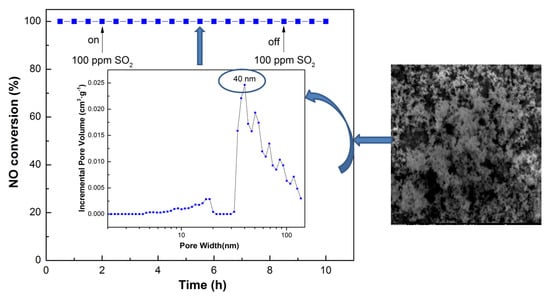
3.4. Influence of SO2 and H2O and Stability Test

In actual industrial processes, some residual SO2 is present in the desulfurized flue gas, which may poison and deactivate the denitration catalysts at low temperature. Therefore, the SO2 tolerance performance of the MCTO-600 catalyst was further studied, as shown in Figure 12a. The NO removal efficiency was stabilized at 100% for approximately 2 h at 200 °C prior to the injection of SO2. When 100 ppm of SO2 was introduced into the simulated flue gas, the NO conversion of the catalyst remained nearly 100% within 6 h, which was unchanged for the next 2 h after the injection of SO2 was cut off, indicating the excellent SO2 resistance for the MCTO-600. It has been acknowledged that the TiO2 and CeO2 components can improve the SO2 tolerance of Mn-based catalysts, because TiO2 can restrain the SO2 adsorption due to the weak interaction between SO2 and TiO2, and CeO2 can act as a sacrificial site to alleviate the sulfation of active MnOx [1,24,27,55]. However, the reported SO2 resistant performance of MnOx–CeO2–TiO2 catalysts was limited to some extent, as listed in Table 4. The excellent SO2 tolerance of the MCTO-600 catalyst in this work can be attributed to its largest mesopore size with an average pore size of 32 nm compared with that of the other reported catalysts (6.7–17.3 nm), because the decomposition of ammonium sulfate occurs more easily in larger pores [29,30,31]. In addition, the above in-situ DRIFTS results showed that the NH3–SCR reaction over the MCTO-600 catalyst followed both the E–R and L–H mechanisms, especially for the E–R pathway; namely, the gaseous NO could react directly with the active NH3 species adsorbed on Lewis acid sites, which is also beneficial to the superior SO2 resistance ability [25,56].
Meanwhile, the H2O resistance of the MCTO-600 catalyst was also investigated, as shown in Figure 12b. When 5 vol. % of H2O vapor was introduced into the system, the NO conversion decreased from 100% to 90% in the first 2 h and remained stable for the next 4 h, which returned to 100% after the H2O vapor was cut off, which may have been due to the fact that the adsorption of H2O at the active sites was reversible, and the occupied active sites could be easily regenerated after H2O desorption [55,57]. When 100 ppm of SO2 and 5 vol. % of H2O vapor were injected into the flue gas simultaneously, as shown in Figure 12c, the NO conversion of the MCTO-600 catalyst reduced from 100% to 75% within 2 h and remained stable for the next 4 h, which then gradually increased from 75% to 95% within 2.5 h after SO2 + H2O was cut off, suggesting that the passivation of the catalyst by SO2 + H2O included reversible and irreversible parts [58]. These results indicated that the coexistence of SO2 and H2O vapor at a low temperature had a greater impact on the NO removal than that of SO2 alone, which may have been due to the fact that H2O can accelerate the deposition of sulfates on the surface of catalyst, thereby intensifying the poisoning of SO2 [59,60]. In addition, the stability and longevity of the catalyst are also important for practical applications, as shown in Figure 12d; the NO removal efficiency of the MCTO-600 catalyst was stabilized at 100% within 24 h under the test conditions, demonstrating its excellent long-term stability.

4. Conclusions

In this work, the Mn–Ce–Ti–O composite aerogel with a large mesopore size was successfully prepared via a one-pot sol-gel method by using propylene oxide as a network gel inducer and ethyl acetoacetate as a complexing agent, and which was used for NH3–SCR of simulated flue gas. The results indicate that the Mn–Ce–Ti–O catalyst calcined at 600 °C exhibits the highest NH3–SCR activity, good N2 selectivity, lowest Ea, excellent SO2 resistance, and long-term stability. Its highest NH3–SCR activity is related to the most abundant Lewis acid sites and the best reducibility among the four catalysts calcinated at different temperatures (400, 500, 600, and 700 °C). The Lewis acid sites are mainly contributed by Ce3+ while the Brønsted acid sites mainly by Mn4+. The Lewis acid sites play a more important role than the Brønsted acid sites do in our catalysts investigated. Its superior SO2 resistance to the other reported MnOx–CeO2–TiO2 catalysts can be mainly attributed to its large mesopore size with an average pore size of 32 nm. The abundant Lewis acid sites are another factor that alleviates sulfation of NH3, which may reduce vapor pressure of NH3 greatly. Both the Langmuir–Hinshelwood (L–H) mechanism and the Eley–Rideal (E–R) mechanism are involved in the NH3–SCR. The results of this study may provide a good opportunity for preparing and designing NH3–SCR catalysts with superior sulfur tolerance and low temperature activity.

Author Contributions

Formal analysis, J.W. and Y.L.; Funding acquisition, W.Q. and L.L.; Investigation, W.L., S.Y., H.W., and M.Y.; Supervision, M.J.; Writing—original draft, Y.W.; Writing—review and editing, S.J. and R.Z. All authors have read and agreed to the published version of the manuscript.

Funding

This work was financially supported by the National Natural Science Foundation of China (No. U1710252).

Conflicts of Interest

The authors declare no conflict of interest.

References

  1. Zhang, L.; Zhang, D.; Zhang, J.; Cai, S.; Fang, C.; Huang, L.; Li, H.; Gao, R.; Shi, L. Design of meso-TiO2@MnOx–CeOx/CNTs with a core-shell structure as DeNOx catalysts: Promotion of activity, stability and SO2-tolerance. Nanoscale 2013, 5, 9821–9829. [Google Scholar] [CrossRef] [PubMed]
  2. Liu, J.; Li, X.; Zhao, Q.; Ke, J.; Xiao, H.; Lv, X.; Liu, S.; Tadé, M.; Wang, S. Mechanistic investigation of the enhanced NH3-SCR on cobalt-decorated Ce–Ti mixed oxide: In situ FTIR analysis for structure-activity correlation. Appl. Catal. B Environ. 2017, 200, 297–308. [Google Scholar] [CrossRef]
  3. Xie, A.; Tang, Y.; Huang, X.; Jin, X.; Gu, P.; Luo, S.; Yao, C.; Li, X. Three-dimensional nanoflower MnCrOx/Sepiolite catalyst with increased SO2 resistance for NH3–SCR at low temperature. Chem. Eng. J. 2019, 370, 897–905. [Google Scholar] [CrossRef]
  4. Shao, J.; Lin, F.; Li, Y.; Tang, H.; Wang, Z.; Liu, P.; Chen, G. Co-precipitation synthesized MnOx–CeO2 mixed oxides for NO oxidation and enhanced resistance to low concentration of SO2 by metal addition. Catalysts 2019, 9, 519. [Google Scholar] [CrossRef] [Green Version]
  5. Huang, H.; Long, R.; Yang, R. Kinetics of selective catalytic reduction of NO with NH3 on Fe–ZSM-5 catalyst. Appl. Catal. A Gen. 2002, 235, 241–251. [Google Scholar] [CrossRef]
  6. Yang, S.; Li, J.; Wang, C.; Chen, J.; Ma, L.; Chang, H.; Chen, L.; Peng, Y.; Yan, N. Fe–Ti spinel for the selective catalytic reduction of NO with NH3: Mechanism and structure-activity relationship. Appl. Catal. B Environ. 2012, 117–118, 73–80. [Google Scholar] [CrossRef]
  7. Wei, B.; Yang, W.; Wang, J.; Tan, H.; Zhou, S.; Wang, F.; Ma, J. Study on reduction mechanism of Fe2O3 by NH3 under SNCR condition. Fuel 2019, 255, 115814. [Google Scholar] [CrossRef]
  8. Xi, H.; Zhou, S.; Zhou, J. New experimental results of NO removal from simulated marine engine exhaust gases by Na2S2O8/urea solutions. Chem. Eng. J. 2019, 362, 12–20. [Google Scholar] [CrossRef]
  9. Song, L.; Ma, K.; Tian, W.; Ji, J.; Liu, C.; Tang, S.; Jiang, W.; Yue, H.; Liang, B. An environmentally friendly FeTiSOx catalyst with a broad operation-temperature window for the NH3-SCR of NOx. AIChE J. 2019, 65, e16684. [Google Scholar] [CrossRef]
  10. Michalow-Mauke, K.; Lu, Y.; Kowalski, K.; Graule, T.; Nachtegaal, M.; Kröcher, O.; Ferri, D. Flame-Made WO3/CeOx–TiO2 Catalysts for Selective Catalytic Reduction of NOx by NH3. ACS. Catal. 2015, 5, 5657–5672. [Google Scholar] [CrossRef]
  11. Mu, J.; Li, X.; Sun, W.; Fan, S.; Wang, X.; Wang, L.; Qin, M.; Gan, G.; Yin, Z.; Zhang, D. Enhancement of Low-temperature catalytic activity over a highly dispersed Fe–Mn/Ti catalyst for selective catalytic reduction of NOx with NH3. Ind. Eng. Chem. Res. 2018, 57, 10159–10169. [Google Scholar] [CrossRef]
  12. Chen, X.; Wang, P.; Fang, P.; Ren, T.; Liu, Y.; Cen, C.; Wang, H.; Wu, Z. Tuning the property of Mn–Ce composite oxides by titanate nanotubes to improve the activity, selectivity and SO2/H2O tolerance in middle temperature NH3–SCR reaction. Fuel Process. Technol. 2017, 167, 221–228. [Google Scholar] [CrossRef]
  13. Gao, F.; Tang, X.; Yi, H.; Li, J.; Zhao, S.; Wang, J.; Chu, C.; Li, C. Promotional mechanisms of activity and SO2 tolerance of Co-or Ni-doped MnOx–CeO2 catalysts for SCR of NOx with NH3 at low temperature. Chem. Eng. J. 2017, 317, 20–31. [Google Scholar] [CrossRef]
  14. Leng, X.; Zhang, Z.; Li, Y.; Zhang, T.; Ma, S.; Yuan, F.; Niu, X.; Zhu, Y. Excellent low temperature NH3–SCR activity over MnaCe0.3TiOx (a = 0.1–0.3) oxides: Influence of Mn addition. Fuel Process. Technol. 2018, 181, 33–43. [Google Scholar] [CrossRef]
  15. Chen, L.; Yuan, F.; Li, Z.; Niu, X.; Zhu, Y. Synergistic effect between the redox property and acidity on enhancing the low temperature NH3–SCR activity for NOx removal over the Co0.2CexMn0.8-xTi10 (x = 0–0.40) oxides catalysts. Chem. Eng. J. 2018, 354, 393–406. [Google Scholar] [CrossRef]
  16. Ma, M.; Ma, X.; Cui, S.; Liu, T.; Tian, Y.; Wang, Y. Low Temperature NH3–SCR over Mn–Ce Oxides Supported on MCM-41 from Diatomite. Materials 2019, 12, 3654. [Google Scholar] [CrossRef] [Green Version]
  17. Meng, D.; Zhan, W.; Guo, Y.; Guo, Y.; Wang, L.; Lu, G. A highly effective catalyst of Sm–MnOx for the NH3–SCR of NOx at low temperature: Promotional role of Sm and its catalytic performance. ACS. Catal. 2015, 5, 5973–5983. [Google Scholar] [CrossRef]
  18. Wang, Z.; Guo, R.; Shi, X.; Liu, X.; Qin, H.; Liu, Y.; Duan, C.; Guo, D.; Pan, W. The superior performance of CoMnOx catalyst with ball-flowerlike structure for low-temperature selective catalytic reduction of NOx by NH3. Chem. Eng. J. 2020, 381, 122753. [Google Scholar] [CrossRef]
  19. Liu, F.; Shan, W.; Lian, Z.; Xie, L.; Yang, W.; He, H. Novel MnWOx catalyst with remarkable performance for low temperature NH3-SCR of NOx. Catal. Sci. Technol. 2013, 3, 2699–2707. [Google Scholar] [CrossRef]
  20. Yang, S.; Wang, C.; Li, J.; Yan, N.; Ma, L.; Chang, H. Low temperature selective catalytic reduction of NO with NH3 over Mn–Fe spinel: Performance, mechanism and kinetic study. Appl. Catal. B Environ. 2011, 110, 71–80. [Google Scholar] [CrossRef]
  21. Wang, F.; Xie, Z.; Liang, J.; Fang, B.; Piao, Y.; Hao, M.; Wang, Z. Tourmaline-modified FeMnTiOx catalysts for improved low temperature NH3–SCR performance. Environ. Sci. Technol. 2019, 53, 6989–6996. [Google Scholar] [CrossRef] [PubMed]
  22. Ren, S.; Yang, J.; Zhang, T.; Jiang, L.; Long, H.; Guo, F.; Kong, M. Role of cerium in improving NO reduction with NH3 over Mn–Ce/ASC catalyst in low-temperature flue gas. Chem. Eng. Res. Des. 2018, 133, 1–10. [Google Scholar] [CrossRef]
  23. Li, Q.; Li, X.; Li, W.; Zhong, L.; Zhang, C.; Fang, Q.; Chen, G. Effect of preferential exposure of anatase TiO2{001} facets on the performance of Mn–Ce/TiO2 catalysts for low-temperature selective catalytic reduction of NOx with NH3. Chem. Eng. J. 2019, 369, 26–34. [Google Scholar] [CrossRef]
  24. Jin, R.; Liu, Y.; Wang, Y.; Cen, W.; Wu, Z.; Wang, H.; Weng, X. The role of cerium in the improved SO2 tolerance for NO reduction with NH3 over Mn–Ce/TiO2 catalyst at low temperature. Appl. Catal. B Environ. 2014, 148–149, 582–588. [Google Scholar] [CrossRef]
  25. Han, L.; Cai, S.; Gao, M.; Hasegawa, J.Y.; Wang, P.; Zhang, J.; Shi, L.; Zhang, D. Selective Catalytic Reduction of NOx with NH3 by using novel catalysts: State of the art and future prospects. Chem. Rev. 2019, 119, 10916–10976. [Google Scholar] [CrossRef]
  26. Ma, D.; Yang, L.; Huang, B.; Wang, L.; Wang, X.; Sheng, Z.; Dong, F. MnOx–CeO2@TiO2 core-shell composites for low temperature SCR of NOx. New J. Chem. 2019, 43, 15161–15168. [Google Scholar] [CrossRef]
  27. Chang, H.; Chen, X.; Li, J.; Ma, L.; Wang, C.; Liu, C.; Schwank, J.W.; Hao, J. Improvement of activity and SO2 tolerance of Sn-Modified MnOx–CeO2 Catalysts for NH3–SCR at Low Temperatures. Environ. Sci. Technol. 2013, 47, 5294–5301. [Google Scholar] [CrossRef]
  28. Yu, J.; Guo, F.; Wang, Y.; Zhu, J.; Liu, Y.; Su, F.; Gao, S.; Xu, G. Sulfur poisoning resistant mesoporous Mn-base catalyst for low-temperature SCR of NO with NH3. Appl. Catal. B Environ. 2010, 95, 160–168. [Google Scholar] [CrossRef]
  29. Soh, B.W.; Nam, I.S. Effect of support morphology on the sulfur tolerance of V2O5/Al2O3 catalyst for the reduction of NO by NH3. Ind. Eng. Chem. Res. 2003, 42, 2975–2986. [Google Scholar] [CrossRef]
  30. Guo, K.; Fao, G.; Gu, D.; Yu, S.; Ma, K.; Liu, A.; Tan, W.; Wang, J.; Du, X.; Zhou, W.; et al. Pore size expansion accelerates ammonium bisulfate decomposition for improved sulfur resistance in low-temperature NH3–SCR. ACS Appl. Mater. Interfaces. 2019, 11, 4900–4907. [Google Scholar] [CrossRef]
  31. Ma, K.; Guo, K.; Li, L.; Zou, W.; Tang, C.; Dong, L. Cavity size dependent SO2 resistance for NH3–SCR of hollow structured CeO2–TiO2 catalysts. Catal. Commun. 2019, 128, 105719. [Google Scholar] [CrossRef]
  32. Lee, S.M.; Park, K.H.; Hong, S.C. MnOx/CeO2–TiO2 mixed oxide catalysts for the selective catalytic reduction of NO with NH3 at low temperature. Chem. Eng. J. 2012, 195–196, 323–331. [Google Scholar] [CrossRef]
  33. Sheng, Z.; Hu, Y.; Xue, J.; Wang, X.; Liao, W. SO2 poisoning and regeneration of Mn–Ce/TiO2 catalyst for low temperature NOx reduction with NH3. J. Rare Earths 2012, 30, 676–682. [Google Scholar] [CrossRef]
  34. Peng, Y.; Li, K.; Li, J. Identification of the active sites on CeO2–WO3 catalysts for SCR of NOx with NH3: An in-situ IR and Raman spectroscopy study. Appl. Catal. B Environ. 2013, 140–141, 483–492. [Google Scholar] [CrossRef]
  35. Zhang, D.; Zhang, L.; Shi, L.; Fang, C.; Li, H.; Gao, R.; Huang, L.; Zhang, J. In situ supported MnOx–CeOx on carbon nanotubes for the low-temperature selective catalytic reduction of NO with NH3. Nanoscale 2013, 5, 1127–1136. [Google Scholar] [CrossRef]
  36. Han, L.; Gao, M.; Hasegawa, J.; Li, S.; Shen, Y.; Li, H.; Shi, L.; Zhang, D. SO2–tolerant selective catalytic reduction of NOx over Meso–TiO2@Fe2O3@Al2O3 Metal-Based Monolith catalysts. Environ. Sci. Technol. 2019, 53, 6462–6473. [Google Scholar] [CrossRef]
  37. Zhang, J.; Huang, Z.; Du, Y.; Wu, X.; She, H.; Jiang, G. Atomic-scale insights into the nature of active sites in Fe2O3-supported submonolayer WO3 catalysts for selective catalytic reduction of NO with NH3. Chem. Eng. J. 2020, 381, 122668. [Google Scholar] [CrossRef]
  38. Jiang, L.; Liu, Q.; Ran, G.; Kong, M.; Ren, S.; Yang, J.; Li, J. V2O5–modified Mn–Ce/AC catalyst with high SO2 tolerance for low temperature NH3-SCR of NO. Chem. Eng. J. 2019, 370, 810–821. [Google Scholar] [CrossRef]
  39. Xiao, X.; Sheng, Z.; Yang, L.; Dong, F. Low-temperature selective catalytic reduction of NOx with NH3 over a manganese and cerium oxide/graphene composite prepared by a hydrothermal method. Catal. Sci. Technol. 2016, 6, 1507–1514. [Google Scholar] [CrossRef]
  40. Ye, B.; Lee, M.; Jeong, B.; Kim, J.; Lee, D.H.; Baik, J.M.; Kim, H.D. Partially reduced graphene oxide as a support of Mn–Ce/TiO2 catalyst for selective catalytic reduction of NOx with NH3. Catal. Today 2019, 328, 300–306. [Google Scholar] [CrossRef]
  41. Liu, F.; He, H.; Ding, Y.; Zhang, C. Effect of manganese substitution on the structure and activity of iron titanate catalyst for the selective catalytic reduction of NO with NH3. Appl. Catal. B Environ. 2009, 93, 194–204. [Google Scholar] [CrossRef]
  42. Koebel, M.; Elsener, M.; Madia, G. Reaction pathways in the selective catalytic reduction process with NO and NO2 at low temperatures. Ind. Eng. Chem. Res. 2001, 40, 52–59. [Google Scholar] [CrossRef]
  43. Li, W.; Zhang, C.; Li, X.; Tan, P.; Zhou, A.; Fang, Q.; Chen, G. Ho-modified Mn–Ce/TiO2 for low-temperature SCR of NOx with NH3: Evaluation and characterization. Chin. J. Catal. 2018, 39, 1653–1663. [Google Scholar] [CrossRef]
  44. Zhang, L.; Shi, L.; Huang, L.; Zhang, J.; Gao, R.; Zhang, D. Rational design of high-performance DeNOx catalysts bsed on MnxCo3–xO4 nanocages derived from Metal-Organic Frameworks. ACS Catal. 2014, 4, 1753–1763. [Google Scholar] [CrossRef]
  45. Li, C.; Tang, X.; Yi, H.; Wang, L.; Cui, X.; Chu, C.; Li, J.; Zhang, R.; Yu, Q. Rational design of template-free MnOx–CeO2 hollow nanotube as de-NOx catalyst at low temperature. Appl. Surf. Sci. 2018, 428, 924–932. [Google Scholar] [CrossRef]
  46. Marbán, G.; Solís, T.V.; Fuertes, A.B. Mechanism of low-temperature selective catalytic reduction of NO with NH3 over carbon-supported Mn3O4: Role of surface NH3 species: SCR mechanism. J. Catal. 2004, 226, 138–155. [Google Scholar] [CrossRef]
  47. Jiang, C.; Zhang, X.; Jia, D.; Song, L. Performance of Hβ zeolites modified by Ce3+ on synthesis of ethyl anthrquinone. J. China. Univ. Petrol. Nat. Sci. 2015, 39, 151–156. [Google Scholar]
  48. Liu, Z.; Zhang, S.; Li, J.; Ma, L. Promoting effect of MoO3 on the NOx reduction by NH3 over CeO2/TiO2 catalyst studied with in situ DRIFTS. Appl. Catal. B Environ. 2014, 144, 90–95. [Google Scholar] [CrossRef]
  49. Ding, S.; Liu, F.; Shi, X.; He, H. Promotional effect of Nb additive on the activity and hydrothermal stability for the selective catalytic reduction of NOx with NH3 over CeZrOx catalyst. Appl. Catal. B Environ. 2016, 180, 766–774. [Google Scholar] [CrossRef]
  50. Liu, L.; Su, S.; Xu, K.; Li, H.; Qing, M.; Hu, S.; Wang, Y.; Xiang, J. Insights into the highly efficient Co modified MnSm/Ti catalyst for selective catalytic reduction of NOx with NH3 at low temperature. Fuel 2019, 255, 115798. [Google Scholar] [CrossRef]
  51. Chen, L.; Li, J.; Ge, M.; Ma, L.; Chang, H. Mechanism of Selective Catalytic Reduction of NOx with NH3 over CeO2-WO3 Catalysts. Chin. J. Catal. 2011, 32, 836–841. [Google Scholar] [CrossRef]
  52. Marban, G.; Fuertes, A.B. Kinetics of the low-temperature selective catalytic reduction of NO with NH3 over activated carbon fiber composite-supported iron oxides. Catal. Lett. 2002, 84, 13–19. [Google Scholar] [CrossRef]
  53. Madia, G.; Koebel, M.; Elsener, M.; Wokaun, A. Side Reactions in the Selective Catalytic Reduction of NOx with Various NO2 Fractions. Ind. Eng. Chem. Res. 2002, 41, 4008–4015. [Google Scholar] [CrossRef]
  54. Grossale, A.; Nova, I.; Tronconi, E.; Chatterjee, D.; Weibel, M. The chemistry of the NO/NO2–NH3 “fast” SCR reaction over Fe-ZSM5 investigated by transient reaction analysis. J. Catal. 2008, 256, 312–322. [Google Scholar] [CrossRef]
  55. Wang, F.; Shen, B.; Zhu, S.; Wang, Z. Promotion of Fe and Co doped Mn-Ce/TiO2 catalysts for low temperature NH3-SCR with SO2 tolerance. Fuel 2019, 249, 54–60. [Google Scholar] [CrossRef]
  56. Ha, L.; Gao, M.; Feng, C.; Shi, L.; Zhang, D. Fe2O3-CeO2@Al2O3 nanoarrays on Al–Mesh as SO2–tolerant monolith catalysts for NOx reduction by NH3. Environ. Sci. Technol. 2019, 53, 5946–5956. [Google Scholar]
  57. Liu, F.; He, H.; Lian, Z.; Shan, W.; Xie, L.; Asakura, K.; Wang, W.; Deng, H. Highly dispersed iron vanadate catalyst supported on TiO2 for the selective catalytic reduction of NOx with NH3. J. Catal. 2013, 307, 340–351. [Google Scholar] [CrossRef]
  58. Yao, X.; Zhao, R.; Chen, L.; Du, J.; Tao, C.; Yang, F.; Dong, L. Selective catalytic reduction of NOx by NH3 over CeO2 supported on TiO2: Comparison of anatase, brookite, and rutile. Appl. Catal. B Environ. 2017, 208, 82–93. [Google Scholar] [CrossRef]
  59. Yu, S.; Lu, Y.; Cao, Y.; Wang, J.; Sun, B.; Gao, F.; Tang, C.; Dong, L. Composite catalytic systems: A strategy for developing the low temperature NH3–SCR catalysts with satisfactory SO2 and H2O tolerance. Catal. Today 2019, 327, 235–245. [Google Scholar] [CrossRef]
  60. Bordeje, E.G.; Pinilla, J.L.; Lazaro, M.J.; Moliner, R. NH3–SCR of NO at low temperatures over sulphated vanadia on carbon coated monoliths: Effect of H2O and SO2 traces in the gas feed. Appl. Catal. B Environ. 2006, 66, 281–287. [Google Scholar] [CrossRef]
Figure 1. Thermogravimetry–differential scanning calorimetry (TG–DSC) curve of sample MCTO-0.
Materials 13 00475 g001
Figure 2. XRD patterns of MCTO-0, MCTO-400, MCTO-500, MCTO-600, and MCTO-700 catalysts.
Materials 13 00475 g002
Figure 3. N2 adsorption/desorption isotherms (a) and the corresponding pore size distributions (b) of MCTO-400, MCTO-500, MCTO-600, and MCTO-700.
Materials 13 00475 g003
Figure 4. SEM images of MCTO-400 (a), MCTO-500 (b), MCTO-600 (c), and MCTO-700 (d).
Materials 13 00475 g004
Figure 5. XPS spectra of the MCTO-400, MCTO-500, MCTO-600, and MCTO-700 catalysts: (a) Mn 2p, (b) Ce 3d, (c) Ti 2p, and (d) O 1s.
Materials 13 00475 g005
Figure 6. H2–temperature programmed reduction (TPR) profiles (a) and the corresponding H2 consumption (b) of the MCTO-400, MCTO-500, MCTO-600, and MCTO-700 catalysts.
Materials 13 00475 g006
Figure 7. NH3–TPD profiles (a) and the corresponding amount of adsorbed NH3 (b) of the MCTO-400, MCTO-500, MCTO-600, and MCTO-700 catalysts.
Materials 13 00475 g007aMaterials 13 00475 g007b
Figure 8. In-situ diffuse reflectance infrared Fourier transform spectra (DRIFTS) of NO + O2 reacted with pre-adsorbed NH3 species over MCTO-600 (a). In-situ DRIFTS of NH3 reacted with pre-adsorbed NO + O2 over MCTO-600 (b). Reaction conditions: T = 200 °C, 500 ppm of NO (when used), 500 ppm of NH3 (when used), 5 vol. % of O2 (when used), balance N2.
Materials 13 00475 g008
Figure 9. NH3–selective catalytic reduction (SCR) activity of MCTO-0, MCTO-400, MCTO-500, MCTO-600, and MCTO-700 catalysts (a). N2 selectivity of MCTO-600 (b). Reaction conditions: 500 ppm of NO, 500 ppm of NH3, 5 vol. % of O2, balance N2, gas hourly space velocity (GHSV) = 14,400 h−1.
Materials 13 00475 g009
Figure 10. −ln(1 − x) versus w/V plots (a), reaction rate constant (b), and Arrhenius plots (c) of MCTO-400, MCTO-500, MCTO-600, and MCTO-700.
Materials 13 00475 g010
Figure 11. NH3–SCR performance (a) and the corresponding TOF (b) of MCTO-400, MCTO-500, MCTO-600, and MCTO-700 at different temperatures. Reaction conditions: 500 ppm of NO, 500 ppm of NH3, 5 vol. % O2, balance N2, catalyst mass = 20 mg, flow rate = 240 mL·min−1, GHSV ≈ 200,000 h−1.
Materials 13 00475 g011
Figure 12. The influence of SO2 (a), H2O (b), and SO2 + H2O (c) on NO conversion and long-time stability test (d) of the MCTO-600 catalyst. Reaction conditions: T = 200 °C, 500 ppm of NO, 500 ppm of NH3, 5 vol. % of O2, 5 vol. % of H2O (when used), 100 ppm of SO2 (when used), and balance N2; GHSV = 14,400 h−1.
Materials 13 00475 g012
Table 1. The mean crystallite sizes of metal oxides of different catalysts.
SampleDTiO2 (nm)DCeO2 (nm)DMn2O3 (nm)DMn3O4 (nm)
MCTO-07.8---
MCTO-4009.4-6.815.3
MCTO-50011.5-12.520.8
MCTO-60016.28.013.021.5
MCTO-70021.513.617.838.8
Table 2. Brunauer–Emmett–Teller (BET) specific surface area and pore textures of the samples.
CatalystSurface Area (m2·g−1)Mean Pore Diameter (nm)Pore Volume (cm3·g−1)
MCTO-400127.1140.44
MCTO-50071.6220.38
MCTO-60035.8320.29
MCTO-70018.9200.095
Table 3. Surface atomic compositions of catalysts measured by XPS.
SampleAtomic Composition (%)Oα/(Oα + Oβ) (%)Ce3+/Ce (%)Mn4+/Mn (%)Mn3+/Mn (%)Mn2+/Mn (%)
MnCeTiCO
MCTO-4005.41.816.413.363.257.217.525.931.342.8
MCTO-5005.51.323.16.663.534.917.927.930.641.5
MCTO-6004.61.725.35.163.241.324.029.329.940.8
MCTO-7004.92.424.92.365.629.013.824.330.545.3
Table 4. A comparison of anti-SO2 performance of MnOx–CeO2–TiO2 catalysts prepared by different methods in the reported literatures.
CatalystsAverage Pore SizePreparation MethodsReaction ConditionsNO Conversion Before and After Introducing SO2Refs
MnOx–CeO2@TiO213.3 nmthree-step methodT = 180 °C, [NO] = [NH3] = 500 ppm, [O2] = 5%, [SO2] = 200 ppm, GHSV = 24,000 h−1decline from 100% to 70%[26]
Mn–Ce/TiO29.0 nmco-precipitation methodT = 120 °C, [NO] = [NH3] = 600 ppm, [O2] = 3%, [SO2] = 700 ppm, GHSV = 40,000 h−1decline from 92.5% to 34.6%[33]
Mn–Ce/TiO26.7 nmsol–gel methodT = 150 °C, [NO] = [NH3] = 800 ppm, [O2] = 3%, [SO2] = 100 ppm, GHSV = 40,000 h−1decline from 100% to 60%[24]
MnOx–CeO2/TiO213.7 nmone-step hydrothermal methodT = 180 °C, [NO] = [NH3] = 500 ppm, [O2] = 5%, [SO2] = 200 ppm, GHSV = 24,000 h−1decline from 100% to 47%[26]
MnOx/CeO2–TiO217.3 nmwet impregnationT = 180 °C, [NO] = 200 ppm, [NH3] = 220 ppm, [O2] = 8%, [SO2] = 100 ppm, GHSV = 60,000 h−1decline from 84% to 62%[32]
MnCe/TNTs13.6 nmhydrothermal methodT = 150 °C, [NO] = 720 ppm, [NH3] = 800 ppm, [O2] = 3%, [SO2] = 100 ppm, GHSV = 100,000 h−1decline from 92% to 84%[12]
Mn–Ce–Ti–O composite aerogels32.5 nmone-pot sol–gel methodT = 200 °C, [NO] = [NH3] = 500 ppm, [O2] = 5%, [SO2] = 100 ppm, GHSV = 14,400 h−1maintaining at 100%in this work

