On the Relevance of Volumetric Energy Density in the Investigation of Inconel 718 Laser Powder Bed Fusion


1
Department of Industrial Engineering, University of Salerno, Via Giovanni Paolo II 132, 84084 Fisciano (SA), Italy
2
Dipartimento di Meccanica, Matematica e Management, Politecnico di Bari, Viale Japigia 182, 70126 Bari (BA), Italy
*
Author to whom correspondence should be addressed.
Materials 2020, 13(3), 538; https://doi.org/10.3390/ma13030538
Submission received: 26 October 2019
/
Revised: 5 December 2019
/
Accepted: 21 January 2020
/
Published: 23 January 2020
(This article belongs to the Special Issue Laser Materials Fabrication and Joining)
Abstract
:Laser powder bed fusion (LPBF) can fabricate products with tailored mechanical and surface properties. In fact, surface texture, roughness, pore size, the resulting fractional density, and microhardness highly depend on the processing conditions, which are very difficult to deal with. Therefore, this paper aims at investigating the relevance of the volumetric energy density (VED) that is a concise index of some governing factors with a potential operational use. This paper proves the fact that the observed experimental variation in the surface roughness, number and size of pores, the fractional density, and Vickers hardness can be explained in terms of VED that can help the investigator in dealing with several process parameters at once.
1. Introduction
New methods of manufacturing are receiving special interest to pursue specific advantages in comparison with conventional technologies. Specifically, Additive Manufacturing (AM) by means of laser irradiation of powder bed (i.e., Laser Powder Bed Fusion, LPBF) is being evaluated in many industrial fields, including medicine, aerospace, and automotive [1], thanks to the opportunity of producing custom, complex, accurate components with optimized physical and mechanical features [2,3].
As for any other technology in the field of AM, the process is conducted layer by layer: powder is laid over a plate, then the laser beam provides selective irradiation to the cross-section at each slice of the part. Based on the levels of the governing factors, the process can be conducted either in Selective Laser Sintering (SLS) or Melting (SLM) mode [4]. Since many concurrent phenomena are in place and since LPBF is primarily aimed at industries with stringent standards, different methods of in-line monitoring are required and are currently under development [5,6].
At first, one may expect any outcome in LPBF to depend on the leading factors such as laser power, scanning speed, layer thickness and hatch distance [7], the exposure strategies, as well as the build orientations of the parts [8] and the required supports [9]. Other factors, such as the inert gas selection [10], are deemed to have minor impact, although these have been addressed only recently in the literature. As regarding the output of the process, the resulting mechanical properties and the surface quality are of main concern. Indeed, it has been shown that the porosity, in terms of both amount [11] and size [12] of pores, is crucial for any process involving the laser beam [13], since an effect is played on the ultimate tensile strength and the overall hardness [7,8]; interestingly, a proper selection of the levels of the governing factors is the key to prevent possible anisotropy of the mechanical properties [14].
On the other hand, proper surface quality is crucial for shape tolerances, process accuracy and fatigue life [15,16]; indeed, surface roughness is a limiting factor in LPBF even when manufacturing components with internal channels, because the thermal exchange is affected [17]. Although extensive experimental trials are continuously conducted, improper surface features may still limit the application of the component if compared with its machined or casted counterpart [10]; as a consequence, long and demanding post processing methods are required [18,19] and may represent a challenge in case of complex parts [20]. Nevertheless, specific surface patterns are valuable to the purpose of specific applications, e.g., to promote or hinder adhesion and friction.
Undoubtedly, both the mechanical and the surface properties must be taken into account when performing a proper optimization. At present, although the optimum processing setting for each base metal is often suggested by the machine manufacturer or found via preliminary trials, interest is growing to investigate possible deviations from the target, to improve a specific requirement depending on the final application: in this sense, the optimum solution must be intended as a compromise. For example, although the residual porosity is unwanted in general, a reduced fractional density may be required to some custom-oriented applications as medical metal implants [21], to adjust the stiffness of the final part depending on the loads and promoting regeneration and better apposition of the bone tissue [22]; conversely, low porosity is mandatory to improve both the mechanical properties and the surface quality. In general, this approach is potentially successful, provided that a complete map is available to assess the measure in which endorsing a response results into the detriment of another. Therefore, ongoing works are reported in the literature and are aimed to full understanding the effects of the governing factors in a wide perspective, on mechanical properties, defect, surface texture and microstructure [23,24,25].
In this frame, the paper investigates the surface texture, the porosity, the fractional density and the microhardness as a function of the governing factors, in order to provide a comprehensive study for selecting the proper processing conditions depending on the application. In agreement with the literature, the main factors involved in LPBF have been combined into the Volumetric Energy Density (VED), a synthetic index with physical meaning. Several authors have investigated the process in SLM mode using different definitions of VED [26,27,28,29] to prove that the fractional density [30] and other responses effectively depend on VED which has been already validated [31] as a design parameter for LPBF of stainless steel. Nevertheless, VED is not effective to the purpose of a complete description as it fails to model the physics of the melting pool. In this paper, the definition [29] involving laser power P, scanning speed s, hatch distance h (i.e., the overlapping distance between consecutive traces on the same layer) and thickness t of the layer has been considered:
Advantages and limits concerning the investigation of the process have been discussed aiming to validate the effectiveness of VED as a design parameter. The investigation has been supported by test of normality for each feature and the analysis of variance to assess the statistical significance of VED.
2. Materials and Methods
In this work, the levels of the processing factors (Table 1) have been selected in a mixed experimental plan, for a given constant layer thickness of 20 µm, in order to investigate the outcome of LPBF as a consequence of different values of VED. The thickness of the layer has been taken as a constant, although affecting the VED and the response, since it has been set to match the average size of the particles, to the purpose of uniform layering, based on preliminary trials.
An EOSINT M270 commercial laser sintering system (EOS, Krailling, Germany), operating in full-melting mode, has been used to manufacture cylinder specimens, 40 mm diameter, 20 mm height; the direction of building is the direction of the longitudinal axis of the cylinder, therefore the need for supports [9] has been prevented. As common practice in LPBF [1], the exposure strategy is based on splitting the cross-section into parallel sectors, 5 mm wide; each sector is scanned by the laser with multiple, overlapping, traces (Figure 1). Moreover, double exposure with the parameters of each processing condition is provided at the contour of the cross-section to the purpose of increasing the accuracy. Layer by layer, the scan direction is rotated by 67° to promote full adhesion of the material and reduce the mechanical anisotropy. It is worth noting that although the manufacturing process is generally based on remelting of the last layer in order to improve the features of the top surface, the common approach has been changed to the purpose of this paper: i.e., the exposed surface has been scanned with the same strategy of any other layer, therefore it is fully representative of the conditions of building.
Pre-alloyed, virgin, commercial argon gas atomized EOS NickelAlloy IN718 powder of 20 µm mean size, as reported by the manufacturer (EOS, Krailling, Germany), matching to the standard nominal composition of Inconel 718 [32] has been used and laid by a brush recoater, in inert argon atmosphere to prevent oxidation. The temperature of the plate has been set to 80 °C to improve adhesion of the first layer, as well as preventing cracking.
Visual inspections via stereoscopic microscopy have been conducted. To characterize the surface topography, a contact-type roughness tester has been used; specifically, in compliance with ISO standard [33], the sample length and the cut-off wavelength in the Gaussian filter to separate roughness and waviness components of the parts have been set. Moreover, the surface roughness at the top of each sample has been measured along three directions of probe, i.e., the direction of scan (1), the direction of hatch (2) and a 45°-tilted direction (3) with respect to these; three replications have been made for each acquisition.
Then, the specimens have been cut, mounted, polished and etched with conventional procedures for metallographic preparation of samples [32], to the purpose of further investigation in terms of residual porosity and Vickers microhardness, since a dependence of the mechanical properties as a function of the processing conditions must be assumed.
Porosity has been evaluated in size and amount by an image processing approach: i.e., ten micrographs of 1.20 mm × 0.90 mm size of random sections, orthogonal to the building direction, have been acquired and an algorithm has been implemented to automatically detect the pores as dark spots over a bright surface, based on image segmentation. The number of pores, the corresponding average size, and the residual areal porosity have been computed.
To investigate the effect on the mechanical properties, Vickers testing has been conducted on transverse section, orthogonal to the building direction again; an indenting load of 300 gf has been used for a dwell period of 10 s; specifically, five random cross-sections have been considered, an indentation pattern of 16 tests in a 4 × 4 indentation matrix has been set, a 0.5 mm step has been allowed between adjacent indentations, in compliance with ISO standard [34] for hardness testing on metals. Special care has been taken for the position of indentation in case of significant pore amount, to skip the voids and effectively test the metal.
3. Results and Discussion
3.1. Surface Roughness and Texture
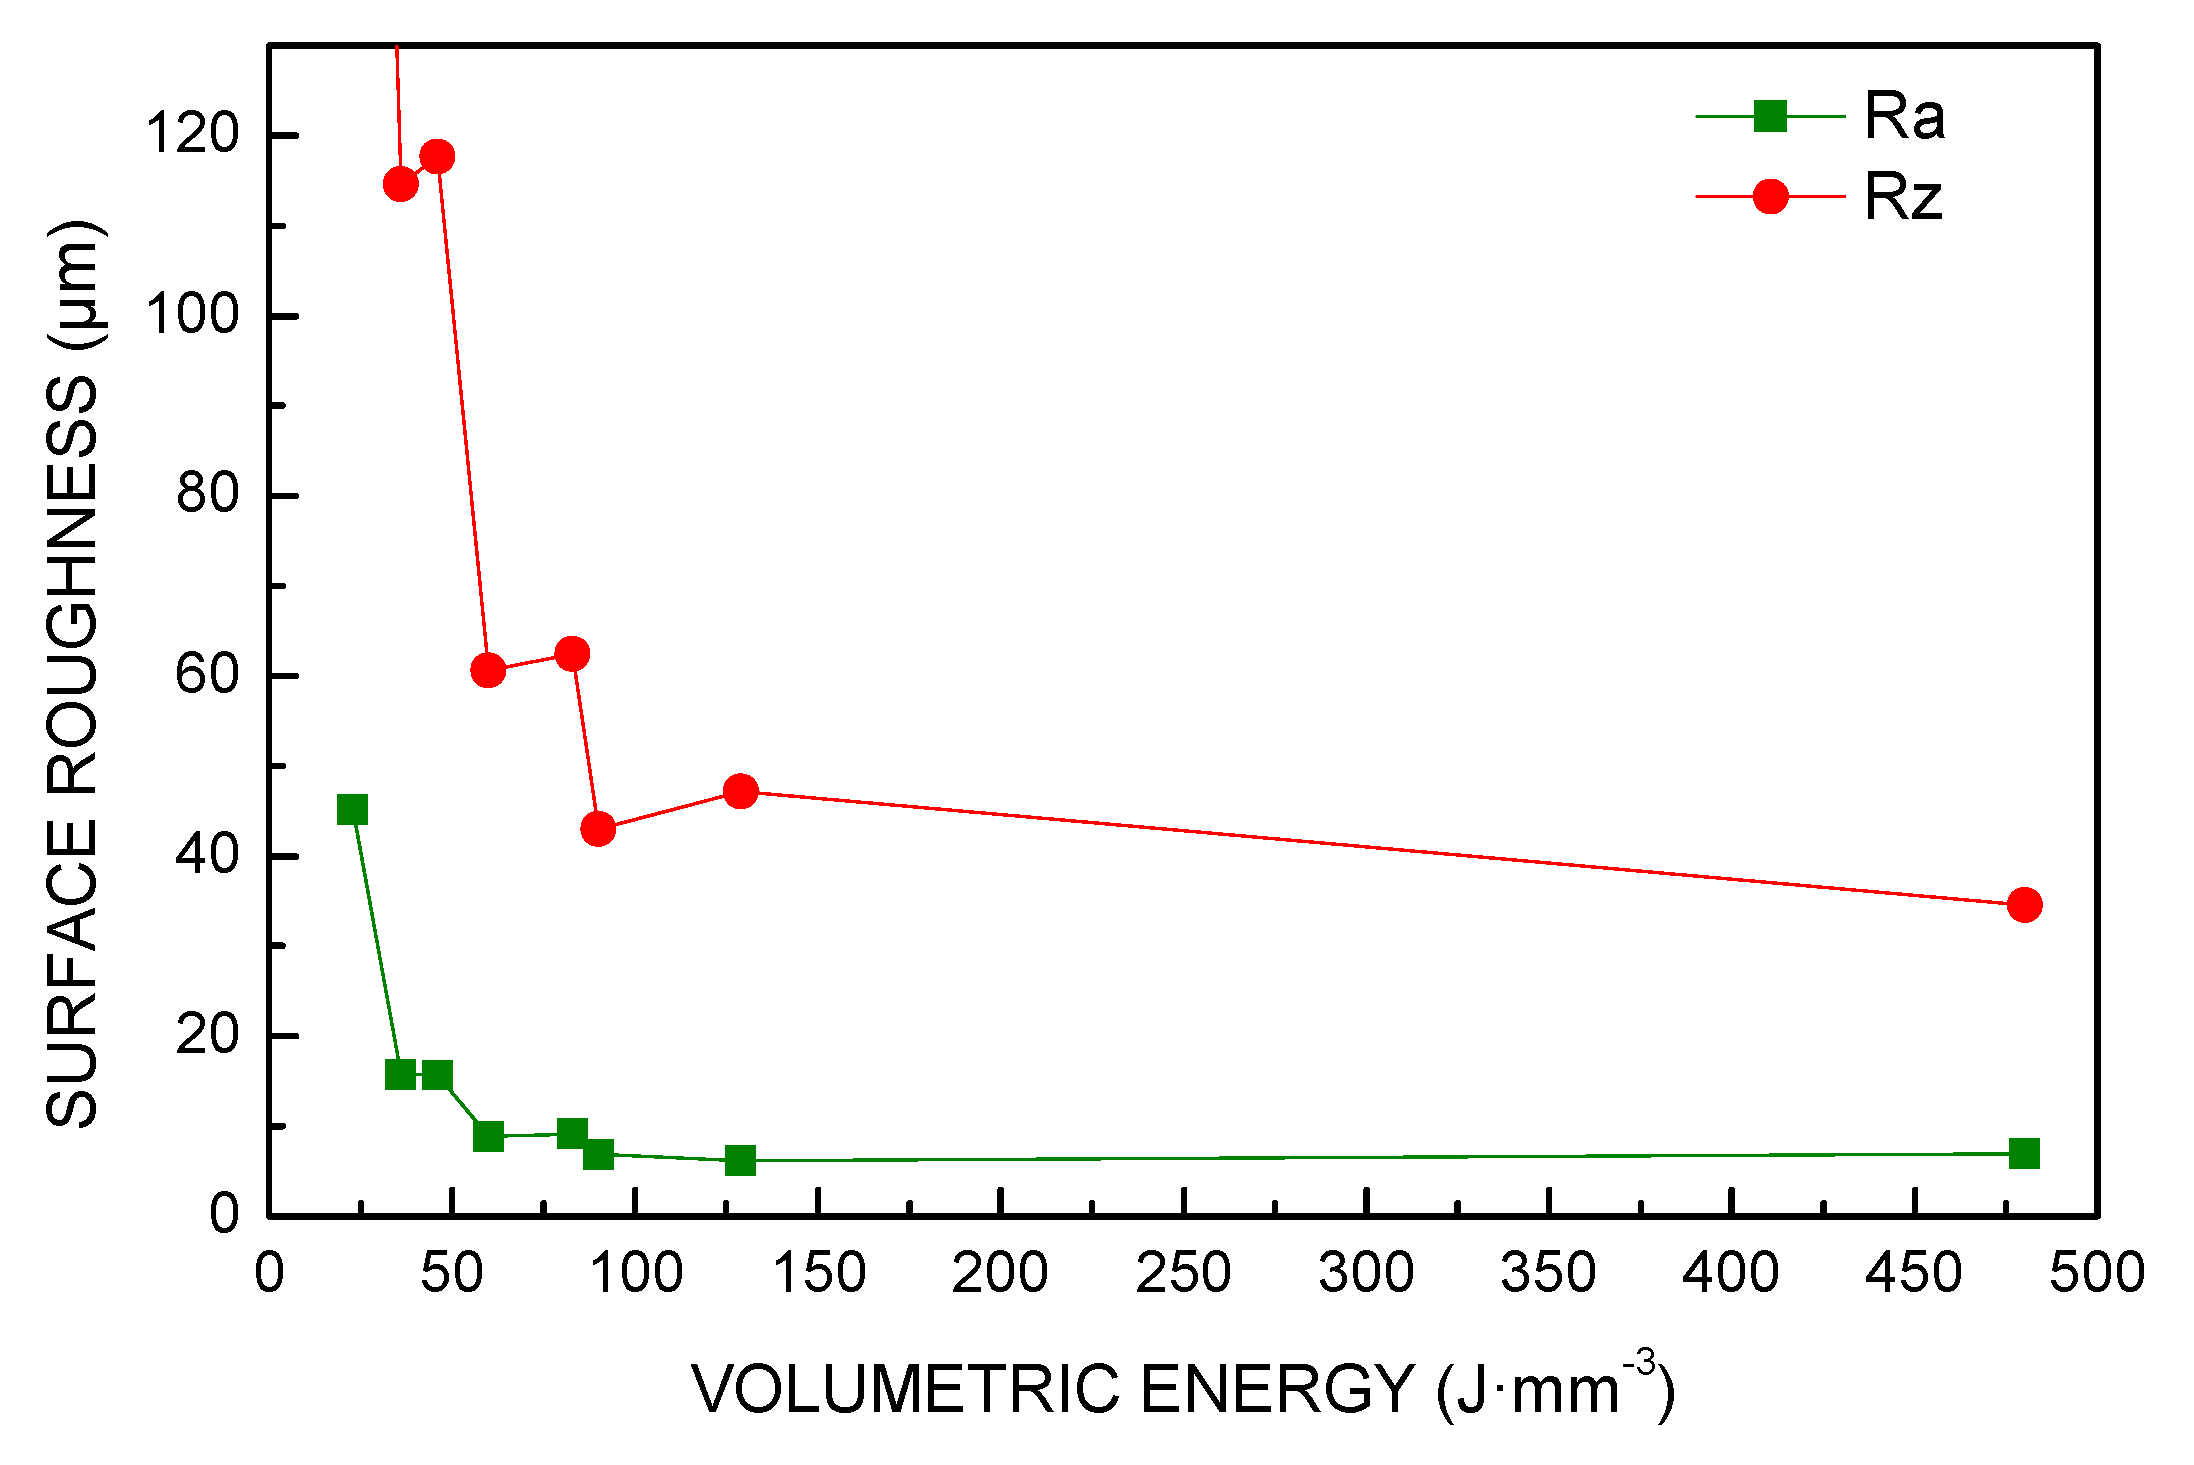
The mean values of roughness and peak-to-valley height, mean Ra and Rz respectively, have been referred to characterize the surface topography for each processing condition. At first, no densification occurred with the lowest level of VED of the plan; the powder was sintered but not fully melted, resulting in the highest roughness.
As regarding the other conditions, effective densification was obtained; interestingly, for each given condition, any dependence of the mean roughness on the direction of probe can be discarded and ascribed to the experimental error; therefore, one may assume that the surface pattern is uniform and the lay resulting from manufacturing is negligible over a surface parallel to the building plate. This is crucial to the purpose of considering a single, average value for the surface roughness (Table 2). Two main findings are displayed. The first one, as-built roughness in LPBF is lower compared to polishing and surface finishing [35] for a given expected dimensional accuracy of 0.01 mm. The second one, any increase of VED yields a reduction of roughness (Figure 2).
Nevertheless, exceeding VED over a threshold of approximately 90 J·mm−3 provided no gain. Indeed, based on the visual inspections on the exposed surface, additional findings must be reported. For example, ridges and dimples result at contour when improper processing conditions are set, i.e., as a consequence of high VED (Figure 3); these are prevented in a condition of balanced heat input of 90 J·mm−3 (Figure 4), instead.
Contour ridges are thought to be a major source of imperfections as they may lead to failure of the building process due to delamination of the part or improper layering of the powder; moreover, balling may even occur in condition of low energy per unit volume, due to surface tension hindering proper wetting [36], thus producing unwanted inhomogeneities such as agglomerated particles and dimples [5]. During building, these defects may easily degenerate in porosity, as discussed in the following.
3.2. Fractional Density
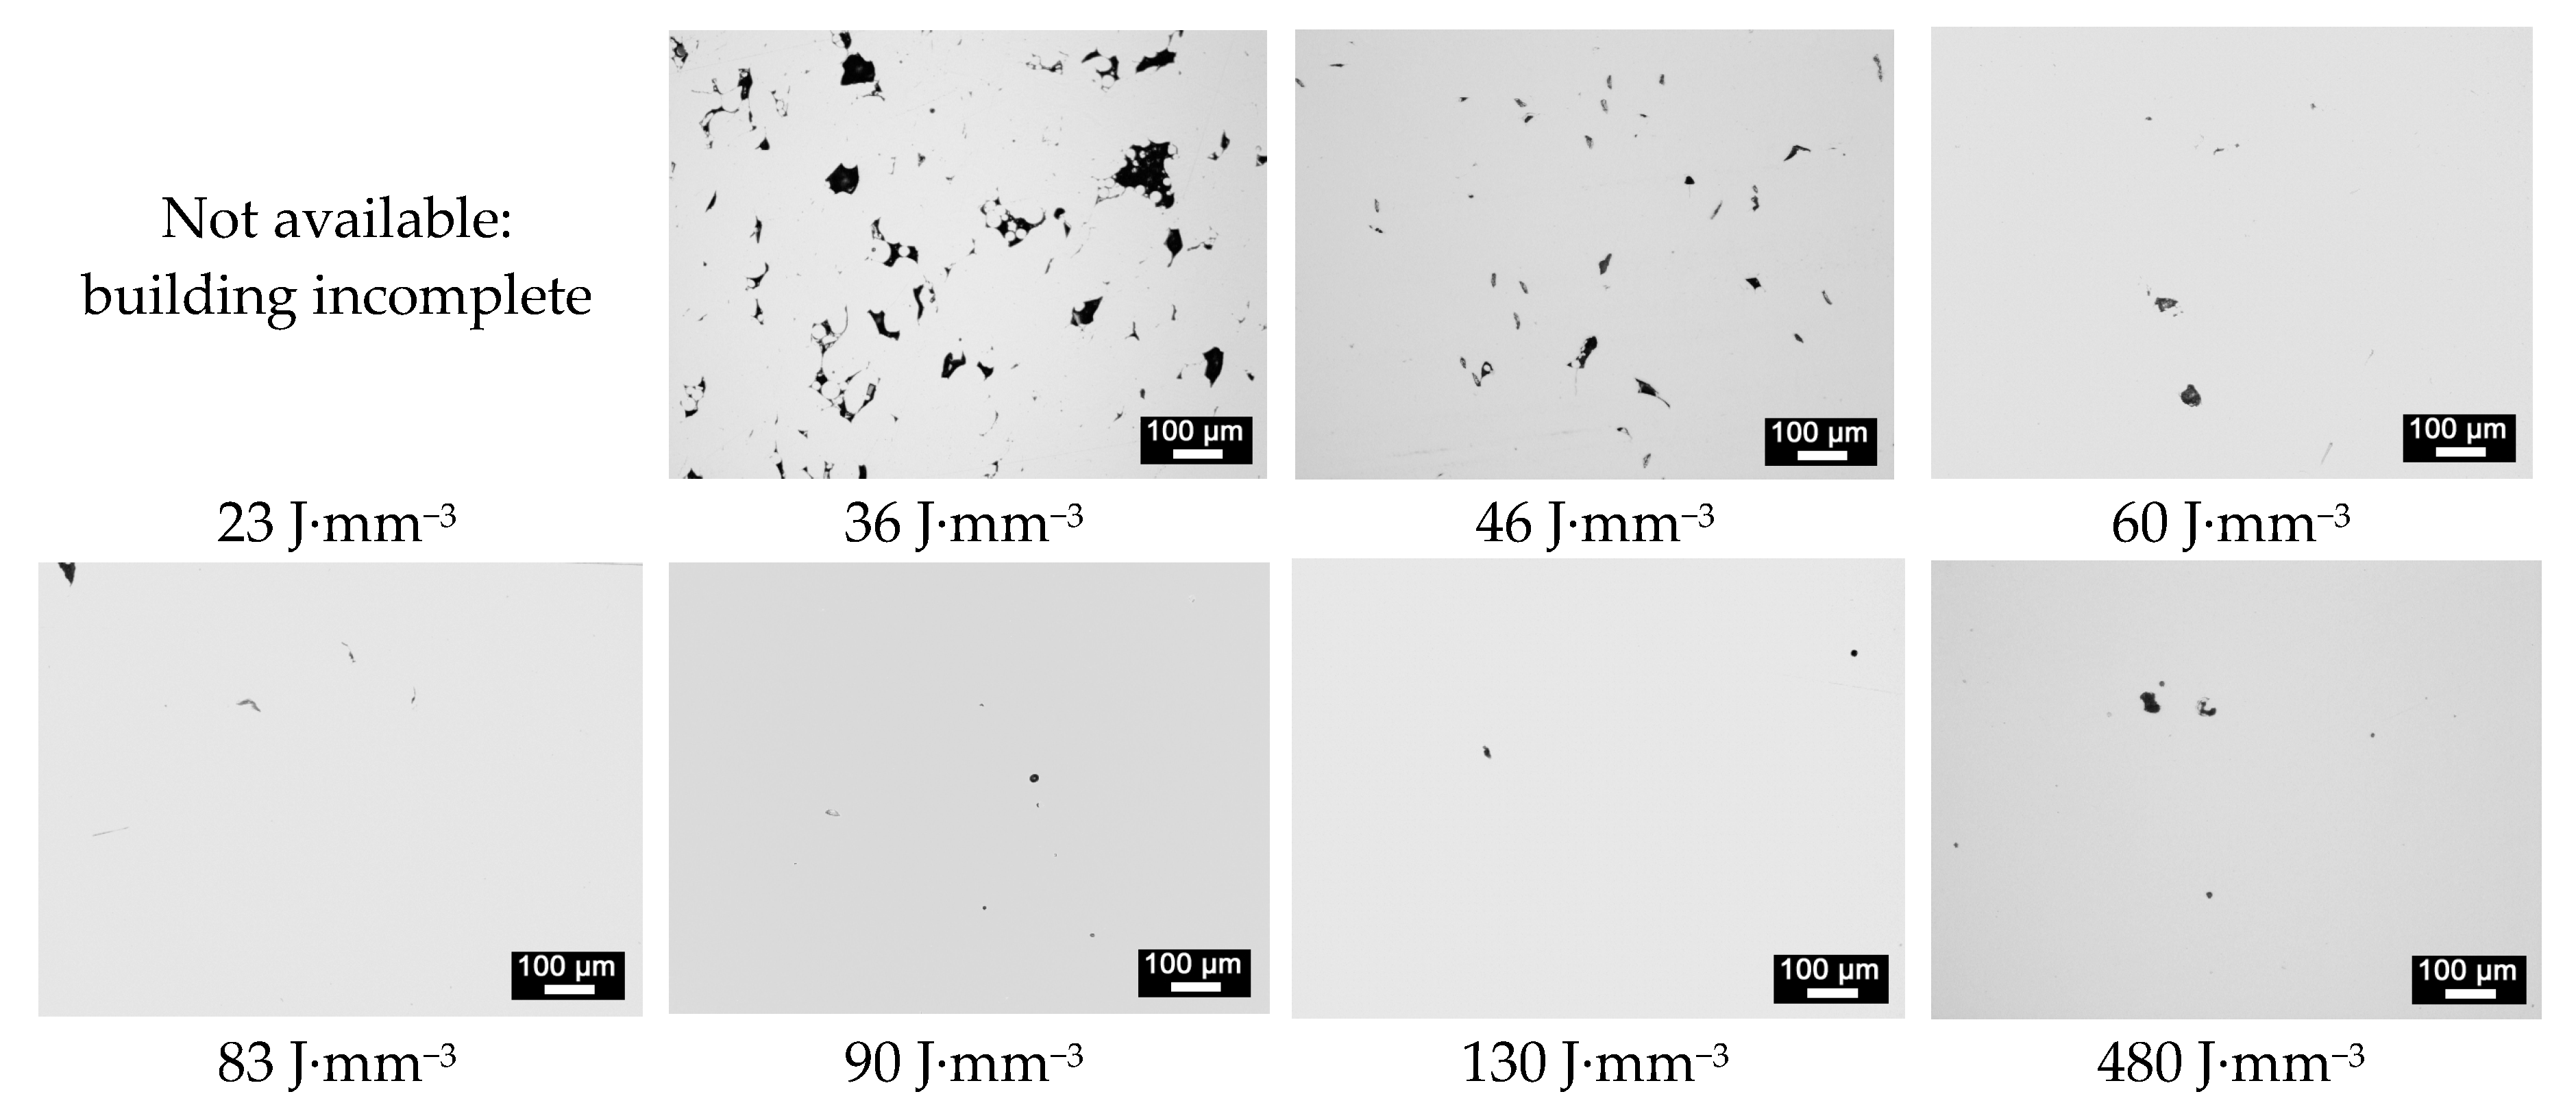
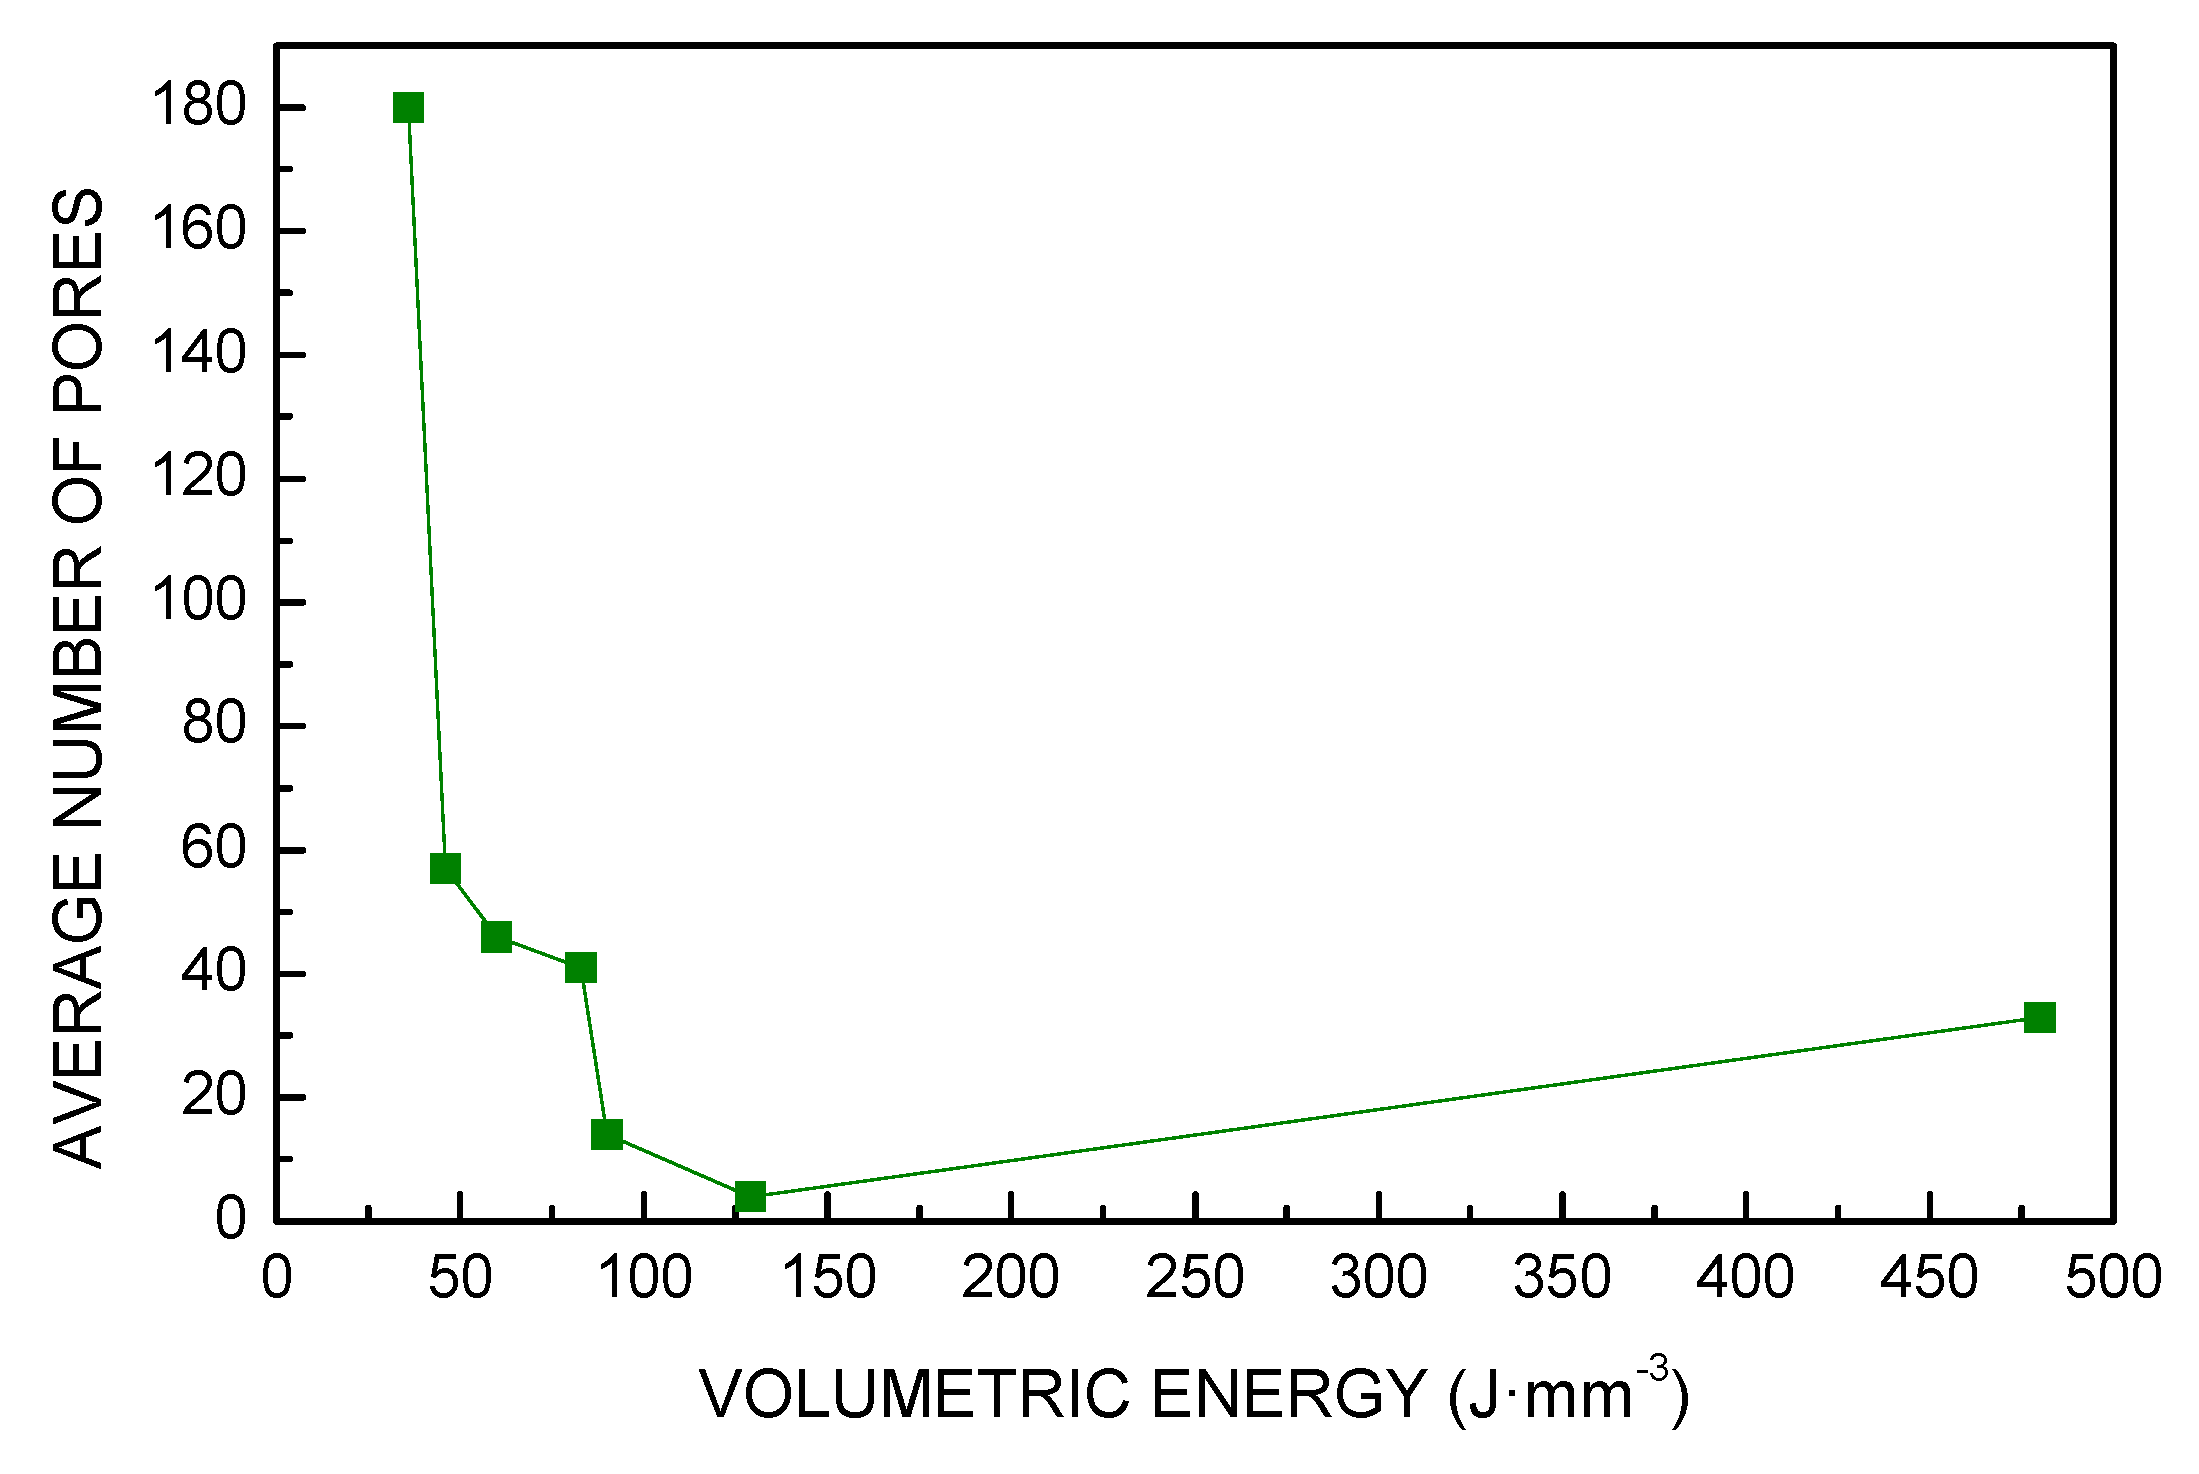
VED relates to fractional density. Indeed, the total number of pores, their shape and average size are affected (Figure 5). An extreme condition of low heat input resulted in larger, irregular pores where even bits of loose powder locate inside, due to reduced densification rates; conversely, increasing VED was favorable to decrease the average number of pores, their average size and the overall void fraction (Table 3).
The same trend was found for these responses (Figure 6, Figure 7 and Figure 8): in fact, a 86% reduction of the void fraction, due to both reduced number of pores and decreased pore size, was observed as a consequence of a 67% increase of VED; the trend is taken until a critical threshold yielding a slower rate of densification. Indeed, energy input ranging from 60 to 130 J·mm−3 resulted in additional improvements in a measure of 72%; nevertheless, further increase of VED may be detrimental: interestingly, an increase of the void fraction is found for VED of 480 J·mm−3 and must be ascribed to specific defects of layer inhomogeneities, as discussed via visual inspections of the contour of the cross-section.
In agreement with similar findings in the literature [30], an exponential law can be assumed for the fractional density ρ intended as the complement of the residual porosity to 100%:
The calibration parameters a, b, and c mainly depend on the particle-size distribution of the powder, although an additional effect could be expected depending on the layering tool. Specifically, a denotes the maximum possible theoretical fractional density, whereas b and c directly depend on the densification rate; all of them must be evaluated on a case-by-case basis. In this case-study, for VED in joule per cubic millimeters, the model yields:
A 0.7% absolute error is offered by the model in predicting the actual fractional density (Figure 9); the value of the tap density of the powder is approached for null VED; the reliability of the model is lost when failures or balling are produced.
3.3. Microhardness
The mechanical properties are expected to be directly dependent on the processing conditions. At first, the formation of pores reduced the overall strength of the part; secondly, different microstructures are formed. Although each given processing condition yields uniform microhardness over random cross-sections, orthogonal to the building plate, a clear dependence on VED is in place (Table 4, Figure 10).
High frequency of pores for low VED (i.e., 36 J·mm−3), prevented proper testing of the base metal; indeed, the average size of the indentation is larger than the average distance between adjacent pores, therefore lower hardness resulted here. As regarding the other conditions, each indentation is made on full metal, therefore one may assume the values are not affected by the occurrence of porosity, but only by the microstructure which depends on the cooling rate in different processing conditions. Specifically, lower cooling rates due to increased level of energy per unit volume resulted in coarser grains. Otherwise, fine grains were obtained when lower energy was applied. In the range from 50 to 100 J·mm−3, considering the extent of the error bars, one may assume that microhardness is not affected by VED.
4. Statistical Analysis
4.1. Assessment of Normality Assumption
Many statistical procedures rely on population normality of the experimental data. Therefore, using a normality test to determine whether to reject this assumption can be an important step in the data analysis. In this paper, the assumption of normality was tested with the Anderson-Darling and the Ryan-Joiner methods. The former compares the empirical cumulative distribution function of the sample data with the expected distribution if the data were normal; the latter assesses the normality by calculating the correlation between the data and the normal scores of the data. If the correlation coefficient is near 1, the population is likely to be normal. The approach is similar to the Shapiro-Wilk normality test [37]. The assumption of normality of data was verified for surface roughness, porosity, fractional density, and microhardness.
The best p-value out of the two tests and the range of VED for the data used in the test are given (Table 5): the lower the p-value, the less the probability that data come from a normal population; i.e., the tests reject the hypothesis of normality when the p-value is less than or equal to a cut-off value which has been set to 0.05, as common practice among researchers.
Apart from the size of pores, the hypothesis of normality was verified positively in the range of VED between 60 and 480 J·mm−3. In this range, the properties of the parts made by Inconel 718 laser powder bed fusion can be predicted using a gaussian distribution of given population parameters (Table 6). As regarding the range between 36 and 60 J·mm−3, the process is hindered by imperfect adhesion of the particles, therefore the adaptation to normality is affected.
4.2. Analysis of Variance
Based on the results, a dependence on the VED is inferred for each of the responses. The analysis of variance (ANOVA) can be used as a definitive exploratory tool to explain the differences in the experimental results. In fact, these can depend either on the experimental error or the explored variable. In the latter case, it is said that the experimental variable has statistical significance, which means that the observed variation is not incidental [37]. The p-value of the investigated responses versus VED has been evaluated (Table 7); since the p-value is a measure of the level to reject the significance of the variable in the explanations of the results, the conclusion is that VED is significant for LPBF of Inconel 718, in a range where normality is matched for the responses.
5. Conclusions
In this paper, the volumetric energy density relevance to the laser powder bed fusion process was studied. The main findings are listed as follows.
- The increase of the volumetric energy density up to a threshold of approximately 90 J·mm−3 results in improved surface features with reduced roughness below 1 µm and fractional density up to 99.97%, with negligible effect on the overall microhardness.
- A critical threshold yielded a slower rate of densification and may degenerate in collapse or delamination of the part, due to ridges and dimples in the cross-section.
- Although it may fail in representing the physics of the process, the volumetric energy density has statistical significance in explaining the variation in the observed experimental results.
- If the VED has statistical significance, it can be used confidently for the process design and optimization, at least in the range of normality for part-quality parameters.
Author Contributions
Conceptualization, methodology, resources, writing—review and editing, supervision, and project administration. F.C.; software and writing—original draft preparation V.A.; investigation and visualization, F.C., V.A.; formal analysis, data curation, and validation, G.C. All authors have read and agreed to the published version of the manuscript.
Funding
This research received no external funding.
Acknowledgments
The Authors gratefully acknowledge Paolo Argenio for his valuable contribution in technical operations for characterization of the samples.
Conflicts of Interest
The authors declare no conflict of interest.
References
- Gibson, I.; Rosen, D.; Stucker, B. Additive Manufacturing Technologies: 3D Printing, Rapid Prototyping, and Direct Digital Manufacturing; Springer-Verlag New York: New York, NY, USA, 2014. [Google Scholar]
- Caiazzo, F.; Cardaropoli, F.; Alfieri, V.; Sergi, V.; Cuccaro, L. Experimental analysis of selective laser melting process for Ti-6Al-4V turbine blade manufacturing. In Proceedings of the XIX International Symposium on High-Power Laser Systems and Applications, Istanbul, Turkey, 10–14 September 2012. [Google Scholar]
- Usera, D.; Alfieri, V.; Caiazzo, F.; Argenio, P.; Corrado, G.; Ares, E. Redesign and manufacturing of a metal towing hook via laser additive manufacturing with powder bed. Procedia Manuf. 2017, 13, 825–832. [Google Scholar] [CrossRef]
- Kumar, S. Selective Laser Sintering/Melting. Compr. Mater. Process. 2014, 10, 93–134. [Google Scholar]
- Depond, P.J.; Guss, G.; Ly, S.; Calta, N.P.; Deane, D.; Khairallah, S.; Matthews, M.J. In situ measurements of layer roughness during laser powder bed fusion additive manufacturing using low coherence scanning interferometry. Mater. Des. 2018, 154, 347–359. [Google Scholar] [CrossRef]
- Caggiano, A.; Zhang, J.; Alfieri, V.; Caiazzo, F.; Gao, R.; Teti, R. Machine learning-based image processing for on-line defect recognition in additive manufacturing. CIRP Ann. 2019, 68, 451–454. [Google Scholar] [CrossRef]
- Kluczyński, J.; Śnieżek, L.; Grzelak, K.; Mierzyński, J. The Influence of Exposure Energy Density on Porosity and Microhardness of the SLM Additive Manufactured Elements. Materials 2018, 11, 2304. [Google Scholar]
- Khorasani, A.M.; Gibson, I.; Awan, U.S.; Ghaderi, A. The effect of SLM process parameters on density, hardness, tensile strength and surface quality of Ti-6Al-4V. Addit. Manuf. 2019, 25, 176–186. [Google Scholar] [CrossRef]
- Calignano, F. Design optimization of supports for overhanging structures in aluminum and titanium alloys by selective laser melting. Mater. Des. 2014, 64, 203–213. [Google Scholar] [CrossRef]
- Montgomery, C.; Farnin, C.; Mellos, G.; Brand, M.; Pacheco, R.; Carpenter, J. Effect of gas shield on surface finish of laser powder bed produced parts. In Proceedings of the 29th Annual International Solid Freeform Fabrication Symposium, Austin, TX, USA, 13–15 August 2018. [Google Scholar]
- Aboulkhair, N.T.; Everitt, N.M.; Ashcroft, I.; Tuck, C.; Tuck, C. Reducing porosity in AlSi10Mg parts processed by selective laser melting. Addit. Manuf. 2014, 1, 77–86. [Google Scholar] [CrossRef]
- Gu, H.; Gong, H.; Pal, D.; Khalid Rafi, H.; Starr, T.; Stucker, B. Influences of Energy Density on Porosity and Microstructure of Selective Laser Melted 17-4PH Stainless Steel. In Proceedings of the 24th Annual International Solid Freeform Fabrication Symposium, Austin, TX, USA, 12–14 August 2013. [Google Scholar]
- Alfieri, V.; Cardaropoli, F.; Caiazzo, F.; Sergi, V. Investigation on porosity content in 2024 aluminum alloy welding by Yb:YAG disk laser. Adv. Mat. Res. 2012, 383–390, 6265–6269. [Google Scholar] [CrossRef]
- Caiazzo, F.; Alfieri, V.; Corrado, G.; Argenio, P. Laser powder-bed fusion of Inconel 718 to manufacture turbine blades. Int. J. Adv. Manuf. Technol. 2017, 93, 4023–4031. [Google Scholar] [CrossRef] [Green Version]
- Fousova, M.; Vojtěch, D.; Doubrava, K.; Daniel, M.; Lin, C.-F. Influence of Inherent Surface and Internal Defects on Mechanical Properties of Additively Manufactured Ti6Al4V Alloy: Comparison between Selective Laser Melting and Electron Beam Melting. Materials 2018, 11, 537. [Google Scholar] [CrossRef] [Green Version]
- Kunze, K.; Etter, T.; Grasslin, J.; Shklover, V. Texture, anisotropy in microstructure and mechanical properties on IN738LC alloy processed by selective laser melting (SLM). Mater. Sci. Eng. A 2014, 620, 213–222. [Google Scholar] [CrossRef]
- Calignano, F. Investigation of the accuracy and roughness in the laser powder bed fusion process. Virtual Phys. Prototyp. 2018, 13, 97–104. [Google Scholar] [CrossRef]
- Alfieri, V.; Argenio, P.; Caiazzo, F.; Sergi, V. Reduction of Surface Roughness by Means of Laser Processing over Additive Manufacturing Metal Parts. Materials 2017, 10, 30. [Google Scholar] [CrossRef] [Green Version]
- Baicheng, Z.; Xiaohua, L.; Jiaming, B.; Muiling, N.; Guojun, Q.; Chen-Nan, S.; Junfeng, G.; Pan, W.; Jun, W. Study of selective laser melting (SLM) Inconel 718 part surface improvement by electrochemical polishing. Mater. Des. 2017, 116, 531–537. [Google Scholar] [CrossRef]
- Fox, J.C.; Moylan, S.P.; Lane, B.M. Effect of Process Parameters on the Surface Roughness of Overhanging Structures in Laser Powder Bed Fusion Additive Manufacturing. Procedia CIRP 2016, 45, 131–134. [Google Scholar] [CrossRef] [Green Version]
- Sing, S.; An, J.; Yeong, W.; Wiria, F. Laser and electron-beam powder-bed additive manufacturing of metallic implants: A review on processes, materials and designs. J. Orthop. Res. 2016, 34, 369–385. [Google Scholar] [CrossRef]
- Traini, T.; Mangano, C.; Sammons, R.; Mangano, F.; Macchi, A.; Piattelli, A. Direct laser metal sintering as a new approach to fabrication of an isoelastic functionally graded material for manufacture of porous titanium dental implants. Dent. Mater. 2008, 24, 1525–1533. [Google Scholar] [CrossRef]
- Liverani, E.; Toschi, S.; Ceschini, L.; Fortunato, A. Effect of selective laser melting (SLM) process parameters on microstructure and mechanical properties of 316L austenitic stainless steel. J. Mater. Process. Technol. 2017, 249, 255–263. [Google Scholar] [CrossRef]
- Choo, H.; Sham, K.-L.; Bohling, J.; Ngo, A.; Xiao, X.; Ren, Y.; Depond, P.J.; Matthews, M.J.; Garlea, E. Effect of laser power on defect, texture, and microstructure of a laser powder bed fusion processed 316L stainless steel. Mater. Des. 2019, 164, 107534. [Google Scholar] [CrossRef]
- Kaynak, Y.; Kitay, O. Porosity, Surface Quality, Microhardness and Microstructure of Selective Laser Melted 316L Stainless Steel Resulting from Finish Machining. J. Manuf. Mater. Process. 2018, 2, 36. [Google Scholar] [CrossRef] [Green Version]
- Campanelli, S.; Casalino, G.; Contuzzi, N.; Ludovico, A. Analysis of the molten/solidified zone in selective laser melted parts. In Proceedings of the SPIE—The International Society for Optical Engineering, San Francisco, CA, USA, 1–6 February 2014. [Google Scholar]
- Cherry, J.; Davies, H.; Mehmood, S.; Lavery, N.; Brown, S.; Sienz, J. Investigation into the effect of process parameters on microstructural and physical properties of 316L stainless steel parts by selective laser melting. Int. J. Adv. Manuf. Technol. 2015, 76, 869–879. [Google Scholar] [CrossRef] [Green Version]
- Ciurana, J.; Hernandez, L.; Delgado, J. Energy density analysis on single tracks formed by selective laser melting with CoCrMo powder material. Int. J. Adv. Manuf. Technol. 2013, 68, 1103–1110. [Google Scholar] [CrossRef]
- Andani, M.T.; Dehghani, R.; Karamooz-Ravari, M.R.; Mirzaeifar, R.; Ni, J. Spatter formation in selective laser melting process using multi-laser technology. Mater. Des. 2017, 131, 460–469. [Google Scholar] [CrossRef]
- Simchi, A.; Pohl, H. Effects of laser sintering processing parameters on the microstructure and densification of iron powder. Mater. Sci. Eng. A 2003, 359, 119–128. [Google Scholar] [CrossRef]
- Bertoli, U.S.; Wolfer, A.J.; Matthews, M.J.; Delplanque, J.-P.R.; Schoenung, J.M. On the limitations of Volumetric Energy Density as a design parameter for Selective Laser Melting. Mater. Des. 2017, 113, 331–340. [Google Scholar] [CrossRef] [Green Version]
- Reed, R. The Superalloys, Fundamentals and Applications; Cambridge University Press: Cambridge, UK, 2006. [Google Scholar]
- Geometrical Product Specifications (GPS)—Surface texture: Profile Method—Terms, Definitions and Surface Texture Parameters; ISO 4287:1997; International Organization for Standardization: Geneva, Switzerland, 1 April 1997.
- Metallic Materials—Vickers Hardness Test—Part 1—Test Method; EN ISO 6507-1; International Organization for Standardization: Geneva, Switzerland, 15 December 2005.
- Schey, J. Tribology in Metalworking: Friction, Lubricating and Wear; ASM International: Materials Park, OH, USA, 1983. [Google Scholar]
- Maamoun, A.H.; Xue, Y.F.; Elbestawi, M.A.; Veldhuis, S.C. Effect of Selective Laser Melting Process Parameters on the Quality of Al Alloy Parts: Powder Characterization, Density, Surface Roughness, and Dimensional Accuracy. Materials 2018, 11, 2343. [Google Scholar] [CrossRef] [Green Version]
- Montgomery, D.; Runger, G. Applied Statistics and Probability for Engineers; John Wiley & Sons, Inc.: Danvers, MA, USA, 2014. [Google Scholar]
Figure 1.
Scheme of the directions of the laser beam in scanning and hatching over a surface.

Figure 2.
Surface roughness as a function of VED.

Figure 3.
Ridges and dimples at the contour of the cross-section, for VED of 480 J·mm−3.

Figure 4.
Contour of the cross-section for VED of 90 J·mm−3.

Figure 5.
Micrographs of random cross-sections for each condition of VED.

Figure 6.
Number of pores as a function of VED.

Figure 7.
Size of pores as a function of VED.

Figure 8.
Void fraction as a function of VED.

Figure 9.
Actual vs predicted fractional density as a function of VED.

Figure 10.
Vickers microhardness as a function of VED.


Table 1.
Processing conditions of LPBF for given layer thickness of 20 µm.
| Power (W) | Speed (mm·s−1) | Hatch distance (mm) | VED (J·mm−3) |
|---|---|---|---|
| 100 | 2400 | 0.09 | 23 |
| 155 | 2400 | 0.09 | 36 |
| 100 | 1200 | 0.09 | 46 |
| 155 | 1200 | 0.11 | 60 |
| 100 | 1200 | 0.05 | 83 |
| 195 | 1200 | 0.09 | 90 |
| 155 | 1200 | 0.05 | 130 |
| 195 | 400 | 0.05 | 480 |
Table 2.
Mean values of roughness with corresponding dispersion for each processing condition.
| VED (J·mm−3) | Mean roughness Ra (µm) | Peak-to-valley height Rz (µm) | ||
|---|---|---|---|---|
| Average | Std. Deviation | Average | Std. Deviation | |
| 23 | 45.12 | 2.78 | 285.96 | 29.89 |
| 36 | 15.82 | 0.97 | 114.56 | 5.75 |
| 46 | 15.77 | 1.92 | 117.65 | 13.57 |
| 60 | 8.92 | 1.37 | 60.57 | 13.80 |
| 83 | 9.08 | 0.21 | 62.38 | 7.04 |
| 90 | 6.84 | 0.12 | 43.04 | 0.42 |
| 130 | 6.22 | 0.83 | 47.17 | 8.10 |
| 480 | 6.99 | 0.56 | 34.62 | 3.79 |
Table 3.
Average number of pores, size, and void fraction with corresponding dispersion.
| VED (J·mm−3) | Number of Pores | Size of Pores (µm) | Void Fraction (%) | |||
|---|---|---|---|---|---|---|
| Average | Std. Deviation | Average | Std. Deviation | Average | Std. Deviation | |
| 36 | 180 | 22 | 5.02 | 0.45 | 4.88 | 0.57 |
| 46 | 57 | 21 | 3.20 | 0.93 | 0.69 | 0.40 |
| 60 | 46 | 51 | 1.63 | 0.95 | 0.11 | 0.10 |
| 83 | 41 | 42 | 1.65 | 1.21 | 0.12 | 0.07 |
| 90 | 14 | 2 | 1.73 | 0.49 | 0.05 | 0.03 |
| 130 | 4 | 4 | 2.19 | 1.80 | 0.03 | 0.04 |
| 480 | 33 | 8 | 4.35 | 0.32 | 1.07 | 0.35 |
Table 4.
Average size of indentation and microhardness with corresponding dispersion.
| VED (J·mm−3) | Size of the Indentation (µm) | Vickers Microhardness HV0.3 | ||
|---|---|---|---|---|
| Average | Std. Deviation | Average | Std. Deviation | |
| 36 | 41.8 | 1.0 | 319 | 9.9 |
| 46 | 40.4 | 0.5 | 341 | 8.5 |
| 60 | 40.7 | 0.5 | 336 | 12.3 |
| 83 | 40.1 | 0.7 | 346 | 10.5 |
| 90 | 40.2 | 0.6 | 345 | 10.7 |
| 130 | 41.9 | 1.0 | 316 | 11.5 |
| 480 | 43.9 | 1.1 | 290 | 15.6 |
Table 5.
Results of normality test and related range of VED.
| Response | p-Value | VED Range (J·mm−3) |
|---|---|---|
| Mean roughness Ra | 0.53 | 60–480 |
| Peak-to-valley height Rz | 0.05 | 60–480 |
| Number of pores | 0.10 | 60–480 |
| Size of pores | 0.01 | 60–480 |
| Microhardness | 0.36 | 60–480 |
Table 6.
Mean and standard deviation of each response for VED in the range 60–480 J·mm−3.
| Response | Mean | Standard Deviation |
|---|---|---|
| Mean roughness Ra (µm) | 7.65 | 1.57 |
| Peak-to-valley height Rz (µm) | 49.40 | 14.79 |
| Number of pores | 34.87 | 25.30 |
| Microhardness (HV) | 328.21 | 3.43 |
Table 7.
Results for the ANOVA to test the significance of VED in the range 60–480 J·mm−3.
| Response | p-Value |
|---|---|
| Mean roughness Ra | 0.000 |
| Peak-to-valley height Rz | 0.028 |
| Number of pores | 0.000 |
| Microhardness | 0.000 |
© 2020 by the authors. Licensee MDPI, Basel, Switzerland. This article is an open access article distributed under the terms and conditions of the Creative Commons Attribution (CC BY) license (http://creativecommons.org/licenses/by/4.0/).
Share and Cite
MDPI and ACS Style
Caiazzo, F.; Alfieri, V.; Casalino, G. On the Relevance of Volumetric Energy Density in the Investigation of Inconel 718 Laser Powder Bed Fusion. Materials 2020, 13, 538. https://doi.org/10.3390/ma13030538
AMA Style
Caiazzo F, Alfieri V, Casalino G. On the Relevance of Volumetric Energy Density in the Investigation of Inconel 718 Laser Powder Bed Fusion. Materials. 2020; 13(3):538. https://doi.org/10.3390/ma13030538
Chicago/Turabian StyleCaiazzo, Fabrizia, Vittorio Alfieri, and Giuseppe Casalino. 2020. "On the Relevance of Volumetric Energy Density in the Investigation of Inconel 718 Laser Powder Bed Fusion" Materials 13, no. 3: 538. https://doi.org/10.3390/ma13030538
Note that from the first issue of 2016, this journal uses article numbers instead of page numbers. See further details here.