High-Efficiency and Low-Damage Lapping Process Optimization


Laboratory of Science and Technology on Integrated Logistics Support, College of Intelligence Science and Technology, National University of Defense Technology, Changsha 410073, China
*
Author to whom correspondence should be addressed.
Materials 2020, 13(3), 569; https://doi.org/10.3390/ma13030569
Submission received: 4 December 2019
/
Revised: 18 January 2020
/
Accepted: 20 January 2020
/
Published: 24 January 2020
(This article belongs to the Special Issue Laser Materials Fabrication and Joining)
Abstract
:The silica opticsare widely applied in the modern laser system, and its fabrication is always the research focus. In the manufacturing process, the lapping process occurs between grinding and final polishing. However, lapping processes optimizations focus on decreasing the depth of sub-surface damage (SSD) or improving lapping efficiency individually. So, the optimum balance point between efficiency and damageshould be studied further. This manuscript establishes the effective removal rate of damage (ERRD)model, and the relationship between the ERRD and processing parameters is simulated. Then, high-efficiency, low-damage lapping processing routine is established based on the simulation. The correctness and feasibility are validated. In this work, the optimized method is confirmed that it can improve efficiency and decrease damage layer depth in the lapping process which promotes the development of optics in low-damage fabrication.
1. Introduction
Fused silica optics with excellent surface and sub-surface qualityare widely used in high power laser system [1]. For example, the system of National Ignition Facility (NIF) contains thousands of fused silica optics that precisely guide, reflect, amplify, and focus 192 laser beams onto a fusion target [2]. However, the laser induced-damage initiation on fused silica optics limits the performance of high-power laser applications [3]. In the previous study, some researchers have shown that sub-surface damage (SSD)is likely to be laser damage precursors [4]. It can cause laser damage susceptibility regionally, enhance laser absorption, and then introduce macroscopic damage to optics [5,6]. In order to avoid degradation of quality, SSD must be minimized or eliminated in the fabrication of optics.
The optical fabrication process mainly contains grinding, lapping and polishing.SSD is introduced in the grinding process and restrained in the following process [7,8,9]. Figure 1 illustrates the generation of SSD during manufacturing. To remove SSD in grinding processing, it needs to remove materials to 3~9 times of grinding abrasive size in the lapping process, which is time-consuming and inefficient [10]. For the lapping process, the material removal occurs into two types: brittle domain and plastic domain. The division of material removal domain is related to an external load and the properties of the material itself. In the brittle domain, cracks appear on the surface and materials are sheared off from substrate under the load, which can achieve higher material removal efficiency. Differently, materials are removed through the function of plastic flow in the plastic domain whose removal is relatively inefficient. In the previous study, a high-efficiency lapping process tends to increase the depth of SSD and delay the processing cycle since the material removal rate of final polishing is rather low. On the other hand, if processing efficiency is reduced to control SSD, more time would be consumed [11]. The main problem is that efficiency and SSD controlling are not balanced in the lapping process.
Buijs et al. had found that the energy required for material fracture removal was lower than that for plastic deformation, and the critical load of median cracks of fused silica was 0.02N through Vickersindentation experiment. A model was also established to predicted removal efficiency [12]. Lambropoulos et al. had proposed an interpretation of manufacturing featuresbased on the optical material removal micromechanical model, which could conduct the fabrication process [13]. More recently, Neauport et al. studied the effect of lapping parameters with different lapping slurries on roughness and SSD. After lapping under the optimal parameters (abrasive: Al2O3, grain size: 3 μm, lapping speed: 50 rpm, load: 2.8 kg), theroughness Rtof fused silica is 1.3 μm and SSD depth is 4.3 μm, while material removal rate was relatively small [14]. From above all the researches, they focused ondecreasing the depth of SSD or improving lapping efficiency individually.
To optimize the lapping process, a theoretical model is proposed and optimal lapping parameters are applied in the manufacture of optics. This work is organized as follows: Section 1 is Introduction. Section 2 presentsthe model and basic equation, which describes the establishment of the remove rate model, subsurface defect model and the effective removal rate of damage (ERRD) model in detail. Section 3 is the simulation while Section 4 is the experimental validation. Section 5 is the conclusion of the work. In general, the theoretical model and the optimal lapping parameters can be a reference on high-efficiency, low-damage optics fabrication.
2. Model and Basic Equation
2.1. Remove Rate Model and Subsurface Defect Model
In reality, as shown in Figure 2, the material is often removed by a combination of various mechanical mechanisms [15]. This co-existence of mechanisms is believed to be caused by non-uniform depth of penetrations among abrasives. Usually, abrasives with large sizes would embed in both the workpiece surface and lapping plate, bear the load, and then remove the materials from the workpiece along withthe motion of the lapping plate. Conversely, abrasives with small size adhere to the surface, which can not achieve effective material removal.It should be noted that cracks appeared along with material removal (brittle domain) when an external load is large enough. Meanwhile, smaller hardness of lapping plate or workpiece would promote the function of rolling of abrasives and finally achieves three-body machining. Considering the hardness of iron lapping plate and external load, the model focuses on three-body and brittle machining [11].
In the three-body and brittle lapping process, the force borne by the single abrasive can be defined as in Equation (1) [15,16].
where α is geometric constant depends on the abrasive shape, it can be calculated as α; = 4∙tan2ψ, ψ is the sharpness angle of abrasive; x is the size of abrasive; g is the gap between workpiece and lapping plate; Hw is the hardness of workpiece; Hp is the hardness of lapping plate.
The total load F can be expressed as Equation (2).
where φ(x) is bounded lognormal distribution; N is the total number of abrasive, it can be calculated by Equation (3) [17].
where A is the contact area between lapping plate and workpiece; ρa and ρl is the density of abrasive particles and lapping slurry respectively; m is the weight ratio of abrasive particles in lapping slurry.
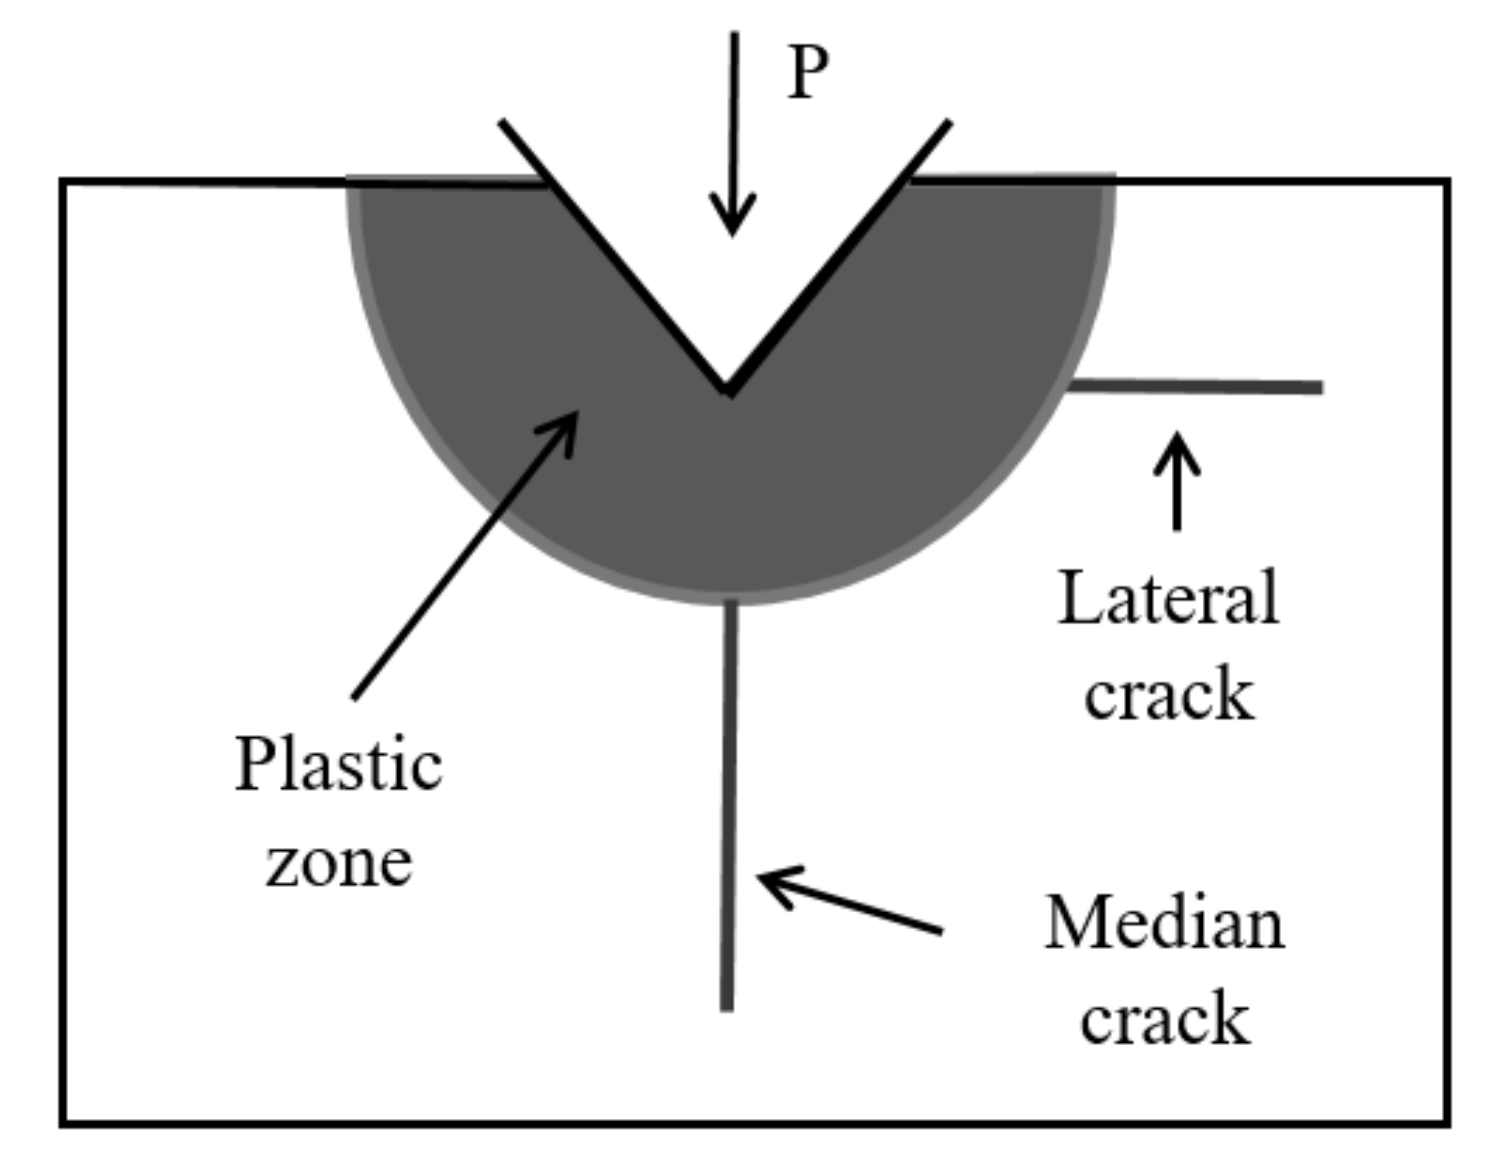
Some researchers have derived theoretical equations of median crack depth and lateral crack depth, based on indentation of sharp indenter [18]. Figure 3 illustrates the crack systems under indentation.
According to previous study, the depth of SSD is equal to that of median crack Cm, and it can be written as Equation (4).
where Ew is the elastic modulus; Hw is the hardness of material; αk is a dimensionless constant, which can be defined as αk = 0.027 + 0.090(m-1/3), the value of m is 0.5; F is the load that lapping plate exerts; K is thedynamic fracture toughness related to the properties of materials.
The lateral crack is related to the removal rate, the length CL can be defined as Equation (5).
where ξ is a constant which can be obtained through experiment; M is a geometrical constant, M = 0.75.
The material removal rate (MRR) can be expressed as Equation (6).
where V is abrasive velocity; n is the effective number of abrasive, which can be written as:
2.2. ERRD Model
The optimization of efficiency and SSD are two important targets inthe lapping process. However, they cannot be achieved at the same time, because of lacking in theoretical analysis. To quantify the efficiency and SSD, the ERRD model isproposed. It can be expressed as follows:
where K is ERRD, its unit is μm/min; H is removal depth in lapping process, its unit is μm; t is processing time, its unit is min;S is the area of surface, its unit is mm2; MRR is the volume removal efficiency in lapping process, its unit is μm3/min.
It should be noted that SSD represents the length of the median crack. In order to simplify the calculation, we use the damage depth to replace it, and its unit is μm.
The ERRD model can be used to find the balance point between SSD and removal efficiency. According to Equations (8) and (9), the value of ERRD is positively related to material removal rate under the same condition of SSD. Moreover, it shows negative correlation between ERRD and removal rate under the same condition of removal efficiency, according to Equation (10). The optimization of SSD and removal efficiency could refer to the ERRD model.
3. Simulations
The factors affecting removal efficiency and SSD in the lapping process mainly include abrasive, pressure and lapping velocity [19]. To optimize efficiency and control the depth of SSD, the relationship between ERRD and these factors were analyzed.
- (1)
- Abrasive
The type and particle size are two key factors thataffect the efficiency and depth of SSD [20]. In this work, different abrasive types and particle sizes are chosen to simulate.
The processing parameters are set as: 40 mm lapping tool size, 0.1 MPa lapping pressure, and 120 rpm lapping velocity. The relationship between ERRD and abrasive can be obtained from simulation, as shown in Figure 4.
Based on the results, it can be concluded that: (1) ERRD value of diamond abrasive is 1.5~3 times of silicon carbide (SiC)with the same particle size, except for W2.5 and W7. (2) Both curves of ERRD increase firstly and then reduce. (3) The largest ERRD value of silicon carbide (SiC)achieves when particle size is W7 (7 μm), while that of diamond is W20 (20 μm).
- (2)
- Pressure
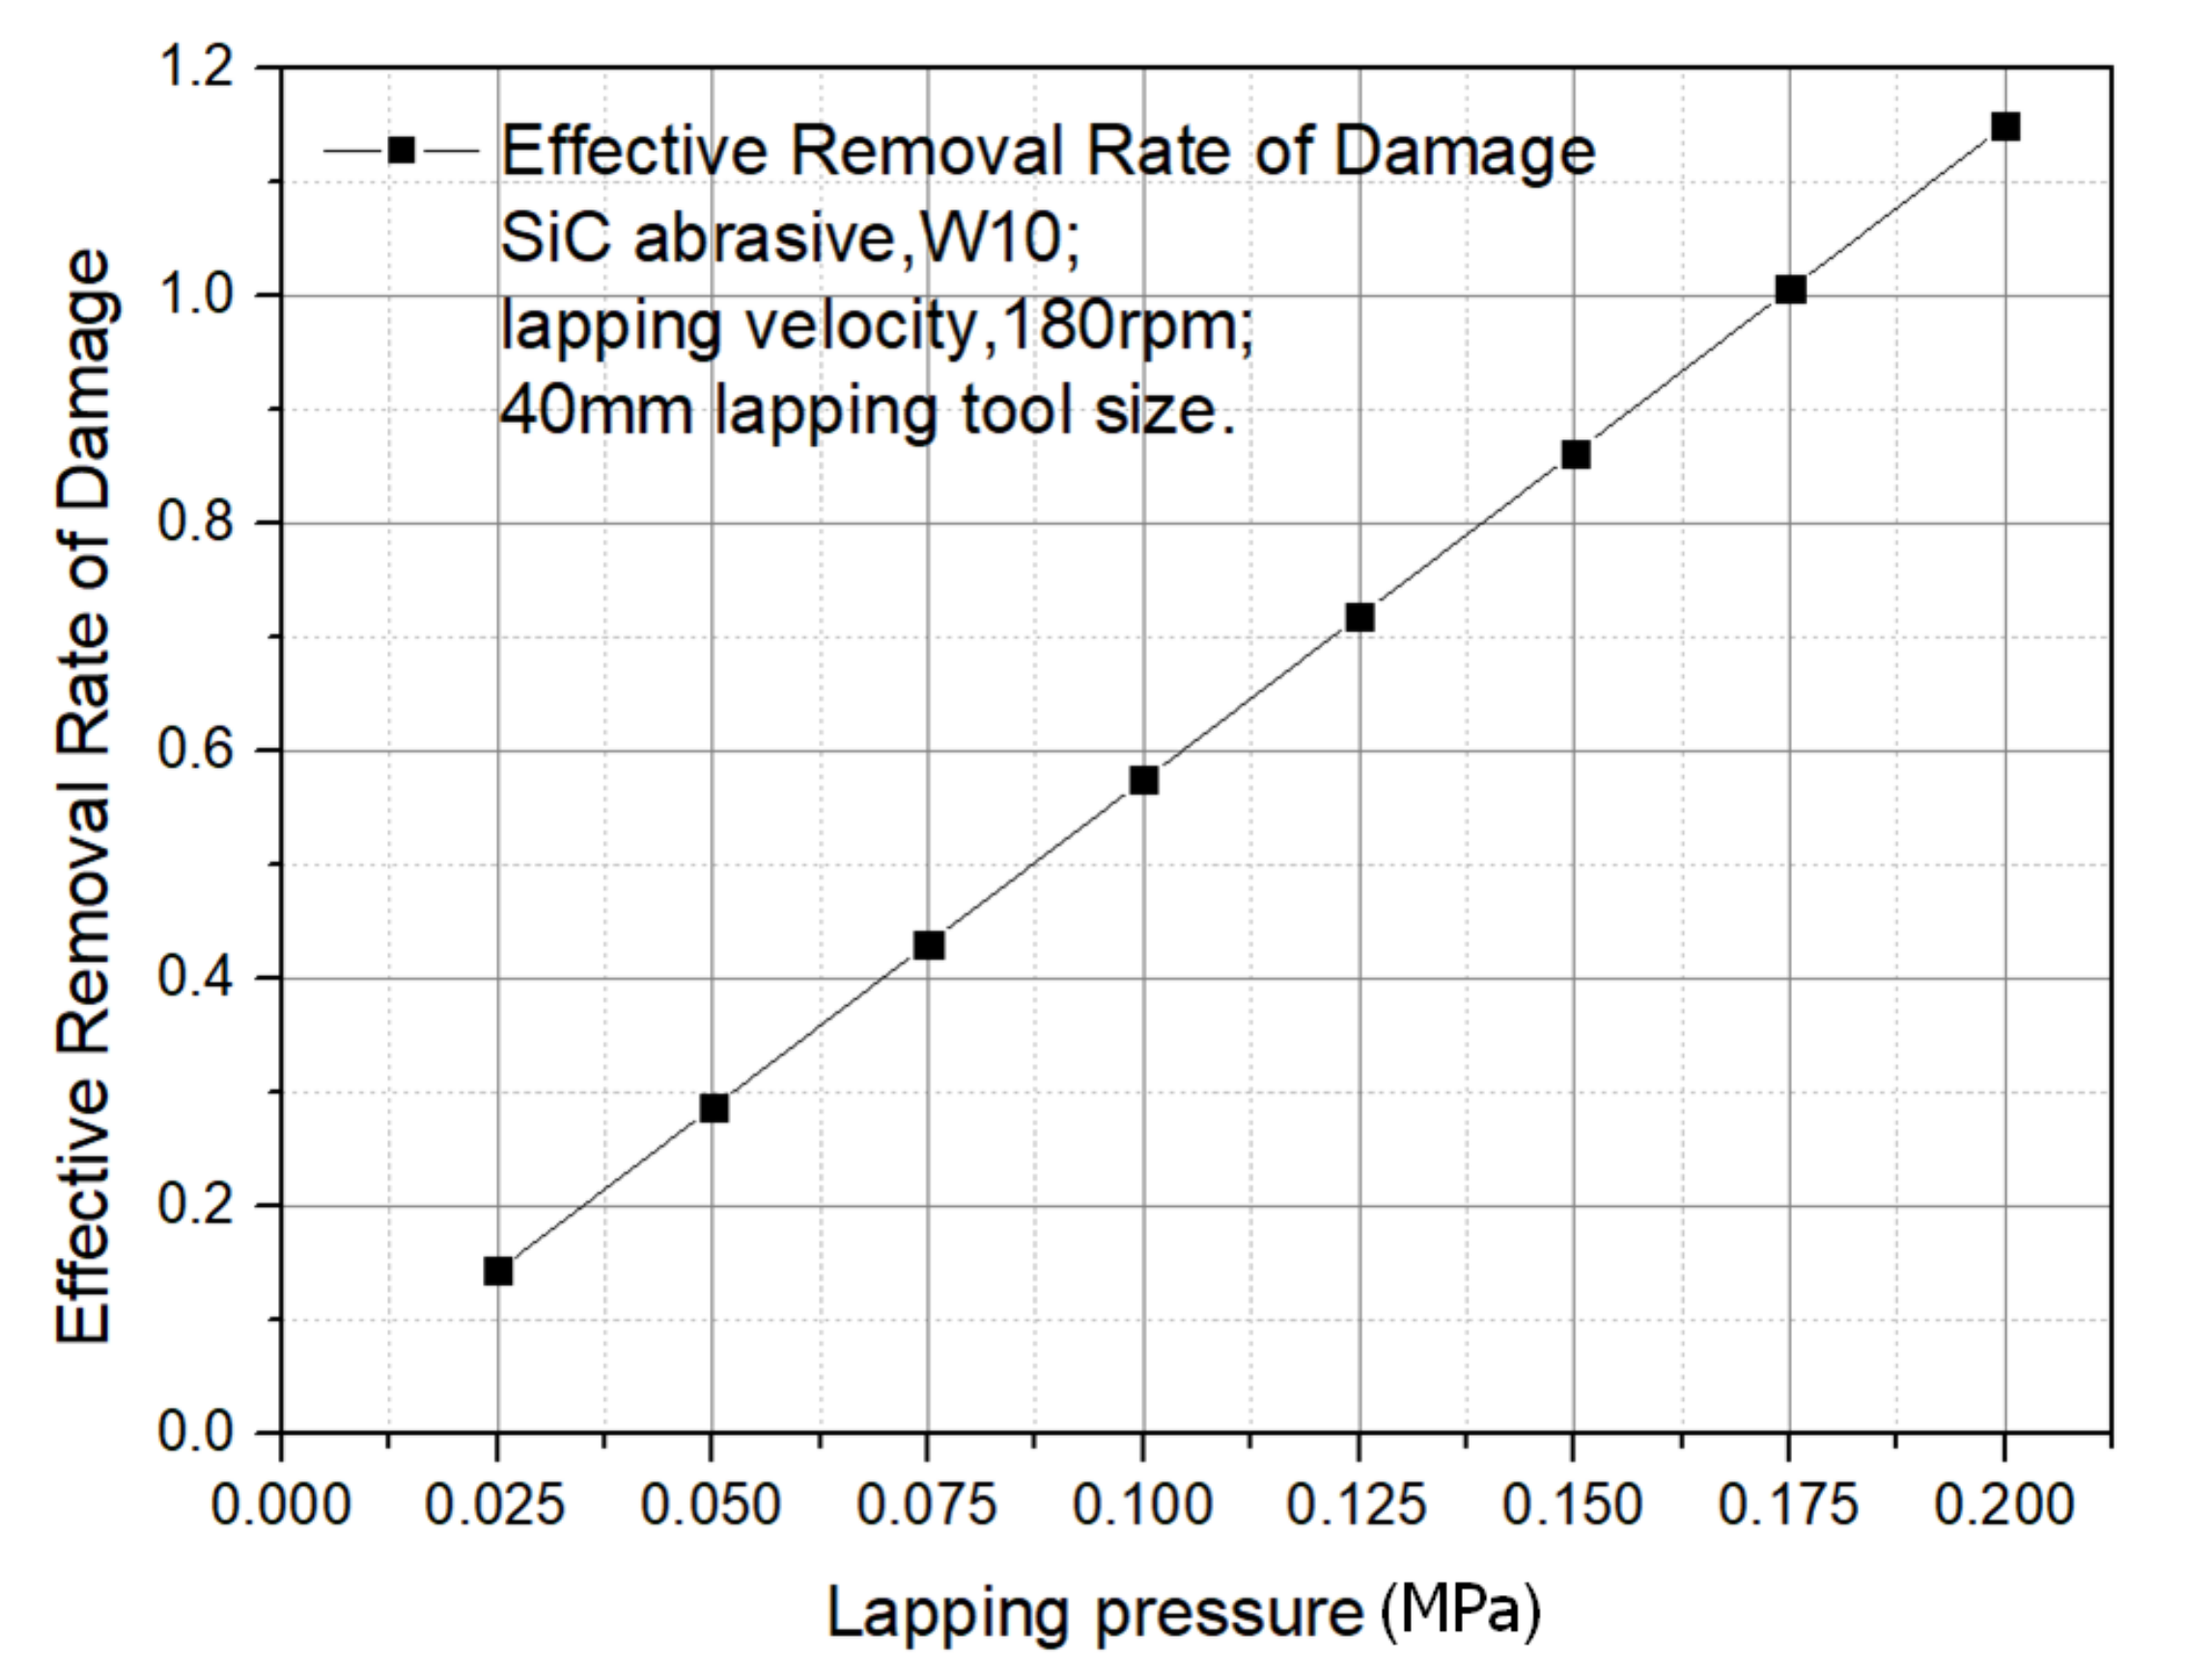
The processing parameters are set as:40 mm lapping tool size, silicon carbide abrasive, W10 abrasive, and 180 rpm lapping velocity.The relationship between ERRD and lapping pressure can be obtained from the results, as shown in Figure 5. It can be seen ERRD is linear with lapping pressure, which means that large pressure tends to improve ERRD under the conditions of stable process parameters.
- (3)
- Velocity
The process parameters are 40 mm lapping tool size, silicon carbide abrasive, W10 abrasive, and 0.2 MPa lapping pressure.
The relationship between the ERRD and lapping velocity can be obtained from Figure 6. According to the result, ERRD is nonlinear with lapping velocity. When lapping velocity beyond 90 rpm, the value of ERRD grows faster.
4. Experimental Validation
- (1)
- Validation of simulation parameters
After the ERRD model is established, we carried out a verification experiment to verify the accuracy of the model. In the verification experiment, abrasives with different particle sizeswereused as verified objects. Corining 7980 fused silica samples (size: 10 mm × 10 mm, number: 7) wereused as the materials, concentration of lapping slurry is 5%, lapping velocity is 120 rpm, 0.2 MPa lapping pressure, and 200 μm material removal depth. The results are shown in Figure 7.
According to the results shown in Figure 7, ERRD (effective removal rate of damage) of SiC abrasive washigher than that of diamond abrasive under the same conditions. In Figure 7a, the values of simulation results werelower than experimental results, whichwerecontrary to the results shown in Figure 7b. For Figure 7a, the highest ERRD occurredwhen 10 μmSiC abrasiveswereused, and its value was0.55 μm/min. For Figure 7b, the highest ERRD value was 0.33 μm/min, while the diamond abrasive size 10 μm. Though the experiment results weredifferent from the simulation, their trends werethe same. In consideration of ERRD, 10 μmSiC abrasives can be applied in the lapping process. (14 μm diamond abrasive is not applied in the experiment because of the limitation of resource in our team). Afterwards, the lapping velocity is regarded as the object and the result is shown in Figure 8.
In Figure 8, the trend of experimental results is the same as that of simulation results. According to Equation (10), a higher material removal rate (MRR) would improve the value of ERRD. Limited by the performance of the machine tool, the lapping velocity can be set at 180 rpm. It should be noted that the processing environment, conditions of lapping slurry and other factors may influence experimental results.
- (2)
- Validation of rough and fine lapping process.
The simulation in Section 3 and Section 4.(1) provides references to optimize lapping parameters. In the actual lapping process, lapping pressure needs to be controlled strictly.Excessive pressure would push the lappingslurry out of the lapping area and make direct contact between the lappingplate and thesurface [21].Limited by machine tool, the velocity is not more than 180 rpm. According to Figure 4, W20 diamond abrasive and W7 SiC abrasive are utilized in the experiment. The parameters are all listed in Table 1. The total material removal amount in Process A and Process B are the same asthe conventional lapping process.
Three Corning 7980 fused silica sampleswith 100 mm × 100 mm (sample 1–4) wereprepared on a single side polishing machine. Sample 1waslapped by the conventional process.Sample 2 and sample 3werelapped by processesA and B, respectively. Sample 4 waslapped by a rough and fine lapping process. Then, four samples werepolished by the MRF wedge method, and the damage depth wasmeasured by the microscope.
As shown in Figure 9, cracks existed on the initial surface, and theiramount reduces when the polishing depth increases. The cracks almost disappear when the polishing depth increases to 18.76 μm. Therefore, the damage depth of sample 1 should be 18.76 μm.
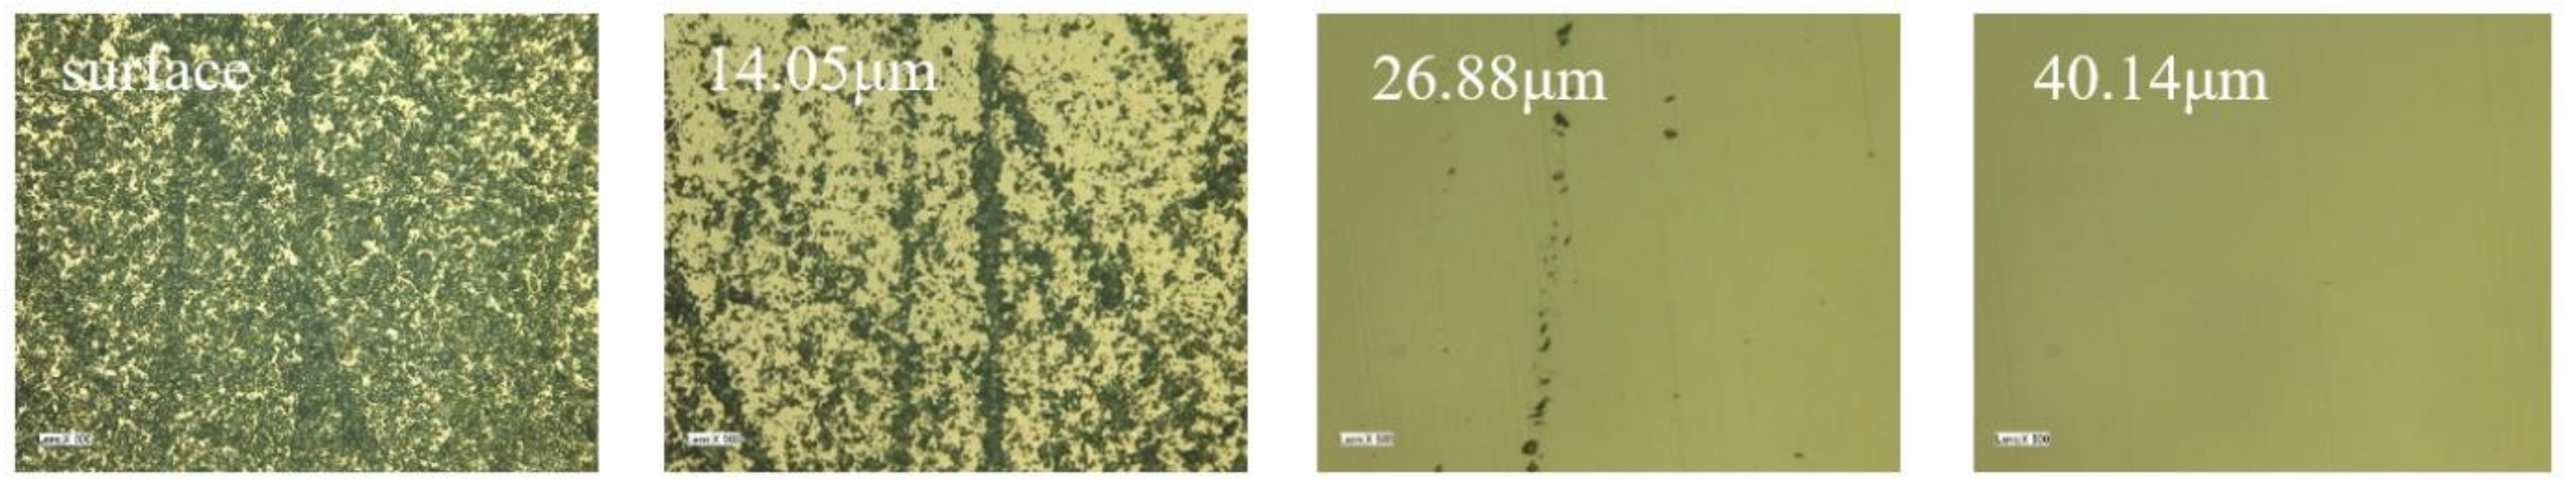
The results of sample 2 show thatcracks reduce when depth increases, see Figure 10. However, it still exists at the depth of 26.88 μm where cracksalready disappear on sample 1. Therefore, we keep on lapping, and the cracks disappear at the depth of 40.14 μm. As shown in Figure 11, it can be clearly seen that the damage depth of sample 3 is 6.83 μm. Compared with the conventional lapping process, process B can significantly decrease the depth of SSD.
The detailed results listed in Table 2 are to evaluate the effect under different lapping parameters. We can find that the efficiency of process A is the highest among the three processes, while the SSD depth of process B is the shallowest.
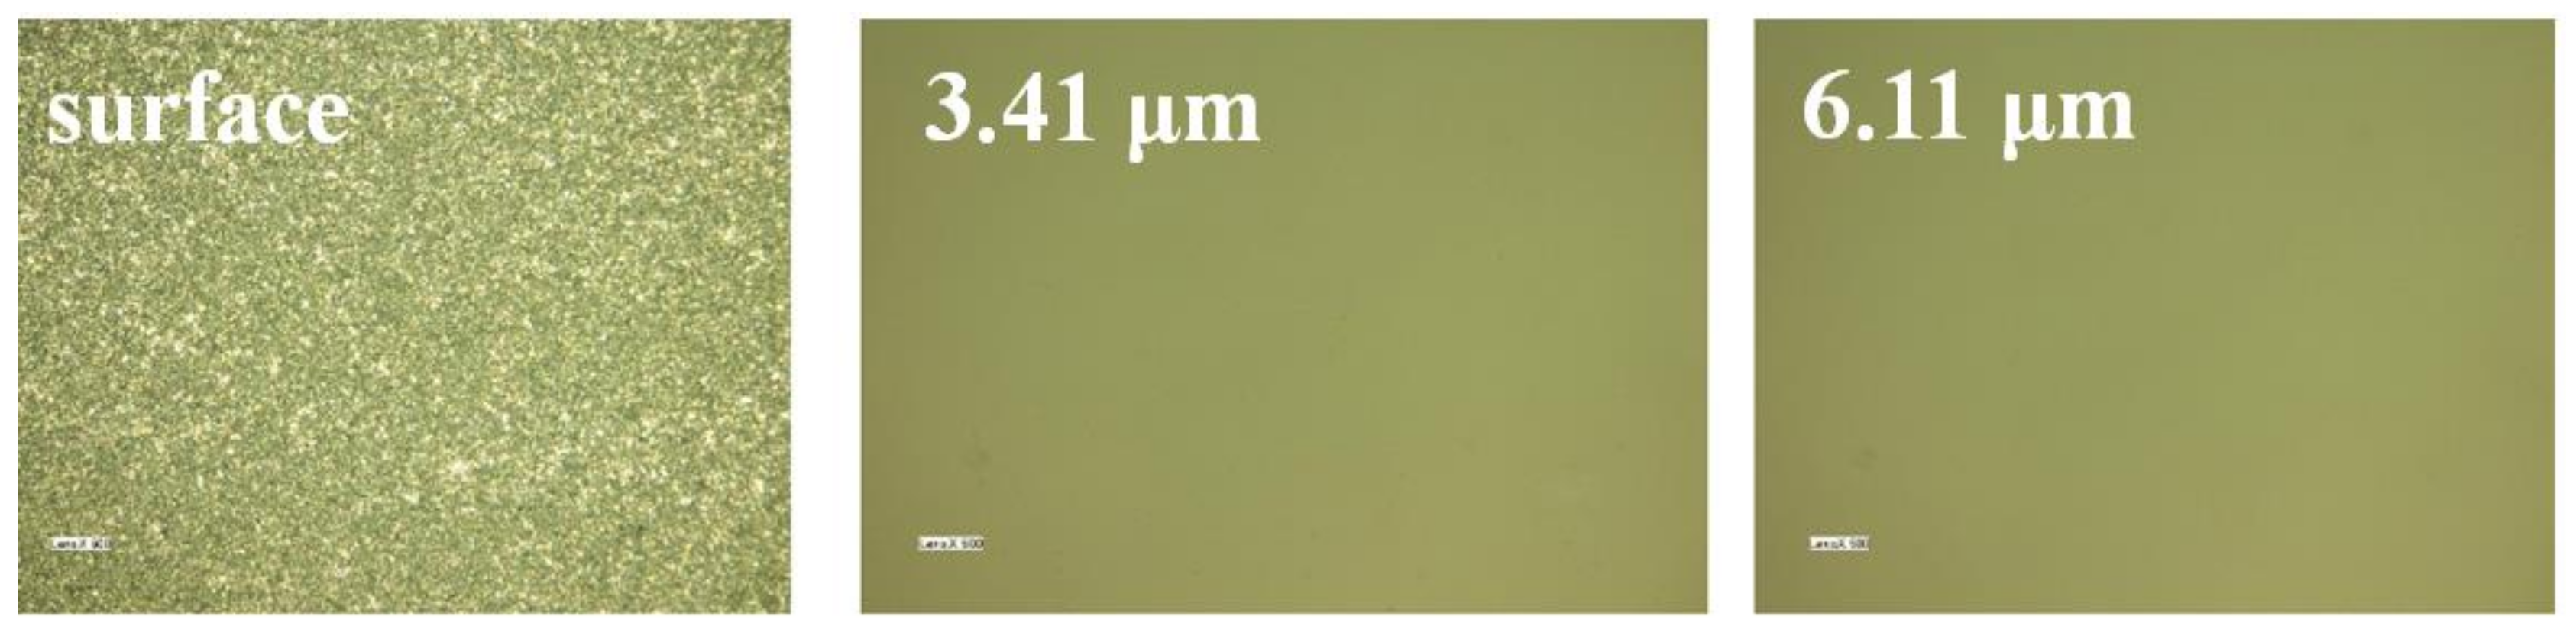
As shown in Table 3, we choose W20 diamond and W7 SiCas the rough lapping abrasive and fine lapping abrasive, respectively.Theremoval amount is 200 μm in rough lapping and 50 μm in fine lapping. The lapping pressure is 0.2 MPa and velocity is 180 rpm. Total lapping time is 3.1 h (2h rough lapping and 1.1 h fine lapping)and the lapping results are shown in Figure 12.
In Figure 12, the SSD depth of the sample is 6.11 μm after the lapping process. Compared with the conventional lapping process, the combination of rough and fine lapping processes was more efficient, which reduced lapping timeby 65% with the same material removal (250 μm).Meanwhile, the SSD depth reduces from 18.76 μm to 6.11 μm. The results demonstrated that rough and fine lapping can not only reduce SSD depth but also improve the removal efficiency.
5. Conclusions
In this work, the ERRD model is established to provide a theoretical reference about balancing lapping efficiency and SSD, the relationship between ERRD, abrasive type, abrasive size, pressure and velocity is simulated. Through the simulation, W7 SiC abrasive and W20 diamond abrasive can be applied in the lapping process, while lapping pressure needs to be controlled strictly. Limited by the performance of the machine tool, the lapping velocity is set at 180 rpm. Based on the simulation, the validation experiments are carried out. In the experiment, the optimal parameters are applied to rough lapping and fine lapping process. After lapping, the depth of SSD decreases from 18.76 μm to 6.11 μm and processing time decreased from 9 h to 3.1 h, reduces by 65% compared with conventional parameters. The results indicate that the optimum lapping process can not only improve efficiency but also reduce SSD depth. Therefore, the ERRD model and optimum lapping process can be applied in high-efficiency, low-damage lapping process optimization for high power laser optics.
Author Contributions
Conceptualization, F.S.; investigation, W.Z., Y.L.; methodology, C.S.; supervision, C.S.; validation, F.S.; visualization, Z.L.; writing—original draft, C.S.; Writing—review and editing, F.S. All authors have read and agreed to the published version of the manuscript.
Funding
This research was funded by the National Nature Science Foundation of China (NSFC) (No.51835013, No. 51675526, No.51775551).
Acknowledgments
Special thanks to scientistsof the Hunan Key Laboratory of Ultra-Precision Machining Technology, Hunan, China, for their support and technical assistance.
Conflicts of Interest
The authors declare no conflict of interest.
References
- Menapace, J.; Penetrante, B.; Miller, P.; Parham, T.; Nichols, M.; Peterson, J.; Golini, D. Combined advanced finishing and UV-laser conditioning for producing UV-damage-resistant fused silica optics. In Optical Fabrication and Testing; Optical Society of America: Washington, DC, USA, 2002. [Google Scholar]
- Campbell, J.H.; Hawley-Fedder, R.A.; Stolz, C.J.; Menapace, J.A.; Borden, M.R.; Whitman, P.K.; Yu, J.; Runkel, M.J.; Riley, M.O.; Feit, M.D.; et al. NIF optical materials and fabrication technologies: an overview. In Optical Engineering at the Lawrence Livermore National Laboratory II: The National Ignition Facility: International Society for Optics and Photonics; International Society for Optics and Photonics: Washington, DC, USA, 2004; pp. 84–101. [Google Scholar]
- Neauport, J.; Ambard, C.; Bercegol, H.; Cahuc, O.; Champreux, J.P.; Charles, J.L.; Cormont, P.; Darbois, N.; Darnis, P.; Destribats, J.; et al. Optimizing fused silica polishing processes for 351nm high-power laser application. In Laser-Induced Damage in Optical Materials; International Society for Optics and Photonics: Washington, DC, USA, 2008. [Google Scholar]
- Huang, J.; Zhou, X.; Liu, H.; Wang, F.; Jiang, X.; Wu, W.; Tang, Y.; Zheng, W. Influence of subsurface defects on damage performance of fused silica in ultraviolet laser. Opt. Eng. 2013, 52, 52024203. [Google Scholar] [CrossRef]
- Bloembergen, N. Role of cracks, pores, and absorbing inclusions on laser induced damage threshold at surfaces of transparent dielectrics. Appl. Opt. 1973, 12, 661–664. [Google Scholar] [CrossRef] [PubMed]
- Genin, F.Y.; Salleo, A.; Pistor, T.V.; Chase, L.L. Role of light intensification by cracks in optical breakdown on surfaces. JOSA A 2001, 18, 2607–2616. [Google Scholar] [CrossRef] [PubMed]
- Wang, Z.; Wu, Y.; Dai, Y.; Li, S. Subsurface damage distribution in the lapping process. Appl. Opt. 2008, 47, 1417–1426. [Google Scholar] [CrossRef] [PubMed]
- Suratwala, T.; Wong, L.; Miller, P.; Feit, M.D.; Menapace, J.; Steele, R.; Davis, P.; Walmer, D. Sub-surface mechanical damage distributions during grinding of fused silica. J. Non Cryst. Solids 2006, 352, 5601–5617. [Google Scholar] [CrossRef] [Green Version]
- Neauport, J.; Ambard, C.; Cormont, P.; Darbois, N.; Destribats, J.; Luitot, C.; Rondeau, O. Subsurface damage measurement of ground fused silica parts by HF etching techniques. Opt. Express 2009, 17, 20448–20456. [Google Scholar] [CrossRef] [PubMed]
- Lee, Y. Evaluating subsurface damage in optical glasses. J. Eur. Opt. Soc. Rapid Publ. 2011, 6. [Google Scholar] [CrossRef]
- Lin, Y.X.; Song, C.; Shi, F.; Li, S.Y. Modeling and simulation for effective removal rate of damage. In Pacific Rim Laser Damage 2017: Optical Materials for High-Power Lasers; International Society for Optics and Photonics: Washington, DC, USA, 2017; p. 103392B. [Google Scholar]
- Buijs, M.; Korpel-van Houten, K. Three-body abrasion of brittle materials as studied by lapping. Wear 1993, 166, 237–245. [Google Scholar] [CrossRef]
- Lambropoulos, J.C. Polishing rate of fused silica, compared to glasses BK7 and SF6. In Optifab 2003: Technical Digest; International Society for Optics and Photonics: Washington, DC, USA, 2003; p. 103140Q. [Google Scholar]
- Neauport, J.; Destribats, J.; Maunier, C.; Ambard, C.; Cormont, P.; Pintault, B.; Rondeau, O. Loose abrasive slurries for optical glass lapping. Appl. Opt. 2010, 49, 5736–5745. [Google Scholar] [CrossRef] [PubMed] [Green Version]
- Chang, Y.P.; Hashimura, M.; Dornfeld, D. An Investigation of Material Removal Mechanisms in Lapping with Grain Size Transition. J. Manuf. Sci. Eng. 2000, 122, 419. [Google Scholar] [CrossRef]
- Yao, P.; Wang, W.; Huang, C.Z.; Wang, J.; Zhu, H.T.; Kuriyagawa, T. Indentation Crack Initiation and Ductile to Brittle Transition Behavior of Fused Silica. Adv. Mater. Res. 2013, 797, 667–672. [Google Scholar] [CrossRef]
- Imanakam, O. Lapping mechanics of glass-especially on roughness of lapped surface. Ann. CIRP 1966, 23, 227–233. [Google Scholar]
- Lambropoulos, J.; Jacobs, S.D.; Ruckman, J. Material removal mechanisms from grinding to polishing. Ceram. Trans. 1999, 102, 113–128. [Google Scholar]
- Buijs, M.; Korpel-van Houten, K. A model for lapping of glass. J. Mater. Sci. 1993, 28, 3014–3020. [Google Scholar] [CrossRef]
- Bulsara, V.H.; Ahn, Y.; Chandrasekar, S.; Farris, T.N. Mechanics of polishing. J. Appl. Mech. 1998, 65, 410–416. [Google Scholar] [CrossRef]
- Evans, C.J.; Paul, E.; Dornfeld, D.; Lucca, D.A.; Byrne, G.; Tricard, M.; Klocke, F.; Dambon, O.; Mullany, B.A. Material removal mechanisms in lapping and polishing. CIRP Ann. 2003, 52, 611–633. [Google Scholar] [CrossRef] [Green Version]
Figure 1.
The schematic view of sub-surface damage (SSD) from grinding to polishing.
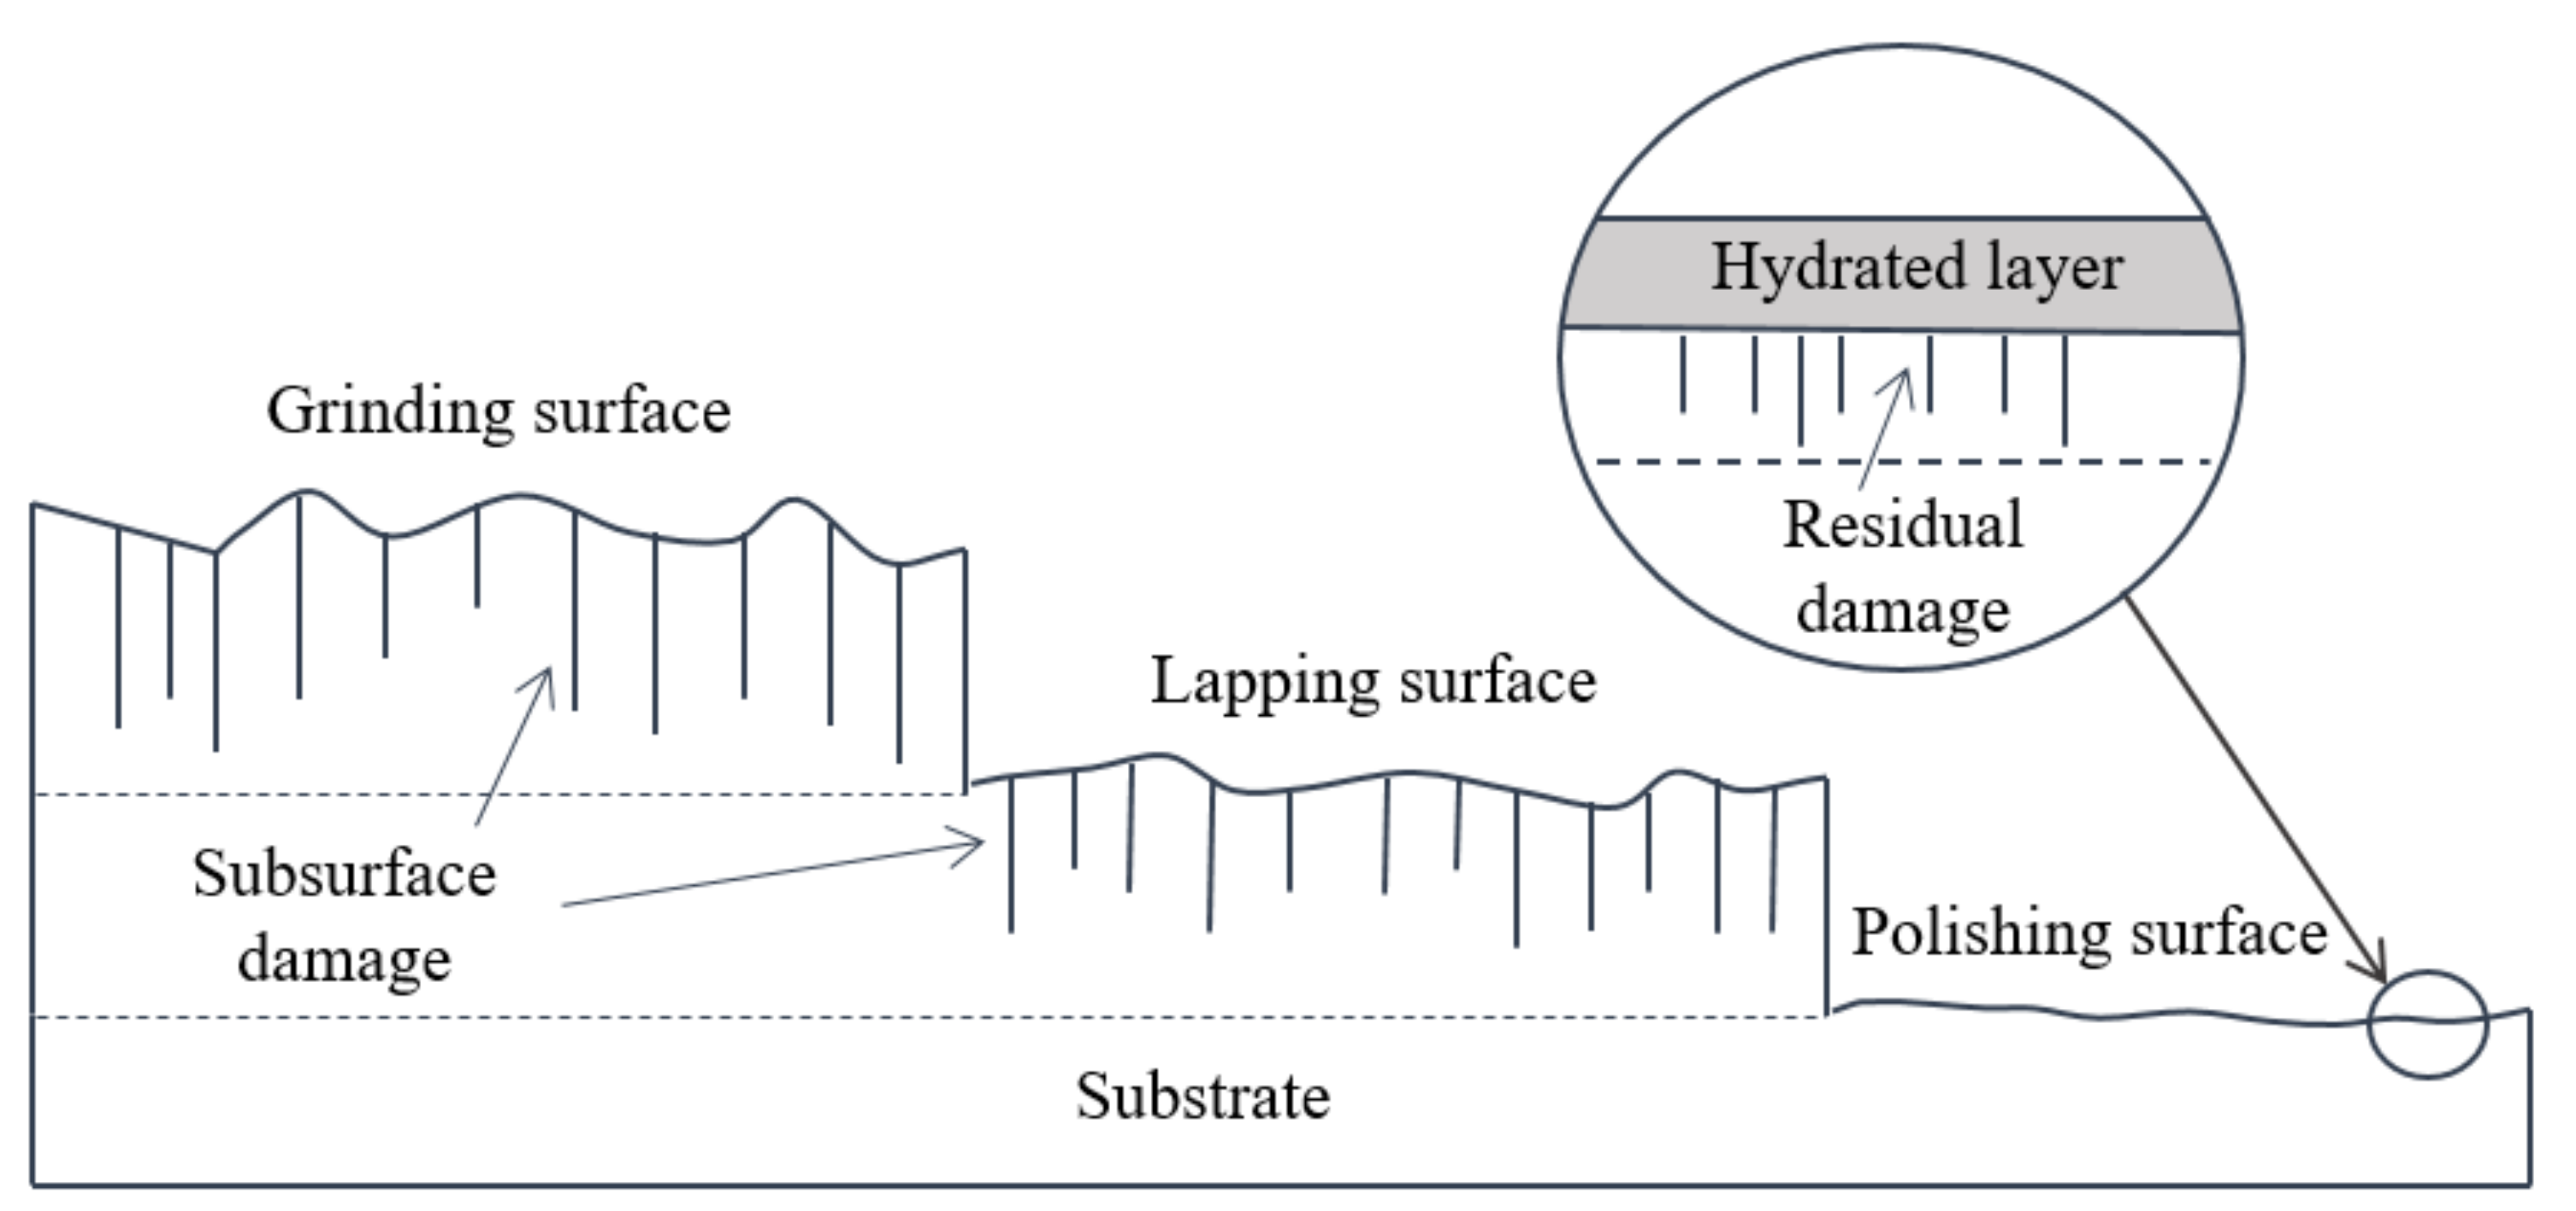
Figure 2.
Interaction among abrasive, lapping plate and workpiece.

Figure 3.
Micro-indentation mechanics.

Figure 4.
The relationship between effective removal rate of damage (ERRD) and abrasive.
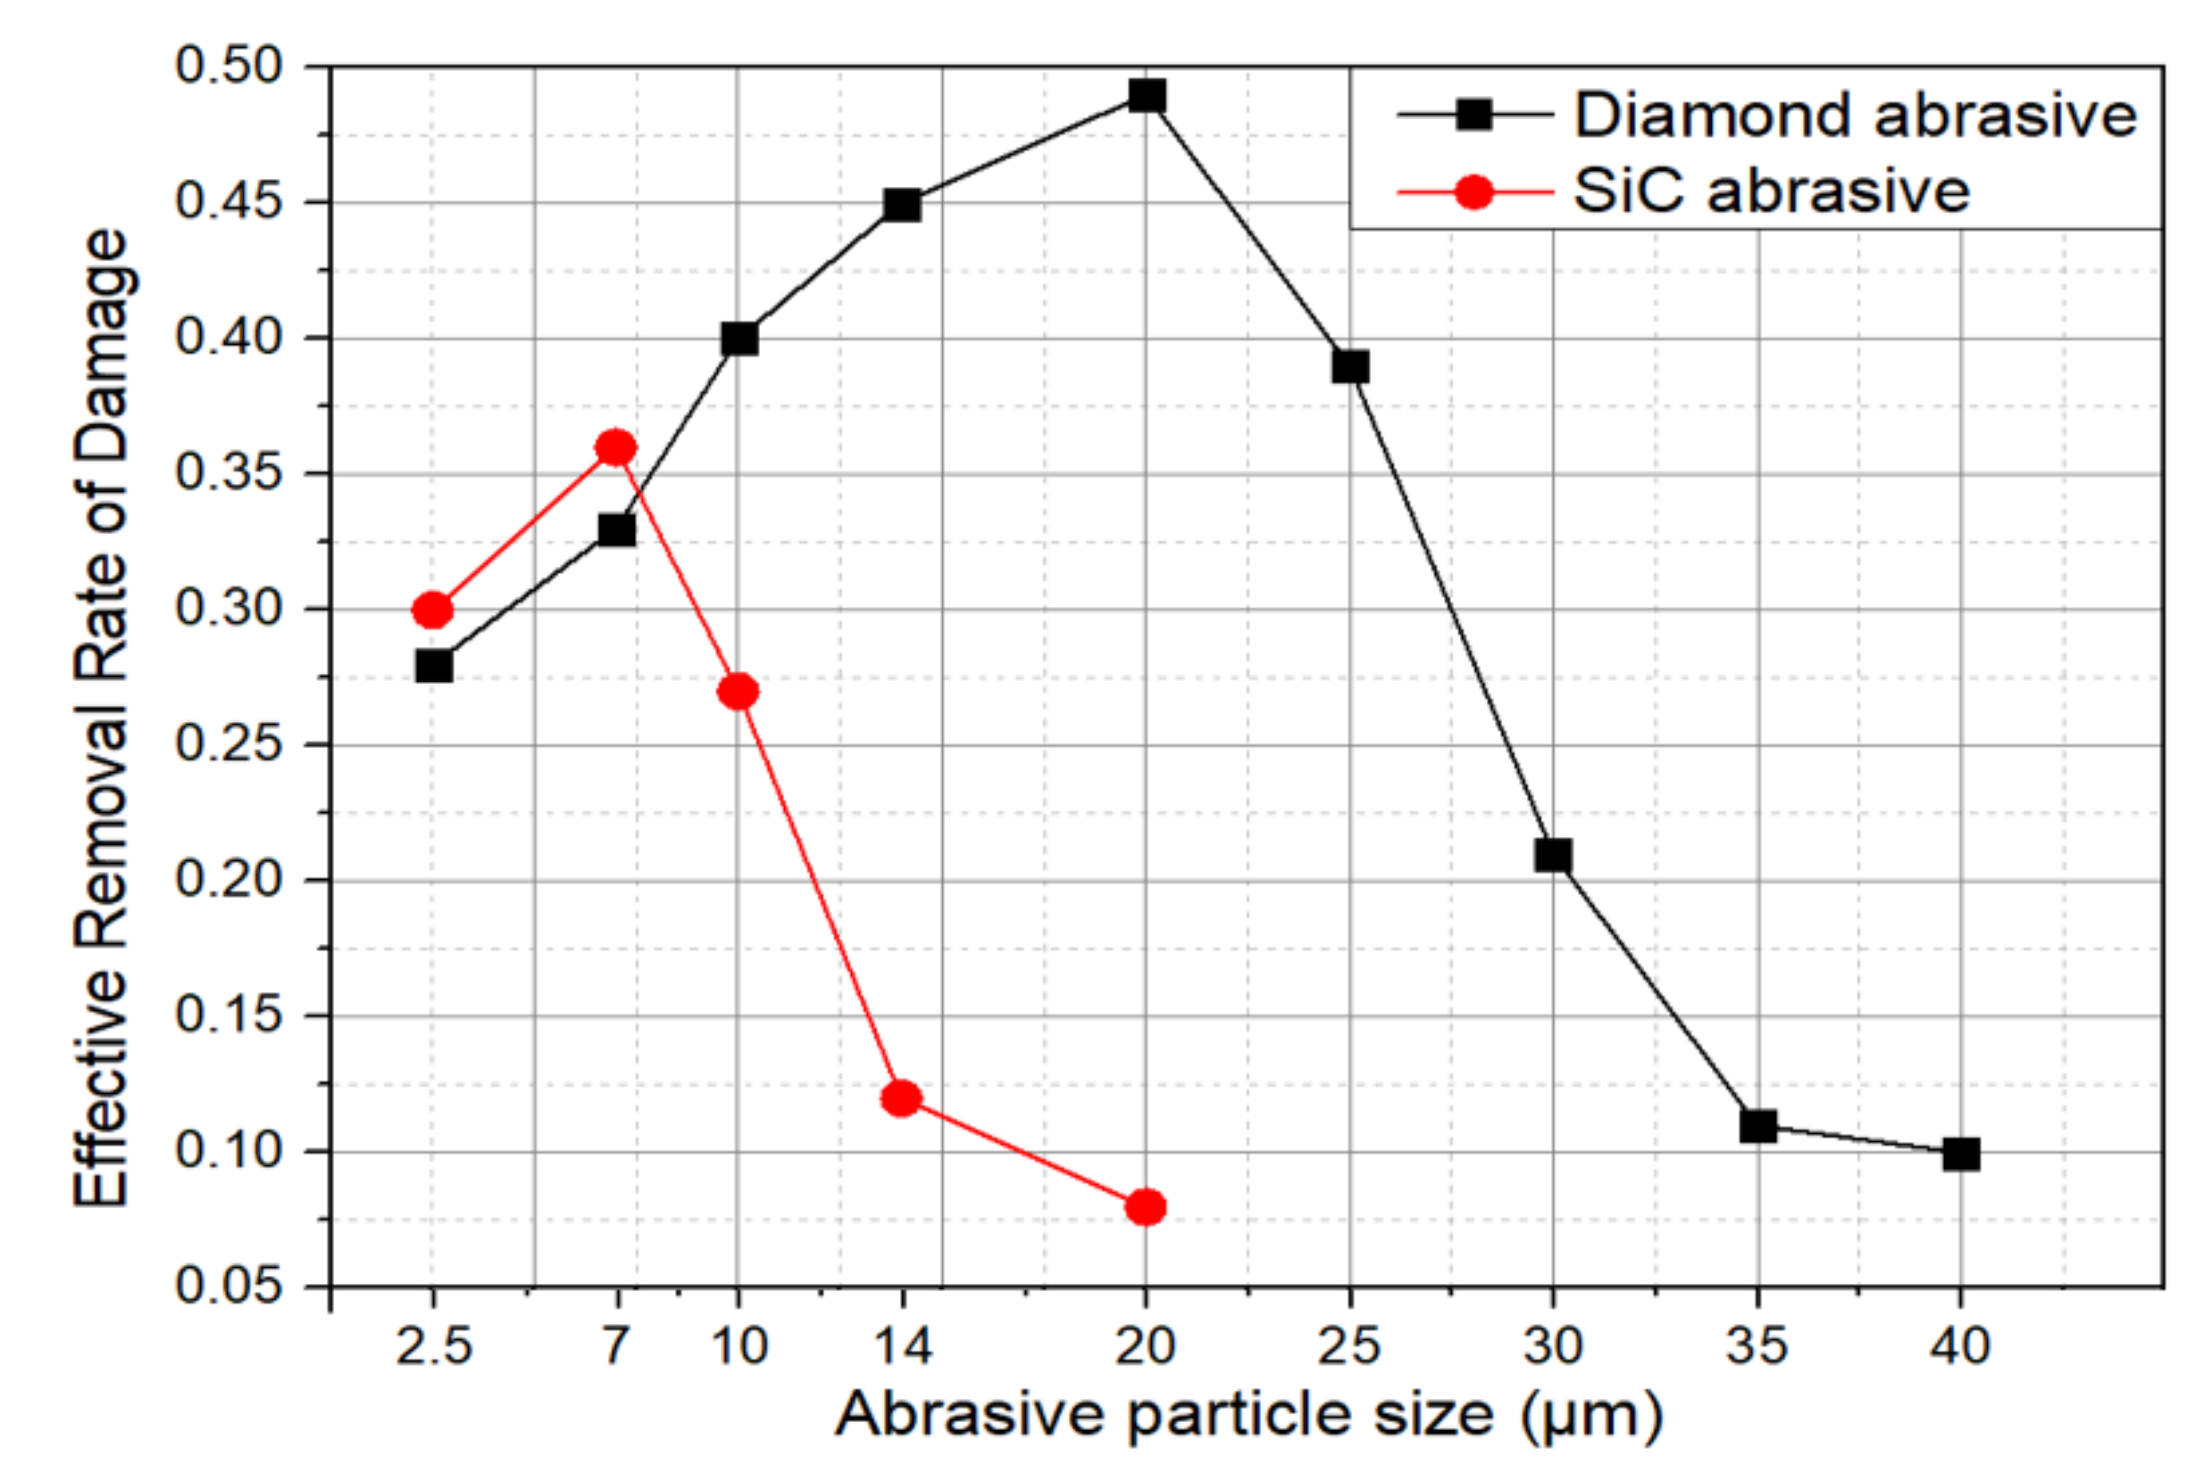
Figure 5.
ERRD for various lapping pressure.

Figure 6.
ERRD for different lapping velocity.

Figure 7.
Results of ERRD with different abrasive.
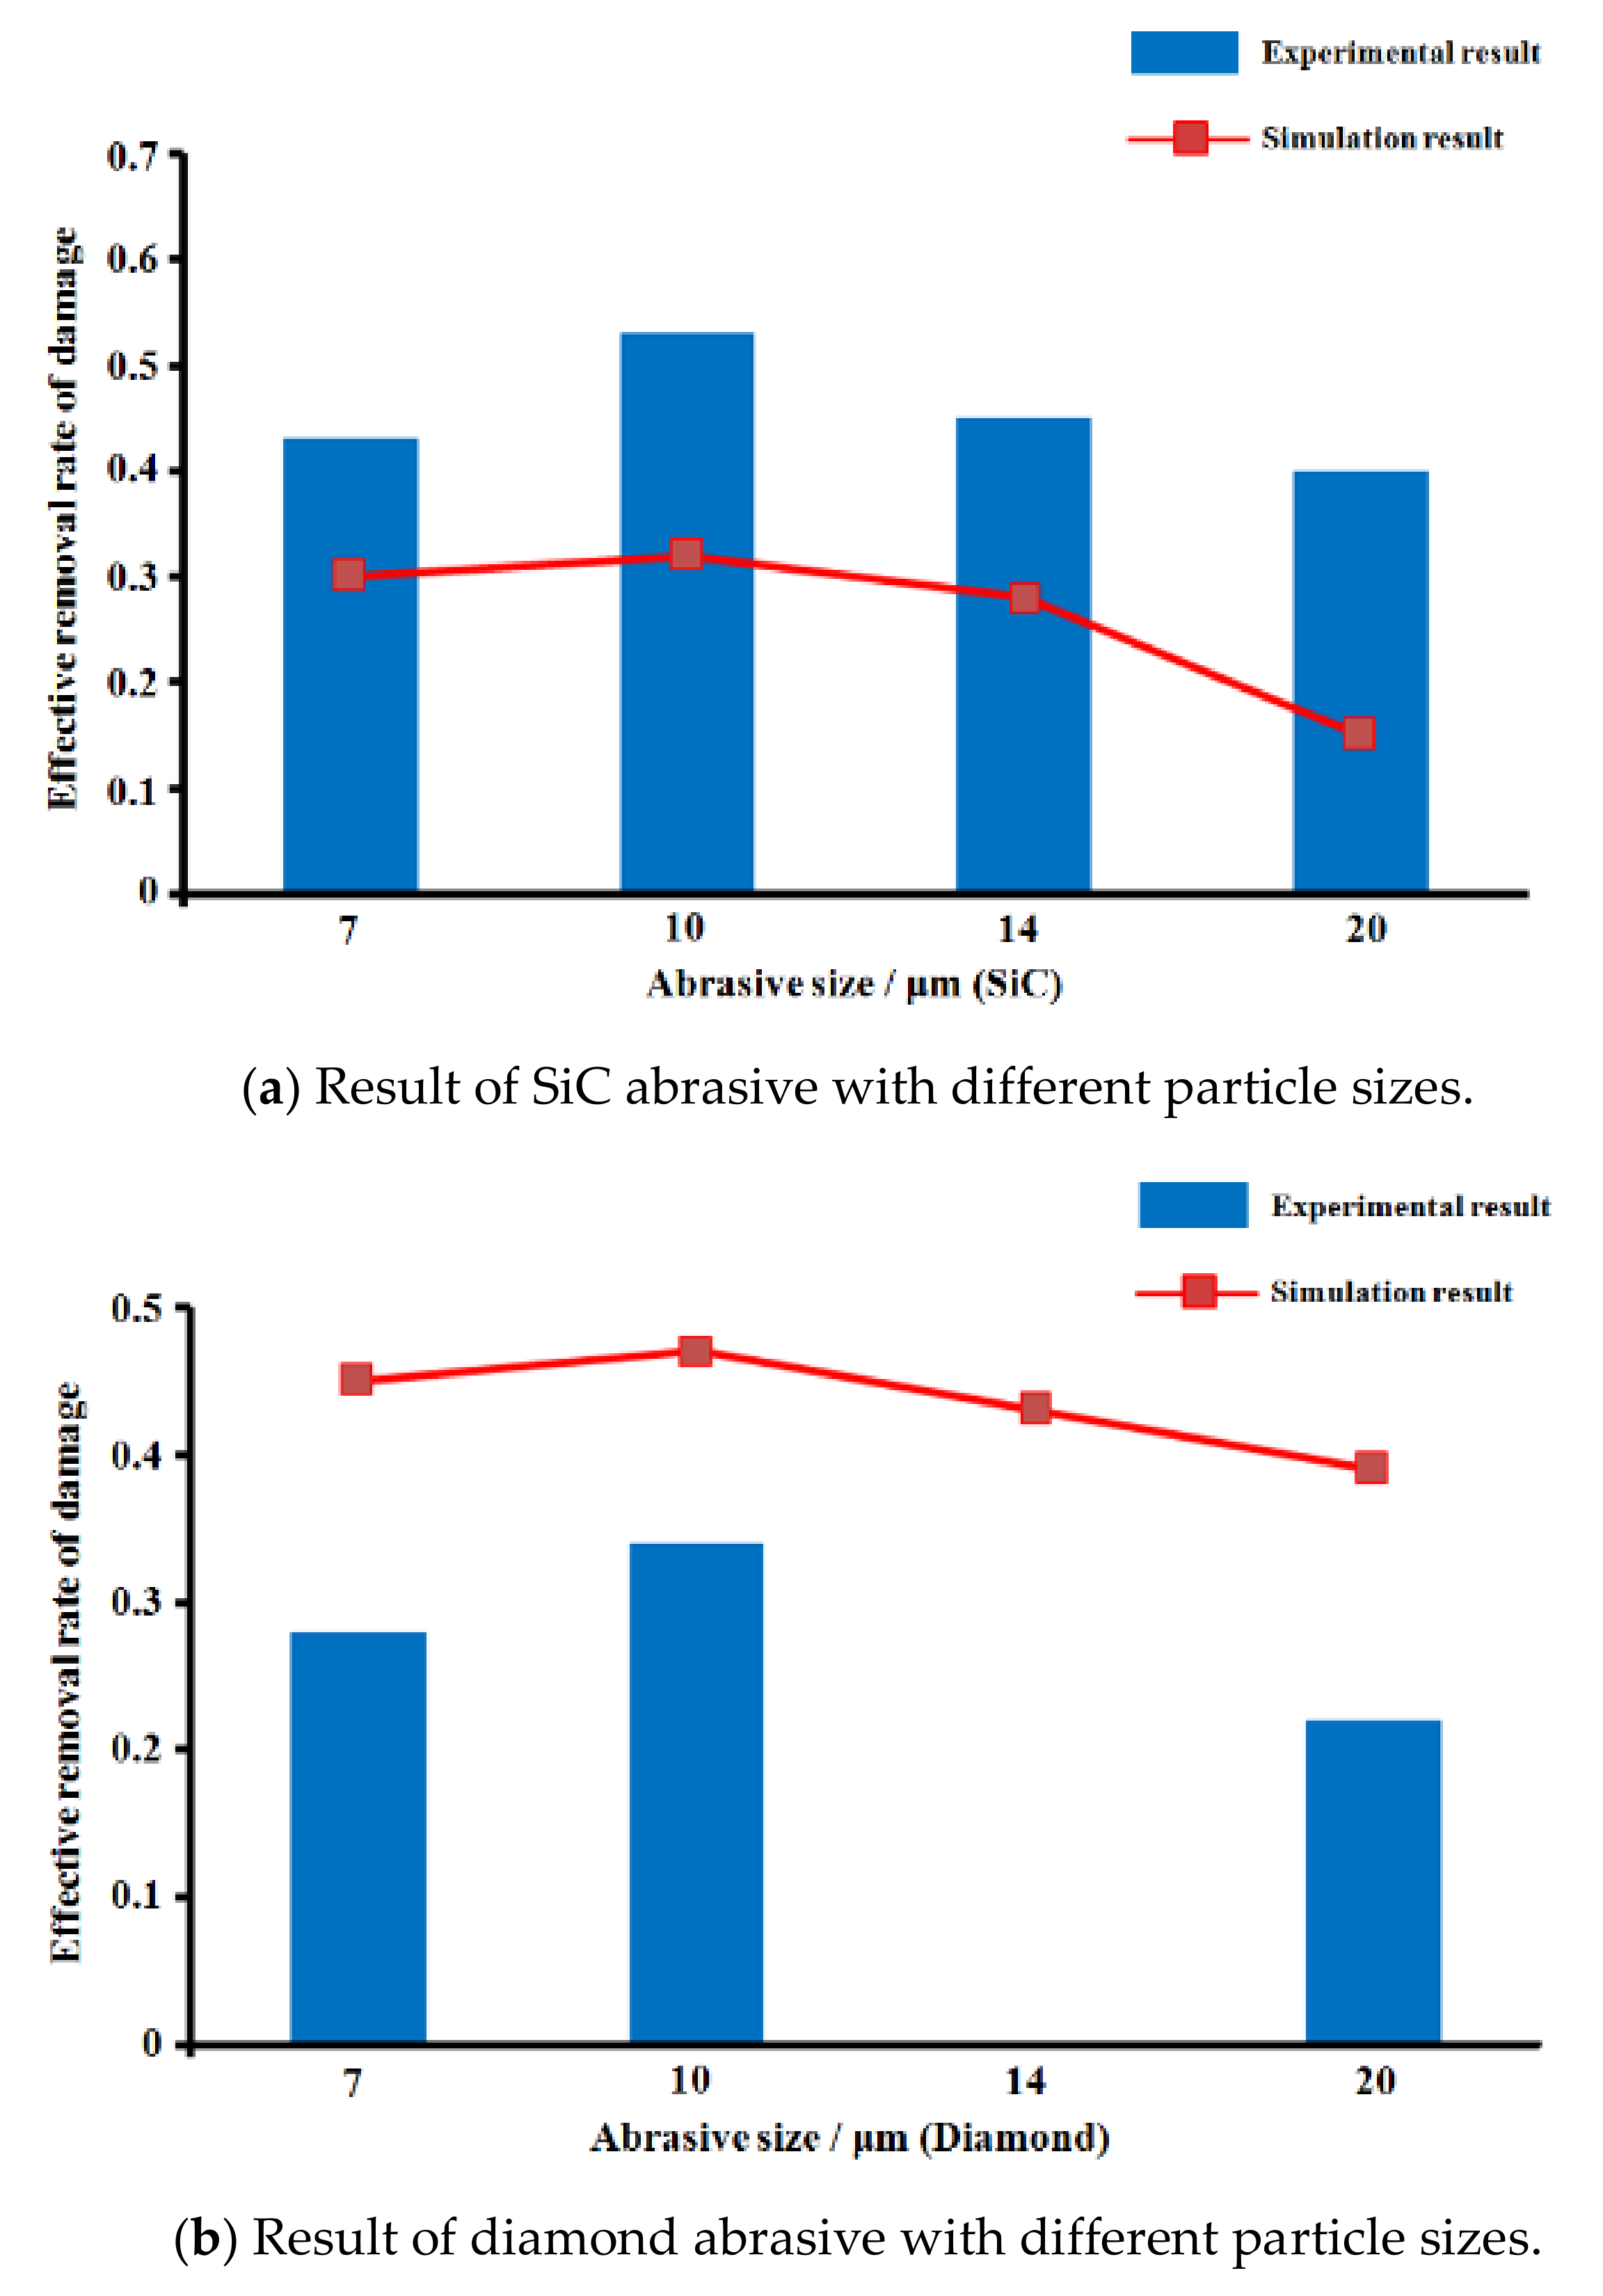
Figure 8.
Result of ERRD under different lapping velocity.
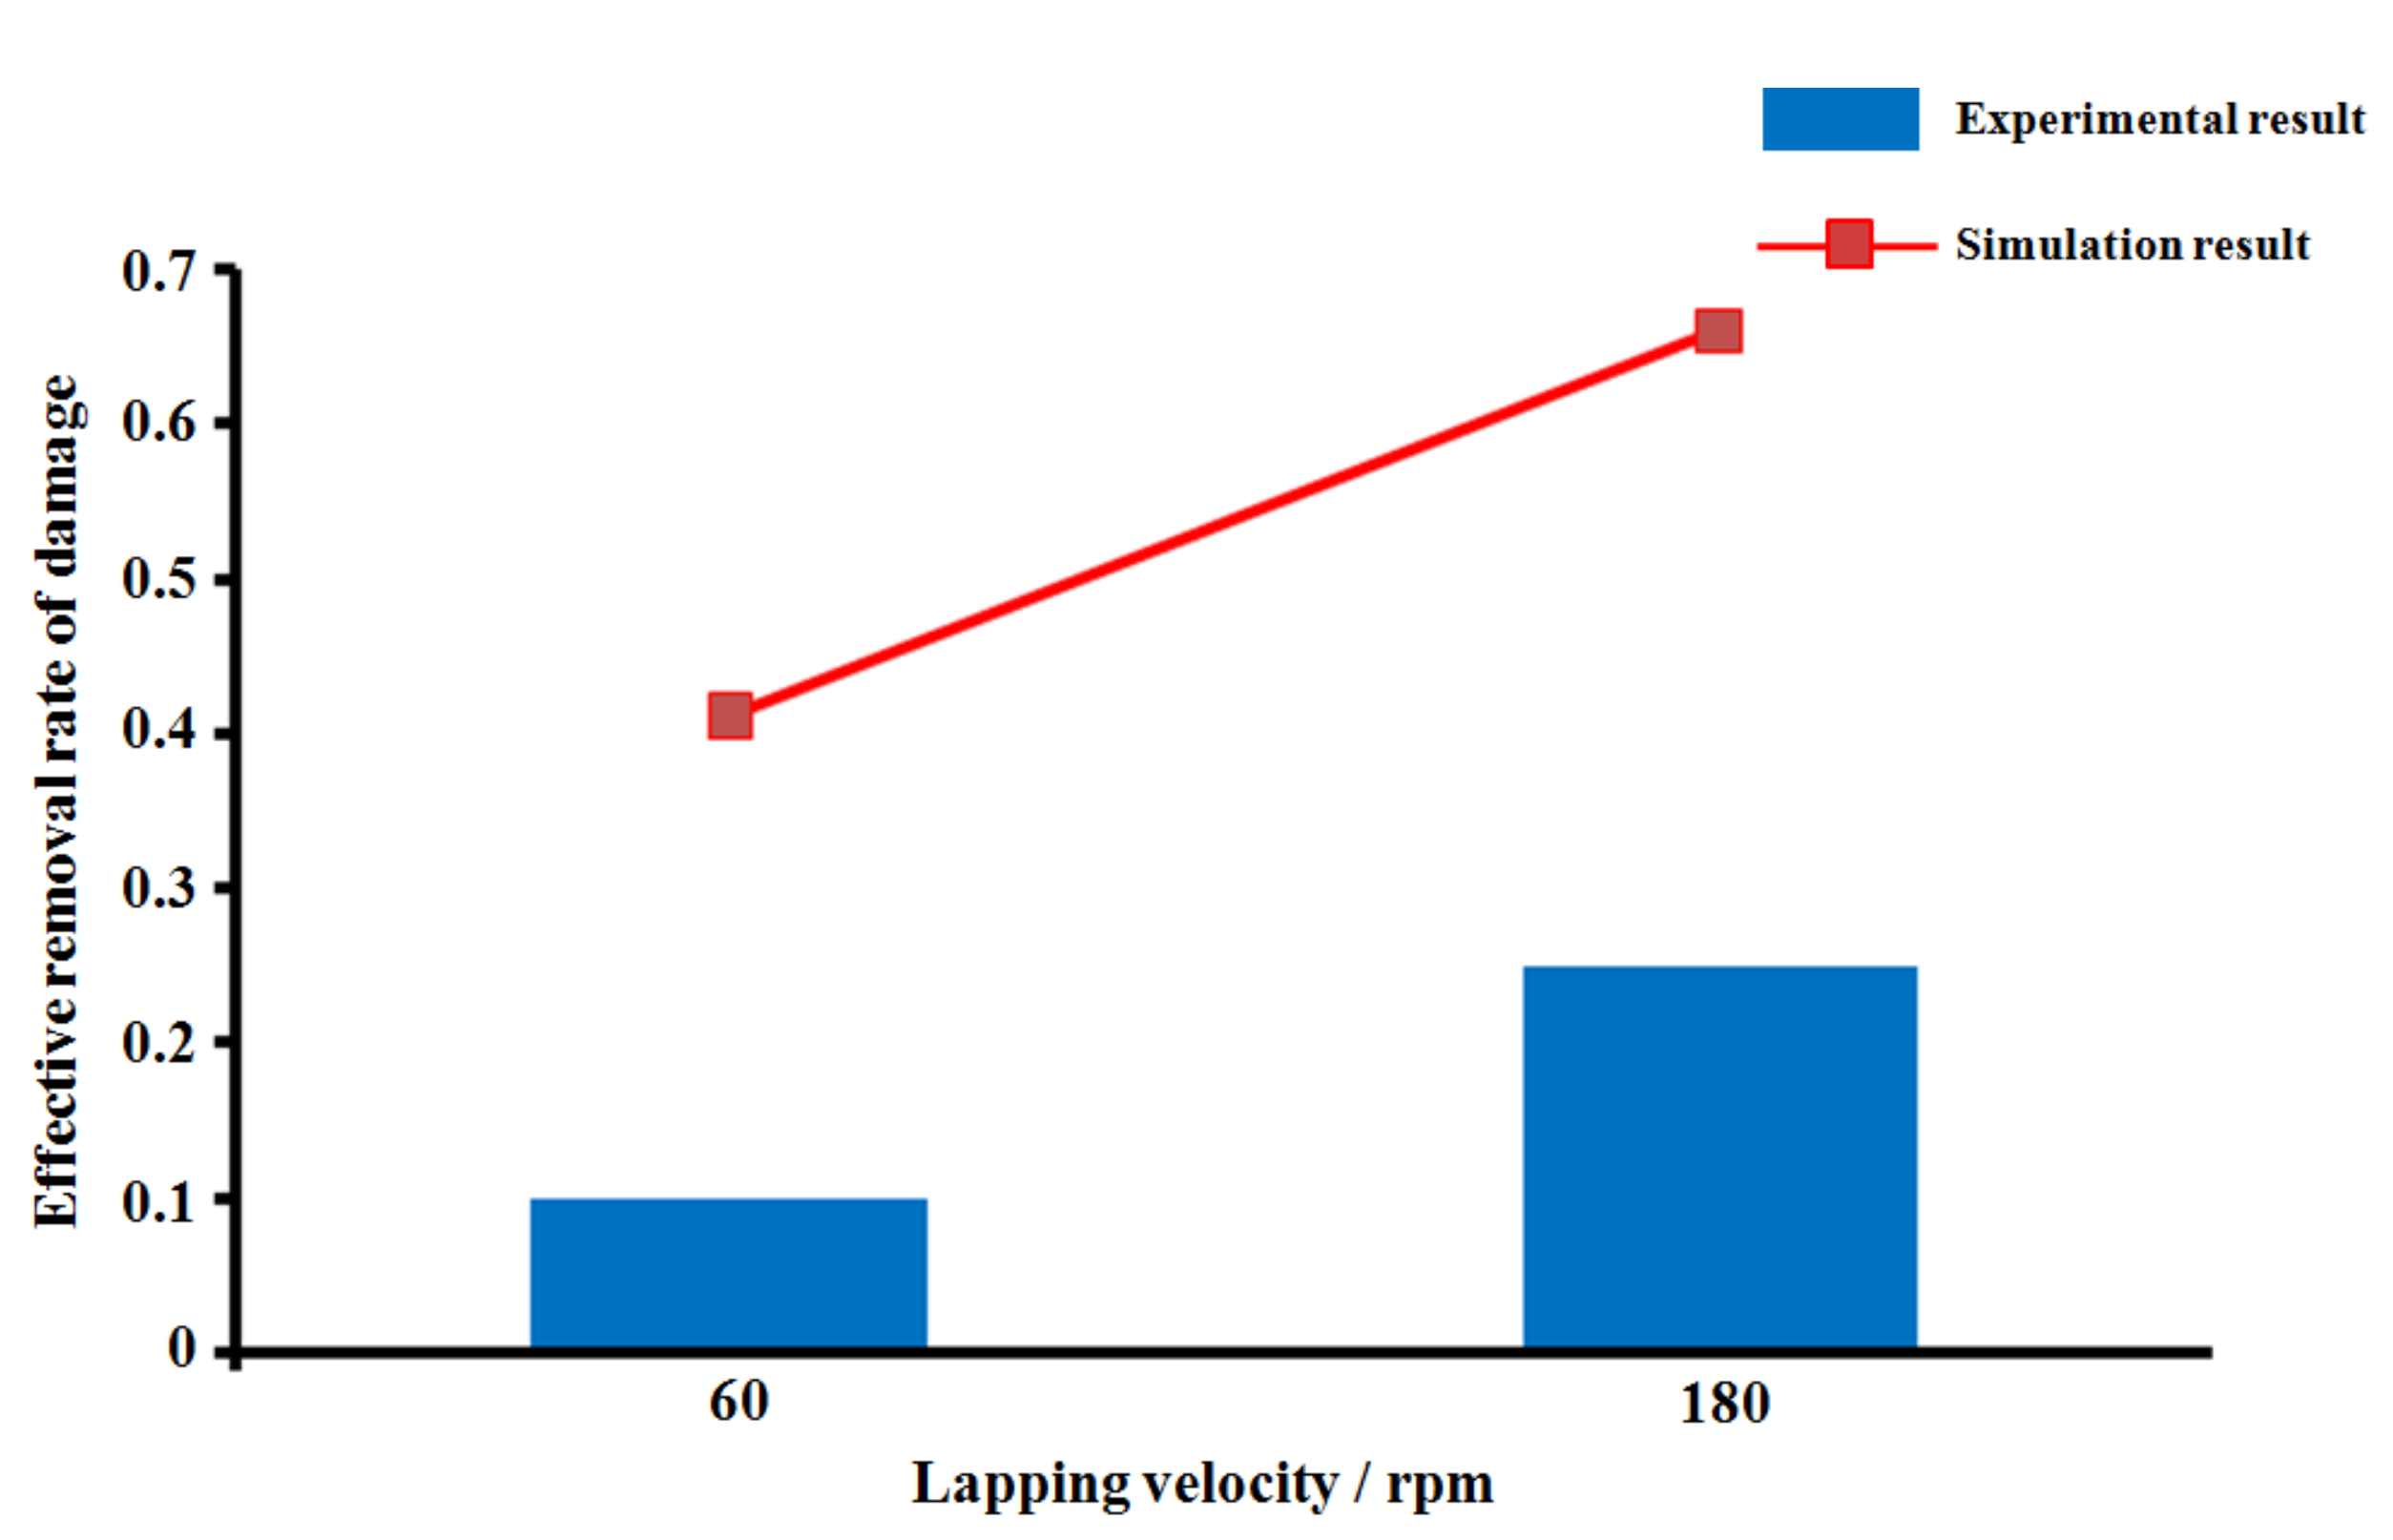
Figure 9.
SSD results of sample 1.

Figure 10.
SSD results of sample 2.

Figure 11.
SSD results of sample 3.

Figure 12.
SSD results of sample 4.

Table 1.
Process parameters in the lapping process.
| Item | Conventional Lapping | Process A | Process B |
|---|---|---|---|
| Material removal amount | 250 μm | 250 μm | 250 μm |
| Abrasive | SiC | Diamond | SiC |
| Abrasive size | W20 | W20 | W7 |
| Pressure | 0.2 MPa | 0.2 MPa | 0.2 MPa |
| Velocity | 120 rpm | 180 rpm | 180 rpm |
Table 2.
Results under different lapping parameters.
| Item | Conventional Process | Process A | Process B |
|---|---|---|---|
| Lapping Time (h) | 9 | 2.5 | 5.3 |
| SSD depth (μm) | 18.76 | 40.14 | 6.83 |
Table 3.
Parameter of optimum lapping process.
| Item | Rough Lapping | Fine Lapping |
|---|---|---|
| Material removal amount | 200 μm | 50 μm |
| Abrasive | W20 Diamond | W7 SiC |
| Pressure | 0.2 MPa | 0.2 MPa |
| Velocity | 180 rpm | 180 rpm |
© 2020 by the authors. Licensee MDPI, Basel, Switzerland. This article is an open access article distributed under the terms and conditions of the Creative Commons Attribution (CC BY) license (http://creativecommons.org/licenses/by/4.0/).
Share and Cite
MDPI and ACS Style
Song, C.; Shi, F.; Zhang, W.; Lin, Z.; Lin, Y. High-Efficiency and Low-Damage Lapping Process Optimization. Materials 2020, 13, 569. https://doi.org/10.3390/ma13030569
AMA Style
Song C, Shi F, Zhang W, Lin Z, Lin Y. High-Efficiency and Low-Damage Lapping Process Optimization. Materials. 2020; 13(3):569. https://doi.org/10.3390/ma13030569
Chicago/Turabian StyleSong, Ci, Feng Shi, Wanli Zhang, Zhifan Lin, and Yuxuan Lin. 2020. "High-Efficiency and Low-Damage Lapping Process Optimization" Materials 13, no. 3: 569. https://doi.org/10.3390/ma13030569
Note that from the first issue of 2016, this journal uses article numbers instead of page numbers. See further details here.