Article

Synthesis, Structure, Morphology, and Luminescent Properties of Ba2MgWO6: Eu3+ Double Perovskite Obtained by a Novel Co-Precipitation Method

by
Thi Hong Quan Vu
,
Bartosz Bondzior
,
Dagmara Stefańska
,
Natalia Miniajluk
and
Przemysław J. Dereń
*
Institute of Low Temperature and Structure Research, Polish Academy of Science, Okólna 2, 50-422 Wroclaw, Poland
*
Author to whom correspondence should be addressed.
Materials 2020, 13(7), 1614; https://doi.org/10.3390/ma13071614
Submission received: 2 March 2020 / Revised: 25 March 2020 / Accepted: 26 March 2020 / Published: 1 April 2020
(This article belongs to the Collection Luminescent Materials)

Abstract

:
Eu3+ doped Ba2MgWO6 (BMW) double-perovskite was successfully synthesized for the first time by the co-precipitation method. The synthesis procedure, crystal structure, as well as morphology of obtained samples are presented. Domination of the 5D07F1 magnetic–dipole over forced electric–dipole transitions in the emission spectra indicates that Eu3+ ions are located in the high symmetry site with inversion center. Only one emission line assigned to the 5D07F0 transition was observed, confirming that europium substituted for only one host cation site. The photoluminescence excitation (PLE) spectrum is dominated by a strong and broad band related to the O2− → Eu3+ and O2− → W6+ charge transfer. The decay of the emission from the 5D0 and 5D1 levels was investigated. The temperature-dependent emission spectra showed that the T0.5 is equal to 350 K. Extinguishing mechanisms of the Eu3+ luminescence in the studied host are discussed.

Graphical Abstract

1. Introduction

Recently, Ba2MgWO6 (BMW), a perfect cubic crystal structure and very promising representative of double perovskite family, has been put into research in the field of ceramic fabrication by virtue of its excellent dielectric properties [1,2]. However, very few studies have discussed its luminescent properties in detail. Indeed, there are only two studies associated with this host doped with Eu3+ ions [3,4]. Still, in both cases, the solid-state method was employed to obtain BMW: Eu3+.
The chemical formula of a double perovskite is described as A2BB’O6 in which A2+ ions are located in 12-coordination sites while B2+ and B’ ions are located in 6-coordination sites [5]. The visualization of the Ba2MgWO6 crystal structure with all details was published in our previous study [3]. In the BMW structure, Ba2+ is located in the site with Td symmetry. As we showed previously, the trivalent europium ions replace the Mg2+ in the site with Oh symmetry with inversion center [3].
In this study, a series of Ba2MgWO6: Eu3+ was synthesized for the first time by using the co-precipitation method. To exclude defects when the trivalent ion replaces the bivalent one, a Li+ co-dopant has been added to locally compensate for the charge. Li+ was chosen because of similar ionic radii, which are as follows for ions with six-fold coordination: 108.7, 90, and 86 pm for Eu3+, Li+, and Mg2+, respectively [6]. The charge compensation strategy could be described in this way:
2Mg2+ → Eu3+ + Li+
The purpose of this work is to obtain BMW by wet chemistry methods, i.e., co-precipitation. Of the various synthesis methods, the co-precipitation one is expected to produce material with smaller particle sizes and more homogeneous morphology. A lower sintering temperature contributes to lower energy consumption compared to other synthesis methods [5]. The usefulness of this method will be assessed by comparing the results obtained with the results already published for the solid-state samples. Here, we present the absorbance, excitation, and emission spectra as well as the emission decay profiles. The influence of temperature and dopant concentration on luminescence was also studied.

2. Experimental

2.1. Synthesis

In this study, concentration series of Ba2MgWO6: x% Eu3+ double perovskite structure (x = 0.1%, 0.5%, 1%, 3%, 4%, 5%, and 7%) were synthesized first time by co-precipitation method, with lower sintering temperature, in comparison with other methods [3,4,7]. To compensate for the evaporation of magnesium ions during the sintering process, a 20% excess of magnesium ions was applied. Ba(CH3COO)2 (Alfa Aesar, 99%), Mg(CH3COO)2∙4H2O (Alfa Aesar, 99.95%), (NH4)10H2(W2O7)6 (Sigma–Aldrich, 99.99%), Eu(CH3COO)3 (Alfa Aesar, 99.9%), were used as starting materials. Firstly, the stoichiometric quantities of barium acetate Ba(CH3COO)2, magnesium acetate Mg(CH3COO)2∙4H2O and ammonium paratungstate (NH4)10H2(W2O7)6 (APT) were dissolved separately in distilled water. Next, a white precipitate was formed immediately after the first droplet of APT solution added slowly (2 ml/min) under stirring 200 rpm, 25 °C. The precipitate was evaporated by heating at 80 °C for 20 h before pre-sintering at 600 °C for 12 h. The final annealing was carried out at 1150 °C for 6 h, with the constant heating rate, 3 °C/min using corundum crucible. After each step, the obtained products were ground for 15 minutes. The scheme of BMW preparation is presented in Figure 1.

2.2. Characterization

The structure of materials was analyzed by X’Pert ProPANalytical X-ray diffractometer (PANalytical, Almelo, The Netherlands) using Cu Kα radiation (λ = 1.54056 Ǻ) in a 2 θ range from 10° to 90° with a step of 0.026°. For measurements of the reflectance absorption spectra, the Varian Cary 5E UV–Vis-NIR spectrophotometer (Agilent, Santa Clara, CA, USA) was used. The emission spectra in the temperature range 10–300 K were recorded using a Jobin-Yvon monochromator (Horiba Scientific, Kyoto, Japan), along with a closed-cycle helium cryostat. Decay profiles were recorded with a Lecroy digital oscilloscope (Teledyne LeCroy, New York, NY, USA) with the Nd: YAG laser as the excitation source. Scanning electron microscope FEI NOVA NanoSEM230 (FEI, Hillsboro, OR, USA) was used to characterize the morphology of sample. The excitation spectrum was recorded using a McPherson spectrometer with a 150 W xenon lamp as the excitation source and a Hamamatsu R928 photomultiplier (Hamamatsu Photonics K.K, Shizuoka, Japan) as the detector. Temperature-dependent emission spectra were measured with the Hamamatsu Photonic multichannel analyzer PMA-12 equipped with a BT-CCD linear image sensor (Hamamatsu Photonics K.K, Shizuoka, Japan). The temperature of the samples during emission measurements was controlled by the Linkam THMS 600 Heating/Freezing Stage (The McCRONE group, Westmont, IL USA).

3. Results and Discussion

Ba2MgWO6 possesses the cubic crystal structure with a rock salt lattice of which corner-shared MgO6 and WO6 octahedrons. The Ba cations are located in the 12-fold coordination sites. The crystal structure of BMW was described in detail in our previous study [3]. The X-ray diffractograms of Ba2MgWO6: x Eu3+ samples (x = 0.1%, 0.5%, 1%, 3%, 4%, 5%, and 7%) are shown in Figure 2. The X-ray diffraction patterns of prepared samples match well with the Ba2MgWO6 pattern (ICSD card number 024-982) with the space group Fm-3m. The higher concentration of europium causes the additional diffraction peaks to appear. The alien phases belong to the barium tungstate family, including BaWO4 (present at 2 θ of 26.4°), Ba2WO5 (28°, 28.6°, 29.6°), and Ba3WO6 (29.4°, 42°) these phases were also mainly found in other reports [1,7]. Fortunately, the alien phases did not affect the luminescence properties as well as further ceramic preparation. The positions of the XRD peaks were corrected with the aid of Si admixture (ICSD card number 026-1481). Ba2+ is a very large ion, its crystal radius (CR) for coordination number equal 12 (CN = 12) is 175 pm. While the CR of the Eu3+ ion for CN = 9 is-Shannon gives no data for the highest CN-only 126 pm [6]. If europium ions have replaced barium ions, then the unit cell of BMW should shrink. Since it is growing (see Figure 2c), we conclude that larger Eu3+ ions (CR = 108.7 pm) replace smaller Mg2+ ions (CR = 86 pm) in the sites with CN = 6. The replacement of W6+ with Eu3+ was excluded because of the large difference between the charge of these ions and their crystal radius equal to 74 and 108.7 pm for W6+ and Eu3+, respectively.
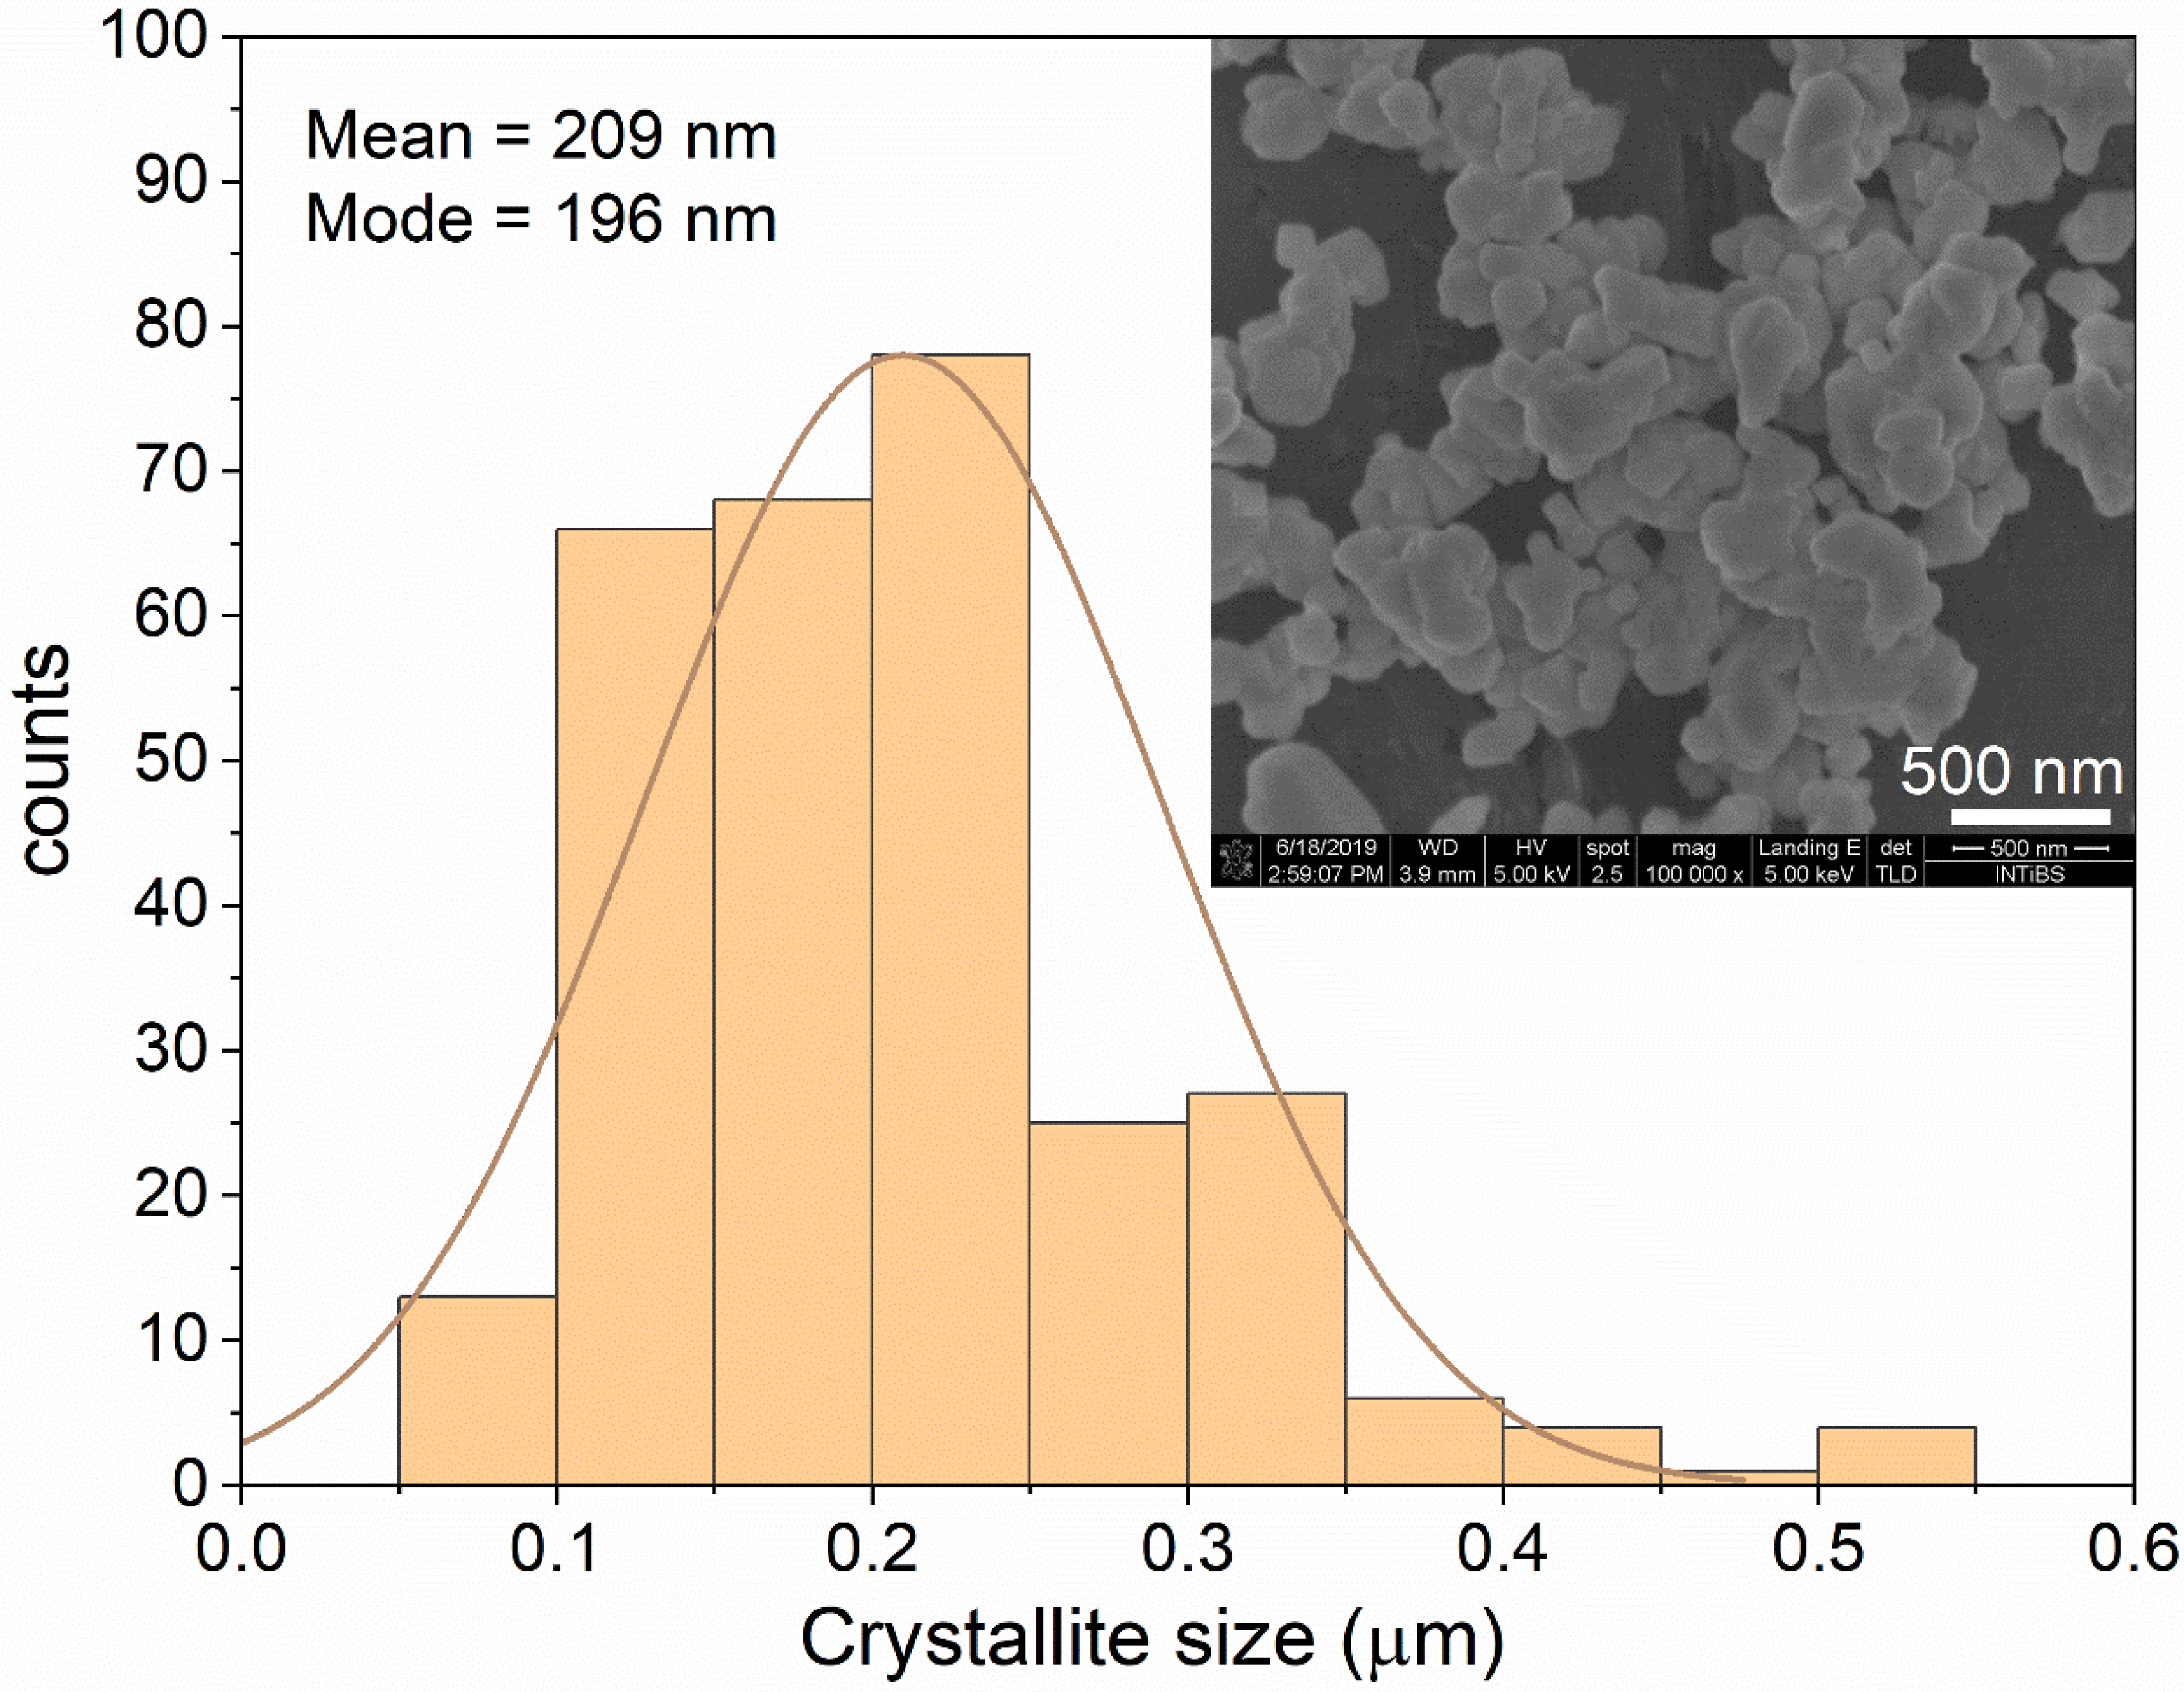
The microstructure of the representative sample BMW: 3% Eu3+, and the crystallite size distribution of the obtained sample (calculated using ImageJ software) are shown in Figure 3. In general, single grains were not observed in the SEM image. As can be seen, the morphology of the sample was heterogeneous. However, a large number of crystallites were agglomerated, forming large objects with irregular shapes. As a result, the distribution of the crystallite sizes is in a wide range from 70 nm up to 500 nm. The average crystallite size was estimated to be around 209 nm. This value is much smaller than those obtained using a conventional solid-state technique [3,7], demonstrating one of the advantages of the wet chemistry method. This result encourages further work to eliminate agglomeration to ease ceramic preparation.
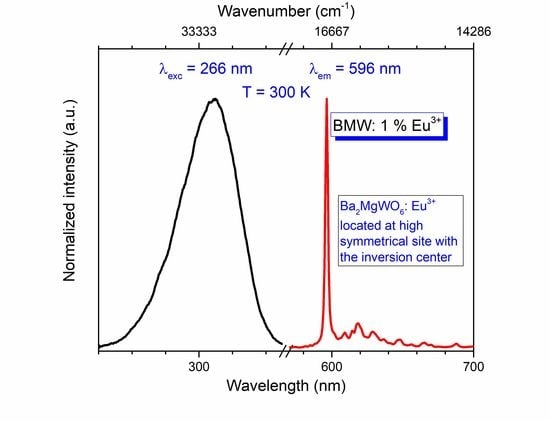
The photoluminescence of Ba2MgWO6 doped with a series of europium concentration from 0.1% to 7% was measured under 266 nm excitation wavelength at room temperature (see Figure 4). The picture is uncommon to majority cases when Eu3+ ions are located at the sites without the center of inversion. Here the 5D07F1 magnetic dipole transition dominates the spectrum as sharp and intense peak at 596 nm. The forced electric dipole transitions are much weaker and broadened due to vibronic coupling, assigned to the 5D07FJ transitions (where J = 0, 2, 3, 4) are observed at about 584.4, 618.7, 665, and 721.3 nm, respectively. The integrated emission intensity in the function of the Eu3+ concentration was depicted in the inset of Figure 4. The luminescent intensity increases significantly with the increase of Eu3+ concentration up to 5%. Above that point, the emission intensity decreases as a consequence of the concentration quenching process.
Due to the hypersensitive nature, the 5D07F2 electric-dipole transition it susceptible to the even small changes of the crystal field. In contrast, the 5D07F1 magnetic dipole transition is virtually unaffected by neither symmetry site nor host lattice-type. Hence, the asymmetry factor R, the ratio between the integrated intensity of the 5D07F2 and that of 5D07F1 transitions, is often used to determine the changes in the nearest environment of Eu3+ in the lattice. Thus, the higher the value R is, the lower the symmetry of the Eu3+ ions occupancy site. For the investigated samples, the R parameter increases gradually from 0.56 to 0.63 when dopant concentration increases. It demonstrates a slight distortion of the structure, which insignificantly decreases local symmetry of the Eu3+ ions.
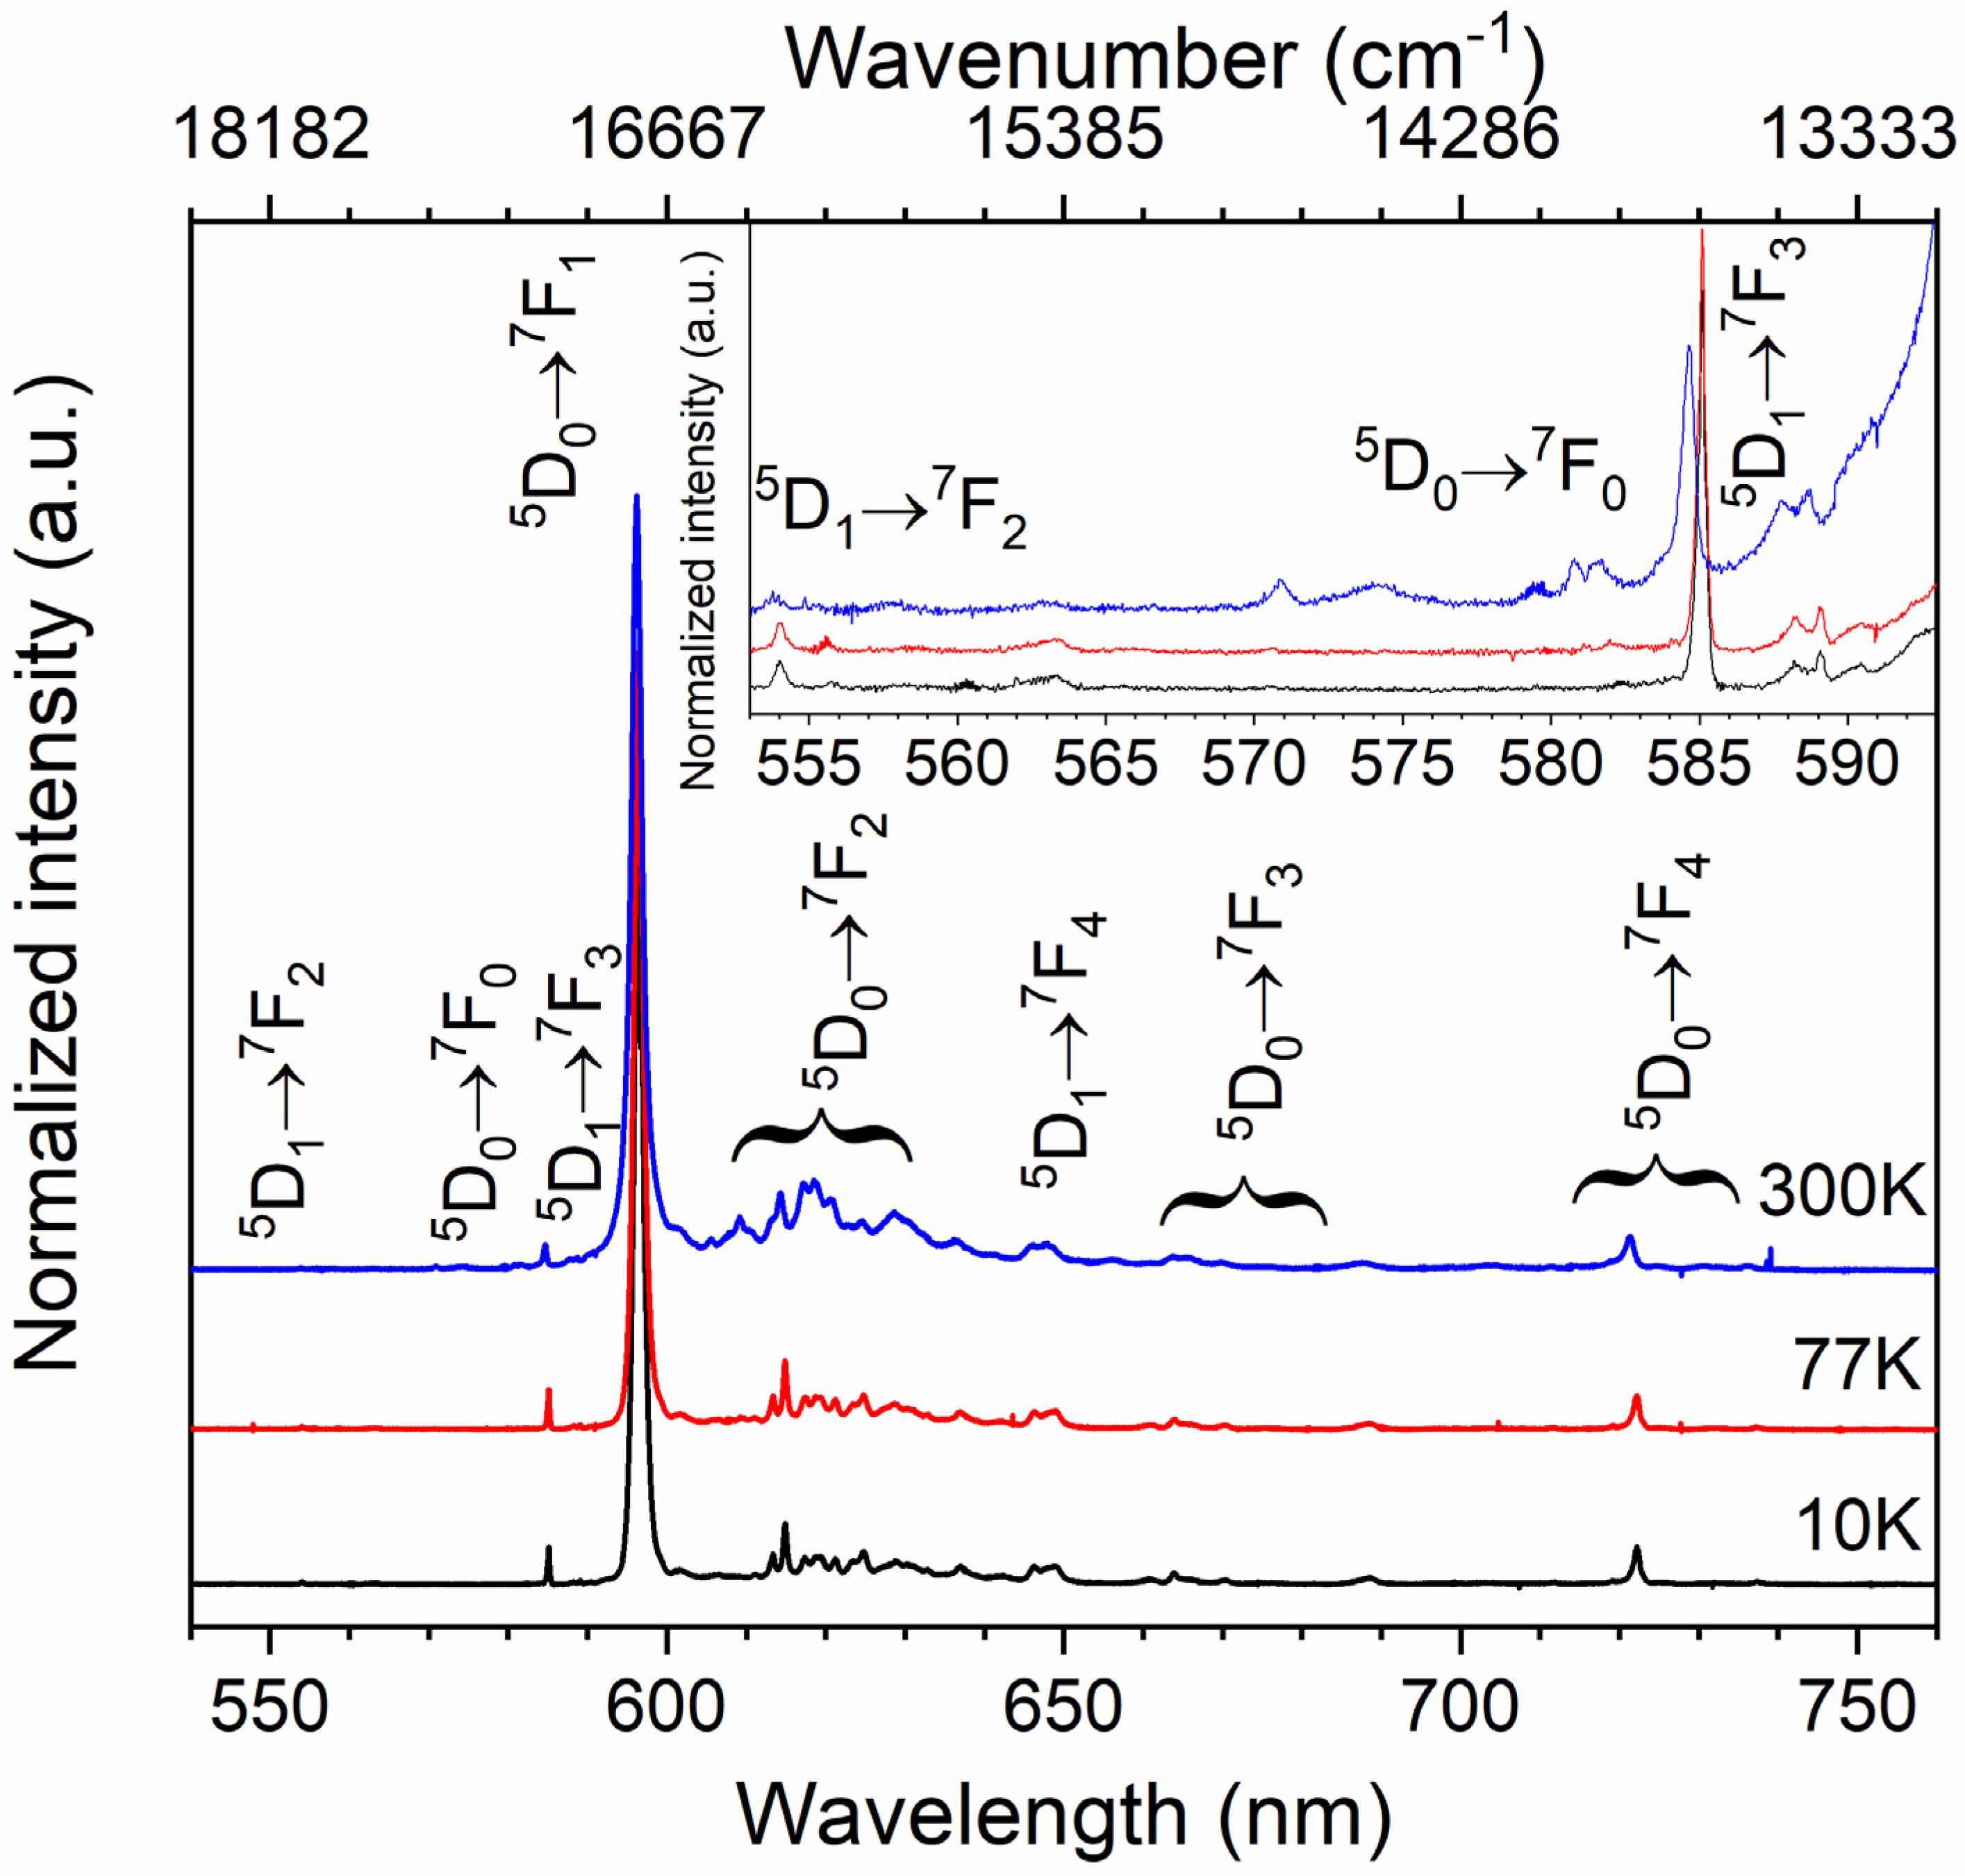
To assign every single emission peak, and to determine the number of the Eu3+ sites, the emission spectra were recorded at low temperature (77 K and 10 K). The intensity of the f-f lines significantly increased, while the vibronic ones almost disappeared when the temperature decreased down to 10 K (see Figure 5). Only one narrow line at 585 nm attributed to the 5D07F0 transition was observed at room and low (10 and 77 K) temperature. It is apparent evidence of the europium location in the only one crystallographic site (see the inset in Figure 5). Emission spectra were carefully studied. All detected lines were tentatively assigned either to MD or ED or vibronic transitions. Their energies are presented in Supplementary Table S1.
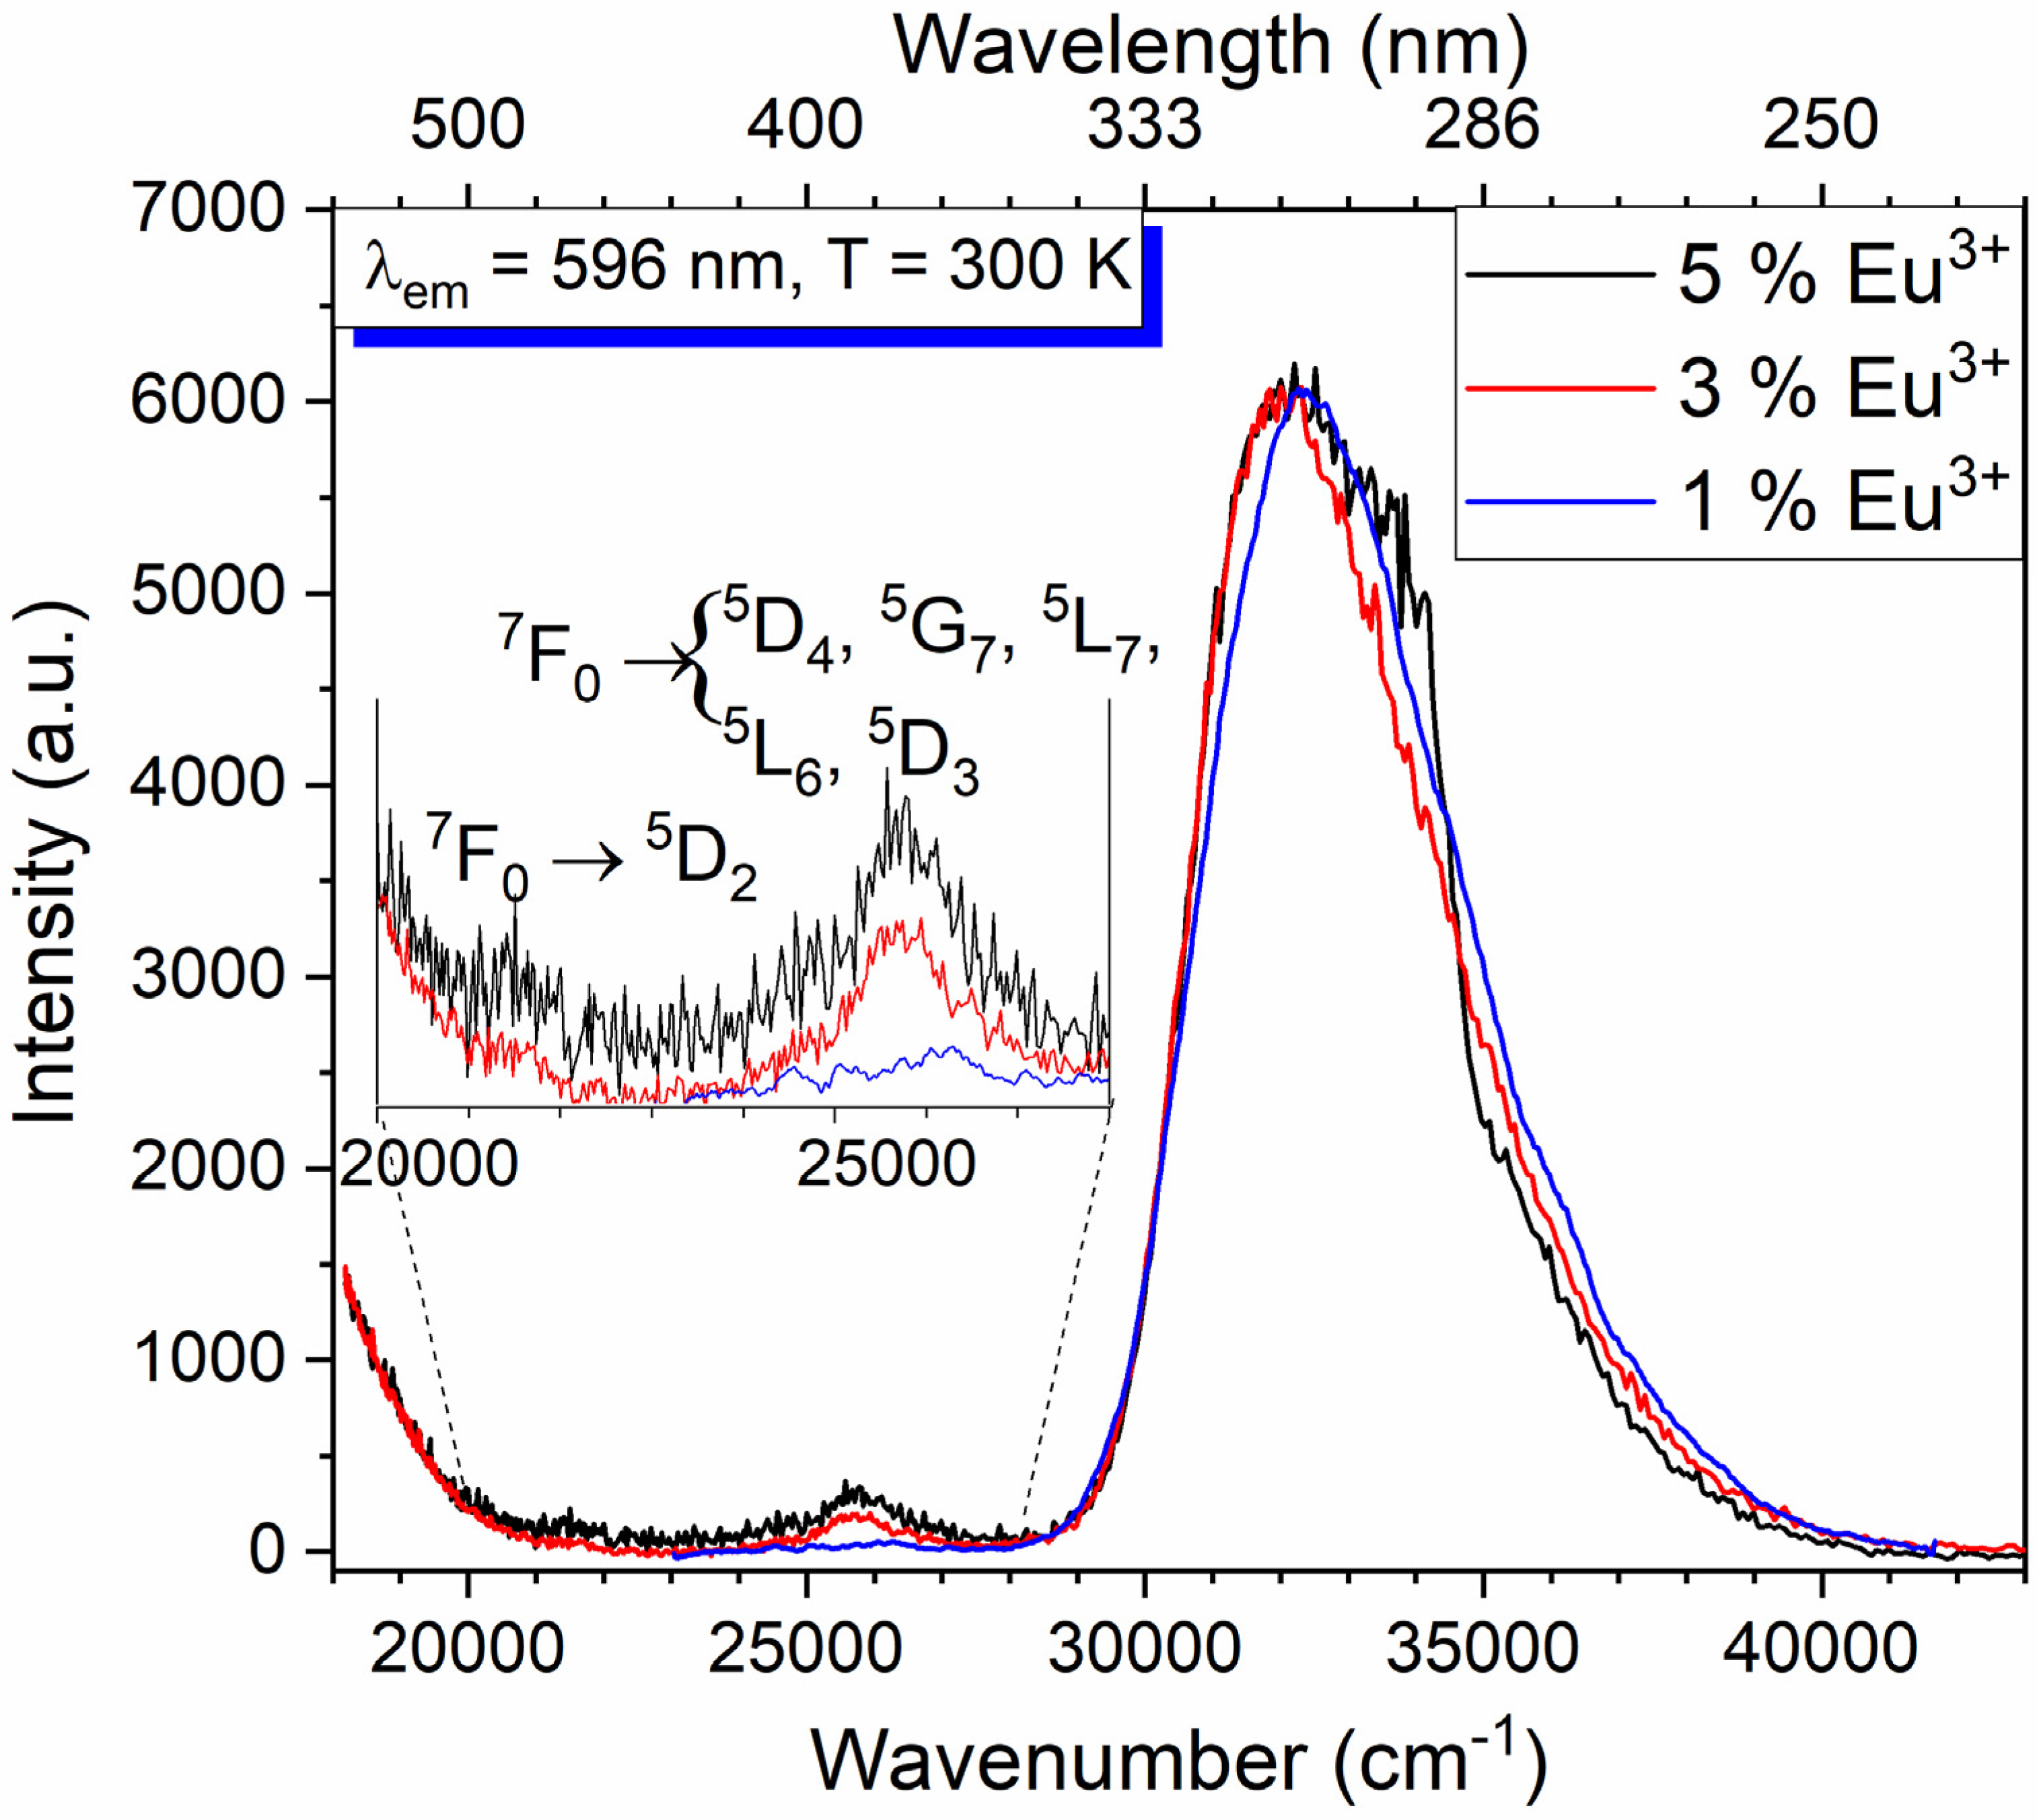
The excitation spectra of the 1%, 3%, and 5% Eu3+ doped Ba2MgWO6 was monitored at 596 nm, i.e.at the maximum of the 5D07F1 transition at room temperature (see Figure 6). The spectra consist of a broad and intense band ranging from 250 nm to 350 nm. The broad band results from two charge transfer transitions (CTB), including the O2 → W6+ and O2 → Eu3+ transitions. There is also a small band at about 395 nm assigned to intra-configurational f-f transitions of Eu3+ ions, weak due to the Laporte selection rule [8]. They become partially allowed because of the lowering of the symmetry site when introducing a higher amount of Eu3+ and Li+ ions. Our recent investigation does not reveal any trace of f-f transitions in the excitation spectra, but there effective doping was several times smaller [3]. The sample with 1% Eu3+ virtually does not show the f-f transitions. Mainly CTB is observed similarly as in the solid-state method [3].
It is not easy to find the energy of the O2− → Eu3+ transitions since the amount of dopant is small comparing to the tungstate, which forms the host structure. Analogously, the broad band at 318 nm results from both charge transfer transitions in Ba3WO6: Eu3+ [9]. The energy of the O2− → Eu3+ CTB is influenced not only by the ligand electronegativity but also by the local surroundings of the Eu3+ ions [8]. The location of the O2−–W6+ CTB has been reported around 300 nm in g-C3N4/Ba2MgWO6: Eu3+ [4], 301 nm in Ba2MgWO6: Eu3+ [3], 310 nm in host Ba2MgWO6 [7], 325 nm [10] in NaLaMgWO6: Eu3+. As noted in the preliminary work, the O2−–Eu3+ CTB was found at around 304 nm in CaMoO4: Eu3+, 293 nm in AMoO4: Eu3+ (A = Ba, Sr), and at 250 nm in BaNa2W2O11: Eu3+. The less intense and narrower bands appeared near the visible region (from 370 to 400 nm) and at 462.5 nm that could be ascribed to f-f transitions of the 7F05D4, 5G7, 5L7, 5L6, 5D3 and 7F05D2 transitions, respectively, [11,12,13] (see inset in Figure 6).
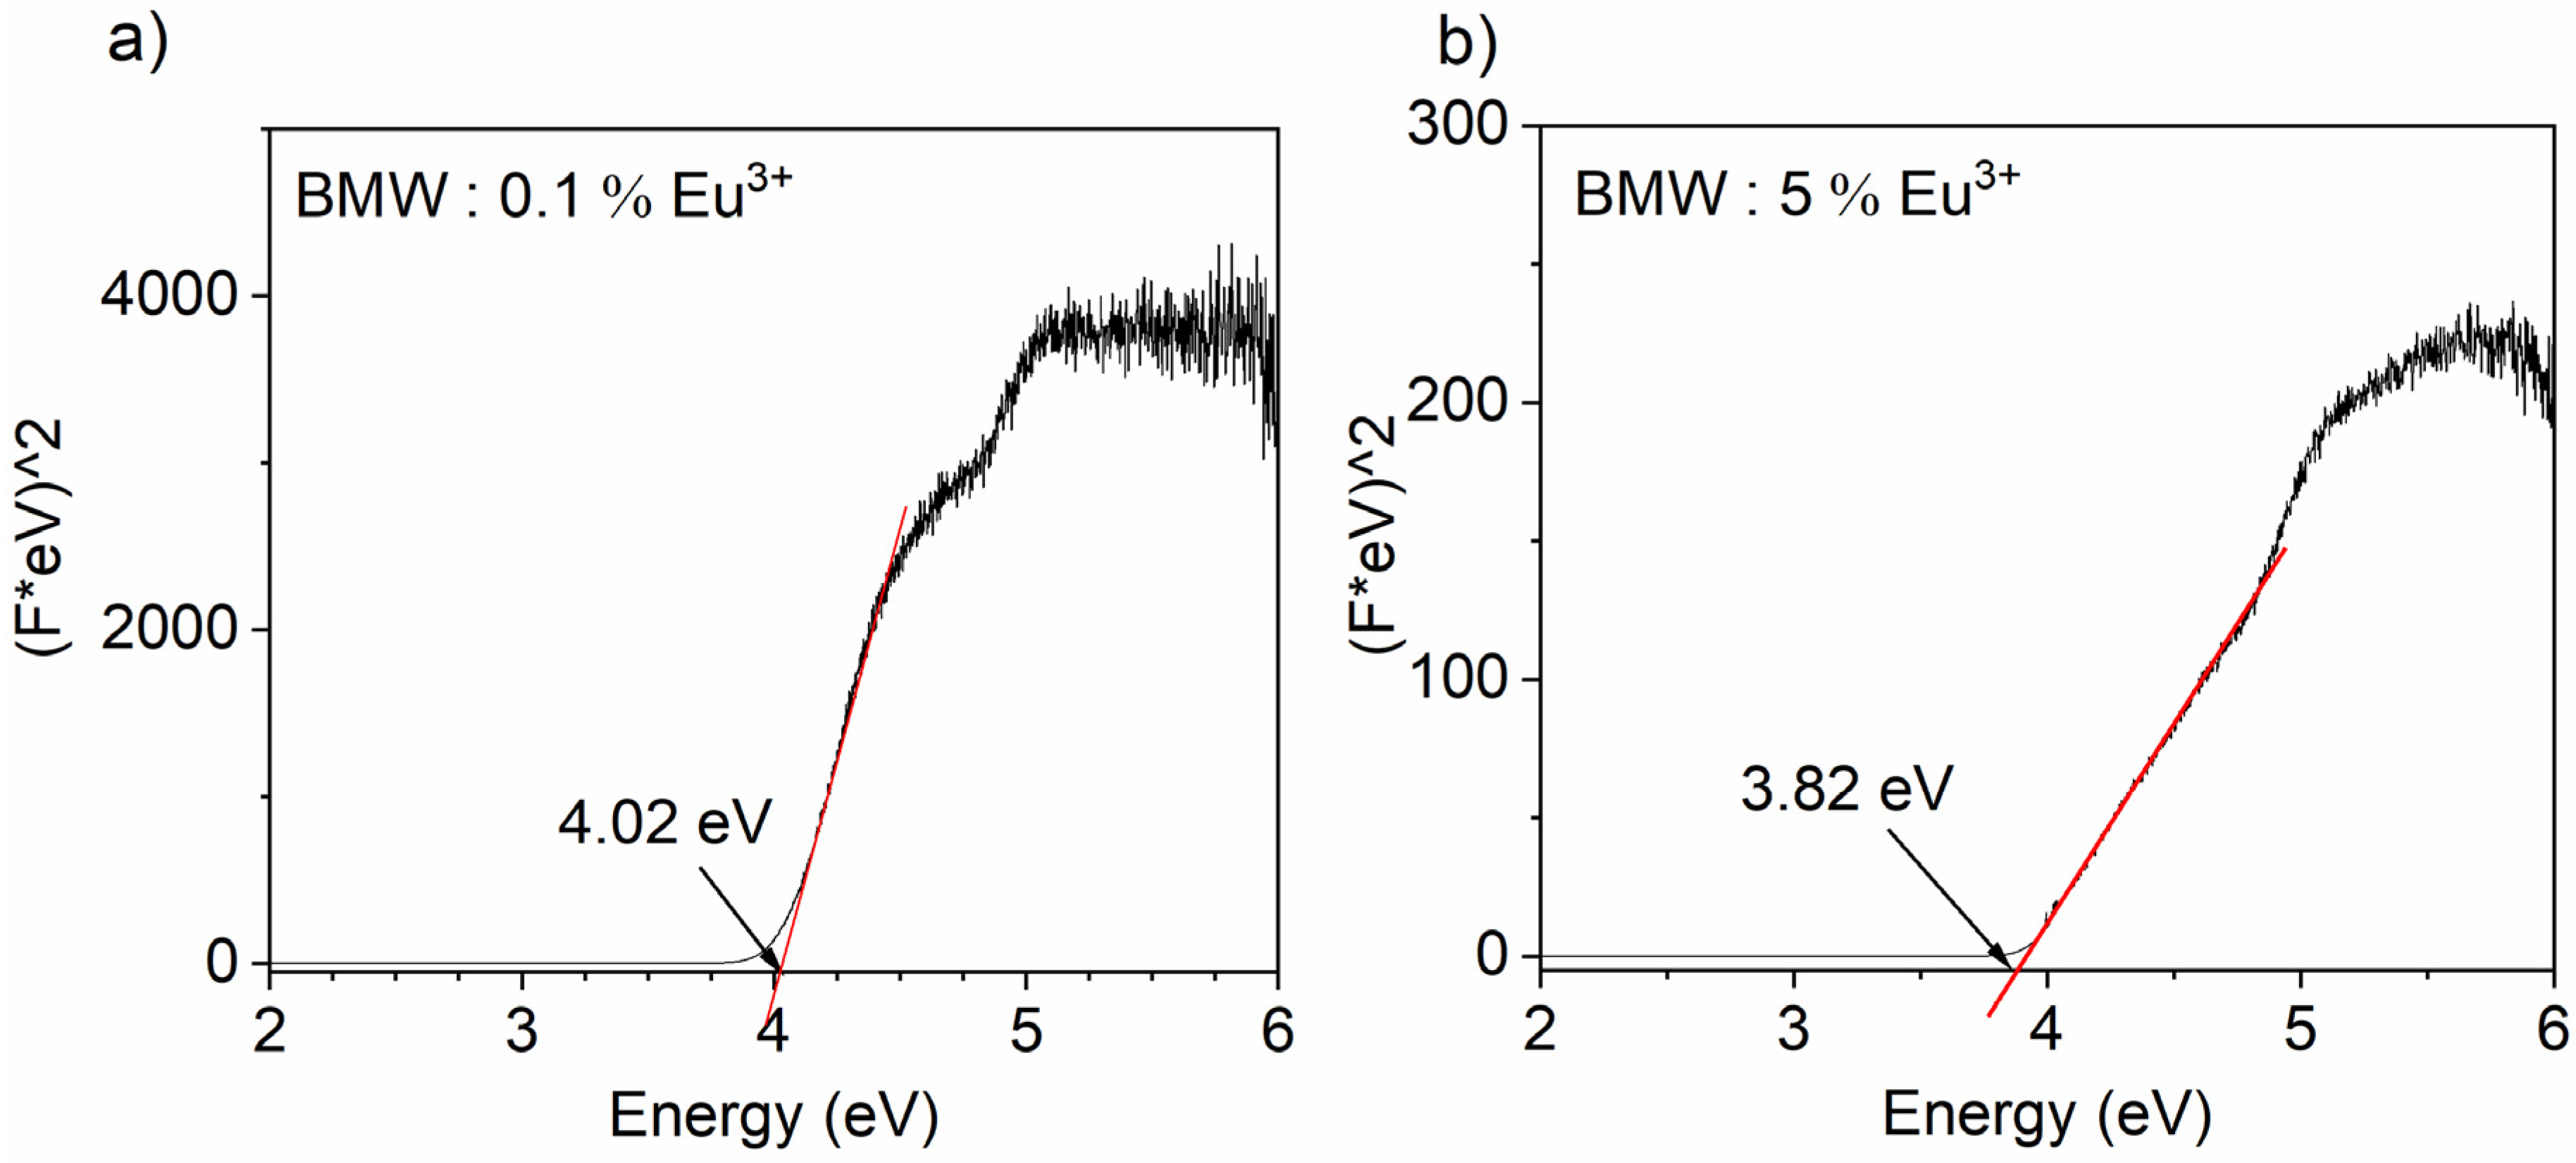
The absorption spectra registered at 300 K were useful to calculate the energy of the forbidden band-gap of the investigated samples. The band-gap energy Eg was determined by applying the modified Kubelka–Munk function and plotted as (F(R).hv)2 versus hv, also called a Tauc method [14]. It was found that the higher dopant content was used, the smaller band-gap energy was obtained, (see Figure 7). For the lowest Eu3+ concentration, the band-gap energy was 4.02 eV while for the sample doped with 5% of Eu3+, Eg = 3.82 eV.
The 77 K decay curves of the BMW sample doped with 1% Eu3+ was excited at 266 nm and monitored at the different wavelengths corresponding to the transitions from the 5D1 (588 nm, 602 nm) and the 5D0 (596 nm, 722 nm) levels (see Figure 8). The decay curves are multi-exponential in all cases. The first component was usually connected with the nonradiative process, while the longer ones resulted from the emissions from different Eu3+ energy levels depending on the monitored wavelength. The decay of magnetic-dipole transition consisted of two components, one with the short lifetime-related to the nonradiative process-and the longer one, τ = 5.71 ms, characteristic for the Eu3+ located in the site with very high symmetry. The decay time of the 5D1 level was found to be equal to 70 μs, it is much smaller than expected, probably because of the fast nonradiative transition to the lower 5D0 level and also possible cross-relaxation mechanism—the latter will be discussed further.
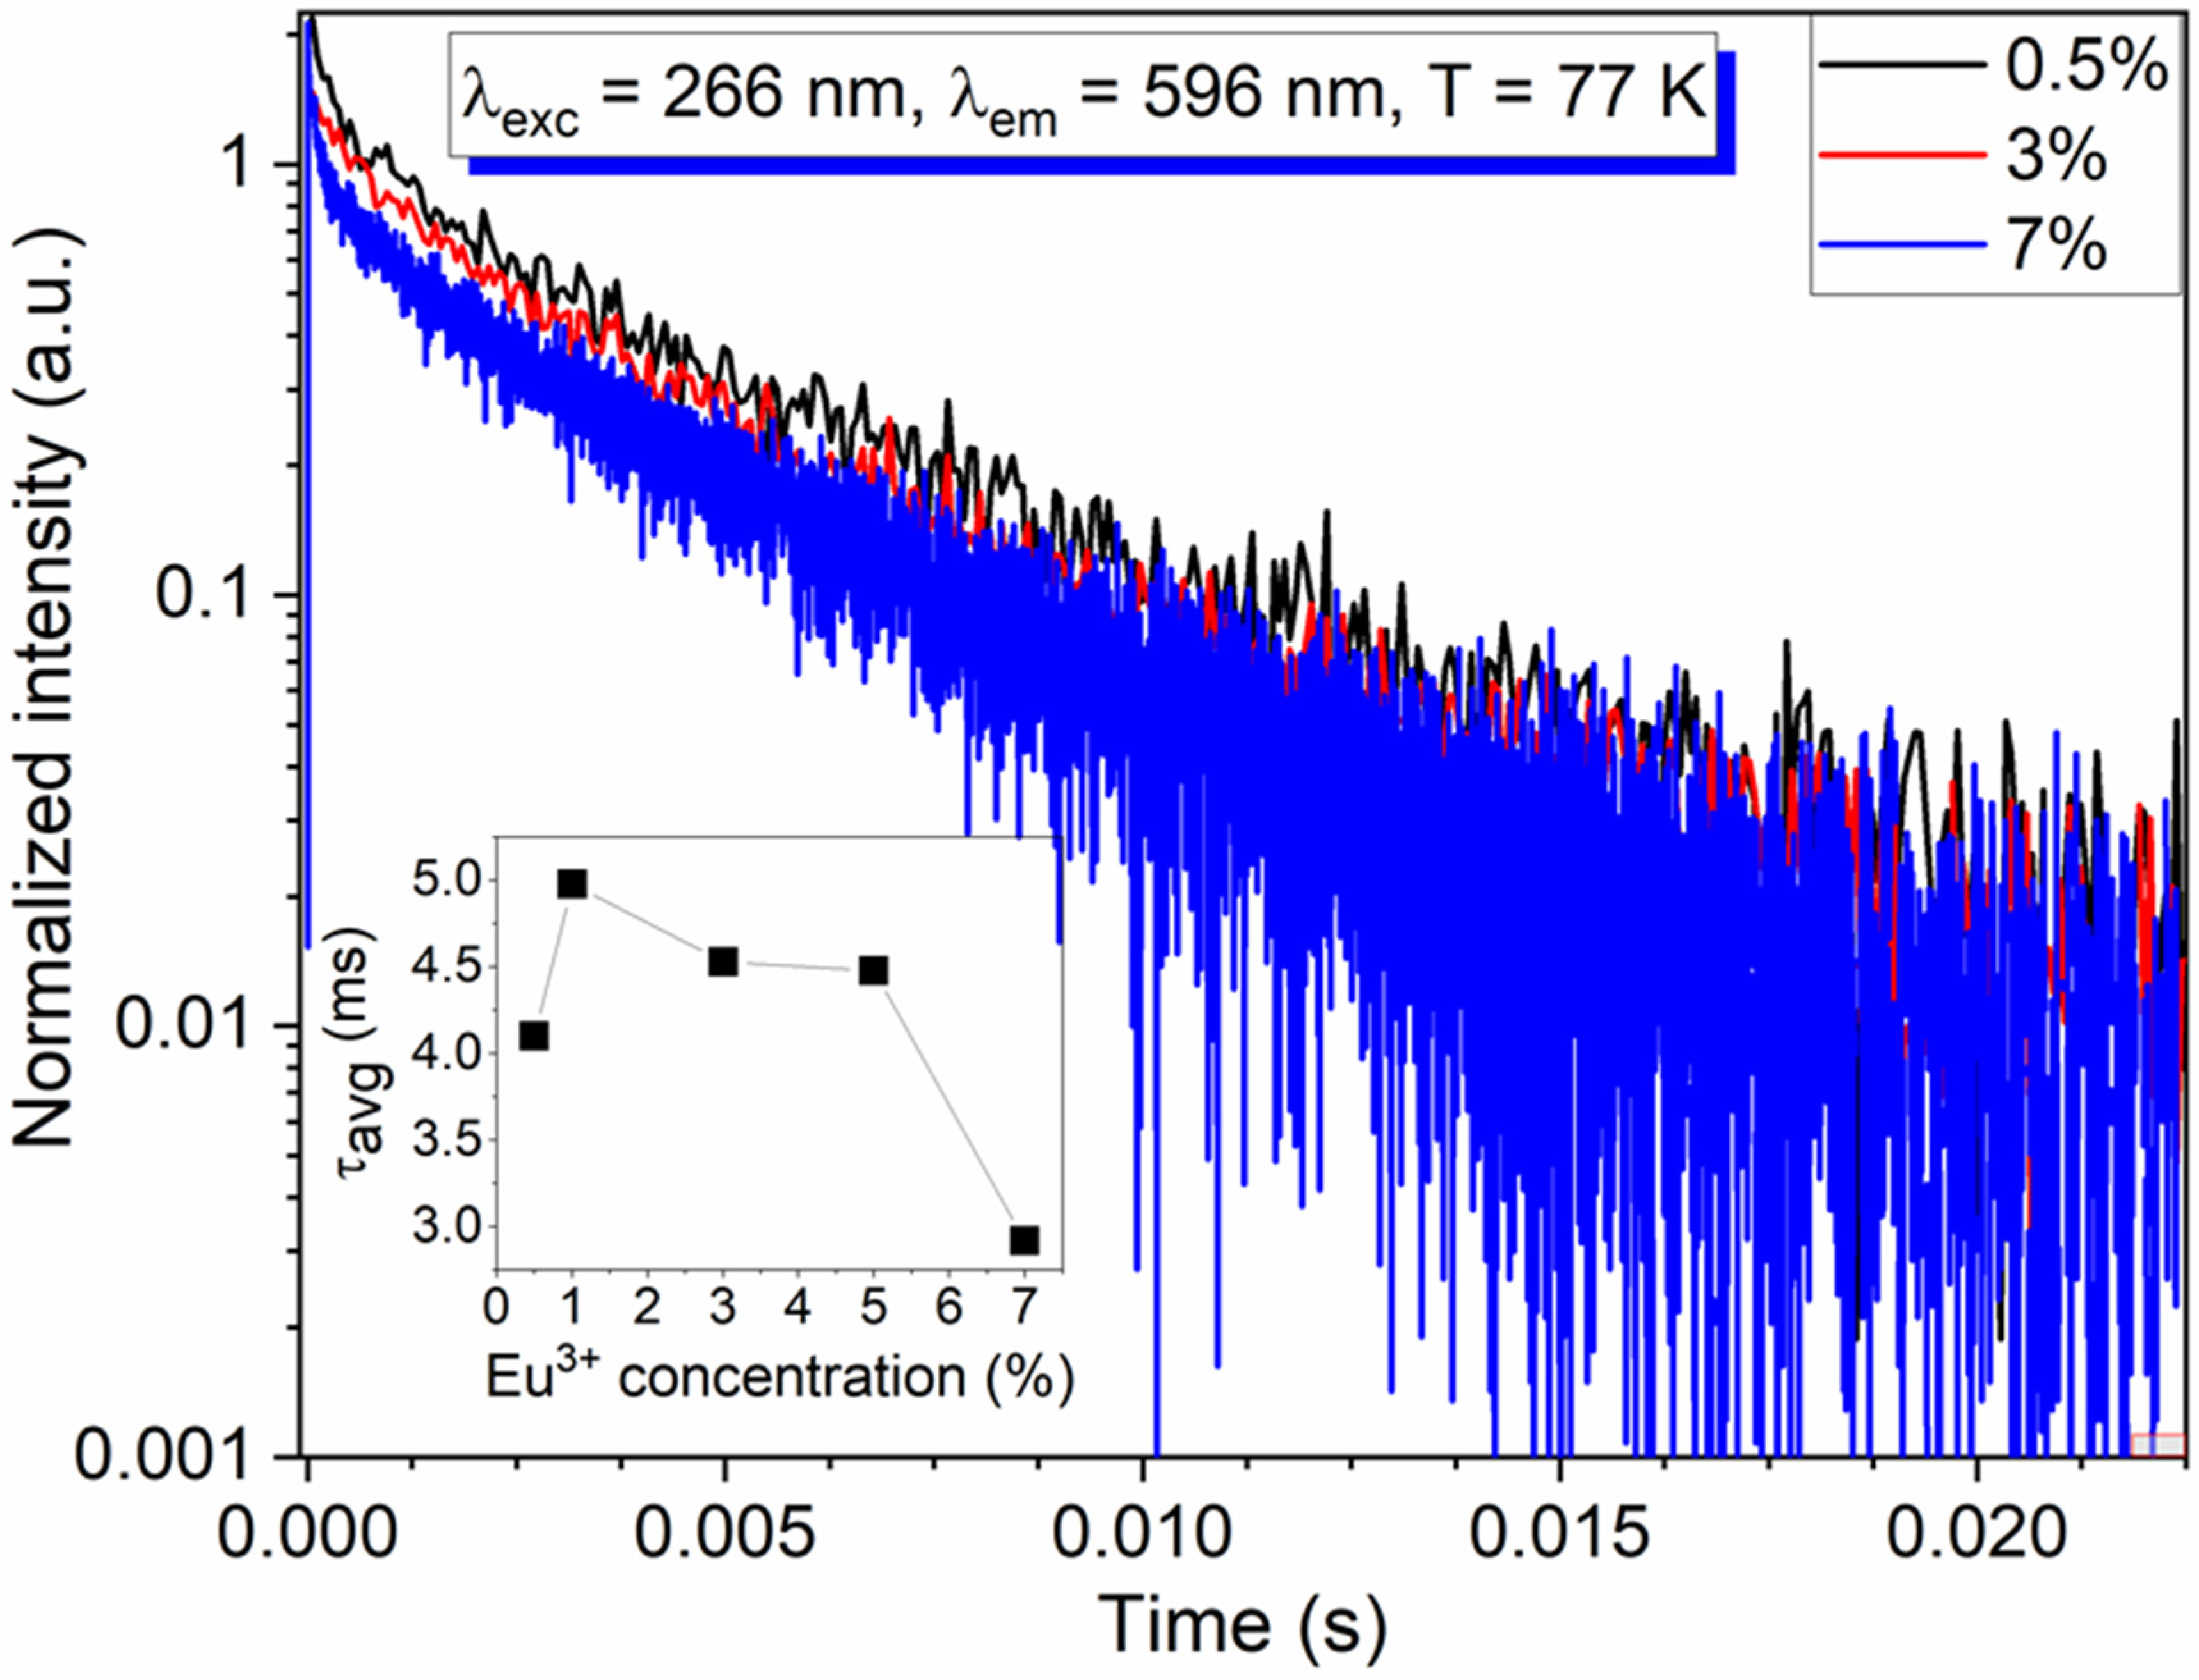
The luminescence kinetics were recorded at 77 K upon excitation at 266 nm. Figure 9 presents the 5D07F1 emission decay profiles of the BMW doped with 0.5%, 3%, and 7% of Eu3+ ions. The emission decay curves exhibited the characteristics of the nonexponential function. The average decay time can be expressed as follow:
τ a v g = 0 ( I ( t ) × t ) d t 0 I ( t ) d t 0 t m a x ( I ( t ) × t ) d t 0 t m a x I ( t ) d t
where I(t) is the emission intensity at time t, 0 < t < tmax. The emission average decay time gradually decreased from 5 ms to 2.9 ms with an increase of Eu3+ concentration from 1% to 7%, respectively. Two factors could explain this observation, one is the nonradiative processes, which are undoubtedly present. Second the distortion of the Eu3+ coordination polyhedra due to the increase of the dopant concentration. We recall here that the effective doping is twice as important as in the previous study [3,4] because of the presence of Li+. The distortion causes a slight decrease in the symmetry, so the transition probability increases, although the emission still dominates the MD transition.
The Judd–Ofelt (J-O) intensity parameters (Ωλ, where λ = 2, 4, 6) were calculated on the basis of the BMW: Eu3+ (5%) emission spectrum excited at 266 nm and recorded at 300 K. Exactly the same formalism and the same set of equations were used as in our previous work [3]. The refractive index “n” of the BMW host is 1.874 [3]. The matrix elements U(2) = 0.0035, U(4) = 0.003 and U(6) = 0.0005 from the work of K. Binnemans [8] were applied for the calculations.
Using the Ωλ parameters, the Aij transition rates, the βij branching ratios, were calculated for the 5D07FJ transitions (where J = 1, 2, 4, 6) (see Table 1 and Table 2). A recent analysis in the frame of J-O theory for the BMW: Eu3+ (2%) solid-state sample was carried out at 395 nm of excitation [3]. However, there is a possibility that excitation at 395 nm will be absorbed by all Eu3+ ions-including those which could be in the additional, foreign phases present in the sample. Consequently, this time, the emission was excited with the 4th harmonic of the Nd: YAG laser reaching the O2- → Eu3+ charge transfer band, both for the solid-state and co-precipitation samples.
There is very little difference among J-O parameters between sample synthesized by co-precipitation and solid-state method (see Table 1, Table 2 and Table 3). The value of Ω2 is twofold smaller than that of Ω6. The increase in the concentration of Eu3+ from 2% to 5% leads to a modification of the Ωλ (see Table 3). These are phenomenological parameters which only depend on the matrix. An increase in the concentration of dopant ions having a larger diameter and a different charge than the replaced Mg2+ must cause the deformation of the matrix. We must not forget either that with 5% Eu3+, we introduce 5% Li+.
The Ω𝜆 values found in this work are comparable with other results obtained in similar tungstate double perovskites but with lower symmetry (Li, Na, K)LaMgWO6 [15]. Due to the fact that Ω2 is very sensitive to the angular changes while Ω4 and Ω6 are mostly affected by bond covalence between dopants and ligands [16]. As a result, a distinction among various tungstate double perovskites was observed, Ω2 values of (Li, Na, K)LaMgWO6 with lower site symmetry are seven times higher in comparison with those of the higher site symmetry (Oh) in BMW. The Ω4 value of (Li, Na, K)LaMgWO6 is also fivefold higher than those of BMW while the Ω6 value is quite similar, except for KLaMgWO6.
Besides, the rates of total, radiative, non-radiative transition along with the theoretical radiative and experimental decay time as well as the quantum efficiency of sample BMW: Eu3+ are presented in Table 2. For sample prepared by co-precipitation and solid-state, the calculated radiative decay times are 4.96 and 5.31 ms and the quantum efficiencies are 90.2% and 85 %, respectively.
The temperature-dependent emission spectra under excitation at 266 nm were performed in the temperature range from 80–730 K (Figure 10a). The emission intensity does not change much up to 200 K. Above this temperature, emission intensity significantly decreases. The temperature quenching, at which the integrated intensity of emission decreased half in comparison with the initial emission intensity (T0.5) was at around 350 K (Figure 10b). The emission intensity of transitions from the 5D1 level was also quenched, along with the transitions from the 5D0 level. Figure 10 shows the relationship of ln(I0/I-1) versus 1/kT, two mechanisms responsible for emission quenching took place. The activation energies for thermal quenching were calculated to be 0.09 eV and 0.23 eV. The first one is due to the process which operates in the 80–350 K temperature range. Above 350 K, the second process is switched on and is more effective in the emission quenching. The first process is of the same nature as that observed in LaAlO3: Eu3+ and explained in detail by Blasse [17], but the CT state involved here is associated with the O2− ↔ W6+ transition. Here, the same approach was applied to support the single configurational coordinate model depicted in Figure 10d. Upon excitation into the charge transfer state-transition A → B, some part of the excitation energy relaxes to point C and then to Eu3+, and the rest, with thermal excitation, flows from the CTS to the Eu3+ ground state via point D. (see Figure 10d). The other nonradiative process is switched on above 350 K when the 5D1 level becomes thermally populated and is due to the following cross-relaxation: [5D1, 7F0] → [5D0, 7F3] (see points F and E in Figure 10d). Its activation energy (∆Ea = 0.23 eV = 1855 cm−1) is related to the difference energy between the 5D0 and 5D1 and 7F07F3 levels.

4. Conclusions

The co-precipitation method was successfully employed in the synthesis of Ba2MgWO6 double perovskite doped with Eu3+ ions. Dopant replaces with Mg2+ and is located at the Oh site with the inversion center. The mean size of the particles determined from SEM images was around 209 nm. The single line of the 5D07F0 transition and the dominance of the 5D07F1 one are undeniable evidence that europium ions occupy one highly symmetrical site in the BMW host. The strongest emission was observed for 5% of Eu3+. The broad band from 250 to 350 nm in the PLE spectrum corresponds to the O2− → Eu3+ and O2− → W6+ charge transfer transitions. Our results are in good agreement with Blasse’s theory, which describes the relationship between Eu3+–O2− distance with localization of CTS maximum and emission efficiency. The thermal quenching investigation showed that cross-relaxation processes generally quench the emission of Eu3+ at temperatures higher than 350 K. At lower temperatures, the excitation energy is lost through the crossing point of the CTS state and the Eu3+ ground level. We believe that this material will be perfect for producing transparent or translucent ceramics.

Supplementary Materials

The following are available online at https://www.mdpi.com/1996-1944/13/7/1614/s1, Table S1. Tentative assignment of the lines from the emission spectra of Ba2MgWO6: 5% Eu3+ based on measurements at 300 K, 77 K and 10 K.

Author Contributions

Conceptualization, D.S. and P.J.D.; methodology, T.H.Q.V., D.S. and B.B., P.J.D.; validation, P.J.D. and D.S.; formal analysis, P.J.D.; investigation, T.H.Q.V. and, B.B.; resources, T.H.Q.V., and N.M.; data curation, T.H.Q.V., B.B., D.S., and P.J.D.; writing—original draft preparation, T.H.Q.V.; writing—review and editing, T.H.Q.V., B.B., D.S., N.M. and P.J.D.; visualization, T.H.Q.V.; supervision, P.J.D.; project administration, P.J.D.; funding acquisition, P.J.D. All authors have read and agreed to the published version of the manuscript.

Funding

This work was supported by “The National Science Centre Poland” under Grant no. 2017/25/B/ST5/02670, as a part of the research project implementation OPUS13.

Acknowledgments

The authors wish to thank to M. Sc. E. Bukowska for XRD measurements and to D. Szymanski for SEM.

Conflicts of Interest

The authors declare no conflict of interest.

References

  1. Chen, Y.C.; Wang, Y.N.; Syu, R.Y. Effect of sintering temperature on microstructures and microwave dielectric properties of Ba2MgWO6 ceramics. J. Mater. Sci. Mater. Electron. 2016, 27, 4259–4264. [Google Scholar] [CrossRef]
  2. De Aguiar1, L.A.; Lapa1, C.M.; Ferreira1, R.A.S.; Aguiar, J.A.; da Silva, C.L.; de Souza, D.P.F. Production, sintering and microstructural characteristics of Ba2MgWO6 ceramics, (n.d.). Mater. Sci. 2005, 498, 523–528. [Google Scholar]
  3. Miniajluk, N.; Bondzior, B.; Stefańska, D.; Dereń, P.J. Eu3+ ions in the highly symmetrical octahedral site in Ba2MgWO6 double perovskite. J. Alloys Compd. 2019, 802, 190–195. [Google Scholar] [CrossRef]
  4. Han, B.; Liu, B.; Zhang, J.; Shi, H. Luminescence properties of novel Ba2MgWO6:Eu3+ and g-C3N4/Ba2MgWO6:Eu3+ phosphors. Optik 2017, 131, 764–768. [Google Scholar] [CrossRef]
  5. B, J.H.G.; Van Oosterhout, A.B. Defect luminescence of ordered perovskites A2BWO6. J. Lumin. 1975, 10, 237–242. [Google Scholar]
  6. Shannon, R.D. Revised Effective Ionic Radii and Systematic Studies of Interatomie Distances in Halides and Chaleogenides. Acta Crystallogr. Sect. A 1976, 32, 751–767. [Google Scholar] [CrossRef]
  7. Bugaris, D.E.; Hodges, J.P.; Huq, A.; Loye, H.-C.Z. Crystal growth, structures, and optical properties of the cubic double perovskites Ba2MgWO6 and Ba2ZnWO6. J. Solid State Chem. 2011, 184, 2293–2298. [Google Scholar] [CrossRef]
  8. Binnemans, K. Interpretation of europium(III) spectra. Coord. Chem. Rev. 2015, 295, 1–45. [Google Scholar] [CrossRef] [Green Version]
  9. Li, Y.; Liu, X. Structure and luminescence properties of Ba3WO6:Eu3+ nanowire phosphors obtained by conventional solid-state reaction method. Opt. Mater. (Amst) 2014, 38, 211–216. [Google Scholar] [CrossRef]
  10. Jiao, M.; Yang, C.; Liu, M.; Xu, Q.; Yu, Y.; You, A.H. Mo6+ substitution induced band structure regulation and efficient near-UV-excited red emission in NaLaMg(W,Mo)O6:Eu. Phosphor 2017, 7, 2660–2671. [Google Scholar] [CrossRef]
  11. Pa̧zik, R.; Watras, A.; MacAlik, L.; Dereń, P.J. One step urea assisted synthesis of polycrystalline Eu3+ doped KYP2O7-luminescence and emission thermal quenching properties. New J. Chem. 2014, 38, 1129–1137. [Google Scholar] [CrossRef]
  12. Watras, A.; Boutinaud, P.; Pazik, R.; Dereń, P.J. Luminescence—Structure relationships in MYP2O7:Eu3+ (M=K, Rb, Cs). J. Lumin. 2016, 175, 249–254. [Google Scholar] [CrossRef]
  13. Rudnicka, D.; Dereń, P.J. Preliminary spectroscopic properties of K4SrSi3O9 doped with Eu3+. Opt. Mater. (Amst) 2013, 35, 2531–2534. [Google Scholar] [CrossRef]
  14. López, R.; Gómez, R. Band-gap energy estimation from diffuse reflectance measurements on sol-gel and commercial TiO2: A comparative study. J. Sol-Gel Sci. Technol. 2012, 61, 1–7. [Google Scholar] [CrossRef]
  15. Ran, W.; Noh, H.M.; Choi, B.C.; Park, S.H.; Kim, J.H.; Jeong, J.H.; Shi, J.; Liu, G. Eu3+ doped (Li, Na, K)LaMgWO6 red emission phosphors: An example to rational design with theoretical and experimental investigation. J. Alloys Compd. 2019, 785, 651–659. [Google Scholar] [CrossRef]
  16. Moura, R.T.; Neto, A.N.C.; Longo, R.L.; Malta, O.L. On the calculation and interpretation of covalency in the intensity parameters of 4f-4f transitions in Eu3+ complexes based on the chemical bond overlap polarizability. J. Lumin. 2016, 170, 420–430. [Google Scholar] [CrossRef]
  17. Blasse, G.; Bril, A.; de Poorter, J.A. Radiationless transitions in the Eu3+ Center in LaAlO3. J. Chem. Phys. 1970, 53, 4450–4453. [Google Scholar] [CrossRef]
Figure 1. Scheme of Ba2MgWO6: Eu3+ preparation using co-precipitation method.
Materials 13 01614 g001
Figure 2. (a) The X-ray powder diffraction of Ba2MgWO6: x% Eu3+, (x = 0.1, 0.5, 1, 3, 4, 5, 7 %) (b) the shifting of position of diffraction lines with Eu3+ concentration and (c) The changing of unit cell volume as a function of Eu3+ concentration.
Materials 13 01614 g002
Figure 3. Crystallite size distribution and SEM image of Ba2MgWO6: 3% Eu3+.
Materials 13 01614 g003
Figure 4. The 300 K emission spectra of Ba2MgWO6: x% Eu3+, (x = 0.1, 0.5, 1, 3, 4, 5, 7%) recorded under 266 nm excitation Nd: YAG line. Inset: the integrated emission intensity and the R parameter (see text for explanation) in function of Eu3+ concentration.
Materials 13 01614 g004
Figure 5. The 300 K (blue), 77 K (red) and 10 K (black) emission spectra of Ba2MgWO6: 5% Eu3+ excited at 266 nm.
Materials 13 01614 g005
Figure 6. The 300 K excitation spectra of Ba2MgWO6: 5% Eu3+ (black), 3% Eu3+ (red) and 1% Eu3+ (blue) monitored at the 5D07F1 transition.
Materials 13 01614 g006
Figure 7. Forbidden energy band-gaps (Eg) of Ba2MgWO6: x Eu3+, (a) x = 0.1%; (b) x = 5%) calculated from the absorption spectra.
Materials 13 01614 g007
Figure 8. The 77 K decay profiles of Ba2MgWO6: 1% Eu3+ under 266 nm excitation and monitored at different wavelength.
Materials 13 01614 g008
Figure 9. The 77 K decay profiles of Ba2MgWO6: x Eu3+, (x = 0.5, 3, 5, 7%). Inset: the average decay time in function of Eu3+ concentration.
Materials 13 01614 g009
Figure 10. (a) The emission spectra of Ba2MgWO6: 5% Eu3+ measured as a function of temperature; (b) The integrated intensity as a function of temperature; (c) Activated energies (∆Ea) of two processes calculated from a function of ln(I0/I-1) versus 1/kT; (d) Simplified single configurational coordinate energy diagram of Ba2MgWO6: Eu3+.
Materials 13 01614 g010
Table 1. The transition rates, branching ratios for 5D07FJ (J = 1, 2, 4, 6) transitions of BMW: Eu3+.
Sample 5D07F15D07F25D07F45D07F6
Co-precipitationA0-J (s−1)96.3577.6417.829.61
Β0-J (%)47.838.558.854.8
Solid-stateA0-J (s−1)96.3570.3314.427.13
Β0-J (%)51.237.47.63.8
Table 2. Total, radiative and non-radiative transition rates, calculated and experimental decay time and quantum efficiency of BMW: Eu3+.
Atot (s−1)Arad (s−1)Anrad (s−1)τrad (ms)τexp (ms)η (%)
Co-precipitation223.2201.421.84.964.4890.2%
Solid-state222.2 188.2345.314.585
Table 3. The Judd–Ofelt Ω𝜆 ( × 10 20 cm 2 ) parameters for Eu3+ ions in various double perovskites.
Ω2Ω4Ω6Reference
Ba2MgWO6: 5% Eu3+ (co-precipitation)1.180.482.5This work
Ba2MgWO6: 2% Eu3+ (solid-state)1.070.391.83This work
LiLaMgWO6: 0.01% Eu3+ (solid-state)7.272.591.64[15]
NaLaMgWO6: 0.01% Eu3+ (solid-state)7.291.861.8[15]
KLaMgWO6: 0.01% Eu3+ (solid-state)7.535.325.09[15]

