
Tri-Planar Geometric Dimensioning and Tolerancing Characteristics of SS 316L Laser Powder Bed Fusion Process Test Artifacts and Effect of Base Plate Removal

 ,
,  and
and
Abstract
:1. Introduction and Background
- Mechanical characteristics, such as tensile, compressive, flexural strength;
- Material characteristics, such as microstructure and porosity;
- Surface characteristics, such as surface roughness and wear properties;
- Geometric characteristics, such as dimensional accuracy and geometric tolerances.
- Inability to provide the geometric evaluation of major GD&T characteristics;
- Lack of features aligned with x, y, z directions for a robust single setup, tri-planar characterization;
- Lack of variation in feature size, specifically for medium to larger mechanical parts;
- No consideration of the effect of removal of the base plate towards the design and measurement phase or consideration of a very thick base feature not capable of capturing base surface warping effects;
- Inclusion of repetitive and/or redundant features that result in material and measurement time wastage;
- Artifact feature size incompatible with available measurement equipment;
- Lack of numerical simulation tools for predicting the geometric tolerances before actual manufacturing.
- Size, length, angle dimensions, and dimensional tolerances;
- Geometrical tolerancing (deviations in form, orientation, and position).
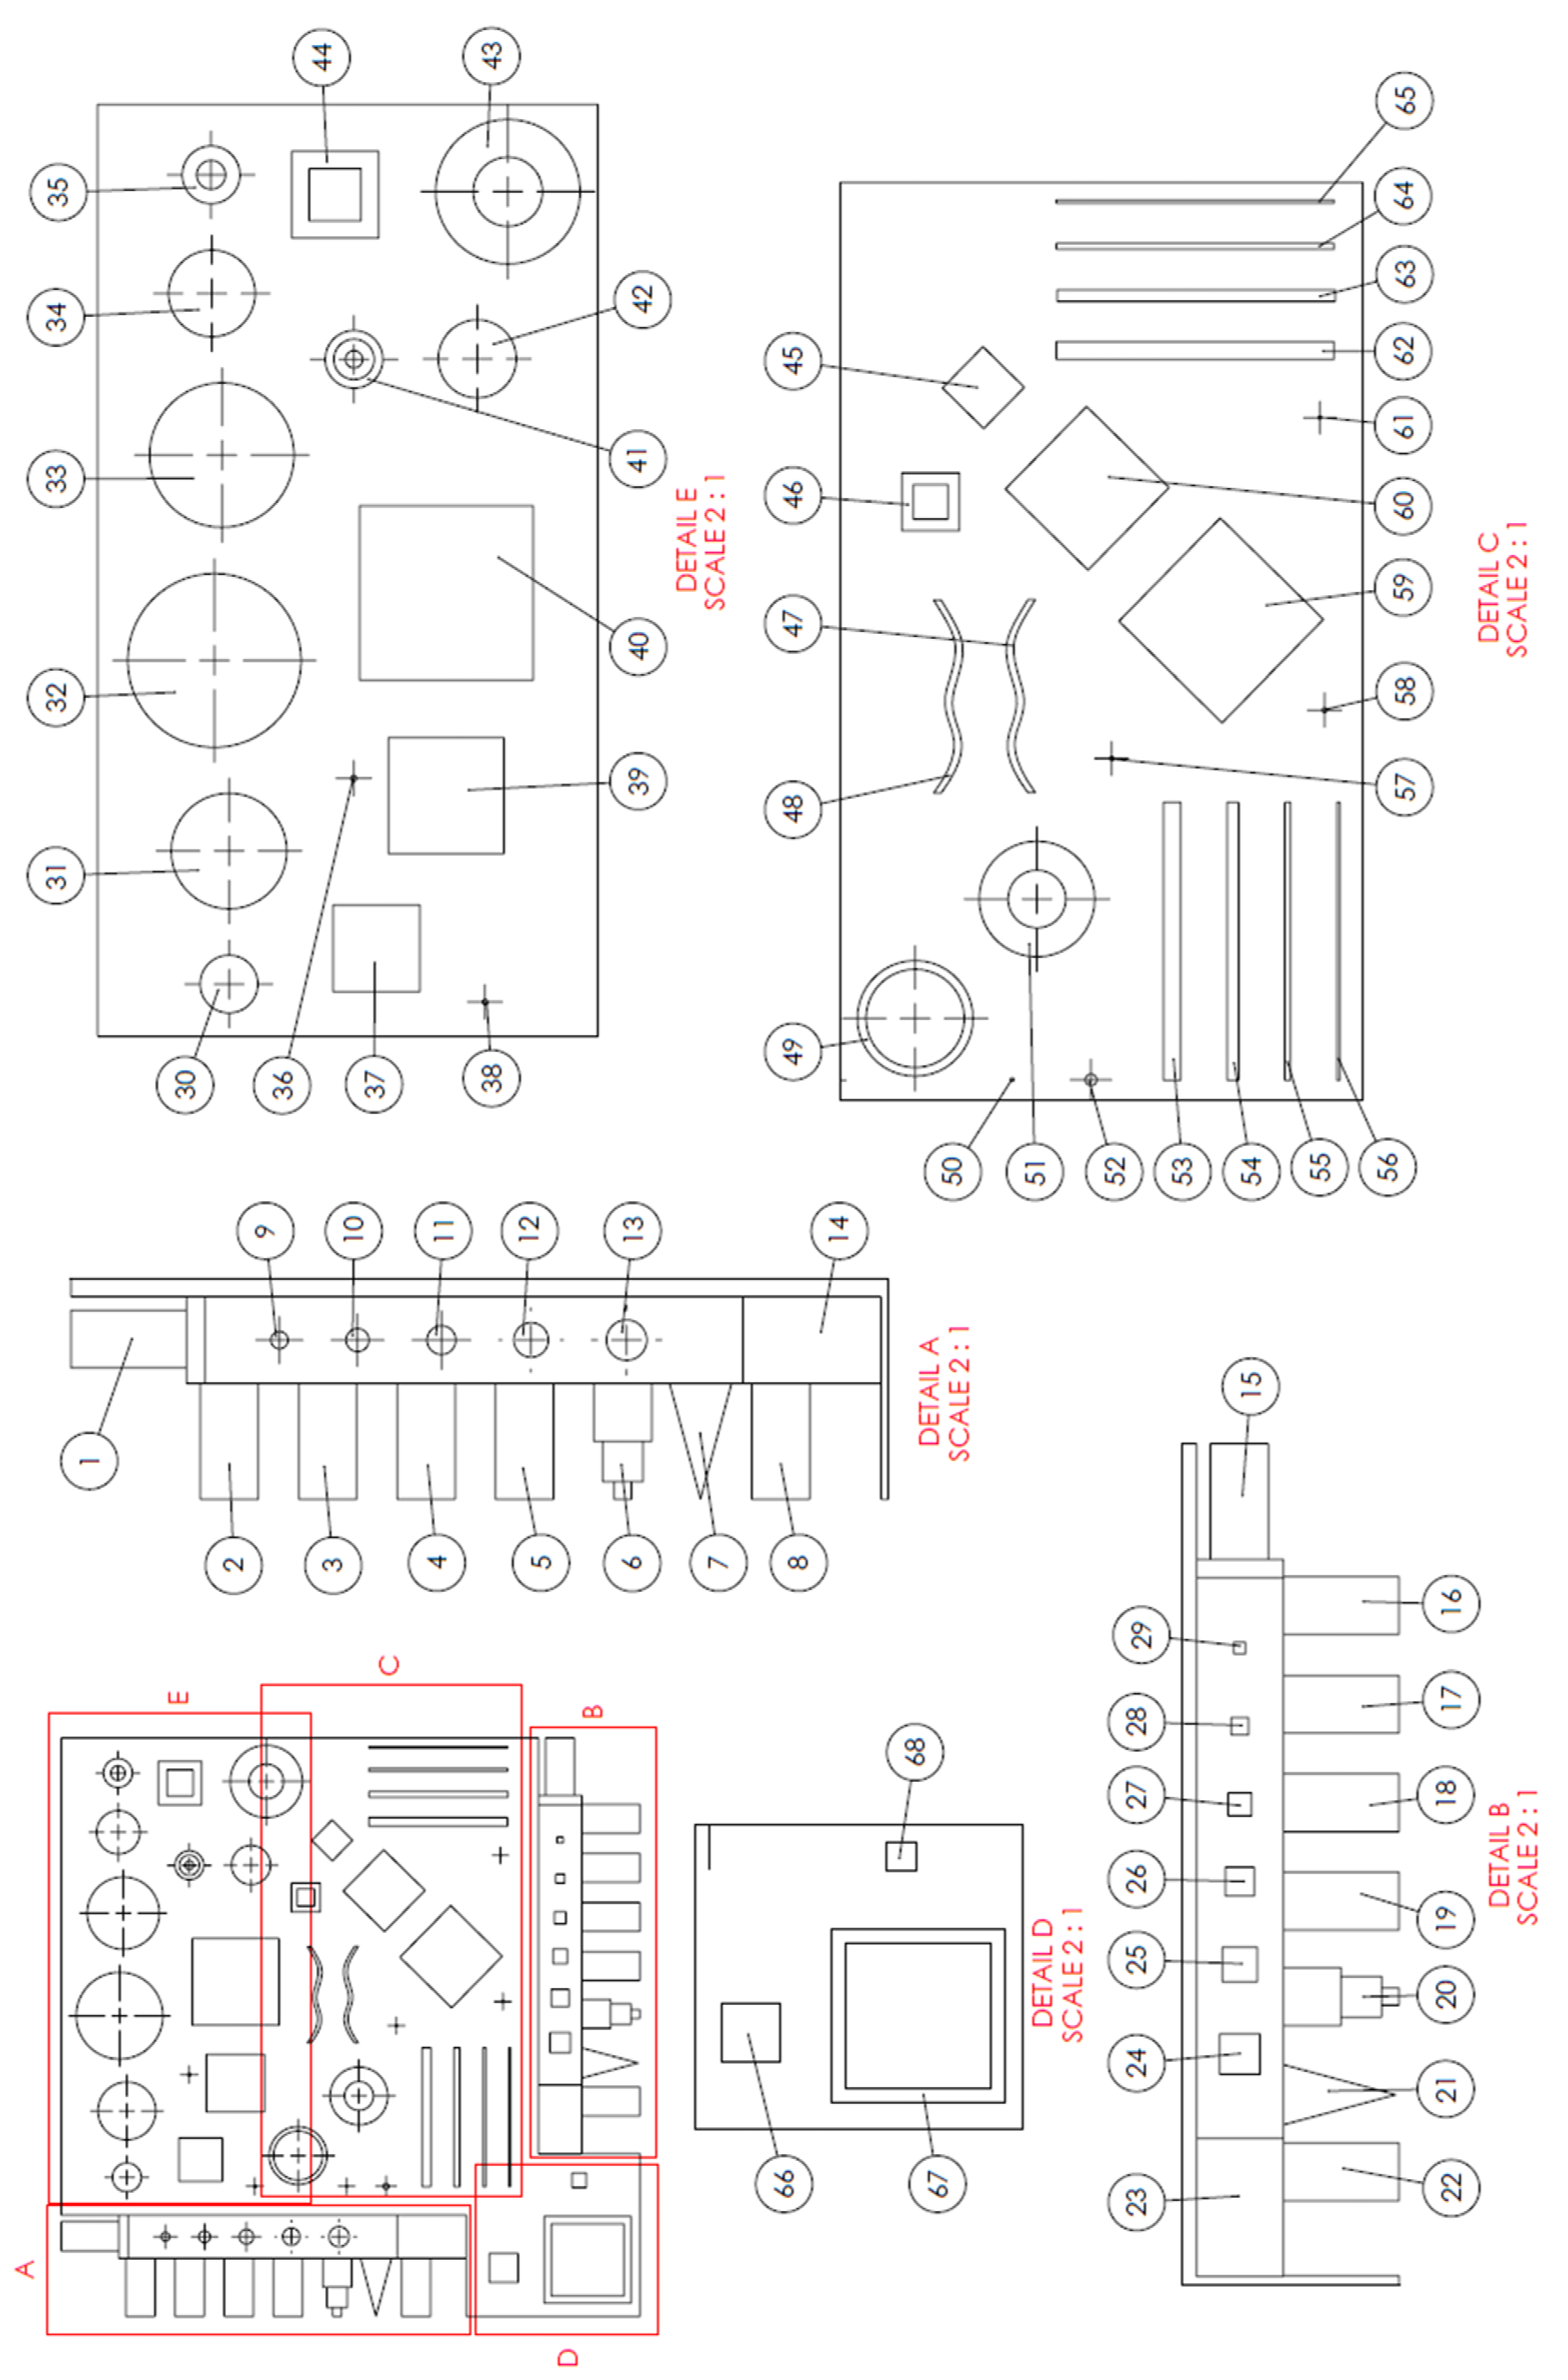
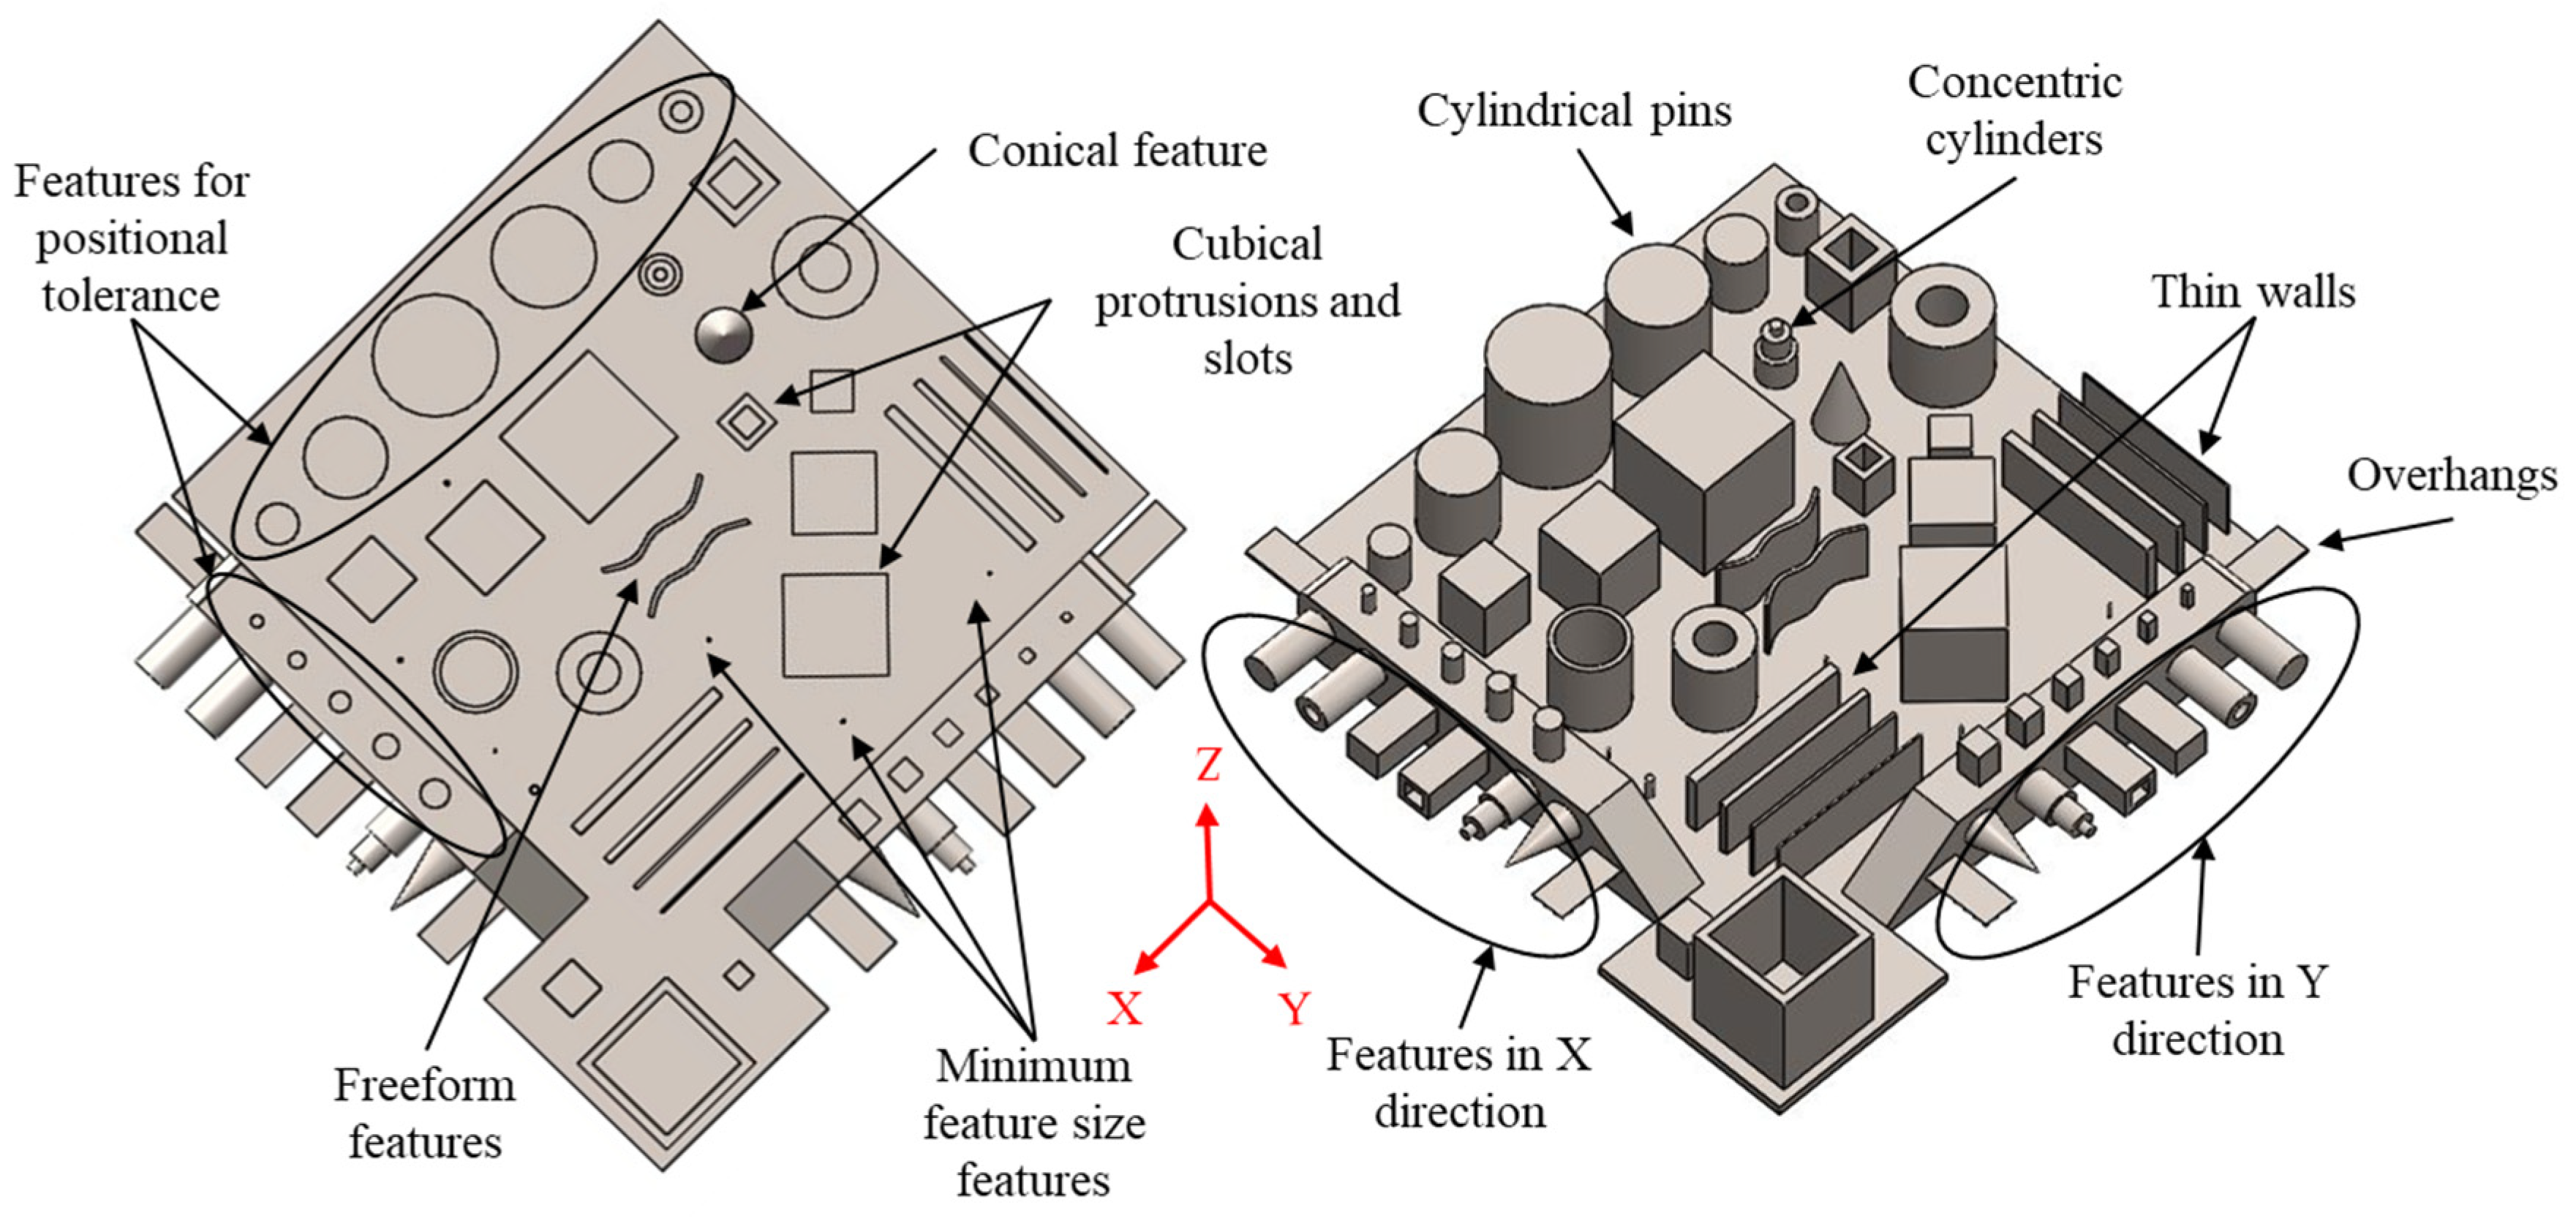
2. Geometric Benchmark Test Artifact Design
- To perform the tri-planar GD&T quantification of the metal AM process;
- To study the effect of base plate removal on GD&T characteristics.
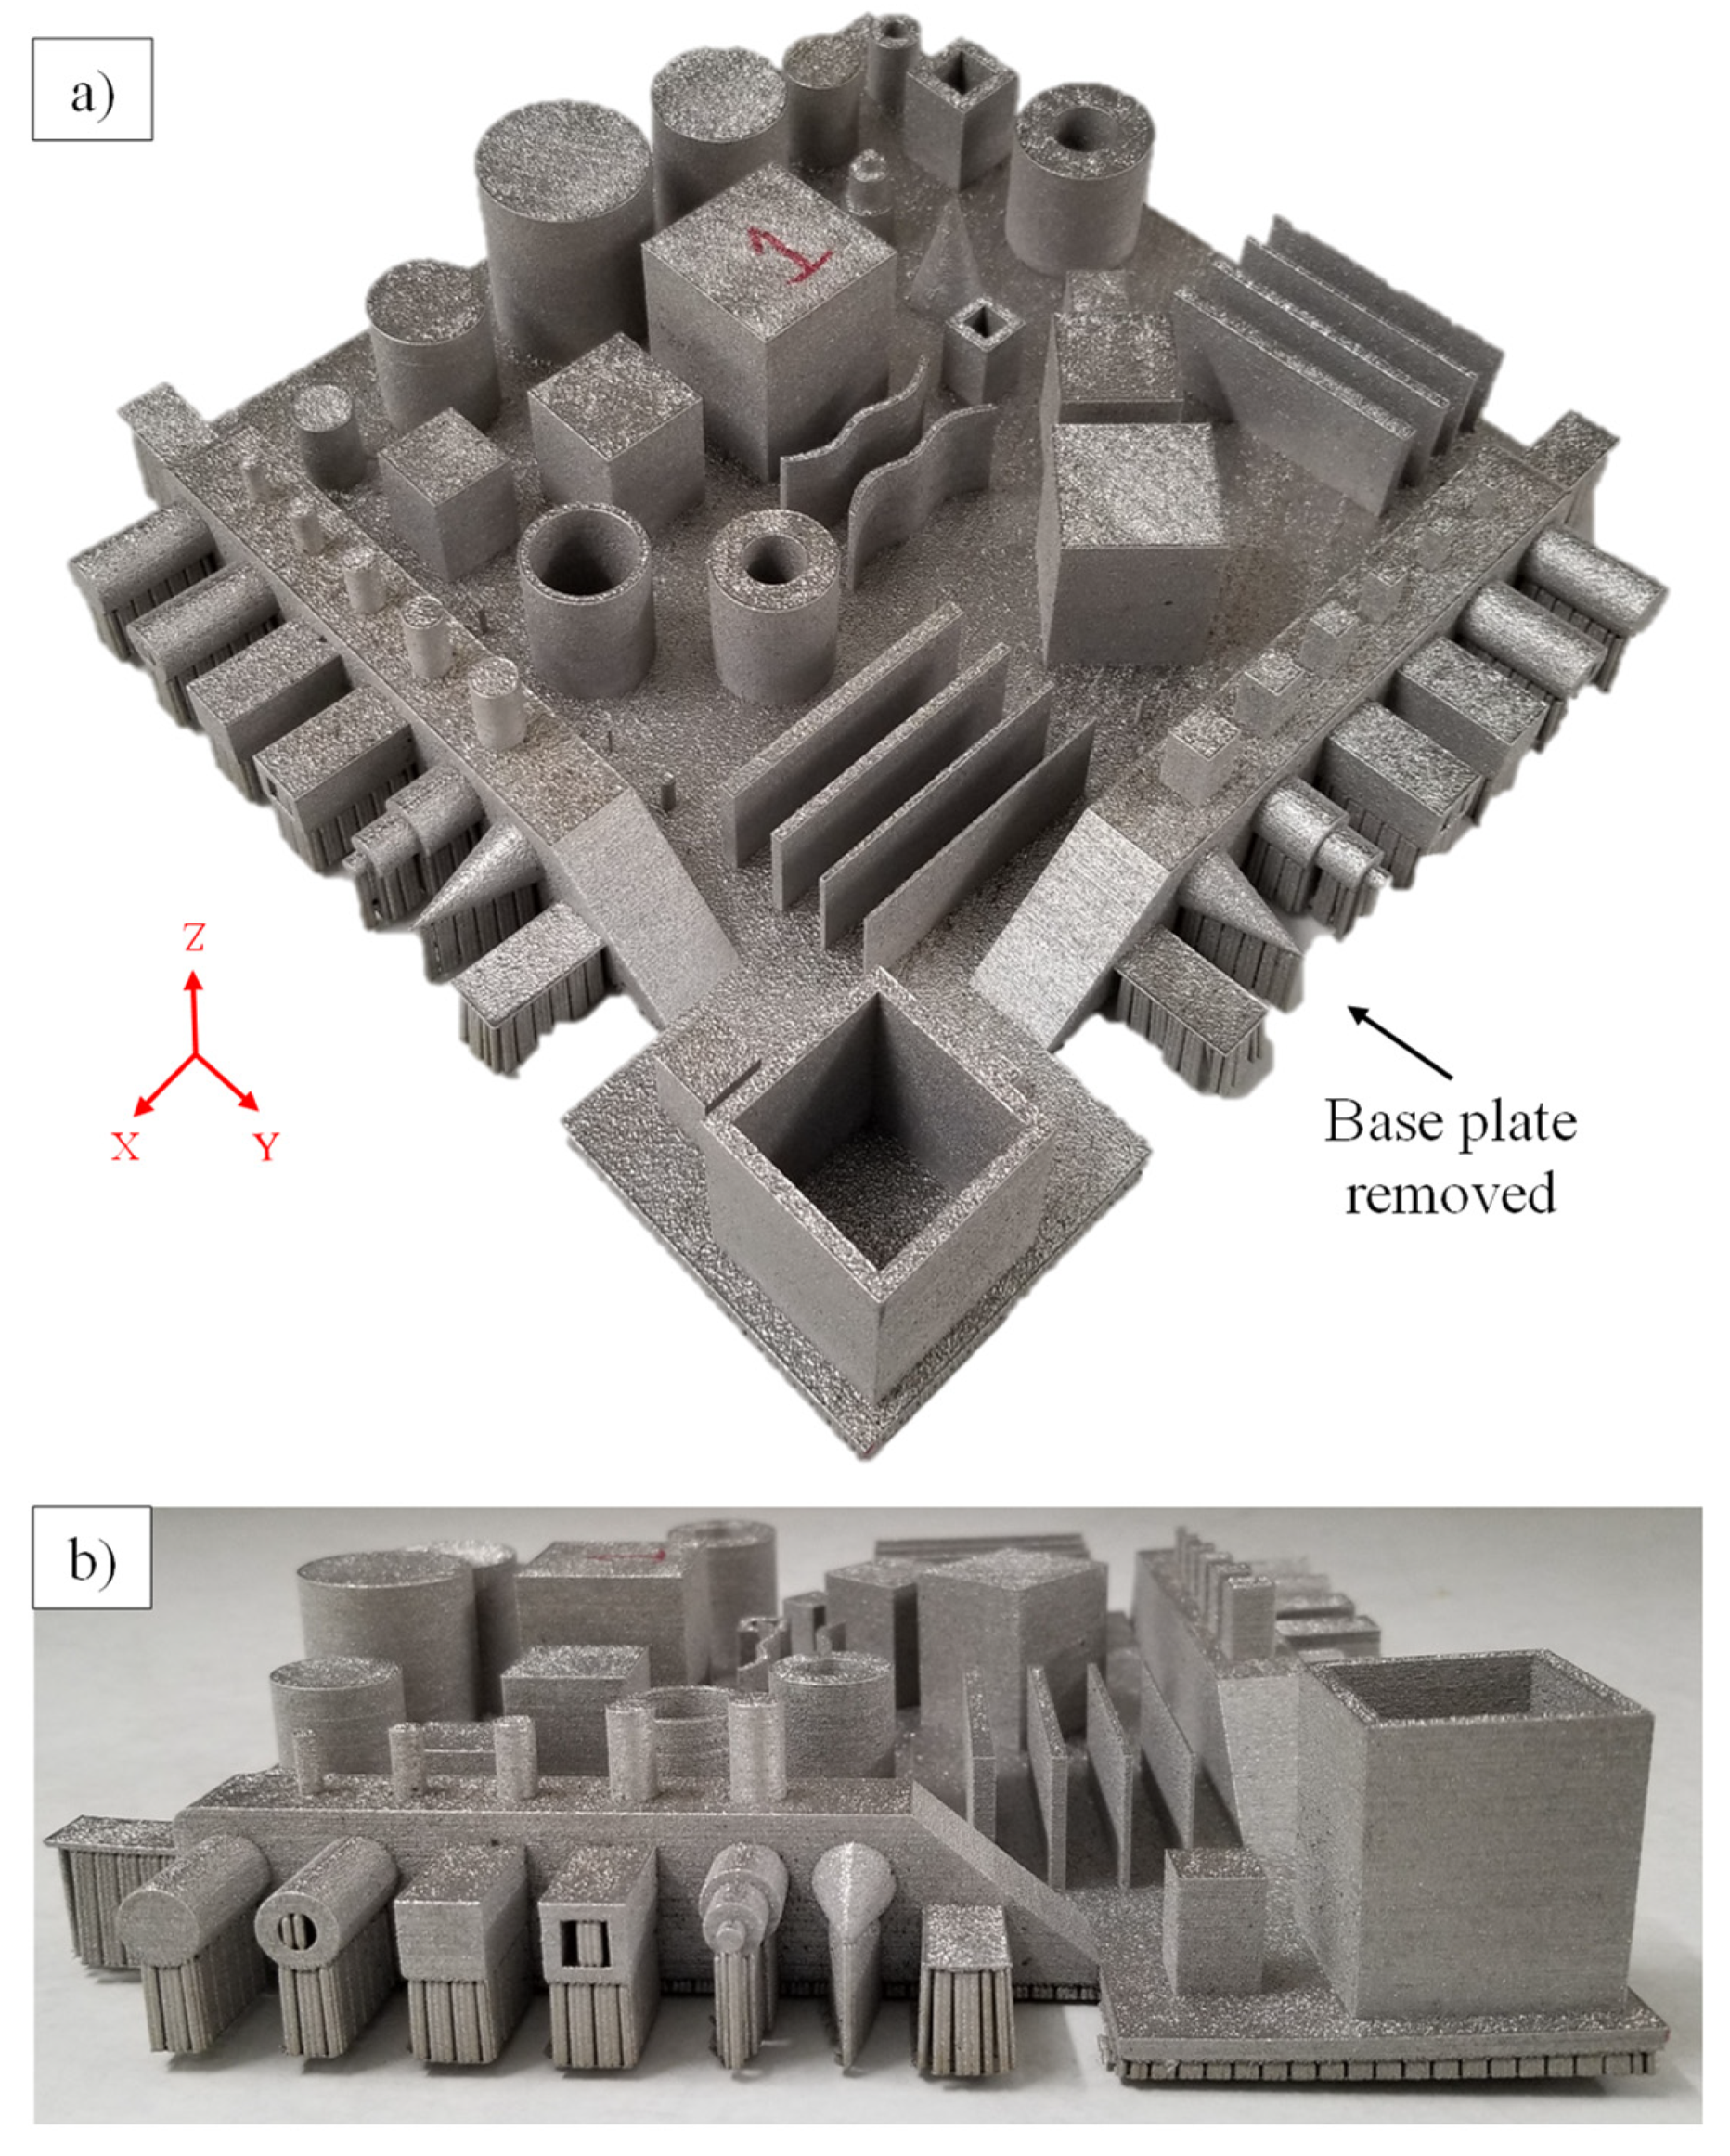
- Printing the features in different orientations on the same GBTA;
- Printing the complete GBTA in different orientations.
- Cuboids: Hollow and solid cuboids selected to quantify straightness, flatness, perpendicularity, and parallelism. Since these are large volume features, the effect of the process on the deviations will be different compared to small volume features, such as thin walls.
- Thin walls: Thin walls of varying dimensions to quantify straightness, flatness, and the effect of residual stresses on the GD&T quantifiers for thin features.
- Cylindrical features: Solid and hollow cylindrical features placed with axes in all three principal directions (X, Y, and Z) to quantify circularity and cylindricity.
- Axially stacked cylinders: Stacked cylinders for measuring concentricity and runout in the X, Y, and Z directions.
- Conical features: For measuring the circularity of features other than cylindrical forms.
- Positional features: Features positioned at specified distances from each other to find positional tolerance zones of features.
- Profile: Profile features with curves to quantify the profiles of a surface and of a line tolerance.
- Minimum size features with diameters and external sizes ranging from 0.5 to 2 mm. This will help to check the ability of the metal AM process in consideration of printing minimum-sized features as well as the effect of the size on the tolerance.
- Thin overhangs: Thin overhang features to understand the effect of support and base removal on thin and fragile features.
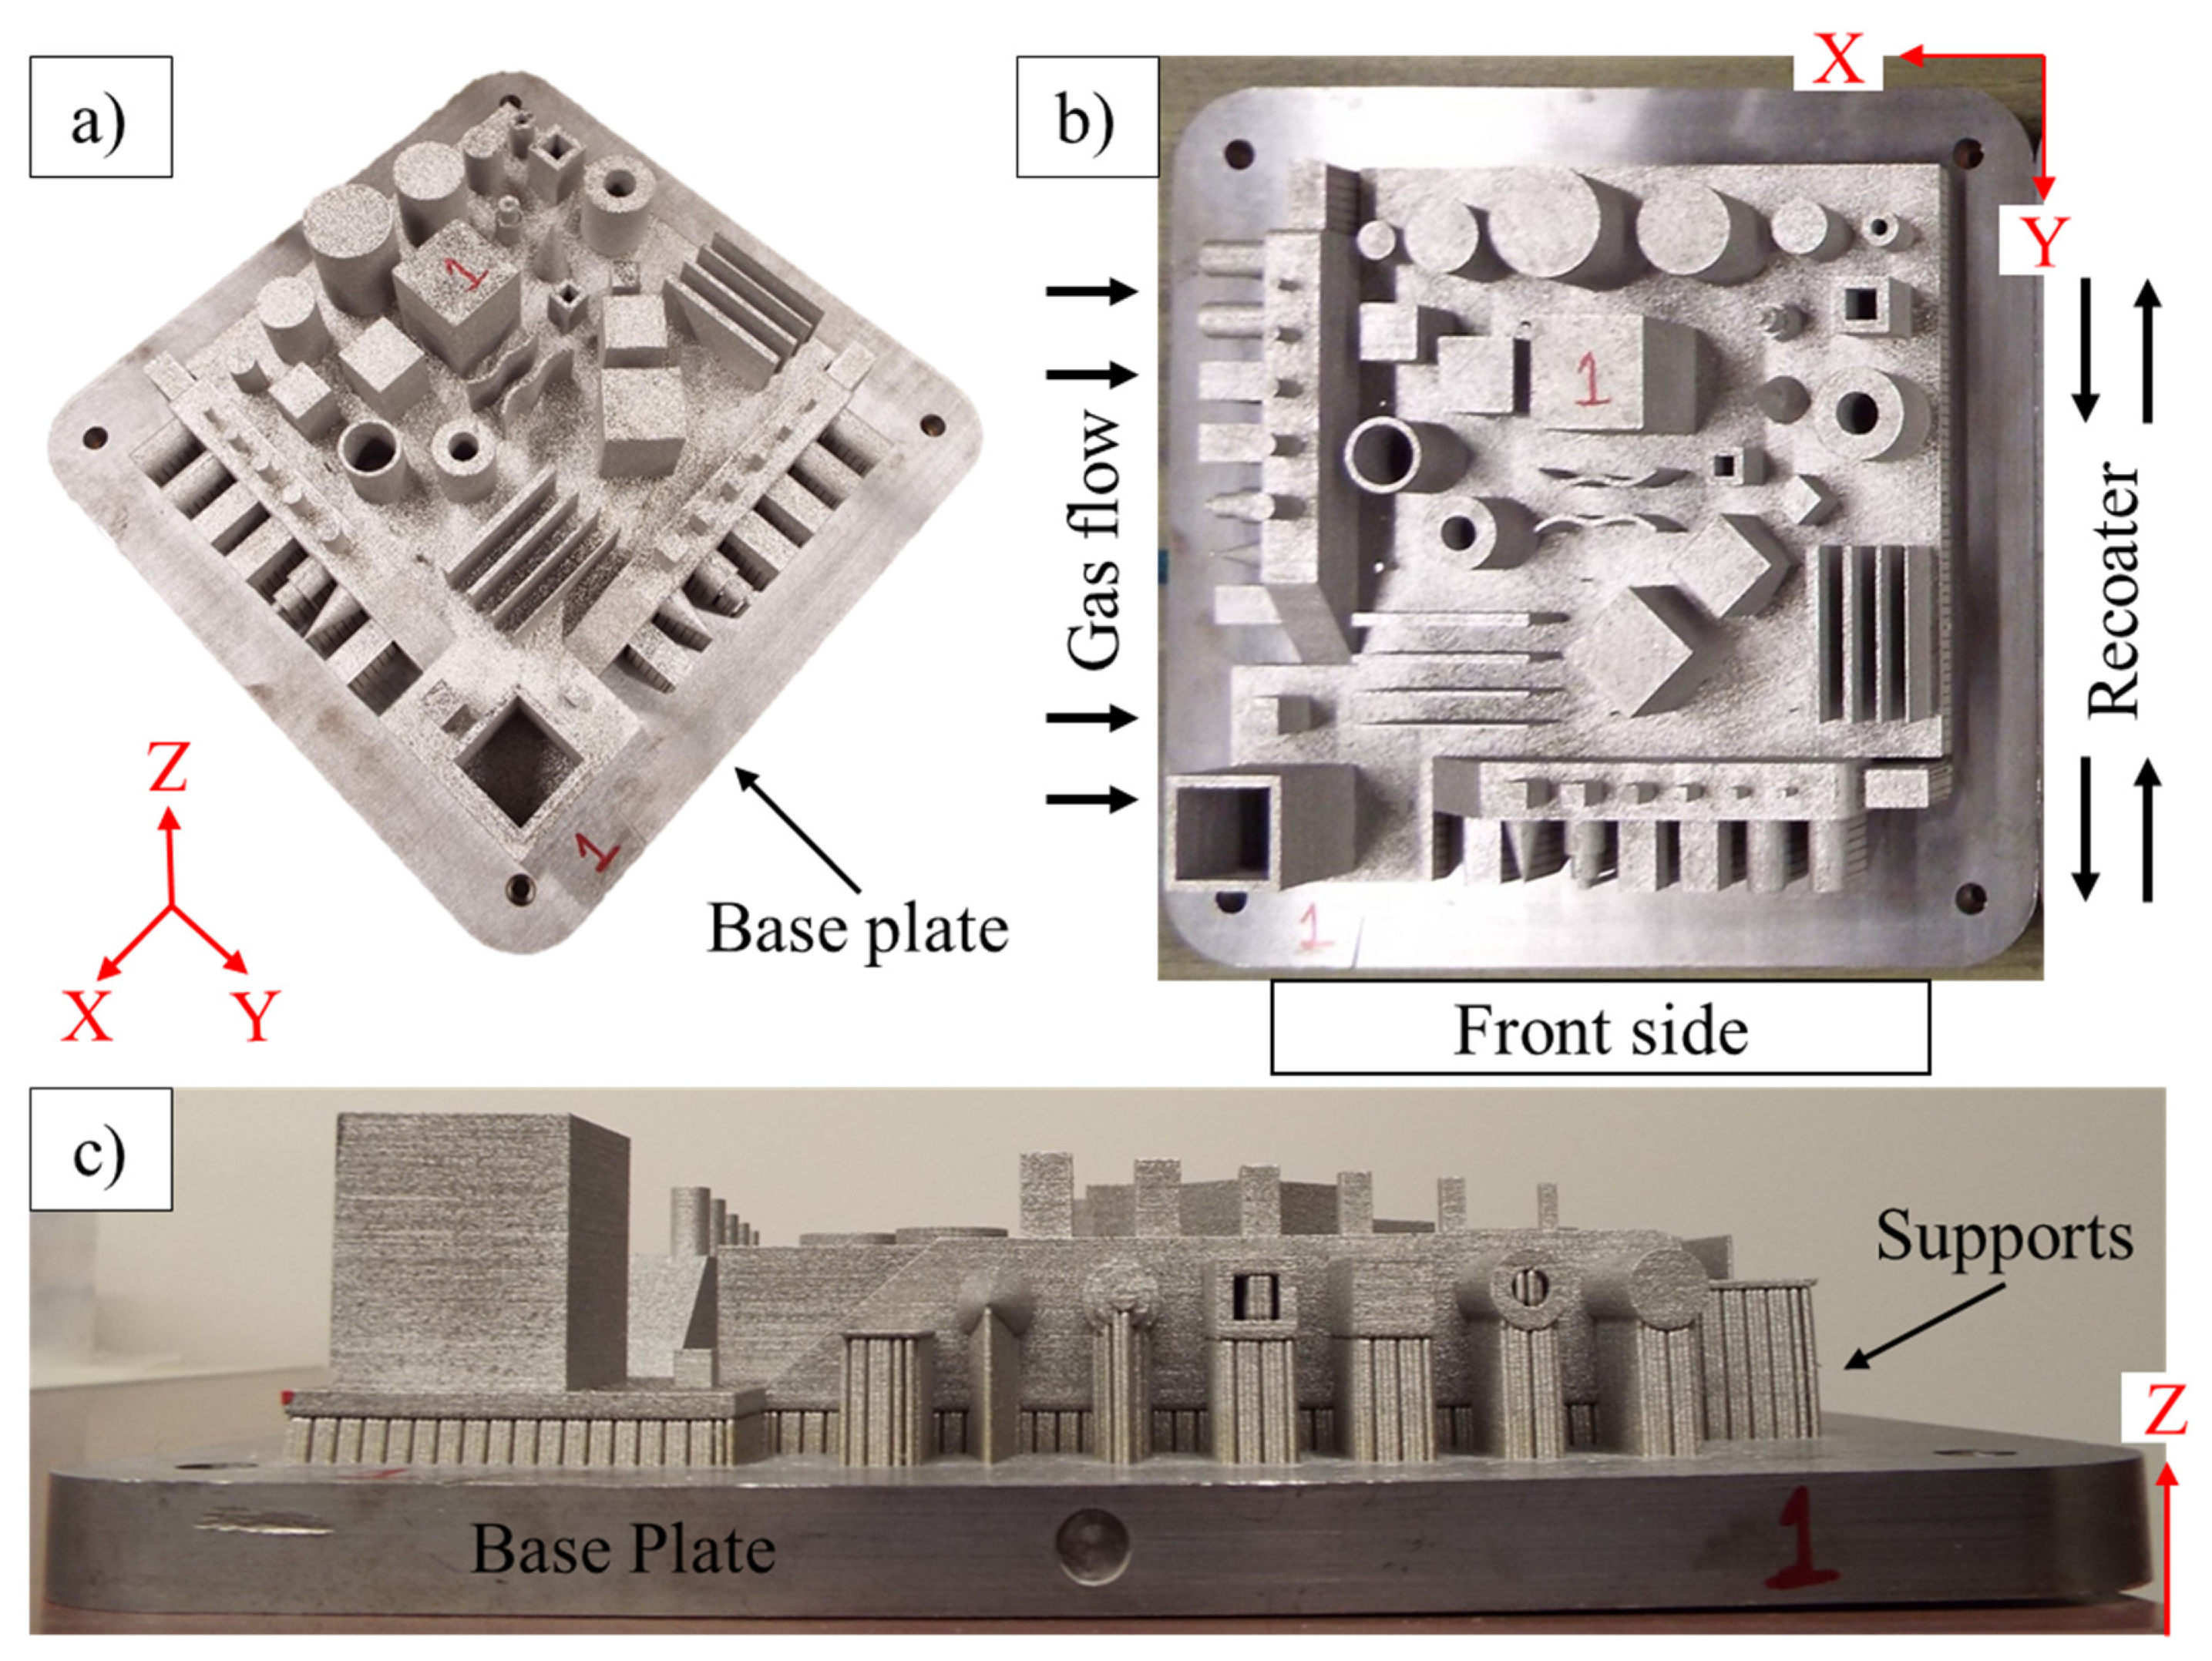
3. Experimental Procedure
3.1. GBTA Manufacturing
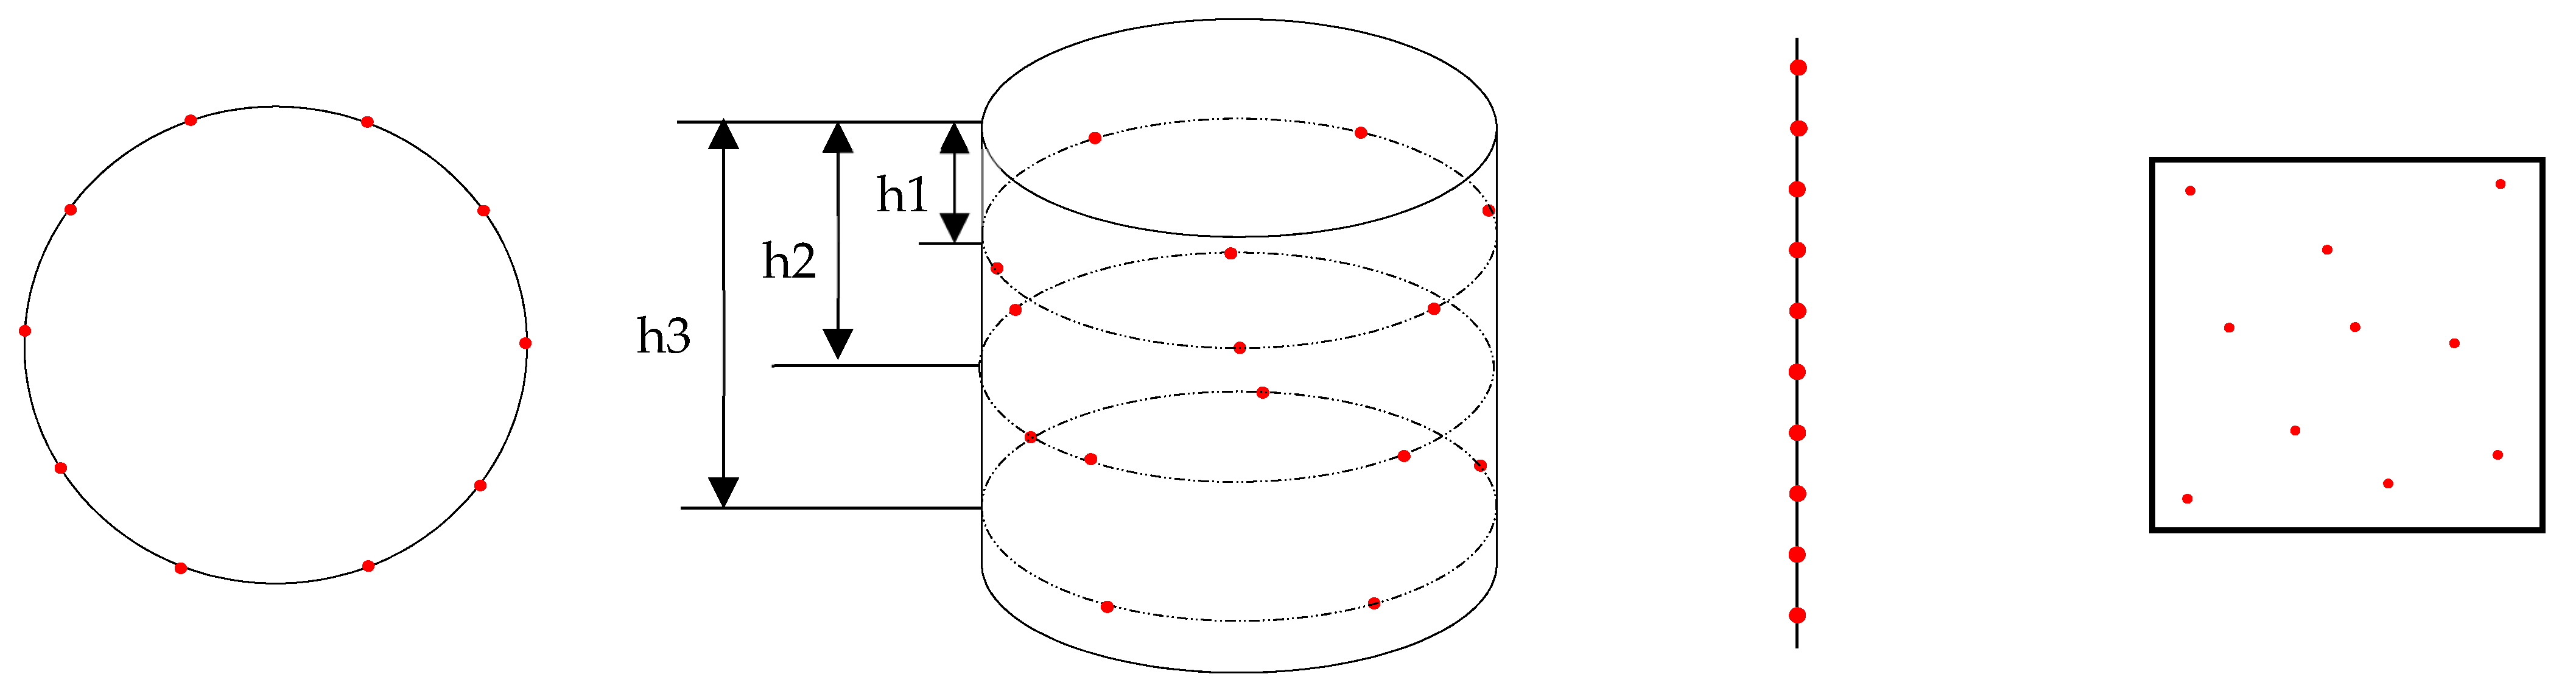
3.2. Measurement Procedure
- Circle: Measured using 10 equally spaced points around the circular cross-section.
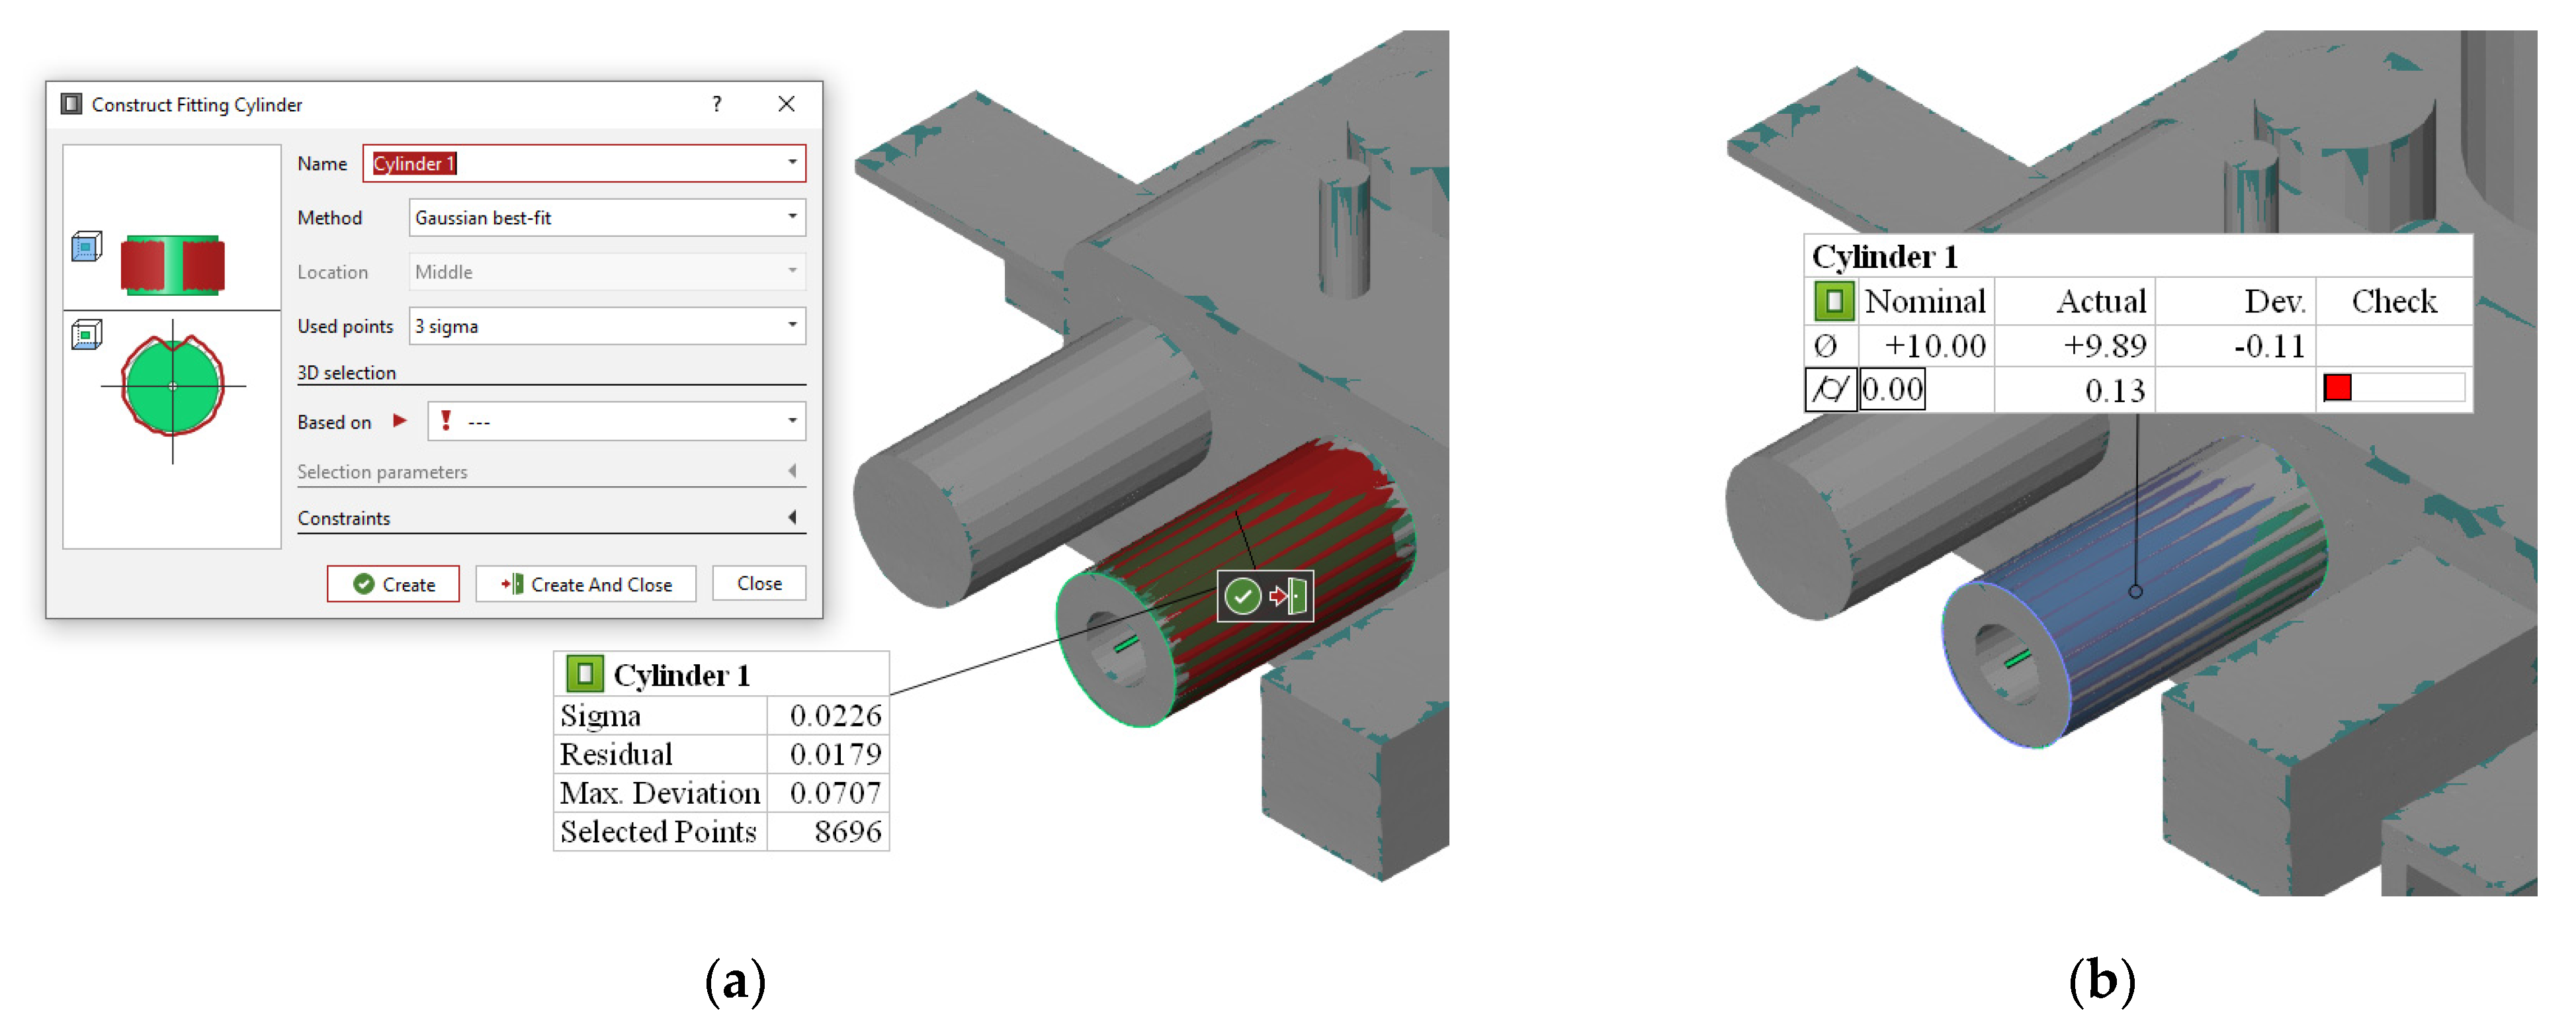
- Cylinder: Measured using a total of 15 points with 5 points, equally spaced, distributed at three cross-sections of the cylinder at heights h1, h2 and h3 (see Figure 3).
- Line: Measured using 10 points, equally spaced, along the length of the line to cover at least 90% of the length of the line.
- Surface: Measured using 10 points with their random distribution over the surface to cover the maximum area of the surface.
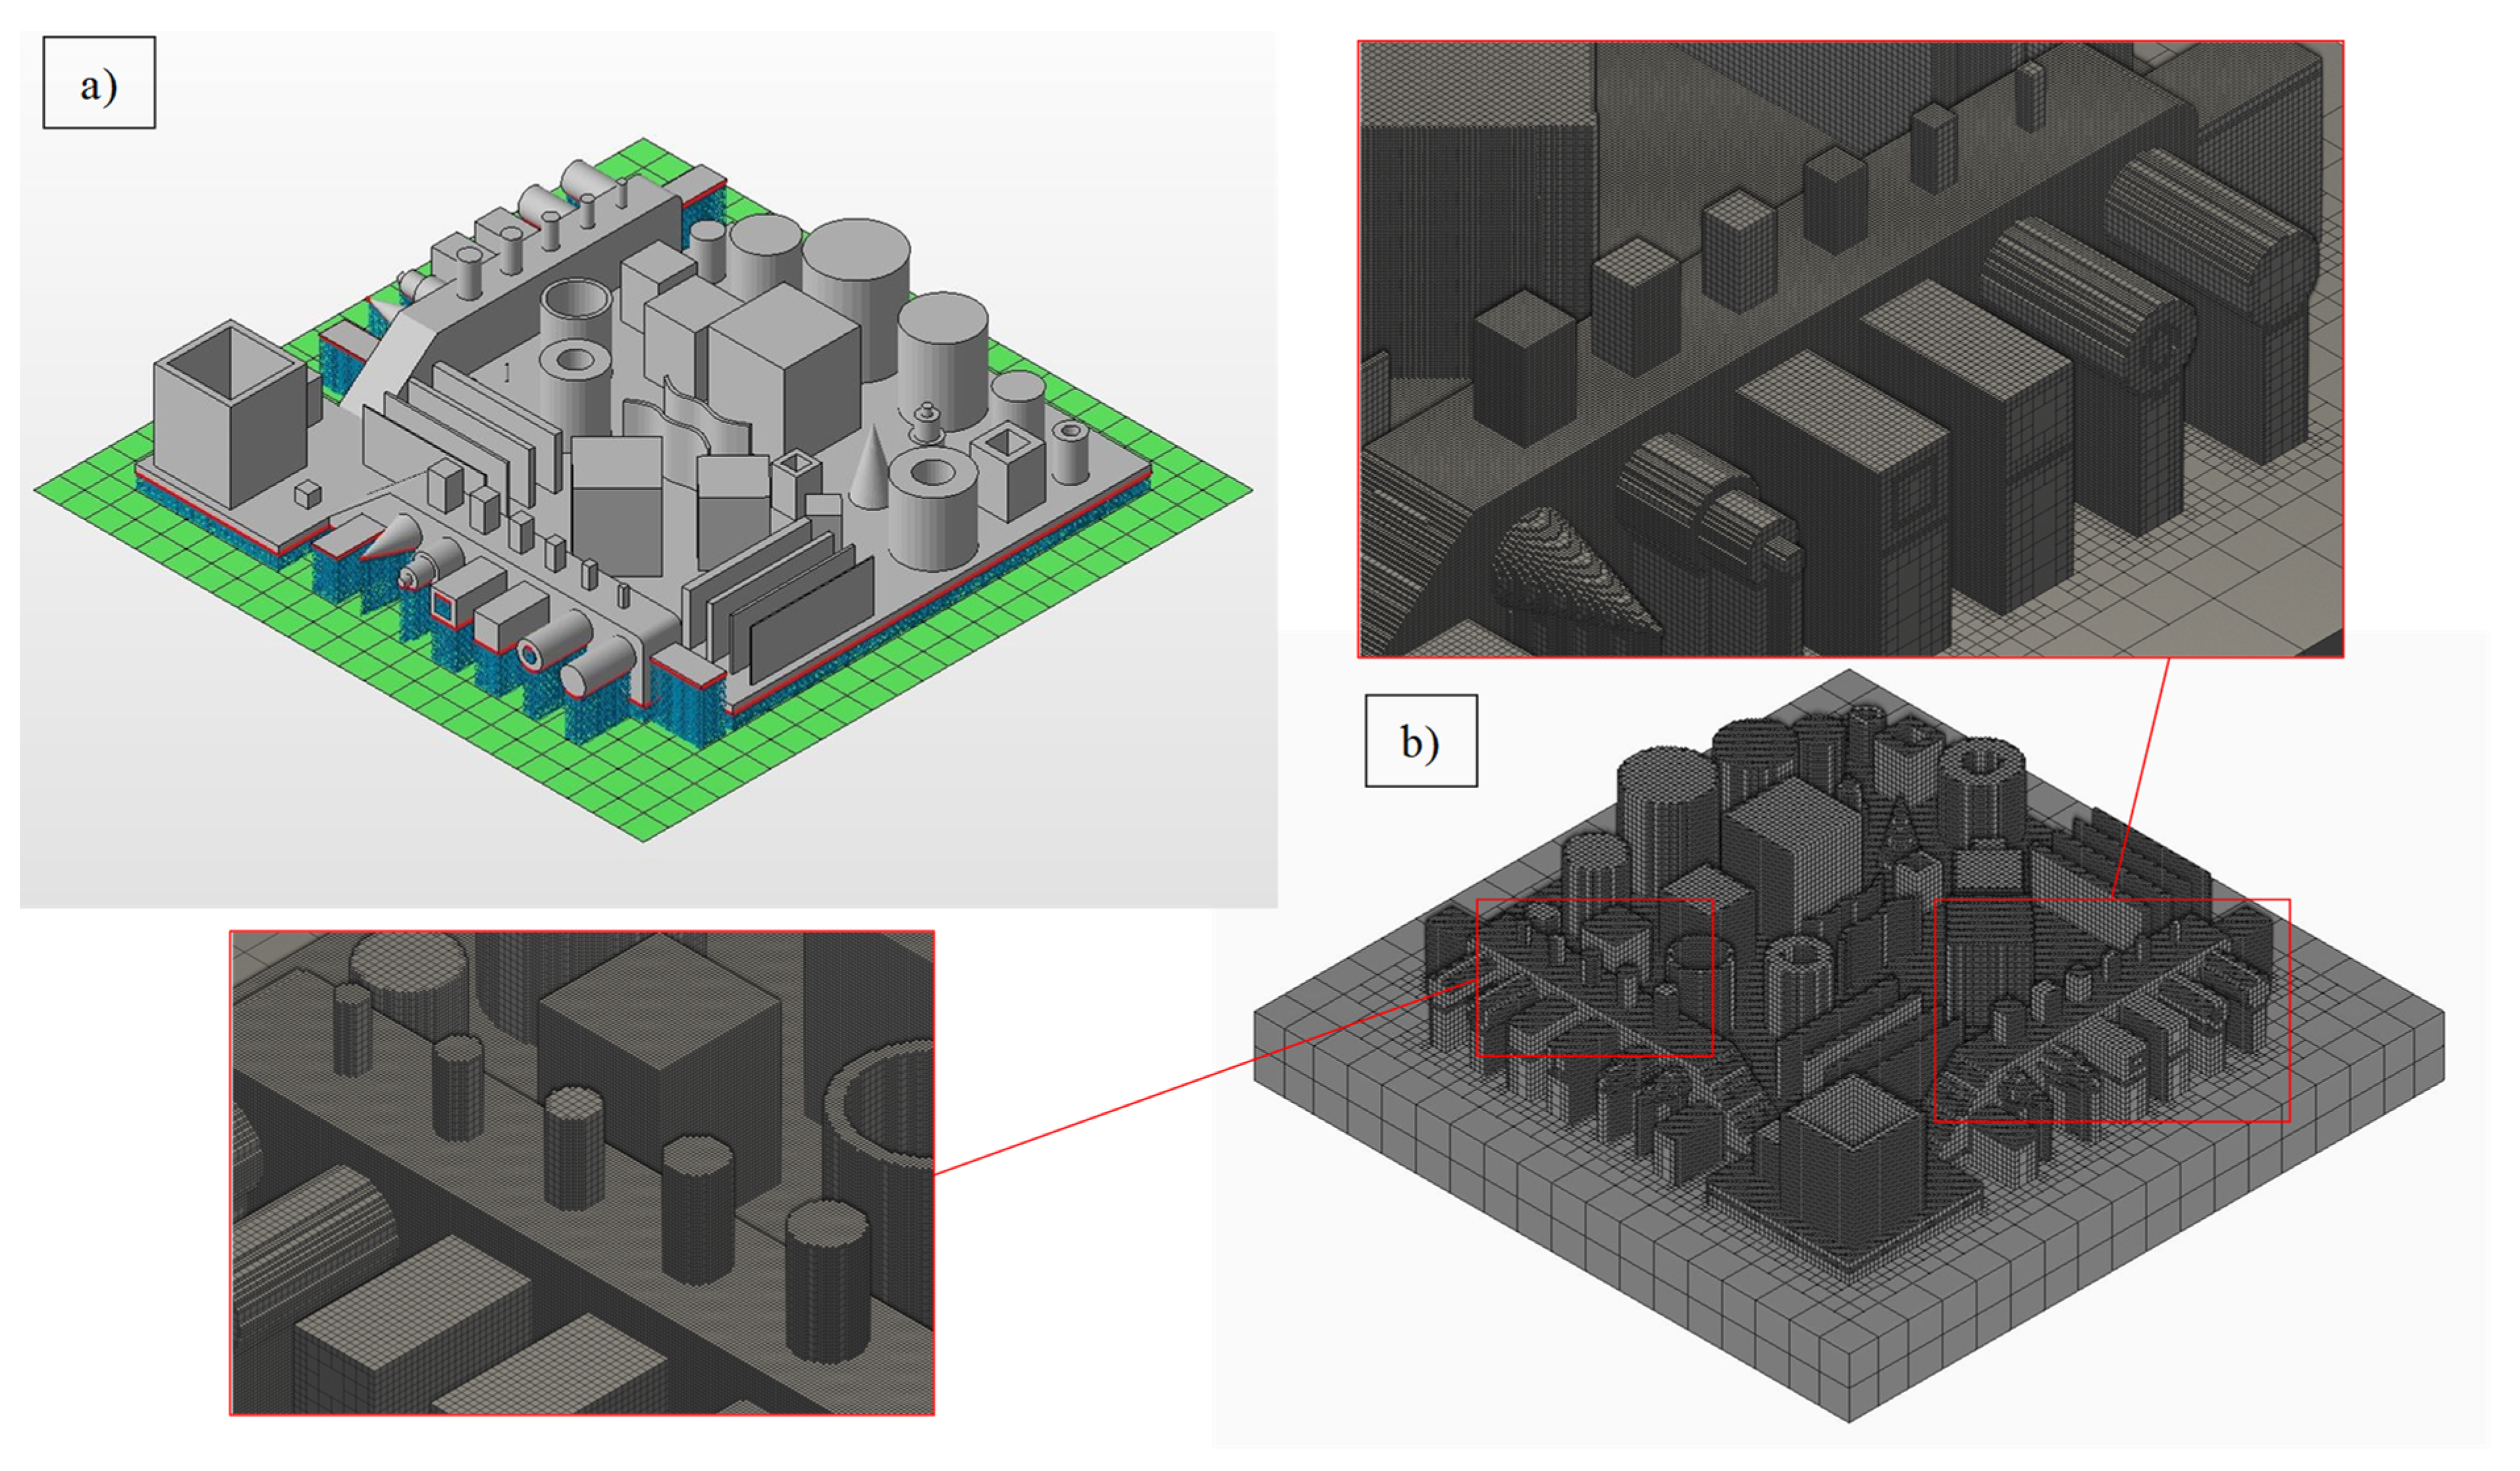
4. Numerical Simulation
- Mechanical boundary conditions: The bottom nodes of the base plate were fixed, i.e., zero displacements was imposed in all directions. At the other boundaries, a zero normal stress boundary condition was used.
- Thermal boundary conditions: A convective heat transfer boundary condition was considered between the powder and the environment. A heat loss coefficient value of 20 W/m2/K was used [43].
5. Results and Discussion
5.1. Form Tolerances
5.1.1. Straightness
5.1.2. Flatness
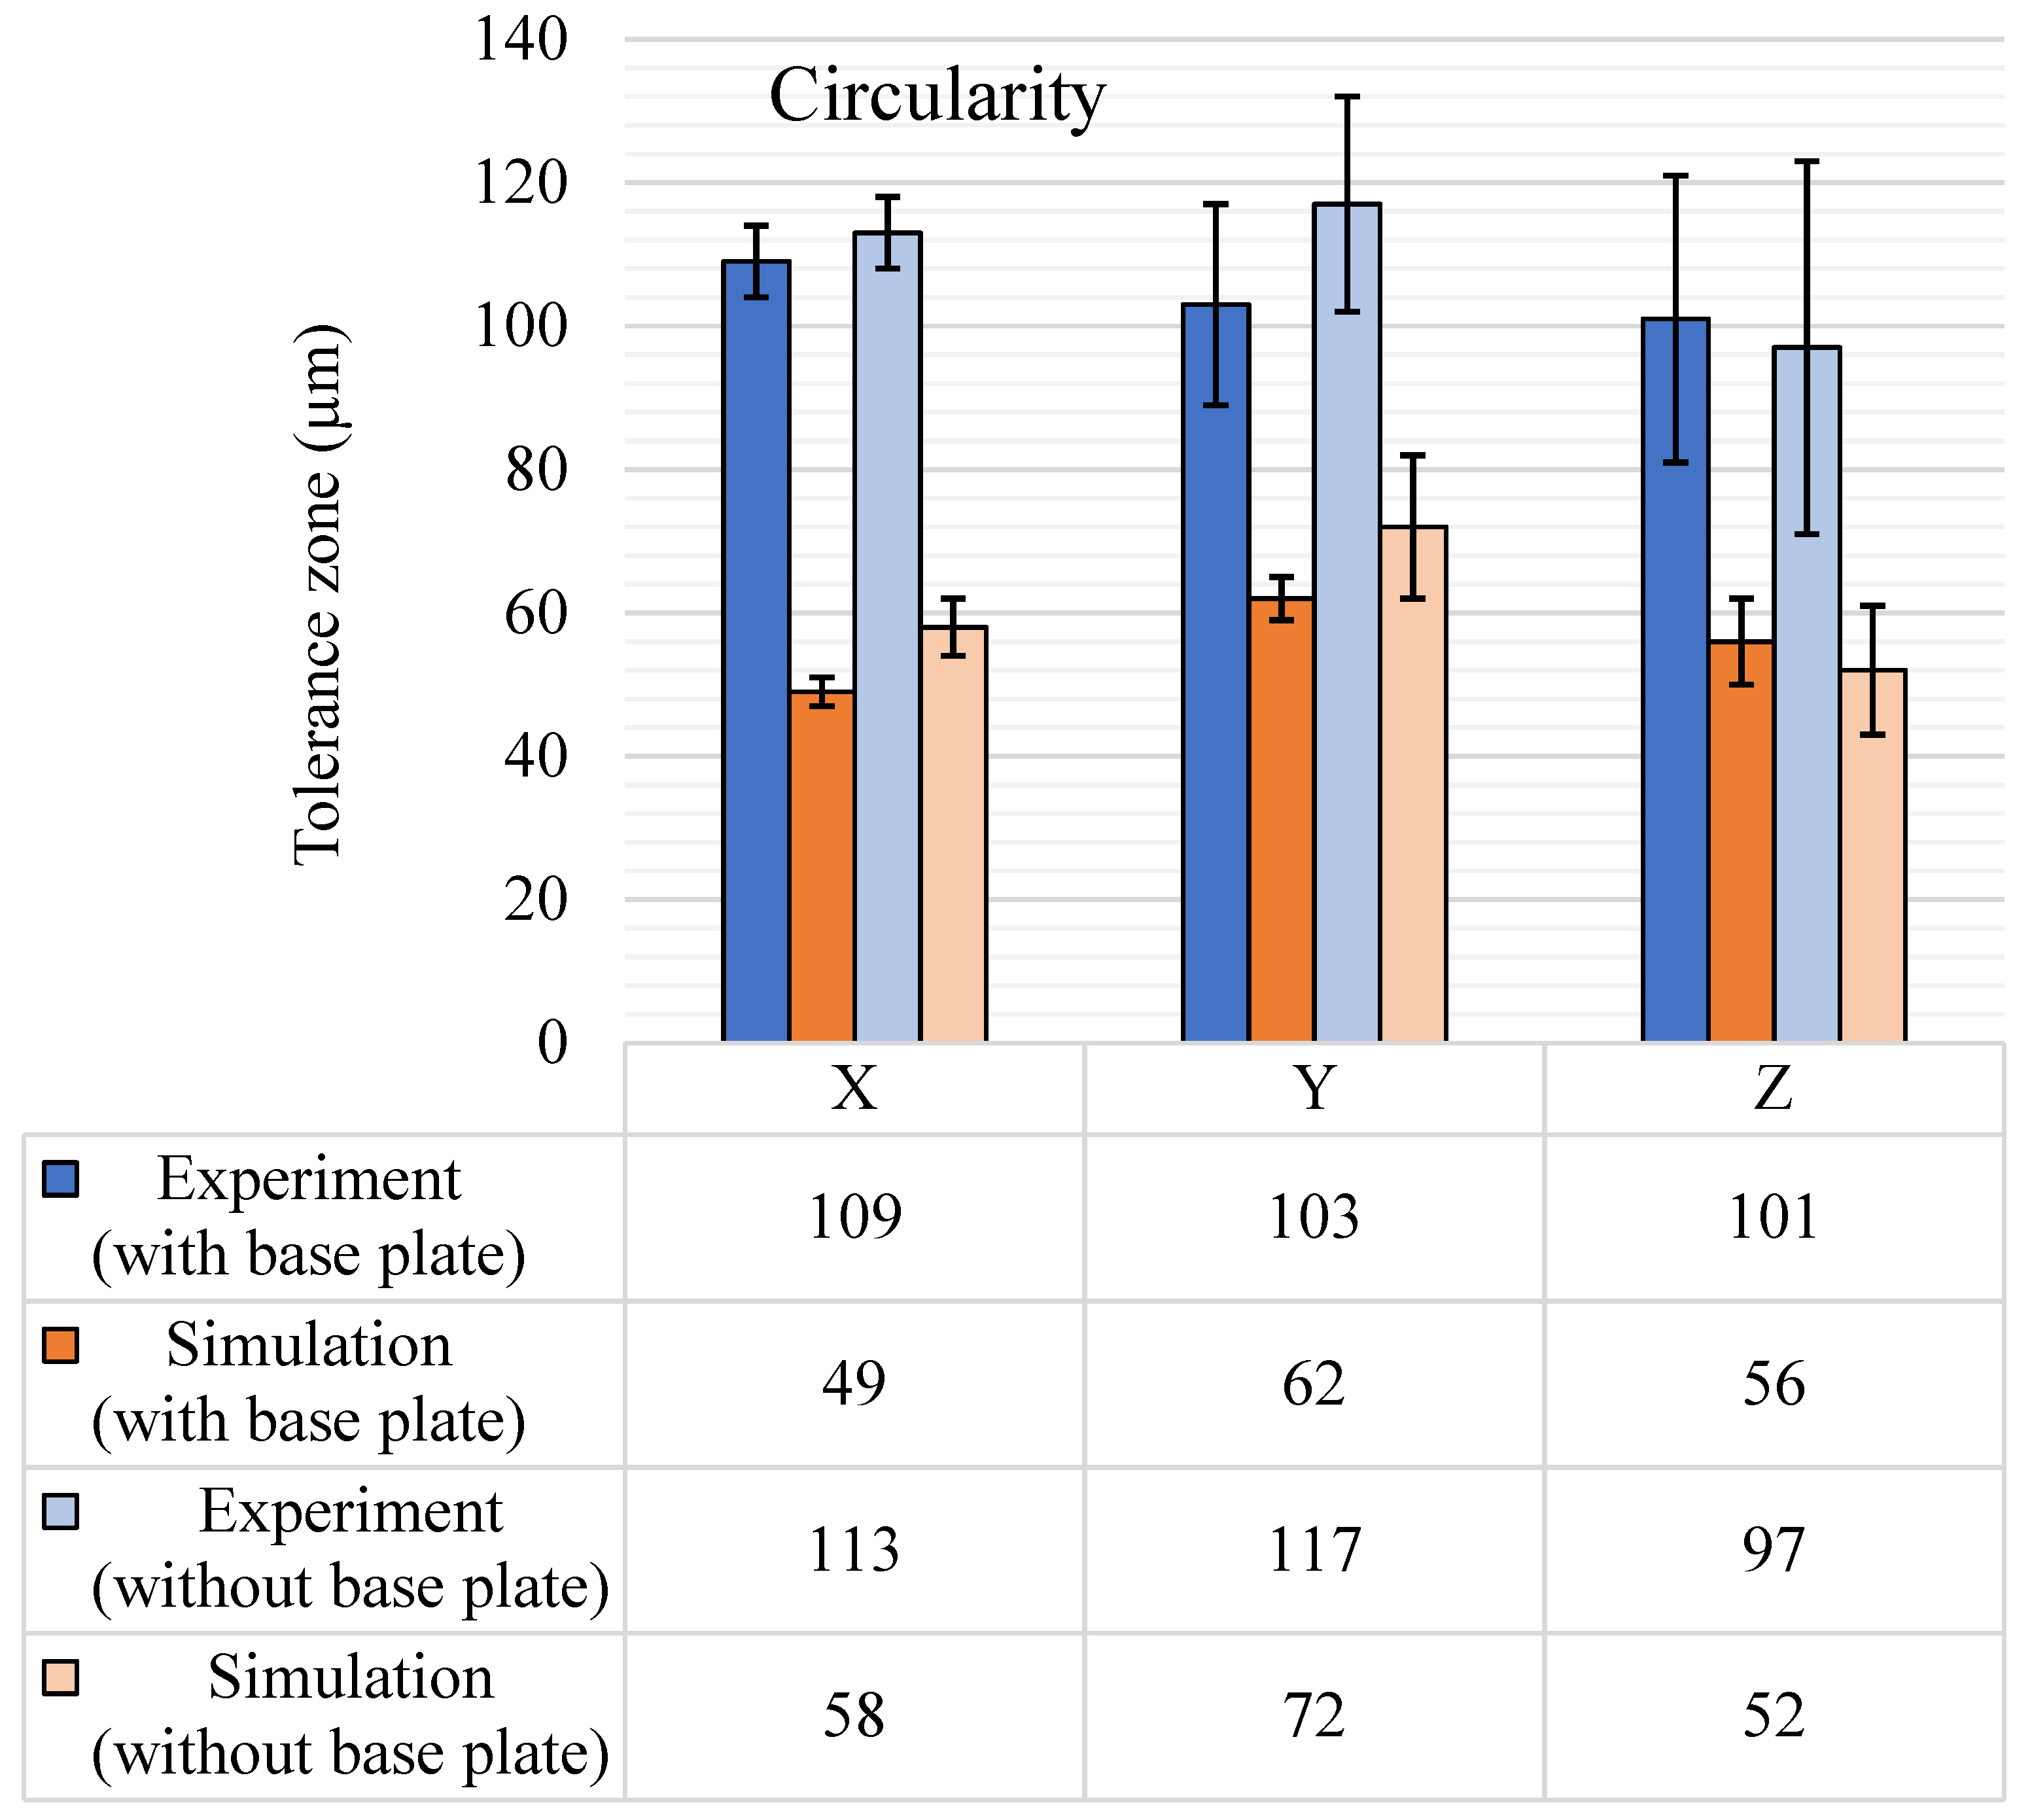
5.1.3. Circularity
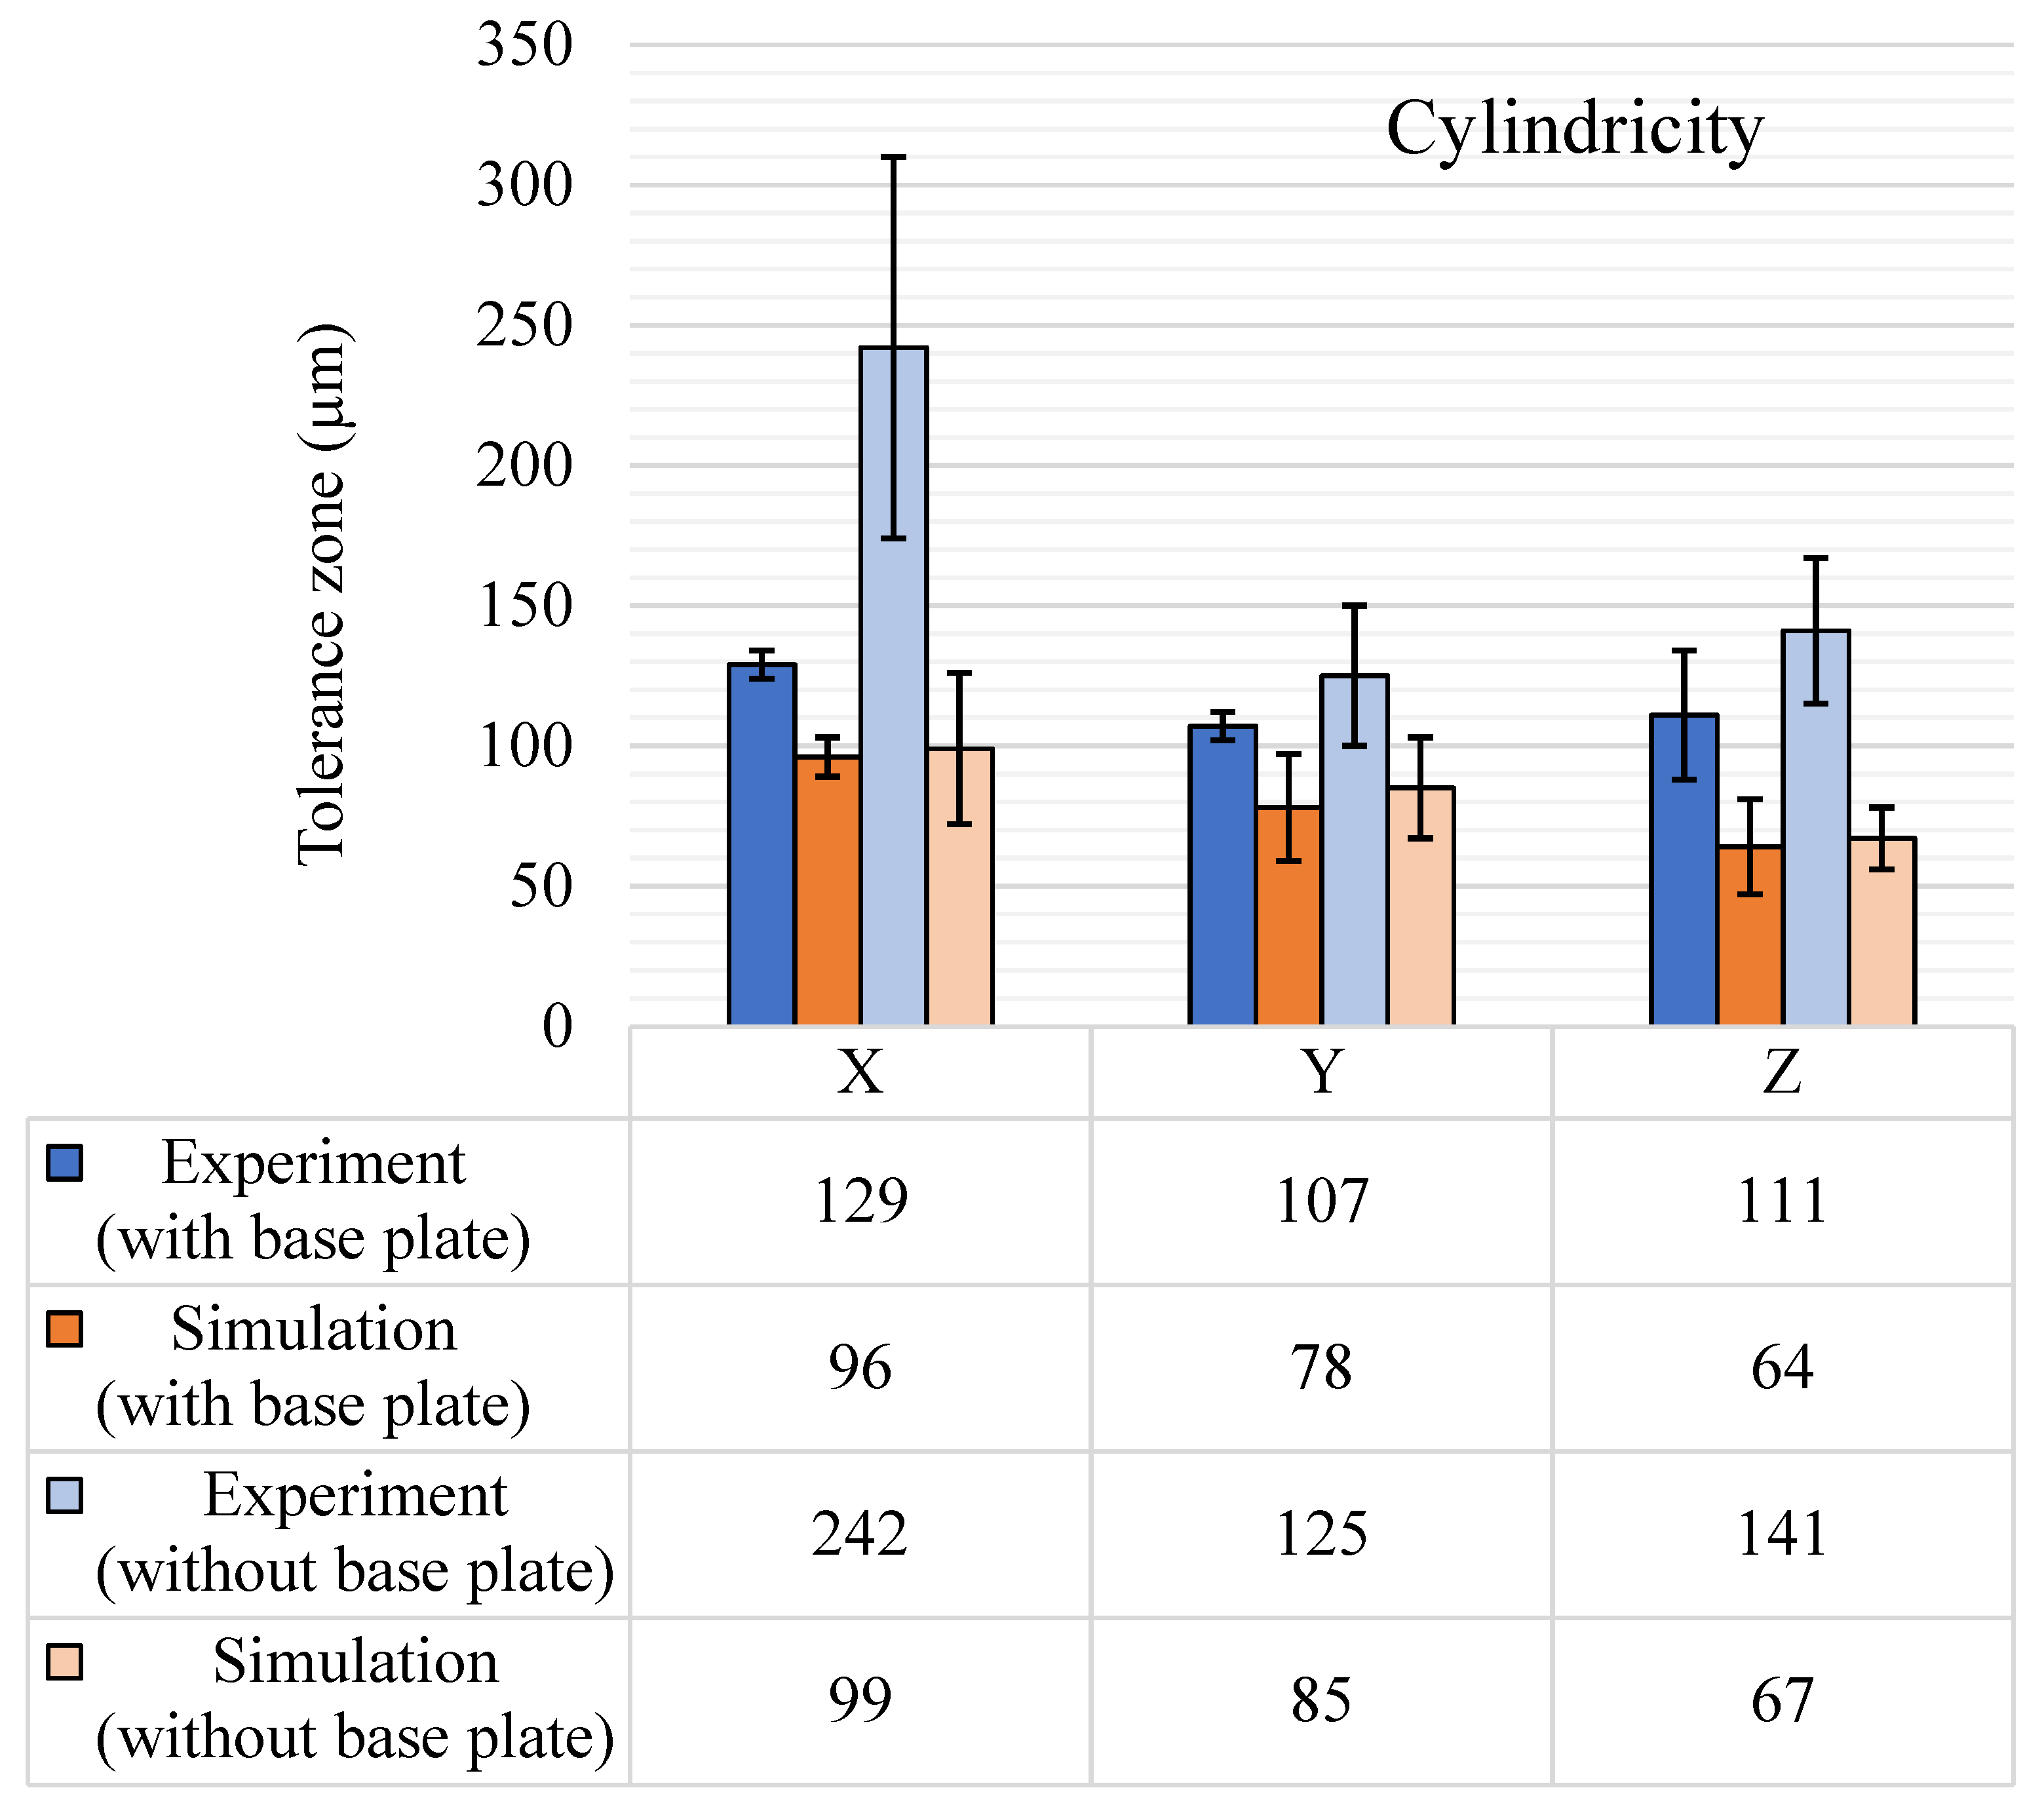
5.1.4. Cylindricity
5.2. Orientation Tolerances
5.2.1. Perpendicularity
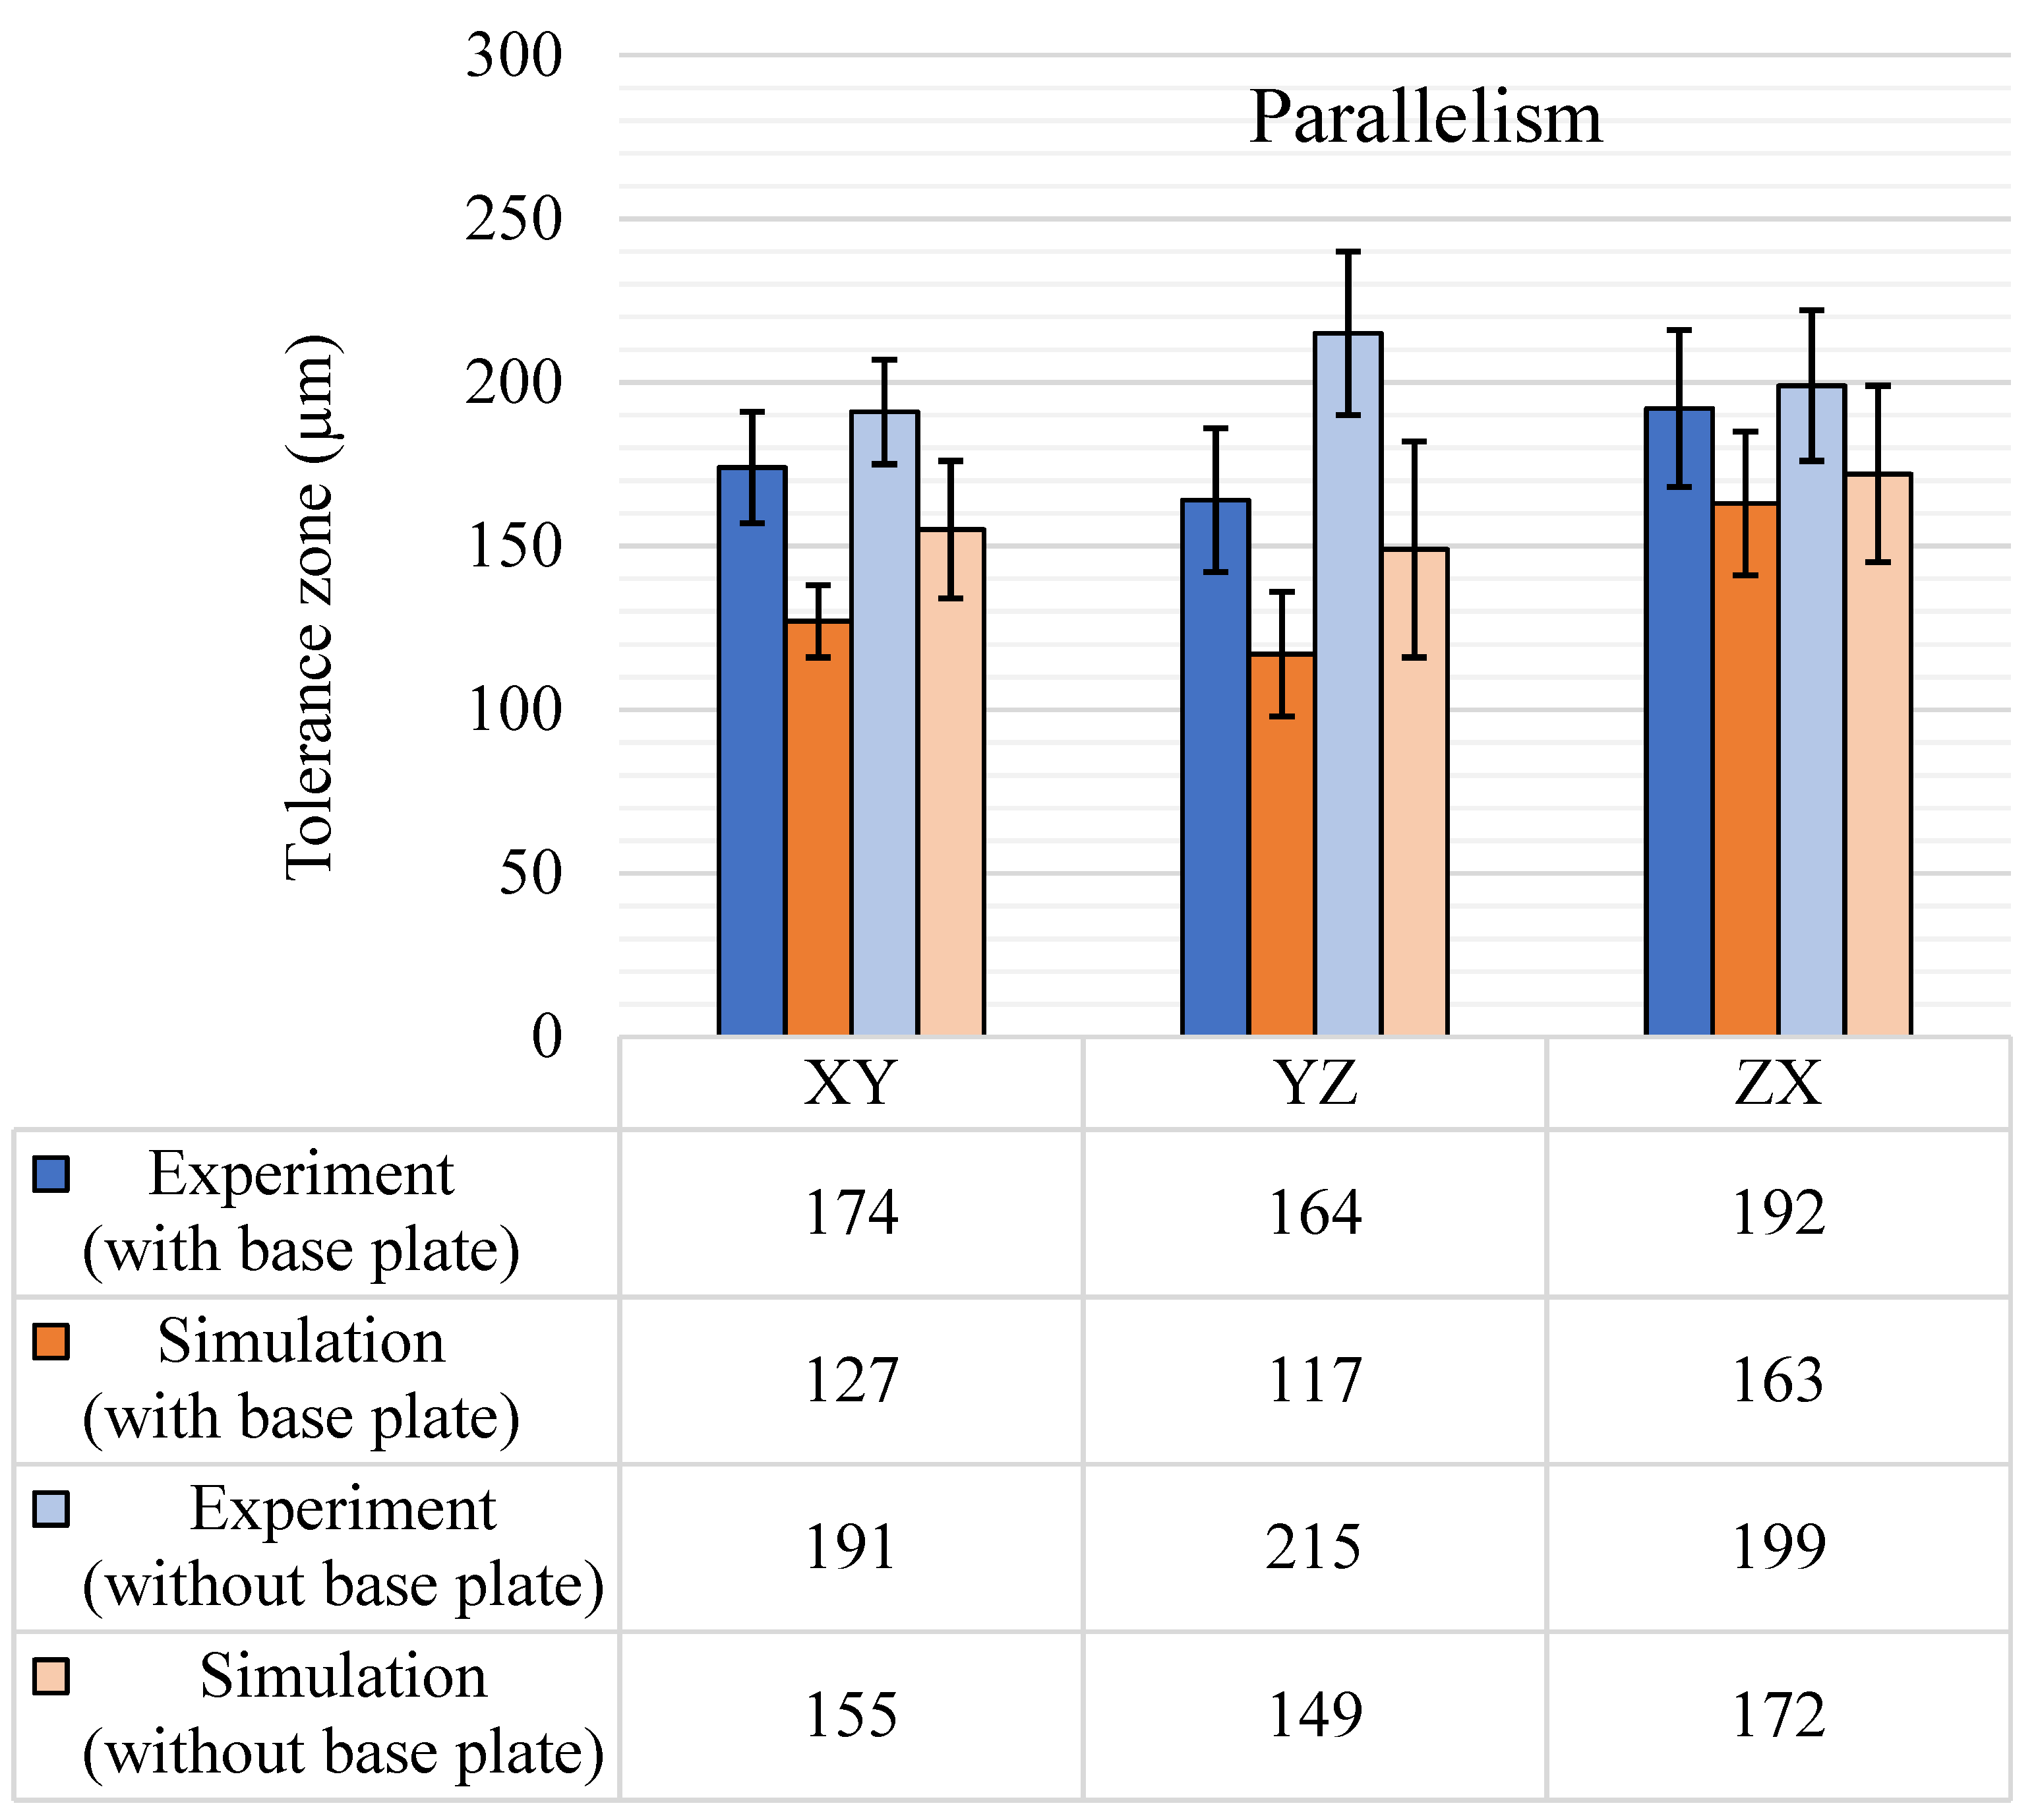
5.2.2. Parallelism
5.2.3. Angularity
5.3. Location Tolerances
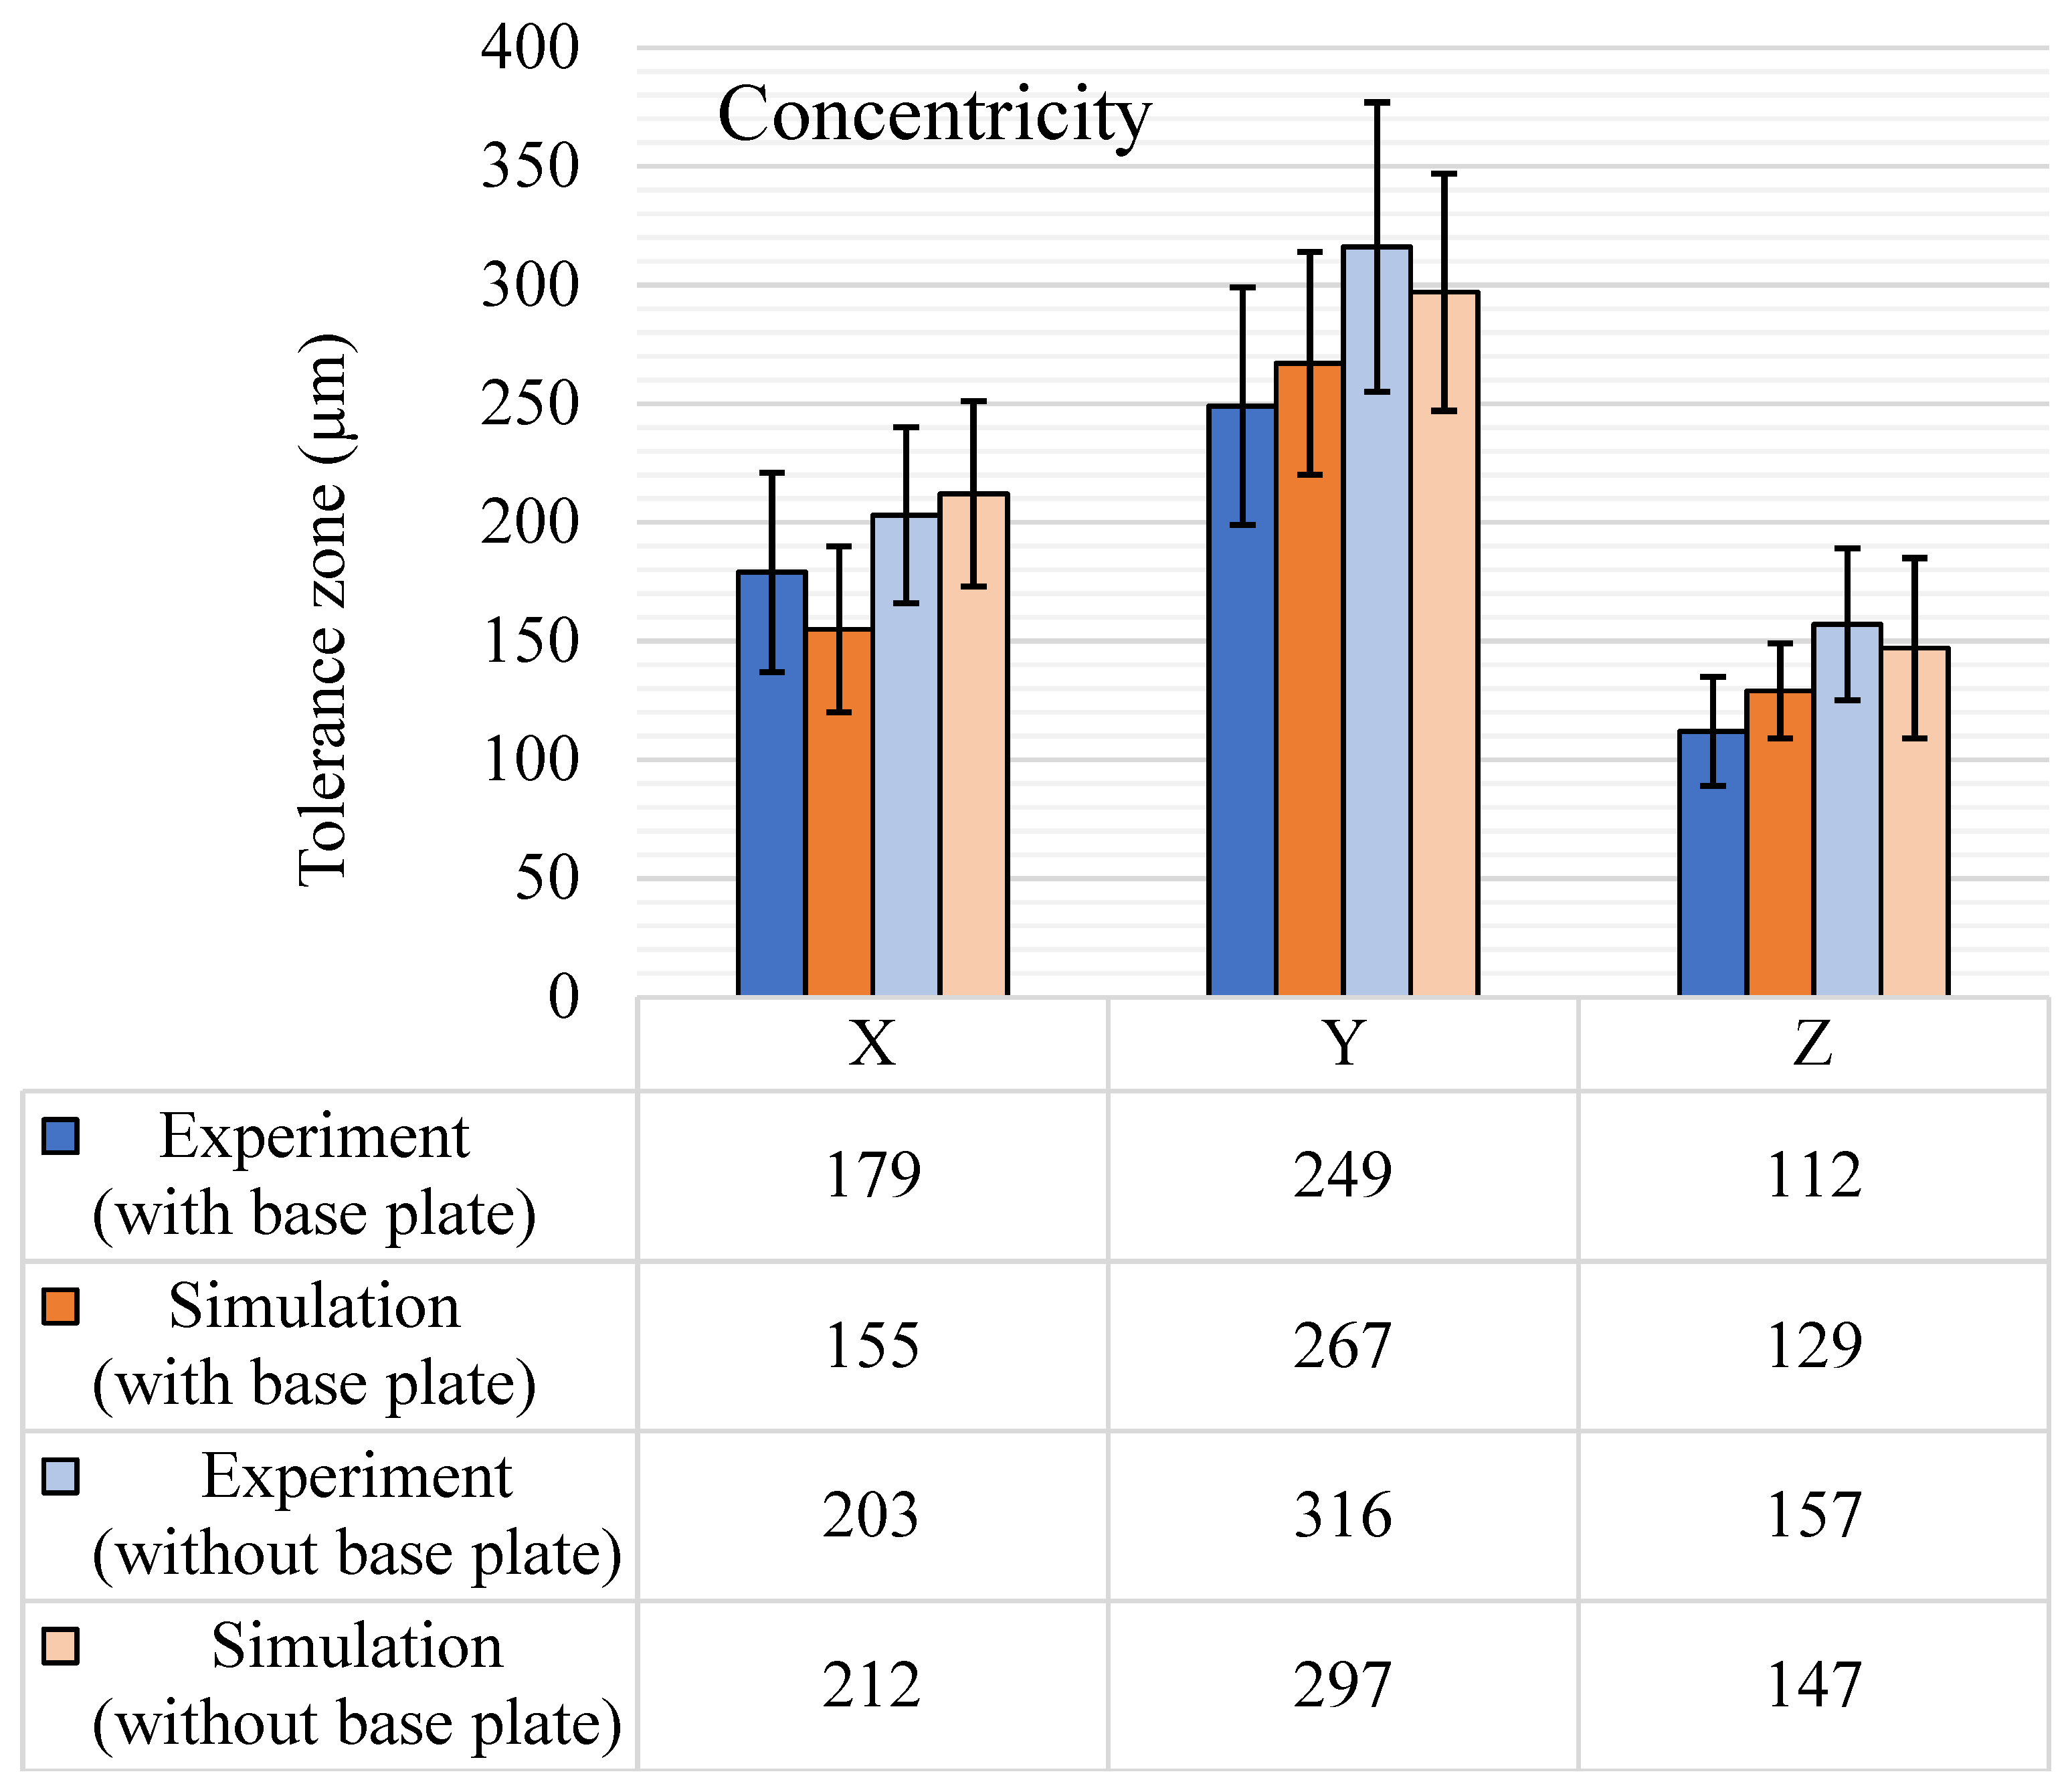
5.3.1. Concentricity
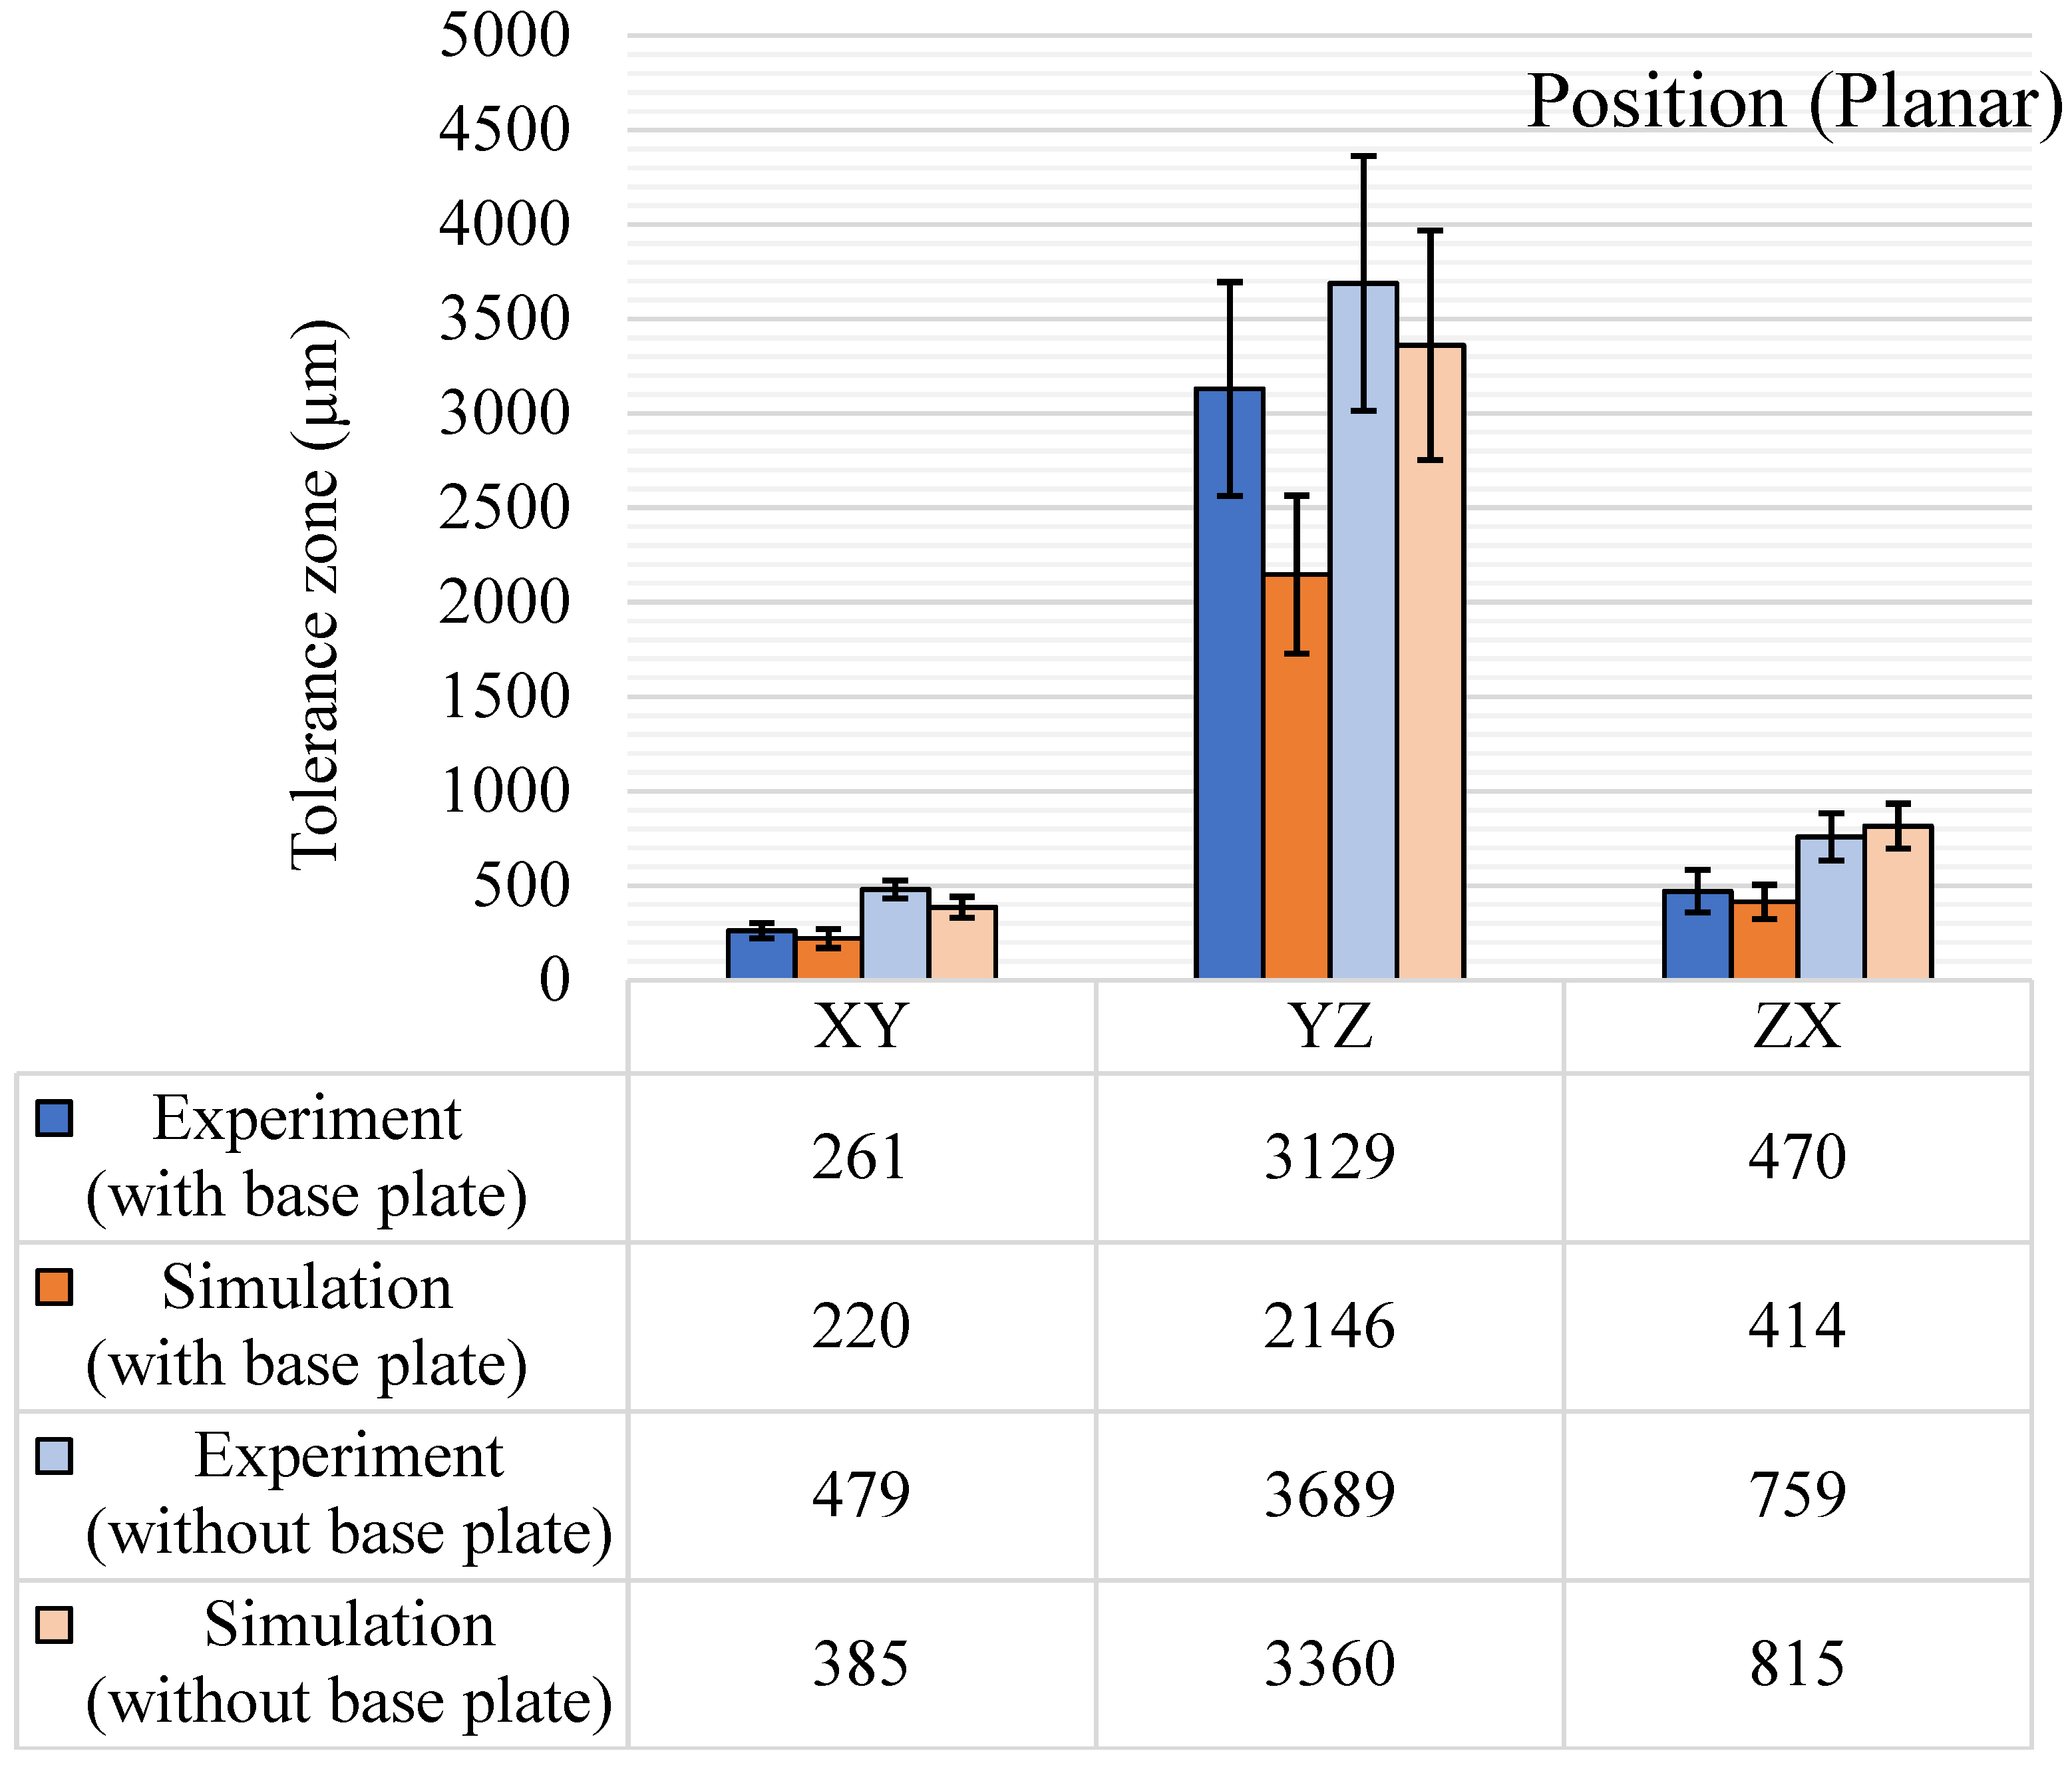
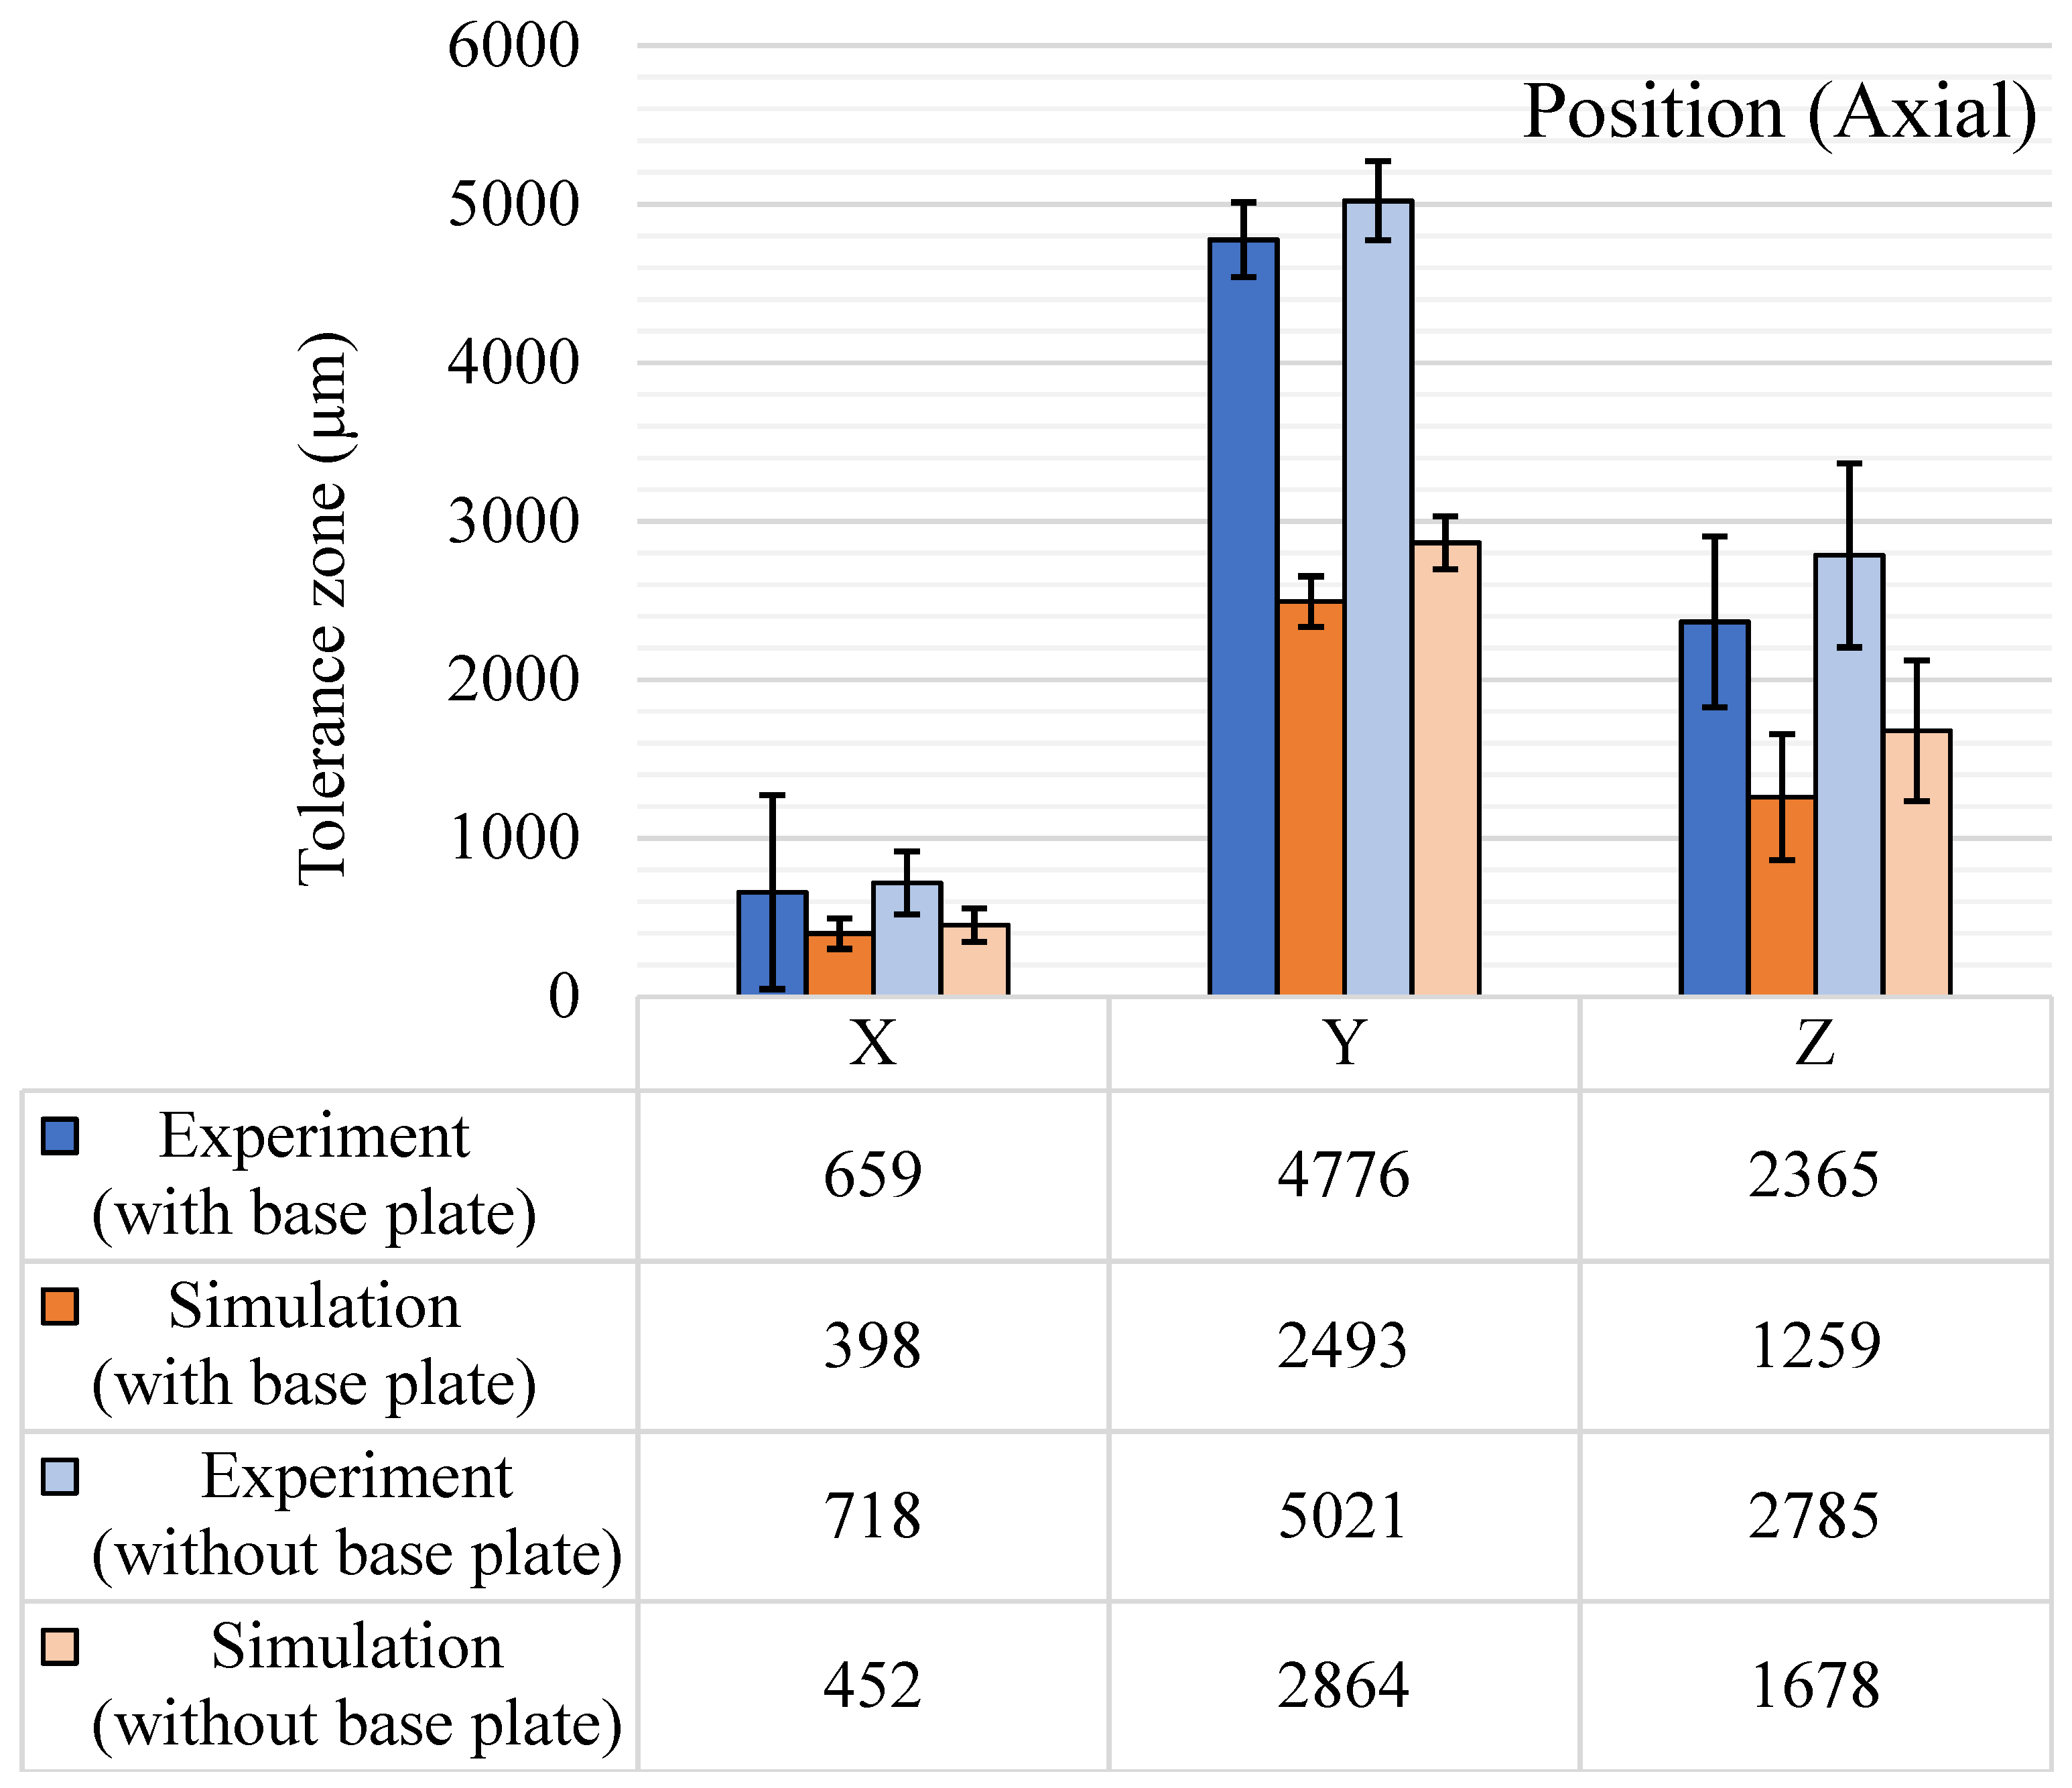
5.3.2. Position
5.4. Runout Tolerances
6. Conclusions and Future Scope
- The results not only justify the new GBTA design and its features, but also gives a quantitative outlook on the variation of the geometric tolerances according to orientation, sizes, and base plate condition;
- The results show that minimizing the residual stress and overall deviations do not lead to minimum tolerance zones for various geometric characteristics that dictate the functionality of the part;
- The circularity and cylindricity tolerance zones show a direct proportionality linkage to the diameter of the feature;
- The orientations of the features lead to a wide range of variation in geometric tolerance results, the average form tolerance increases after the removal of the base plate;
- The orientation and position tolerances also show an increase but, in some cases, the combined effect of the stress relief from removal of the base plate and the variation in the tolerance zone of the datum features minimize the overall tolerance variation;
- The results prove the need for directionality-based analysis of geometric tolerances and the need to consider the removal of the base plate;
- The simulation results are utilized to get an understanding of the tolerance variations and the effect of the residual stresses, with and without the base plate.
Supplementary Materials
Author Contributions
Funding
Institutional Review Board Statement
Informed Consent Statement
Data Availability Statement
Acknowledgments
Conflicts of Interest
Appendix A. GD&T Characteristics

| GD&T Characteristic Symbol | Control Type | Name | Summary Description |
|---|---|---|---|
 | Form | Straightness | Controls the straightness of a feature in a relation to its perfect form |
 | Form | Flatness | Controls the flatness of a surface in relation to its own perfect form |
 | Form | Circularity (Roundness) | Controls the form of a revolved surface in relation to its perfect form by independent cross-sections |
 | Form | Cylindricity | Circularity’ applied to the entire revolved surface |
 | Orientation | Perpendicularity | Controls the orientation of a feature that is nominally perpendicular to the primary datum of its datum reference frame |
 | Orientation | Parallelism | Controls orientation of a feature that is nominally parallel to the primary datum of its datum reference frame |
 | Orientation | Angularity | Controls orientation of a feature at a specific angle in relation to the primary datum of its datum reference frame |
 | Location | Concentricity | Controls concentricity of a surface of revolution to a central datum |
 | Location | Position | Controls the location and orientation of a feature in relation to its datum reference frame |
 | Location | Symmetry | Controls the symmetry of two surfaces about a central datum |
 | Profile | Profile of a line | Controls the size and form of a freeform feature. Additionally controls the location and orientation when a datum reference frame is used |
 | Profile | Profile of a surface | Profile of a line’ applied to the complete feature surface |
 | Runout | Circular Runout | Controls circularity and coaxiality of each circular segment of a surface independently about a coaxial datum |
 | Runout | Total Runout | Controls circularity, straightness, coaxiality, and taper of a cylindrical surface about a coaxial datum |
Appendix B. GBTA Features
| GD&T Characteristics | Plane/Axis | Features |
|---|---|---|
| Flatness | XY | 1, 4, 5, 8, 13, 15, 18, 19, 22, 24, 30, 31, 32, 33, 37, 39, 40, 45, 60, 66, 68 |
| YZ | 2, 4, 18, 19, 24, 37, 39, 40, 44, 62, 63, 64, 65, 66 | |
| ZX | 4, 5, 16, 18, 24, 37, 39, 40, 44, 53, 54, 55, 56, 66 | |
| Straightness | XY | 1, 4, 5, 8, 15, 18, 19, 22, 37, 39, 40, 53, 62 |
| YZ | 24, 37, 39, 40, 62, 65, 66, 67 | |
| ZX | 24, 37, 39, 40, 53, 56, 66, 67 | |
| Parallelism | XY | 4, 5, 8, 13, 18, 22, 24, 30, 31, 32, 37, 39, 40, 60, 66 |
| YZ | 2, 4, 18, 19, 24, 37, 39, 40, 62, 63, 64, 65, 66 | |
| ZX | 4, 5, 16, 18, 24, 37, 39, 40, 53, 54, 55, 56, 66 | |
| Perpendicularity | XY | 4, 5, 8, 18, 19, 22, 24, 37, 39, 40, 66 |
| YZ | 24, 37, 39, 40, 62, 63, 64, 65, 66 | |
| ZX | 24, 37, 39, 40, 53, 54, 55, 56, 66 | |
| Angularity | 14, 23 | |
| Circularity | X | 2, 3, 6B, 6M, 6T, 7 |
| Y | 16, 17, 20B, 20M, 20T, 21 | |
| Z | 9, 11, 13, 30, 31, 32, 33, 34, 35, 36, 38, 41B, 41M, 41T, 42, 43O, 43I, 49O, 49I, 50, 51O, 51I, 52, 57, 58, 61 | |
| Cylindricity | X | 2, 3, 6B, 6M |
| Y | 16, 17, 20B, 20M | |
| Z | 9, 10, 11, 12, 13, 30, 31, 32, 33, 34, 35, 38, 41B, 41M, 43O, 43I, 49O, 49I, 50, 51O, 51I, 52, 57, 58, 61 | |
| Concentricity | X | 6M, 6T |
References
- ISO/ASTM 52900 (ASTM F2792). Additive Manufacturing-General Principles-Terminology; ASTM International: West Conshohocken, PA, USA, 2015.
- Thompson, M.K.; Moroni, G.; Vaneker, T.; Fadel, G.; Campbell, R.I.; Gibson, I.; Bernard, A.; Schulz, J.; Graf, P.; Ahuja, B.; et al. Design for Additive Manufacturing: Trends, opportunities, considerations, and constraints. CIRP Ann. Manuf. Technol. 2016, 65, 737–760. [Google Scholar] [CrossRef] [Green Version]
- ISO. ISO 17296-2. Additive Manufacturing-General Principles-Part 2: Overview of Process Categories and Feedstock; ISO: Geneva, Switzerland, 2015. [Google Scholar]
- Gibson, I.; Rosen, D.; Stucker, B. Additive Manufacturing Technologies: 3D Printing, Rapid Prototyping, and Direct Digital Manufacturing; Springer: New York, NY, USA, 2016. [Google Scholar]
- Barari, A.; Kishawy, H.A.; Kaji, F.; Elbestawi, M.A. On the surface quality of additive manufactured parts. Int. J. Adv. Manuf. Technol. 2017, 89, 1969–1974. [Google Scholar] [CrossRef]
- Lou, S.; Jiang, X.; Sun, W.; Zeng, W.; Pagani, L.; Scott, P.J. Characterisation methods for powder bed fusion processed surface topography. Precis. Eng. 2019, 57, 1–15. [Google Scholar] [CrossRef]
- Choo, H.; Sham, K.L.; Bohling, J.; Ngo, A.; Xiao, X.; Ren, Y.; Depond, P.J.; Matthews, M.J.; Garlea, E. Effect of laser power on defect, texture, and microstructure of a laser powder bed fusion processed 316L stainless steel. Mater. Des. 2019, 164, 107534. [Google Scholar] [CrossRef]
- Leach, R.K.; Bourell, D.; Carmignato, S.; Donmez, A.; Senin, N.; Dewulf, W. Geometrical metrology for metal additive manufacturing. CIRP Ann. 2019, 68, 677–700. [Google Scholar] [CrossRef]
- Rupal, B.S.; Qureshi, A.J. Geometric Deviation Modeling and Tolerancing in Additive manufacturing: A GDT Perspective. In Proceedings of the 1st Conference of NSERC Network for Holistic Innovation in Additive Manufacturing (HI-AM), Waterloo, ON, Canada, 22–23 May 2018; pp. 1–6. [Google Scholar]
- Toguem, S.C.T.; Rupal, B.S.; Mehdi-Souzani, C.; Qureshi, A.J.; Anwer, N. A review of AM artifact design methods. In Proceedings of the 2018 ASPE and Euspen Summer Topical Meeting: Advancing Precision in Additive Manufacturing, Berkeley, CA, USA, 22–25 July 2018. [Google Scholar]
- Toguem, S.C.T.; Mehdi-Souzani, C.; Nouira, H.; Anwer, N. Axiomatic design of customised additive manufacturing artefacts. Procedia CIRP 2020, 91, 899–904. [Google Scholar] [CrossRef]
- Moylan, S.; Slotwinski, J.; Cooke, A.; Jurrens, K.; Donmez, M.A. Proposal for a standardized test artifact for additive manufacturing machines and processes. In Proceedings of the 2012 Annual International Solid Freeform Fabrication Symposium, Austin, TX, USA, 6–8 August 2012. [Google Scholar]
- Mahesh, M.; Wong, Y.S.; Fuh, J.Y.H.; Loh, H.T. Benchmarking for comparative evaluation of RP systems and processes. Rapid Prototyp. J. 2004, 10, 123–135. [Google Scholar] [CrossRef]
- Shahrain, M.; Didier, T.; Lim, G.K.; Qureshi, A.J. Fast Deviation Simulation for ‘Fused Deposition Modeling’ Process. Procedia CIRP 2016, 43, 327–332. [Google Scholar] [CrossRef] [Green Version]
- Rebaioli, L.; Fassi, I. A review on benchmark artifacts for evaluating the geometrical performance of additive manufacturing processes. Int. J. Adv. Manuf. Technol. 2017, 93, 1–28. [Google Scholar] [CrossRef]
- Mahmood, S.; Qureshi, A.J.; Goh, K.L.; Talamona, D. Tensile strength of partially filled FFF printed parts: Experimental results. Rapid Prototyp. J. 2017, 23, 122–128. [Google Scholar] [CrossRef]
- Saqib, S.; Urbanic, J. An Experimental Study to Determine Geometric and Dimensional Accuracy Impact Factors for Fused Deposition Modelled Parts. In Enabling Manufacturing Competitiveness and Economic Sustainability; Springer: Berlin/Heidelberg, Germany, 2012; pp. 293–298. [Google Scholar]
- Mahmood, S.; Qureshi, A.J.; Talamona, D. Taguchi based process optimization for dimension and tolerance control for fused deposition modelling. Addit. Manuf. 2018, 21, 183–190. [Google Scholar] [CrossRef]
- Kruth, J.-P.; Vandenbroucke, B.; van Vaerenbergh, J.; Mercelis, P. Benchmarking of different sls/slm processes as rapid manufacturing techniques. In Proceedings of the International Conference Polymers & Moulds Innovations PMI 2005, Gent, Belgium, 20–24 April 2005. [Google Scholar]
- Galati, M.; Minetola, P. Analysis of Density, Roughness, and Accuracy of the Atomic Diffusion Additive Manufacturing (ADAM) Process for Metal Parts. Materials 2019, 12, 4122. [Google Scholar] [CrossRef] [Green Version]
- Teeter, M.G.; Kopacz, A.J.; Nikolov, H.N.; Holdsworth, D.W. Metrology test object for dimensional verification in additive manufacturing of metals for biomedical applications. Proc. Inst. Mech. Eng. Part H J. Eng. Med. 2015, 229, 20–27. [Google Scholar] [CrossRef]
- Delgado, J.; Ciurana, J.; Reguant, C.; Cavallini, B. Studying the repeatability in DMLS technology using a complete geometry test part. Innovative Developments in Design and Manufacturing: Advanced Research in Virtual and Rapid Prototyping. In Proceedings of the VRP4, Leiria, Portugal, 22 September 2009; pp. 367–372. [Google Scholar]
- ISO. ISO 1101. Geometrical product specifications (GPS)—Geometrical Tolerancing—Tolerances of Form, Orientation, Location and Run-Out; ISO: Geneva, Switzerland, 2017. [Google Scholar]
- Hanumaiah, N.; Ravi, B. Rapid tooling form accuracy estimation using region elimination adaptive search based sampling technique. Rapid Prototyp. J. 2007, 13, 182–190. [Google Scholar] [CrossRef]
- Cooke, A.L.; Soons, J.A. Variability in the Geometric Accuracy of Additively Manufactured Test Parts. In Proceedings of the 21st Annual Solid Freeform Fabrication Symposium: An Additive Manufacturing Conference, Austin, TX, USA, 9–11 August 2010; pp. 1–12. [Google Scholar]
- Han, J.; Wu, M.; Ge, Y.; Wu, J. Optimizing the structure accuracy by changing the scanning strategy using selective laser melting. Int. J. Adv. Manuf. Technol. 2018, 95, 4439–4447. [Google Scholar] [CrossRef]
- Fahad, M.; Hopkinson, N. Evaluation and comparison of geometrical accuracy of parts produced by sintering-based additive manufacturing processes. Int. J. Adv. Manuf. Technol. 2017, 88, 3389–3394. [Google Scholar] [CrossRef]
- Toguem, S.-C.T.; Mehdi-Souzani, C.; Anwer, N.; Nouira, H. Customized design of artefacts for additive manufacturing. In Proceedings of the Euspen’s 19th International Conference & Exhibition, Bilbao, Spain, 3–7 June 2019. [Google Scholar]
- Rupal, B.S.; Ahmad, R.; Qureshi, A.J. Feature-Based Methodology for Design of Geometric Benchmark Test Artifacts for Additive Manufacturing. Procedia Cirp 2018, 70, 84–89. [Google Scholar] [CrossRef]
- ISO. ISO 17296-3. Additive Manufacturing-General Principles-Part 3: Main Characteristics and Corresponding Test Methods; ISO: Geneva, Switzerland, 2014. [Google Scholar]
- ISO/ASTM 52902:2019 [ASTM F42]. Additive manufacturing—Test artifacts—Geometric Capability Assessment of Additive Manufacturing Systems; ASTM International: West Conshohocken, PA, USA, 2019.
- Bertini, L.; Bucchi, F.; Frendo, F.; Moda, M.; Monelli, B.D. Residual stress prediction in selective laser melting. Int. J. Adv. Manuf. Technol. 2019, 105, 609–636. [Google Scholar] [CrossRef]
- Tan, J.H.K.; Sing, S.L.; Yeong, W.Y. Microstructure modelling for metallic additive manufacturing: A review. Virtual Phys. Prototyp. 2020, 15, 87–105. [Google Scholar] [CrossRef]
- Plocher, J.; Panesar, A. Review on design and structural optimisation in additive manufacturing: Towards next-generation lightweight structures. Mater. Des. 2019, 183, 108164. [Google Scholar] [CrossRef]
- Renishaw PLC. “AM250”. Available online: https://www.renishaw.com/en/am250--15253 (accessed on 19 November 2020).
- BS 7172: Guide to Assessment of Position, Size and Departure from Nominal Form of Geometric Features; BSI: London, UK, 1989.
- Hocken, R.J.; Pereira, P.H. (Eds.) Coordinate Measuring Machines and Systems; CRC Press: Boca Raton, FL, USA, 2016. [Google Scholar]
- Autodesk Inc. “Netfabb”. Available online: https://www.autodesk.com/products/netfabb/ (accessed on 10 January 2021).
- Hodge, N.E.; Ferencz, R.M.; Solberg, J.M. Implementation of a thermomechanical model for the simulation of selective laser melting. Comput. Mech. 2014, 54, 33–51. [Google Scholar] [CrossRef]
- Peng, H.; Ghasri-Khouzani, M.; Gong, S.; Attardo, R.; Ostiguy, P.; Rogge, R.B.; Gatrell, B.A.; Budzinski, J.; Tomonto, C.; Neidig, J.; et al. Fast prediction of thermal distortion in metal powder bed fusion additive manufacturing: Part 2, a quasi-static thermo-mechanical model. Addit. Manuf. 2018, 22, 869–882. [Google Scholar] [CrossRef]
- Rupal, B.S.; Anwer, N.; Secanell, M.; Qureshi, A.J. Geometric Tolerance and Manufacturing Assemblability Estimation of Metal Additive Manufacturing (AM) Processes. Mater. Des. 2020, 194, 108842. [Google Scholar] [CrossRef]
- Gouge, M.; Denlinger, E.; Irwin, J.; Li, C.; Michaleris, P. Experimental validation of thermo-mechanical part-scale modeling for laser powder bed fusion processes. Addit. Manuf. 2019, 29, 100771. [Google Scholar] [CrossRef]
- Zhang, Y.; Zhang, J. Finite element simulation and experimental validation of distortion and cracking failure phenomena in direct metal laser sintering fabricated component. Addit. Manuf. 2017, 16, 49–57. [Google Scholar] [CrossRef] [Green Version]
- GOM GmBH. GOM Inspect. Available online: https://www.gom.com/3d-software/gom-inspect.html (accessed on 26 February 2021).
- Li, C.; Liu, J.F.; Fang, X.Y.; Guo, Y.B. Efficient predictive model of part distortion and residual stress in selective laser melting. Addit. Manuf. 2017, 17, 157–168. [Google Scholar] [CrossRef]


| Ref. | Geometric Tolerance Characteristics | Tolerance Directionality | Effect of Base Plate Removal Studied | Prior Numerical Simulation Conducted | Comments on GBTA Design |
|---|---|---|---|---|---|
| [12] | Straightness, flatness, roundness, cylindricity, perpendicularity, parallelism, profile, concentricity, position | Positive Z direction, XY plane, and few negative features in the Y direction | No | No |
|
| [24] | Straightness, flatness, circularity | Positive Z direction and XY plane | No | No |
|
| [25] | Flatness, squareness, parallelism, circularity | Positive Z direction and XY plane | No | No |
|
| [26] | Straightness, flatness, roundness, concentricity, total runout | For flat features: XY plane For cylindrical features: positive Z-axis | No | No |
|
| [27] | Flatness, cylindricity, true position | Features in bi-planar directions | No | No |
|
| [28] | Straightness, flatness, roundness, cylindricity, perpendicularity, parallelism, angularity, profile, concentricity, position | Positive features in the bi-planar direction | No | No |
|
| Machine Settings | Value | Manufacturing Parameters | Value |
|---|---|---|---|
| Layer thickness | 50 µm | Powder material | Stainless steel (SS 316L) |
| Laser power | 200 W | Powder particle size | 15–45 µm |
| Base plate size | 250 × 250 × 15 mm | Hatching style | Chessboard style |
| Scan speed | 600 mm/s | Hatch spacing | 150 µm |
| Laser beam diameter | 70 µm | Interlayer angle | 67° |
| # | GD&T Characteristics | Features Categorization for Measurement |
|---|---|---|
| 1 | Straightness | Features with straight-line–flat surfaces of cuboids and thin sheets. |
| 2 | Flatness | Features with flat surfaces-cuboids, the top surface of cylinders. |
| 3 | Perpendicularity | Flat surfaces of cuboids and thin sheets with respect to a planar surface as a datum feature. |
| 4 | Parallelism | Features with flat surfaces parallel to a planar surface as a datum feature |
| 5 | Angularity | Angular features with respect to a planar surface as a datum feature. |
| 6 | True Position | Cylindrical and planar features with respect to a datum coordinate system. |
| 7 | Circularity | Cylindrical features–circular periphery on the outer surface of cylinders and hollow cylinders. |
| 8 | Cylindricity | Cylindrical features. |
| 9 | Concentricity | Stacked cylindrical features. |
| 10 | Circular run-out | Stacked cylindrical features. |
| 11 | Total run-out | Stacked cylindrical features. |
| Simulation Parameter | Value |
|---|---|
| Heat source absorption efficiency (%) | 35 |
| Analysis type | Thermal and mechanical |
| Structural plasticity calculation | After the part is cooled down and before removing the base plate |
| Mesh approach | Layer based |
| Maximum mesh adaptively levels | 5 |
| Coarsening generations | 1 |
| Layers per mesh element | 20 |
Publisher’s Note: MDPI stays neutral with regard to jurisdictional claims in published maps and institutional affiliations. |
© 2021 by the authors. Licensee MDPI, Basel, Switzerland. This article is an open access article distributed under the terms and conditions of the Creative Commons Attribution (CC BY) license (https://creativecommons.org/licenses/by/4.0/).
Share and Cite
Rupal, B.S.; Singh, T.; Wolfe, T.; Secanell, M.; Qureshi, A.J. Tri-Planar Geometric Dimensioning and Tolerancing Characteristics of SS 316L Laser Powder Bed Fusion Process Test Artifacts and Effect of Base Plate Removal. Materials 2021, 14, 3575. https://doi.org/10.3390/ma14133575
Rupal BS, Singh T, Wolfe T, Secanell M, Qureshi AJ. Tri-Planar Geometric Dimensioning and Tolerancing Characteristics of SS 316L Laser Powder Bed Fusion Process Test Artifacts and Effect of Base Plate Removal. Materials. 2021; 14(13):3575. https://doi.org/10.3390/ma14133575
Chicago/Turabian StyleRupal, Baltej Singh, Tegbir Singh, Tonya Wolfe, Marc Secanell, and Ahmed Jawad Qureshi. 2021. "Tri-Planar Geometric Dimensioning and Tolerancing Characteristics of SS 316L Laser Powder Bed Fusion Process Test Artifacts and Effect of Base Plate Removal" Materials 14, no. 13: 3575. https://doi.org/10.3390/ma14133575