
Mechanical Properties of Bio-Composites Based on Epoxy Resin and Nanocellulose Fibres

 , , , , , and
Abstract
:1. Introduction
2. Materials
2.1. Preparation of Nanocelulosse
2.2. Preparation of Reference Samples
2.3. Preparation of Nanocelulosse EP + NC Samples
3. Methods
3.1. Spectral Testing Methods
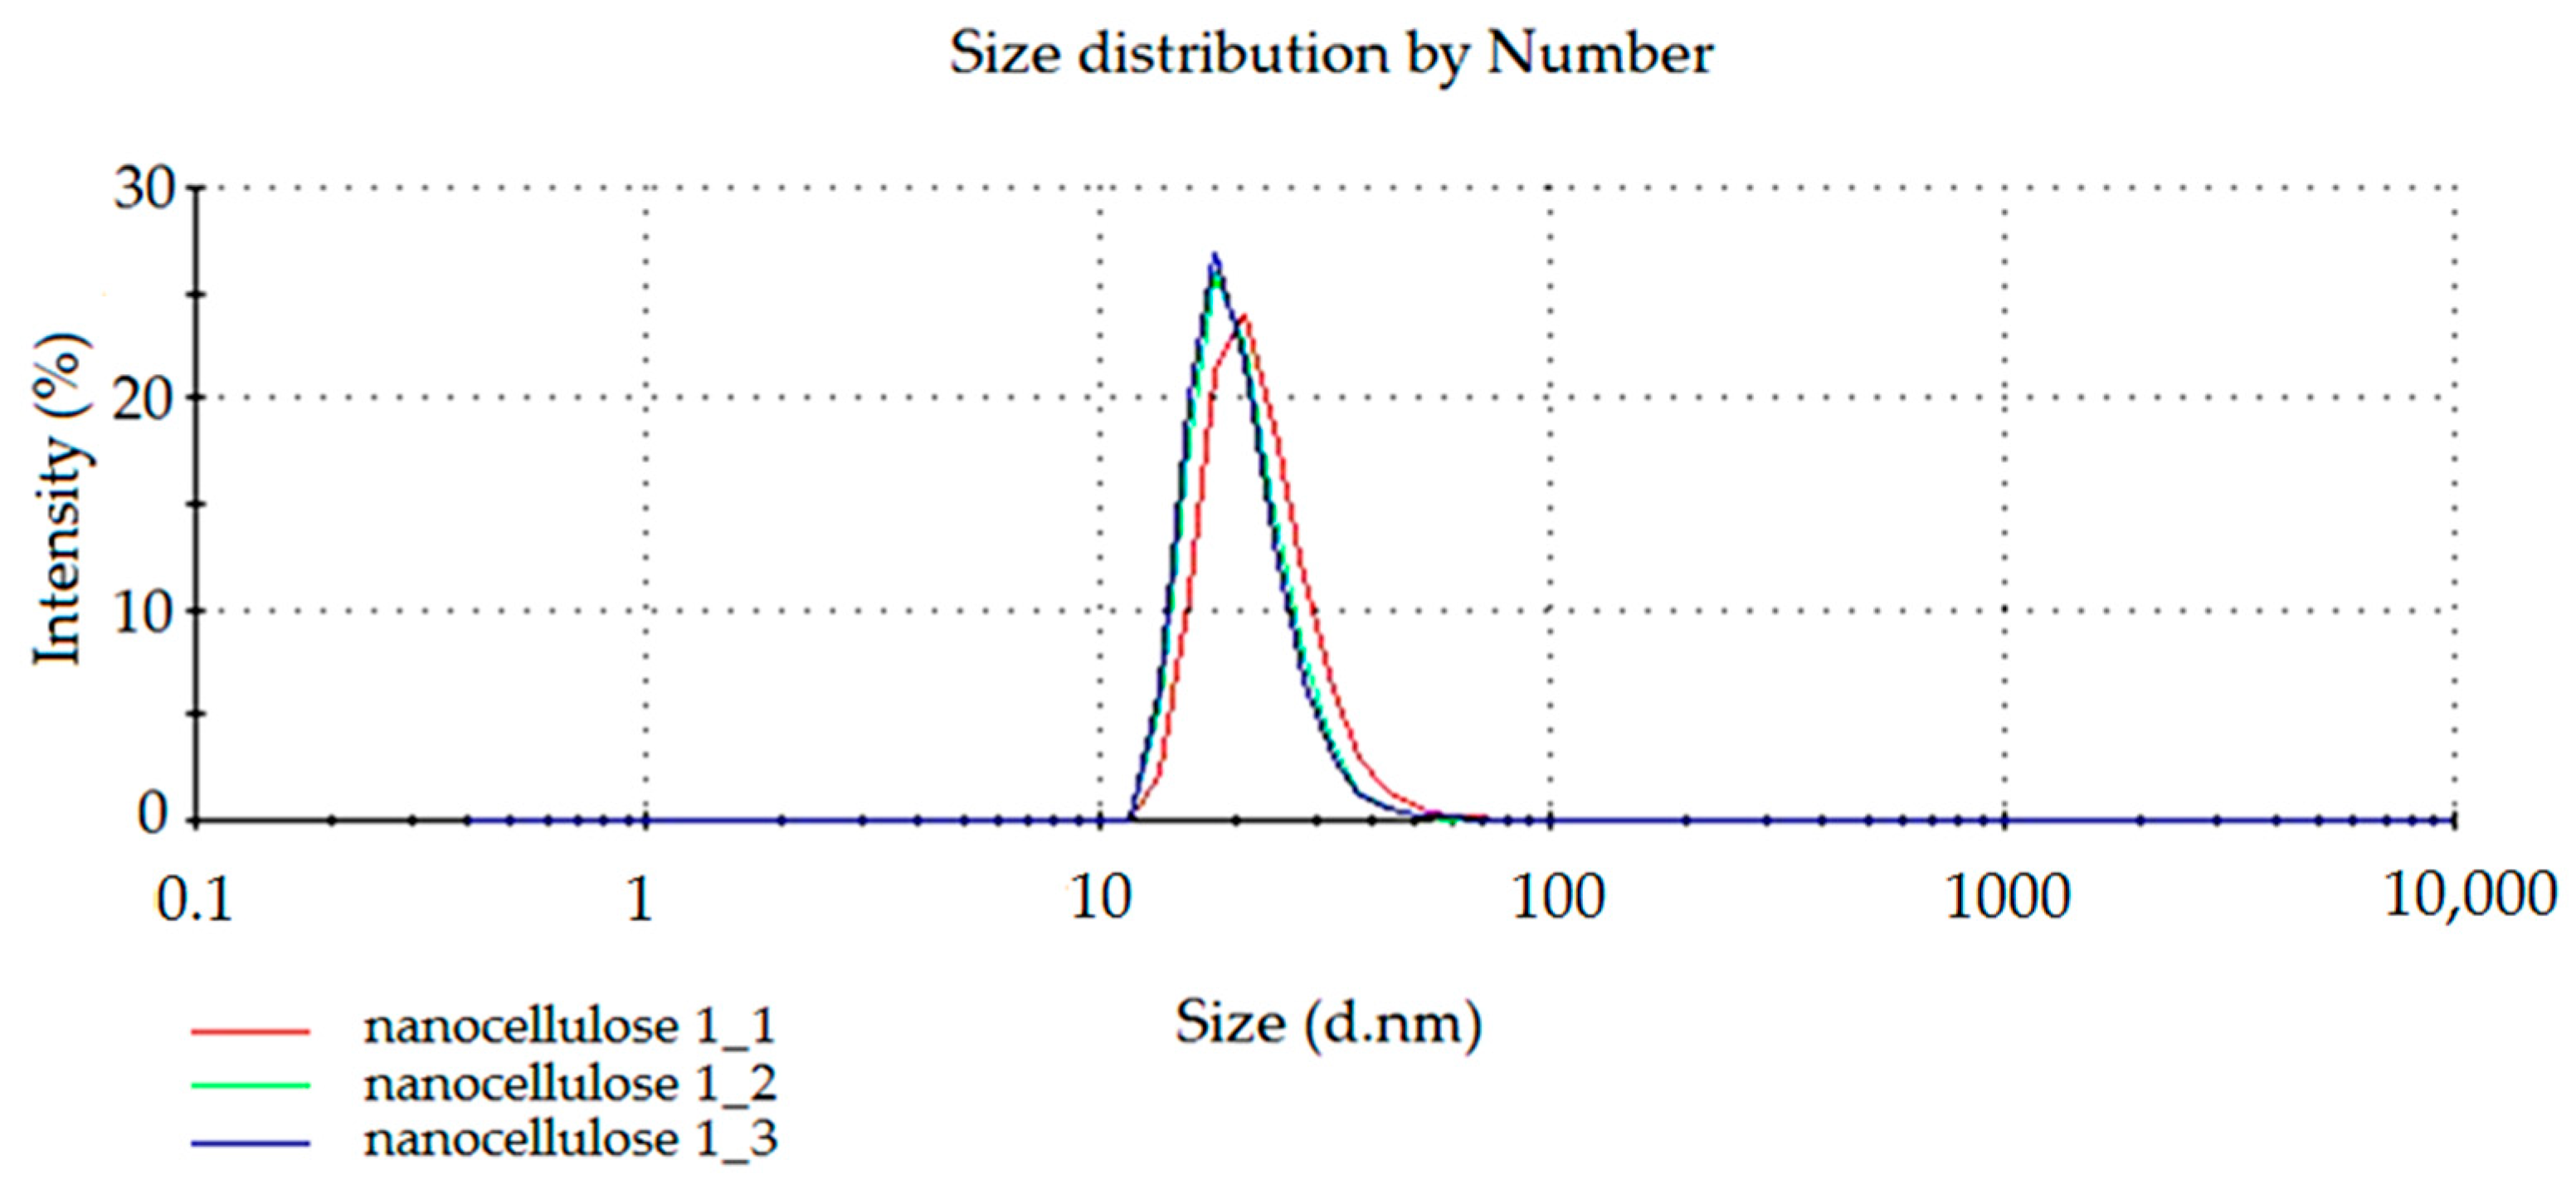
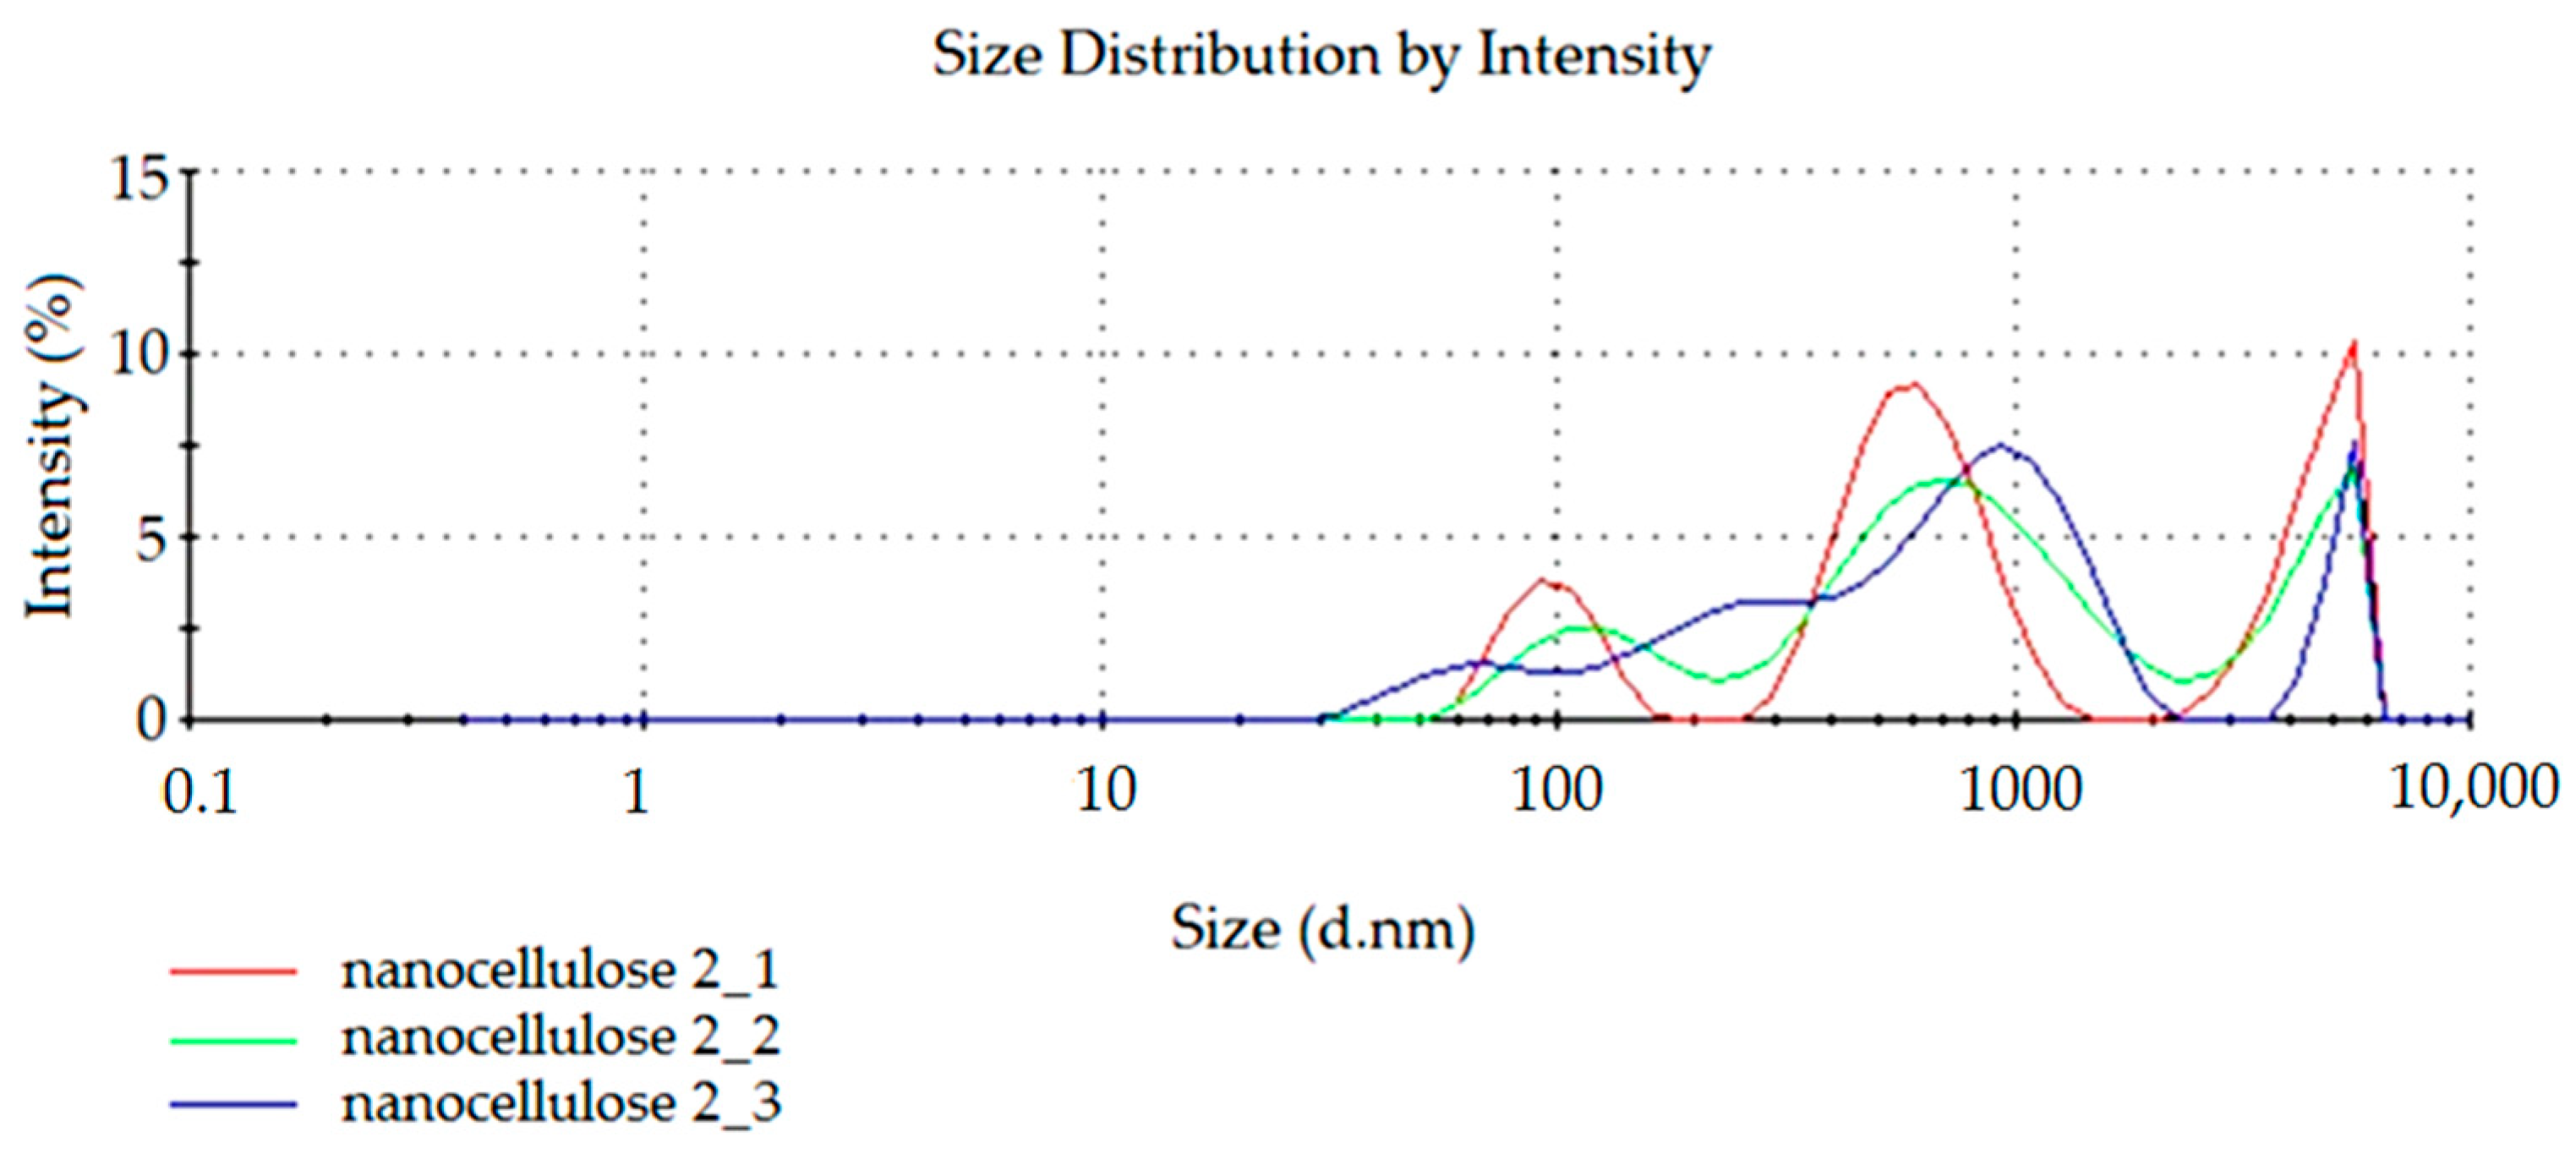
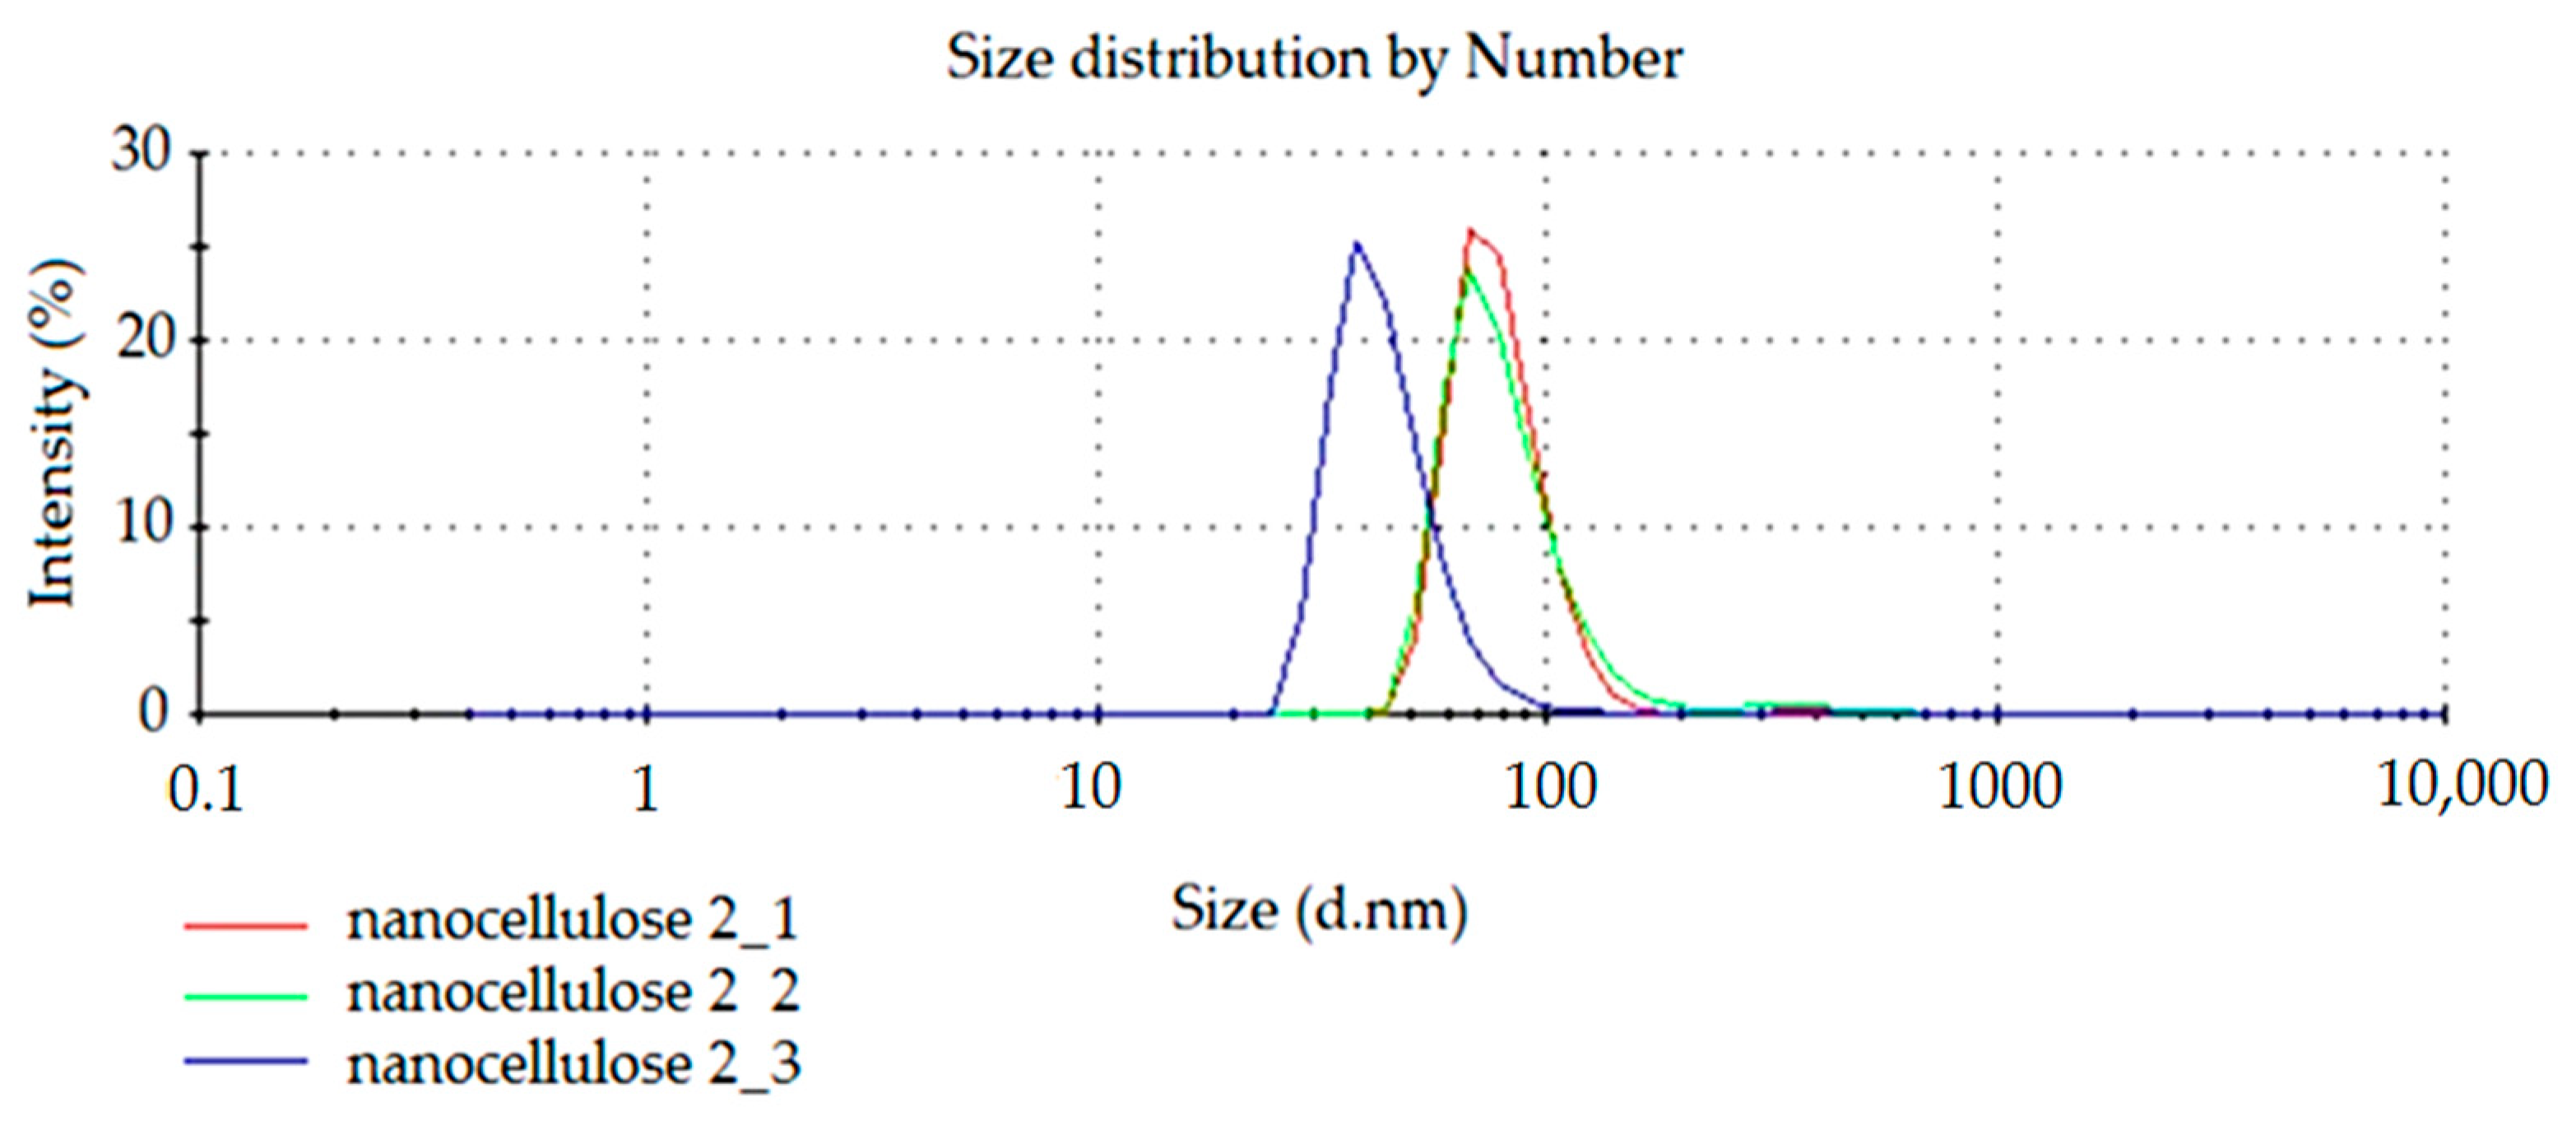
3.1.1. Particle Size Measurements of Nanocellulose
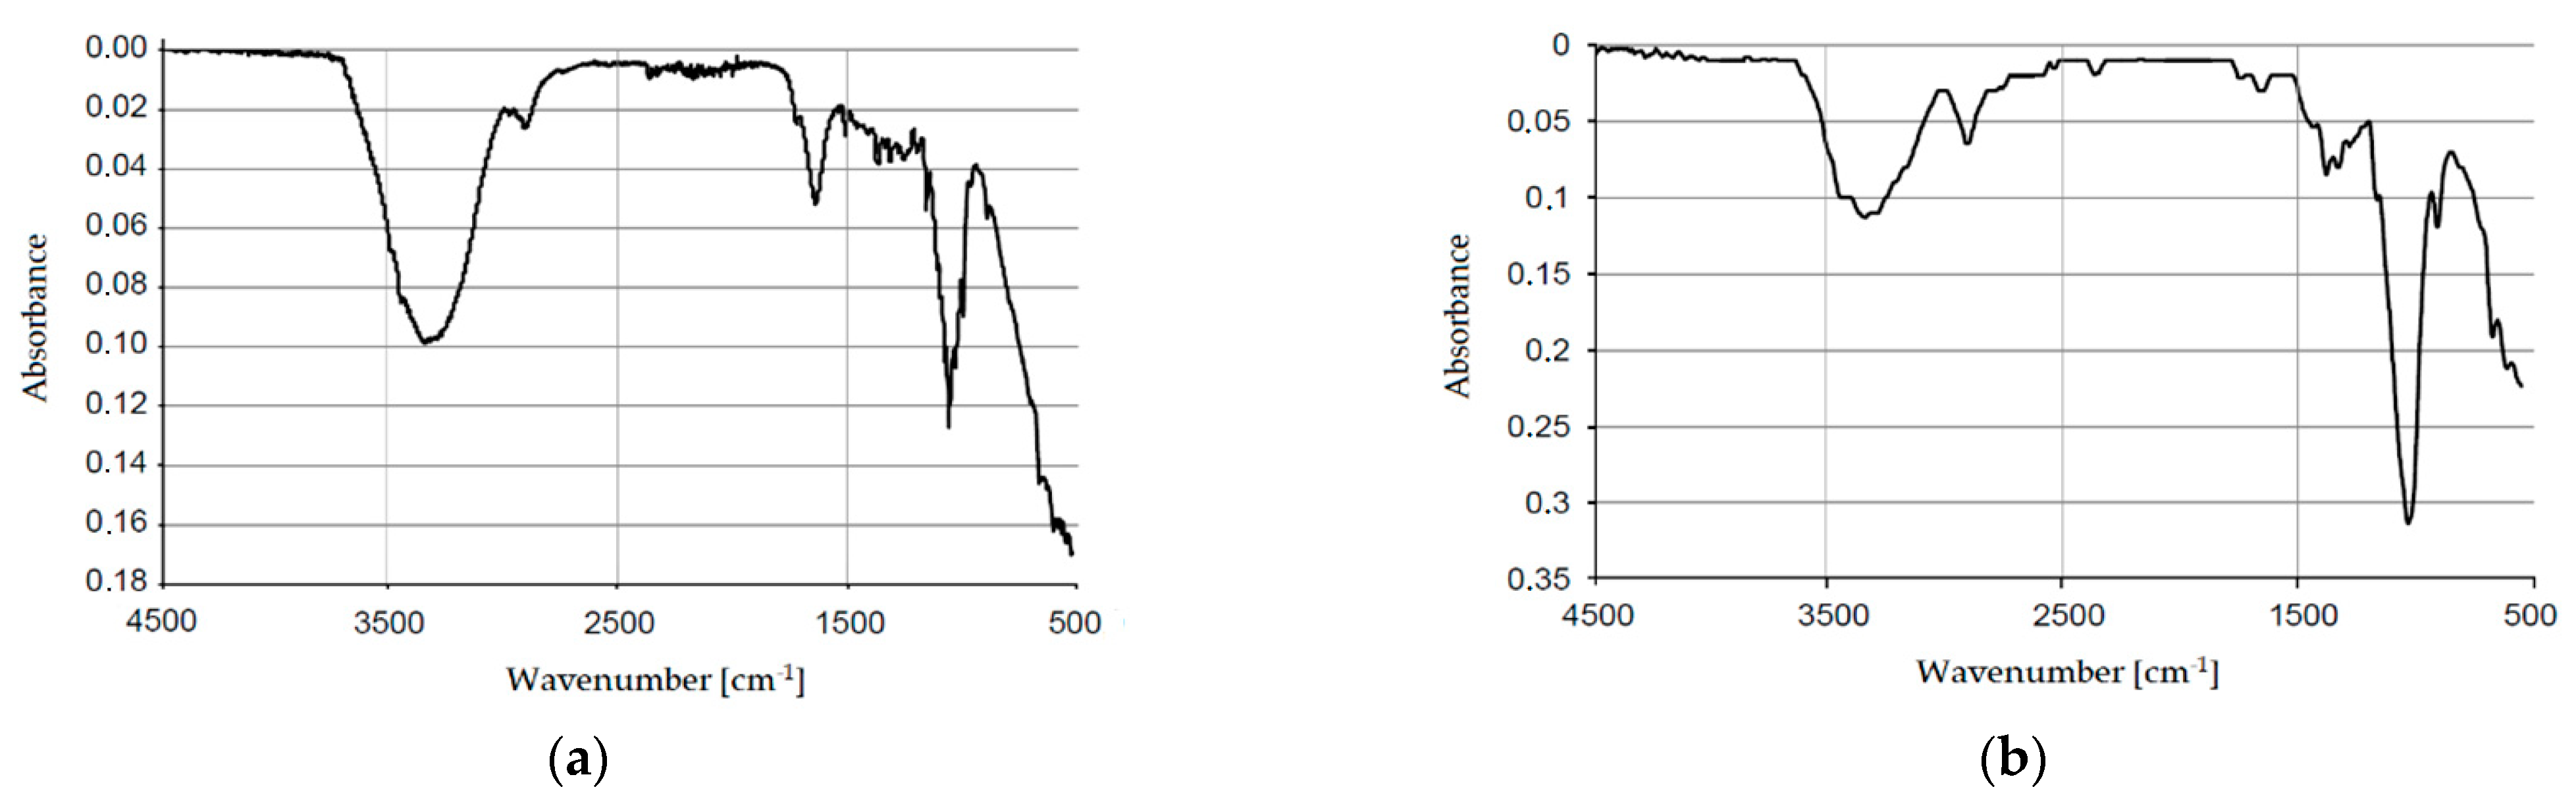
3.1.2. FTIR ATR
3.1.3. SEM
3.2. Mechanical Properties Testing Methods
3.2.1. Impact Strength
3.2.2. Resistance to Crack Propagation
3.2.3. Resistance to Three-Point Bending
3.3. Thermal Testing Methods
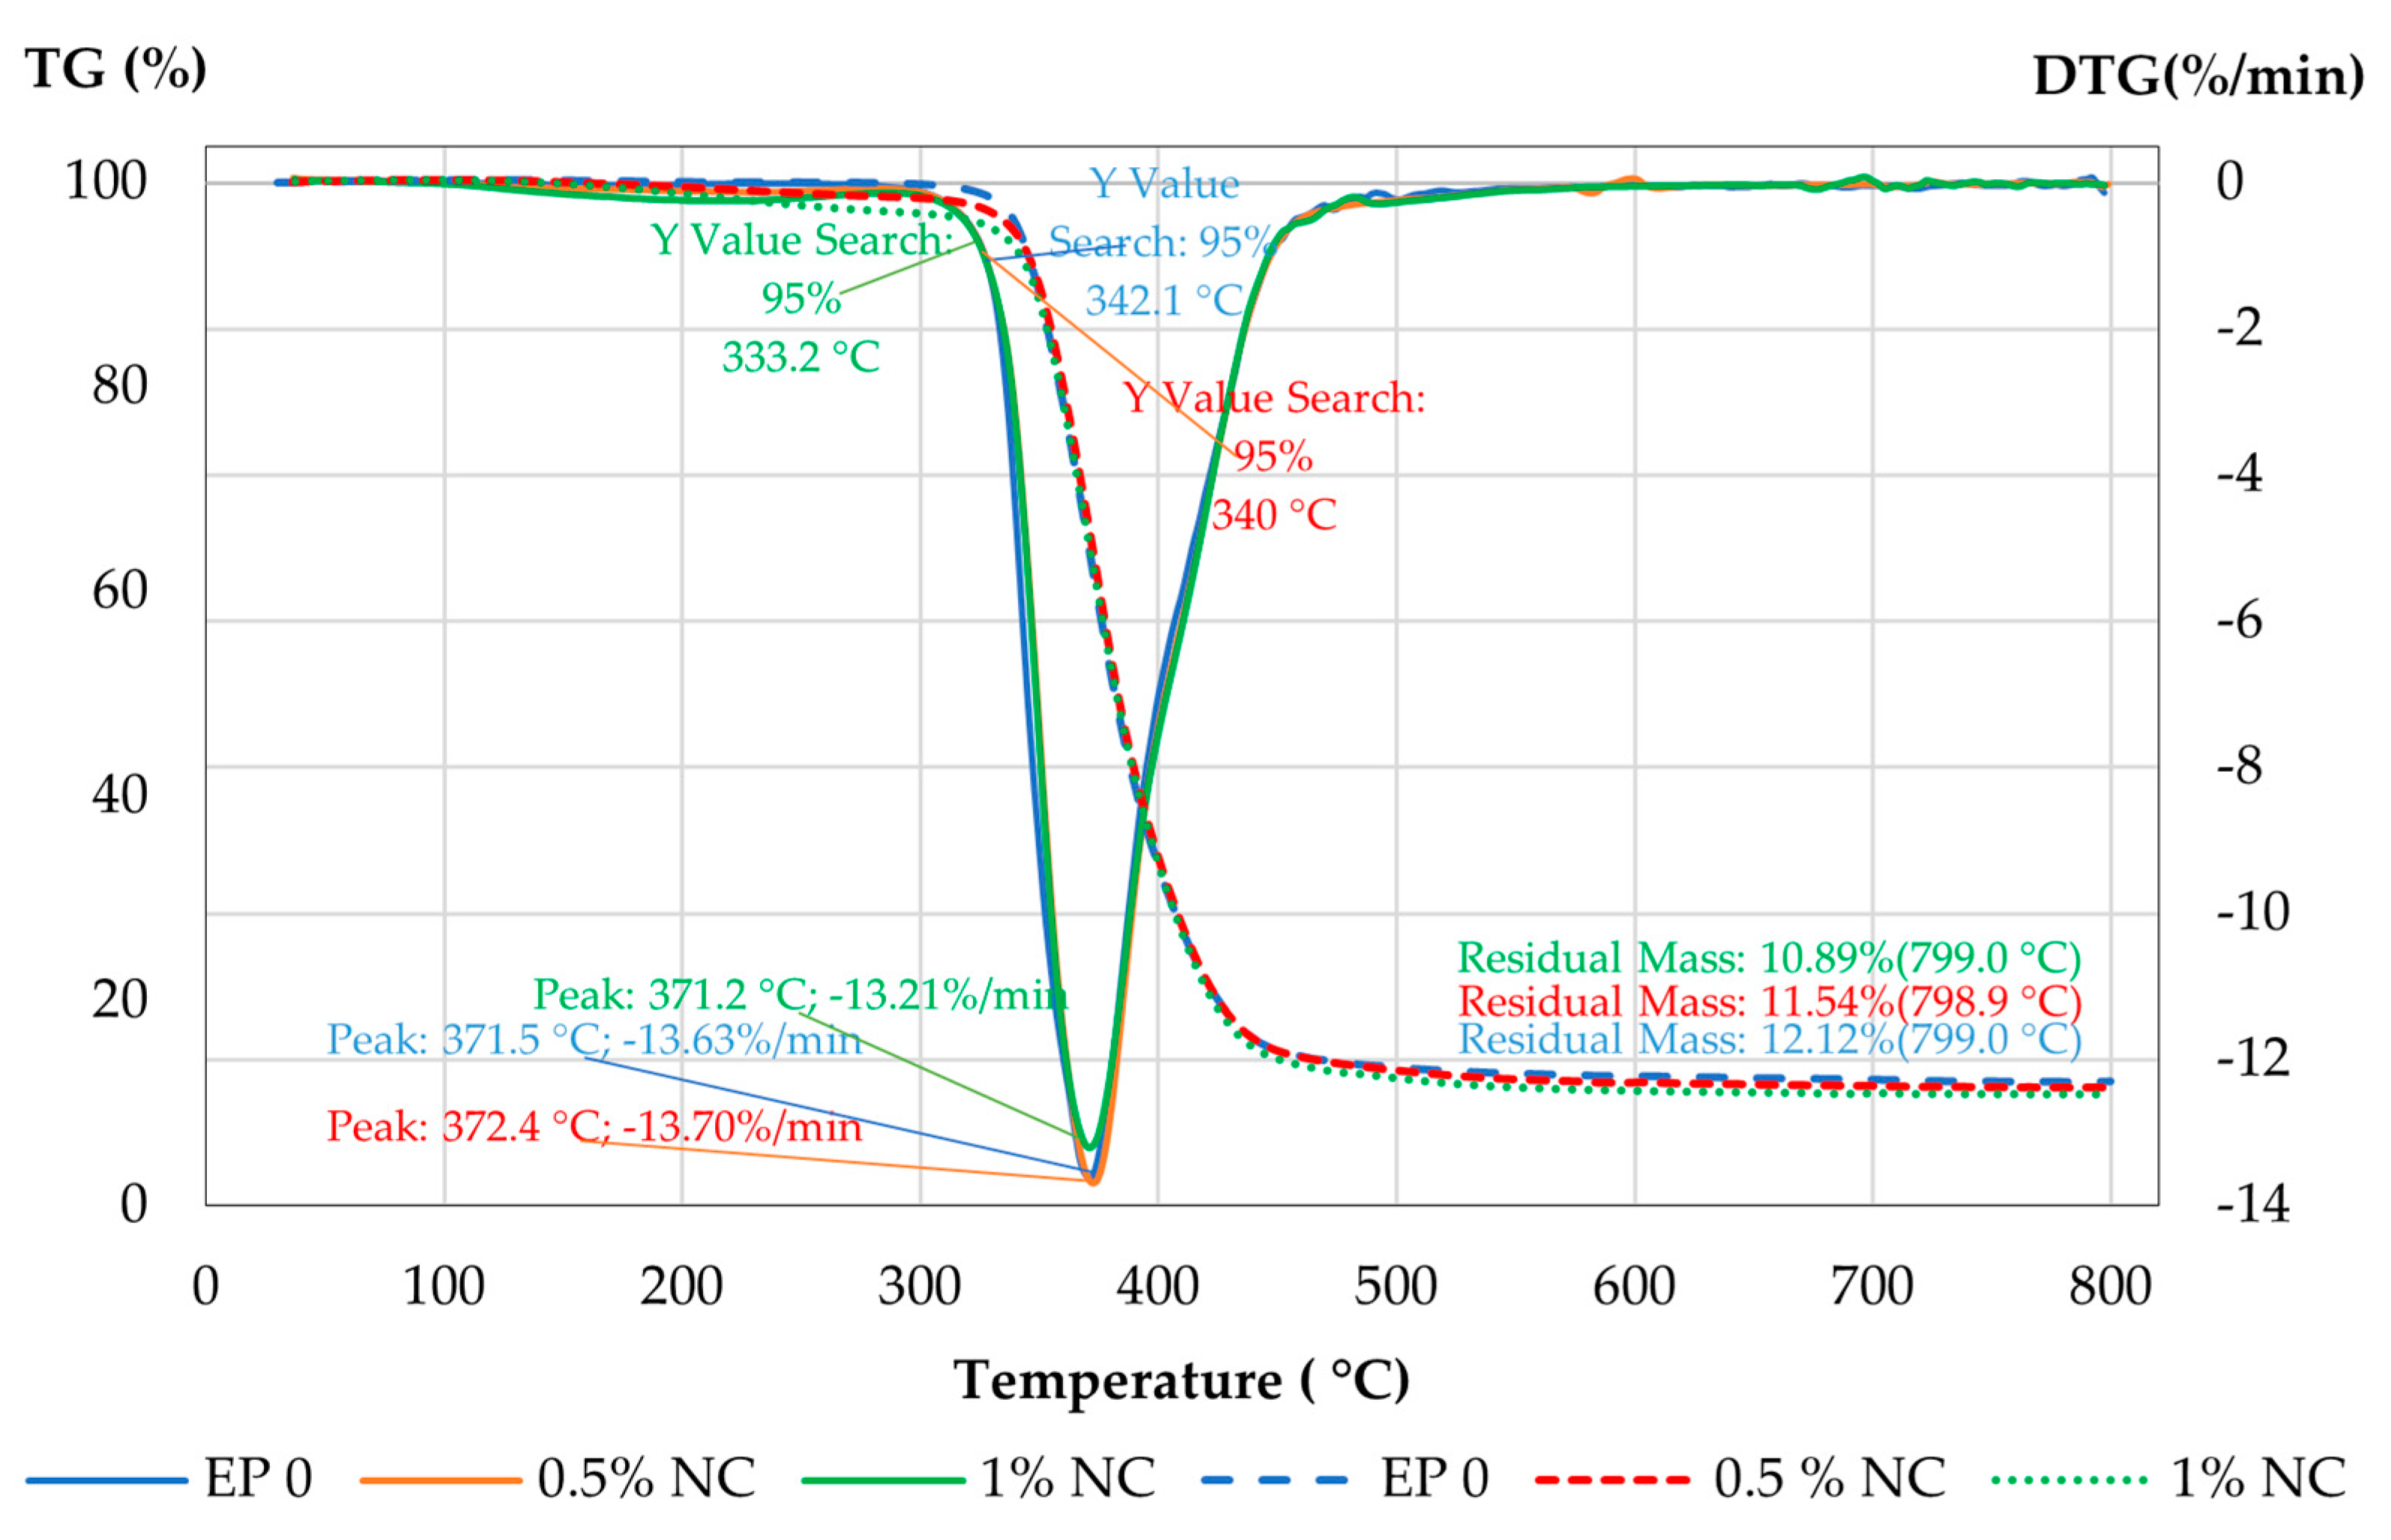
3.3.1. TGA
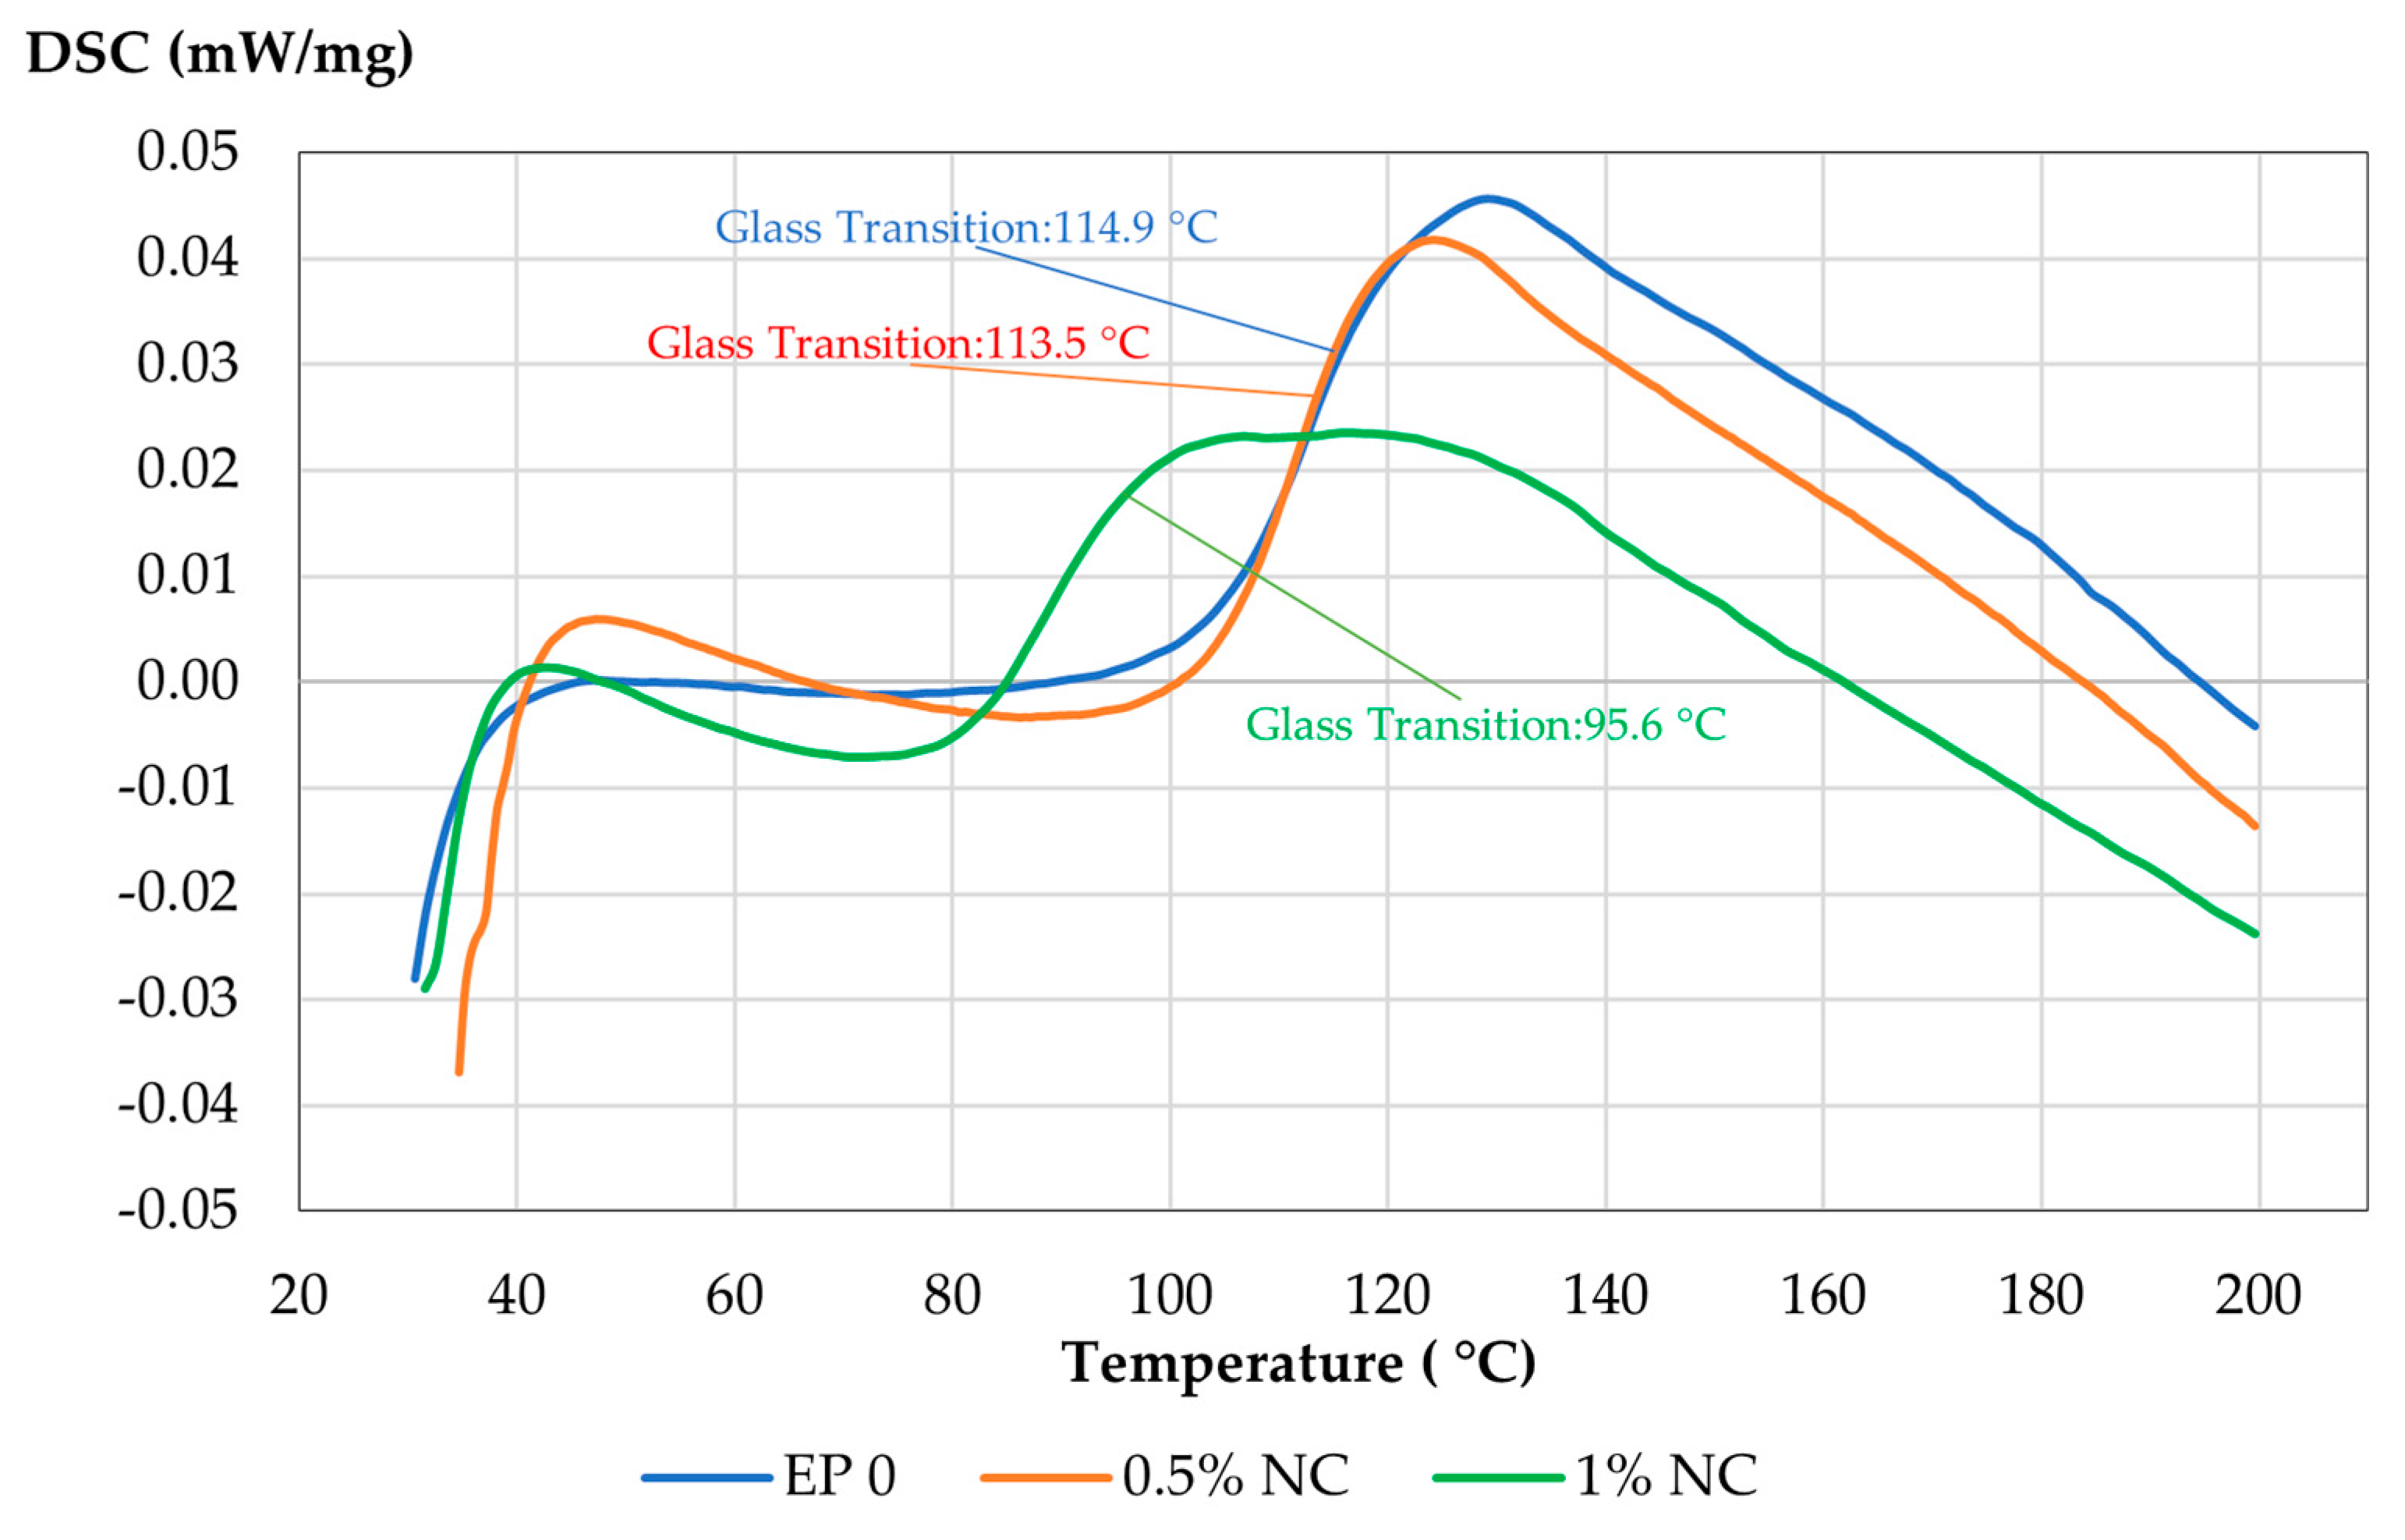
3.3.2. DSC
4. Results
4.1. Spectral Testing Results
4.2. Mechanical Testing Results
4.3. Thermal Testing Results
5. Discussion
6. Conclusions
- impact strength higher by about 70–90%;
- an improvement of resistance to brittle cracking by 70%;
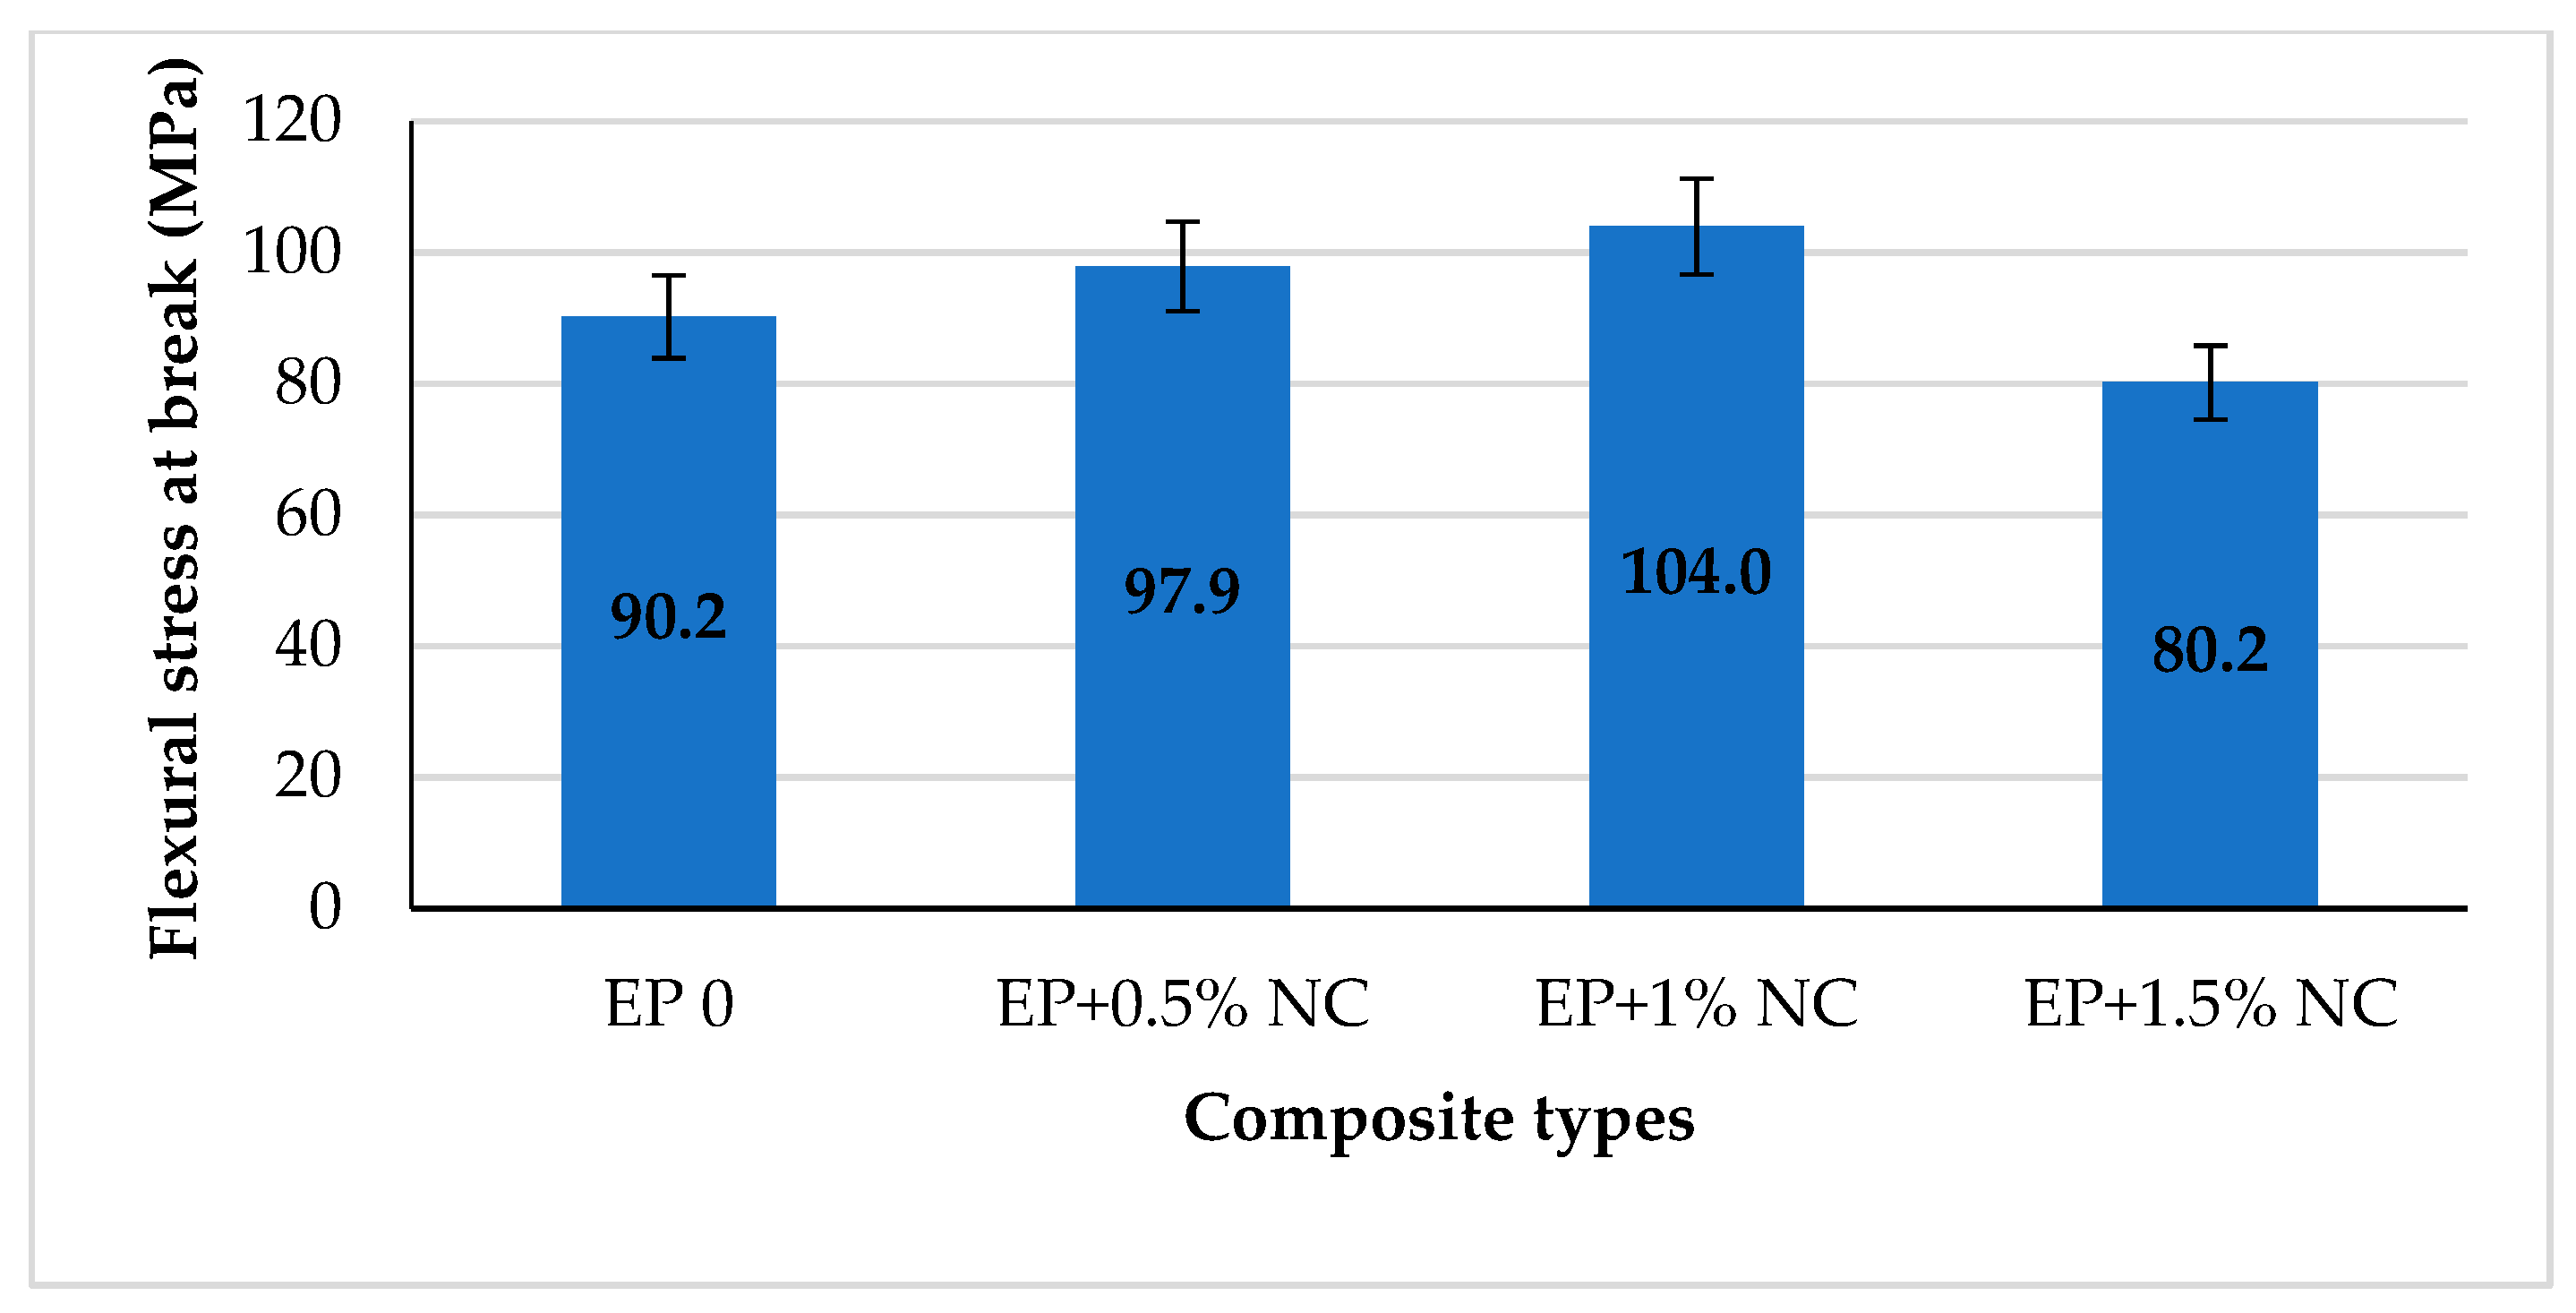
- flexural stress at break higher about 15%;
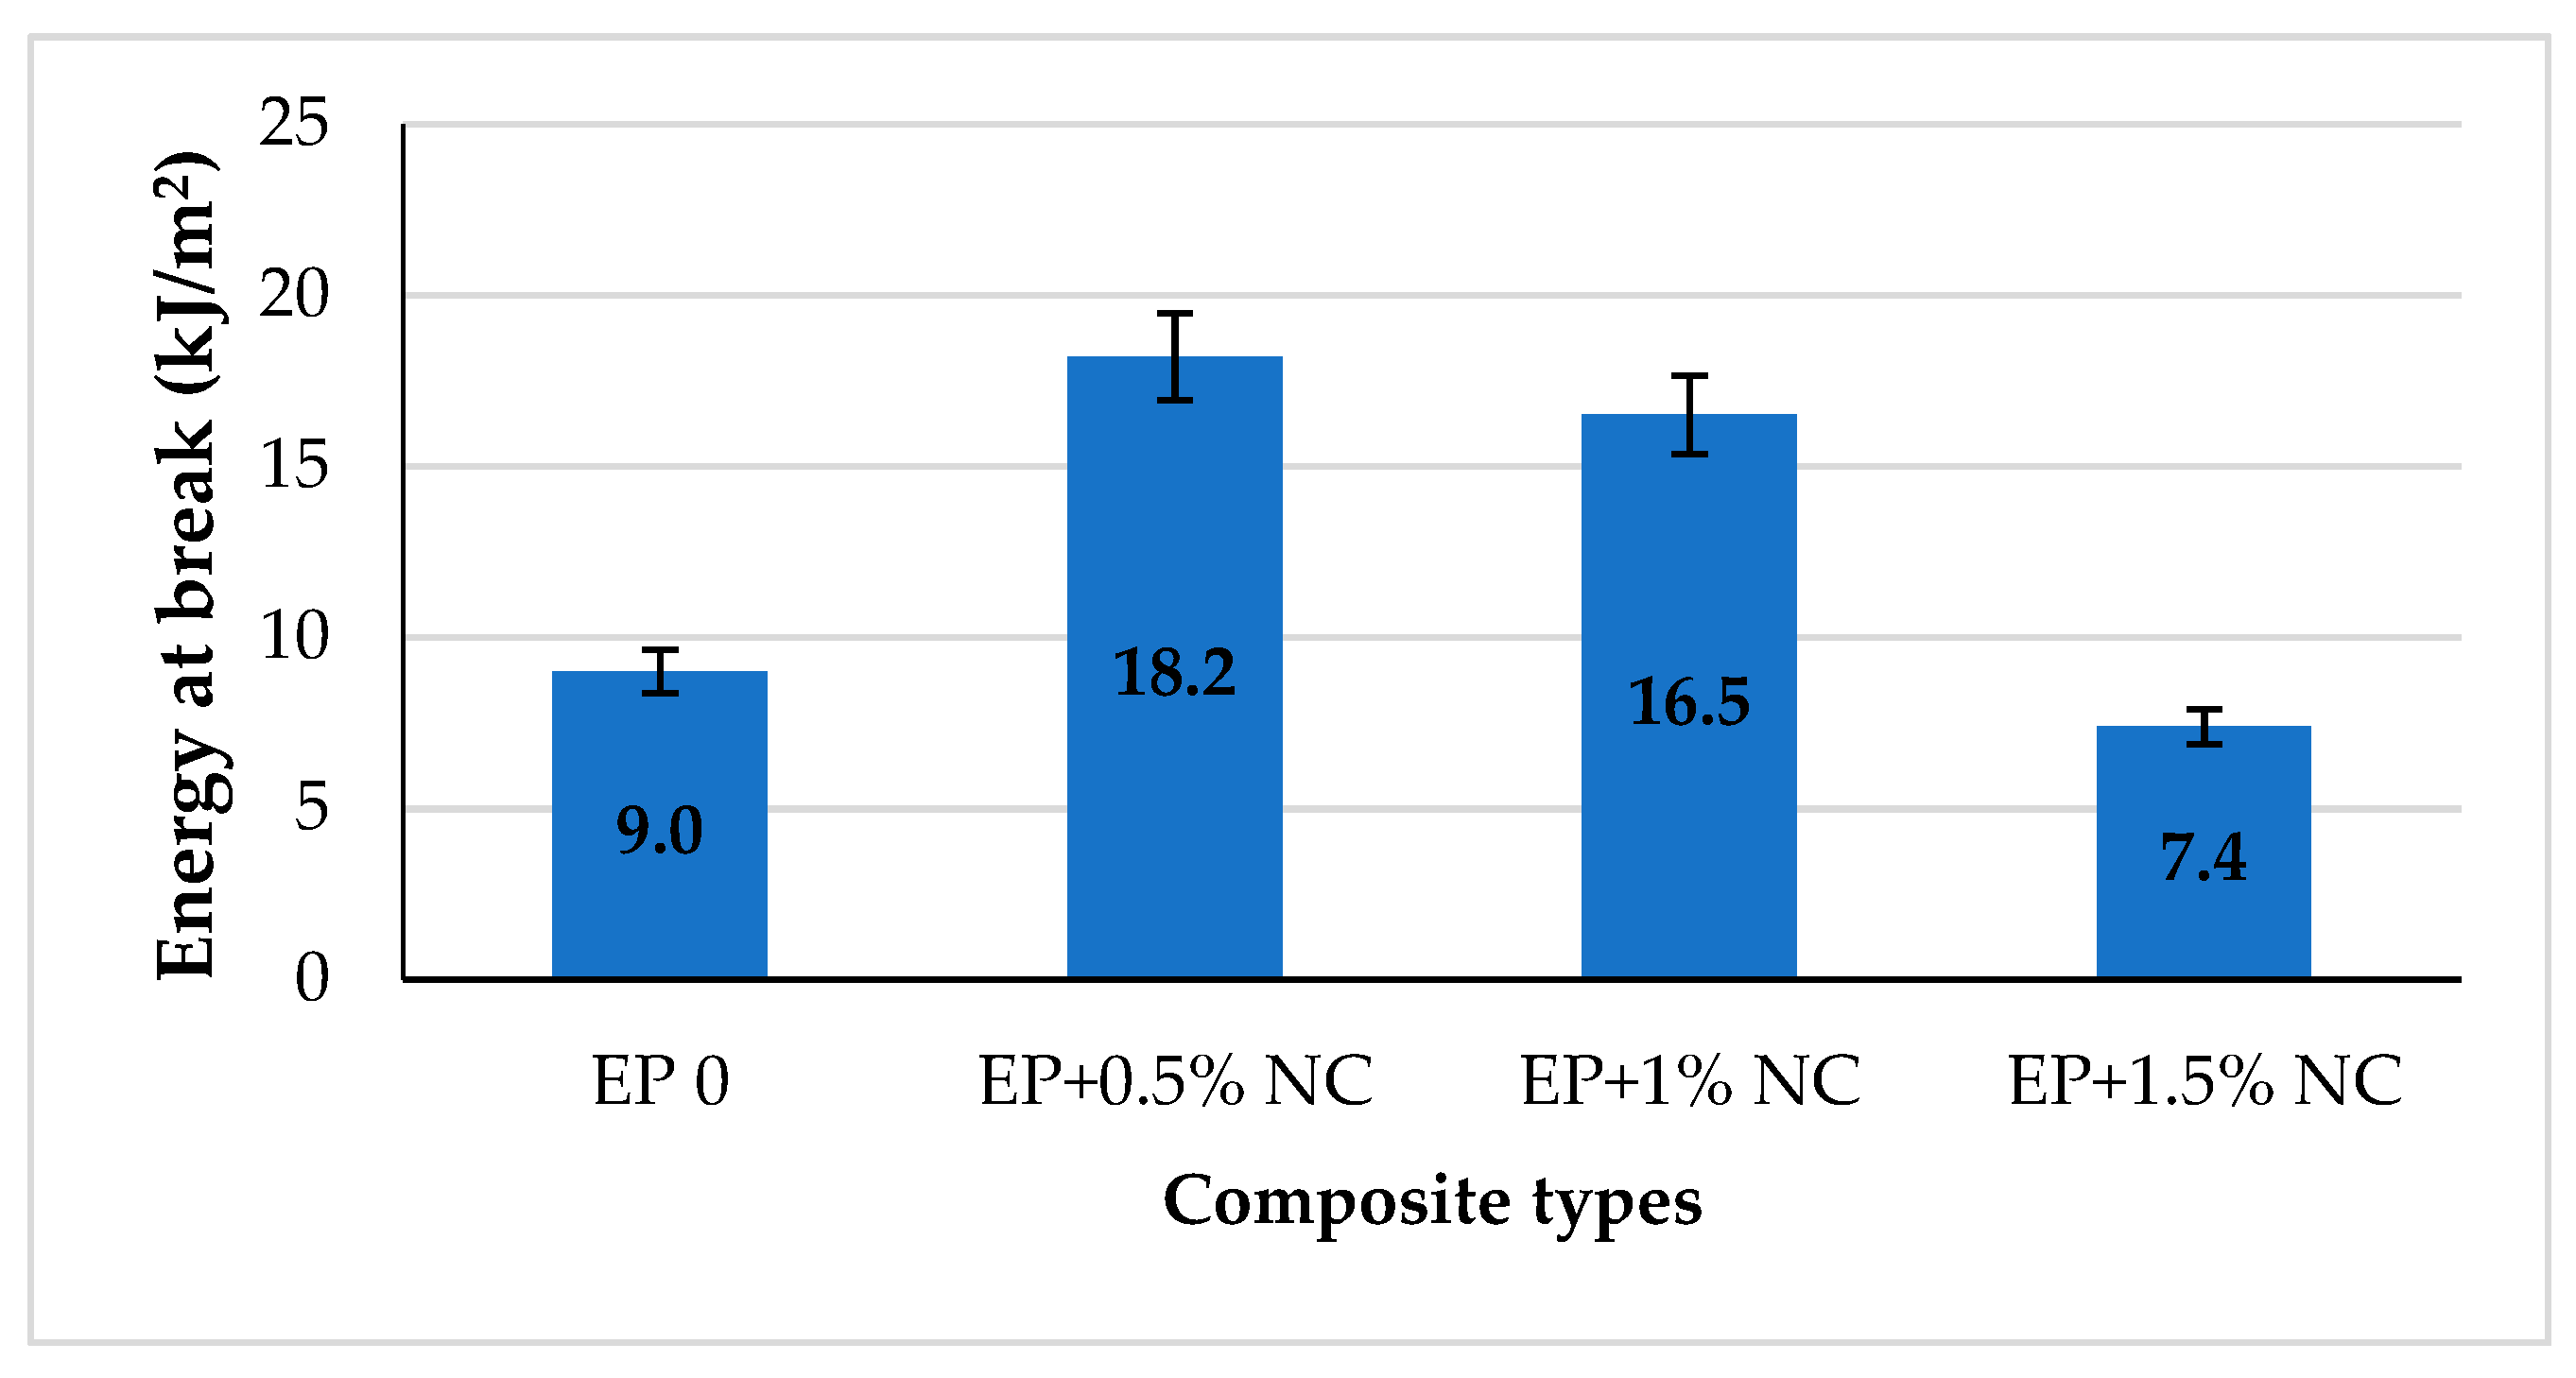
- higher energy to break and stress at the break i.e., for the best compositions 102% and 15%, respectively.
Author Contributions
Funding
Institutional Review Board Statement
Informed Consent Statement
Data Availability Statement
Conflicts of Interest
References
- Balguri, P.K.; Harris, S. A review on mechanical properties of epoxy nanocomposites. Mater. Today Proc. 2020, in press. [Google Scholar] [CrossRef]
- Meiling, Y.; Weicheng, J. High strength and toughness epoxy nanocomposites reinforced with graphene oxide-nanocellulose micro/nanoscale structures. Appl. Surf. Sci. 2019, 497, 143802. [Google Scholar]
- Jabbar, A. Extraction of Nanocellulose from Waste Jute Fibers and Characterization of Mechanical and Dynamic Mechanical Behavior of Nanocellulose-Coated Jute/Green Epoxy Composites. In Sustainable Jute-Based Composite Materials; Springer: Berlin/Heidelberg, Germany, 2017; pp. 71–85. [Google Scholar]
- Alcántara, J.C. Biocomposites from Rice Straw Nanofibers: Morphology, Thermal and Mechanical Properties. Materials 2020, 13, 2138. [Google Scholar] [CrossRef]
- Hassan, M.; Berglund, L. Nanocomposite Film Based on Cellulose Acetate and Lignin-Rich Rice Straw Nanofibers. Materials 2019, 12, 595. [Google Scholar] [CrossRef] [Green Version]
- Khalil, A.; Bhat, A. Green composites from sustainable cellulose nanofibrils: A review. Carbohydr. Polym. 2012, 87, 963–979. [Google Scholar] [CrossRef]
- Eichhorn, S.J.; Dufresne, A.; Aranguren, M.; Marcovich, N.E.; Capadona, J.R.; Rowan, S.; Weder, C.; Thielemans, W.; Roman, M.; Renneckar, S.; et al. Review: Current international research into cellulose nanofibres and nanocomposites. J. Mater. Sci. 2010, 45, 1–33. [Google Scholar] [CrossRef] [Green Version]
- Siró, I.; Plackett, D. Microfibrillated cellulose and new nanocomposite materials: A review. Cellulose 2010, 17, 459–494. [Google Scholar] [CrossRef]
- Valentim, R.; Andrade, S. Composite Based on Biphasic Calcium Phosphate (HA/_-TCP) and Nanocellulose from the Açaí Tegument. Materials 2018, 11, 2213. [Google Scholar] [CrossRef] [PubMed] [Green Version]
- Biagiotti, J.; Puglia, D.; Kenny, J.M. A review on natural fibre-based composites-part I. J. Nat. Fibers 2004, 1, 37–68. [Google Scholar] [CrossRef]
- Ramamoorthy, M.; Skrifvars, A.; Persson, A. A review of natural fibers used in biocomposites: Plant, animal and regenerated cellulose fibers. Polym. Rev. 2015, 55, 107–162. [Google Scholar] [CrossRef]
- Joseph, B.; Sagarika, V.K.; Sabu, C.; Kalarikkal, N.; Thomas, S. Cellulose nanocomposites: Fabrication and biomedical applications. J. Bioresour. Bioprod. 2020, 5, 223–237. [Google Scholar] [CrossRef]
- Halib, N.; Perrone, F. Potential Applications of Nanocellulose-Containing Materials in the Biomedical Field. Materials 2017, 10, 977. [Google Scholar] [CrossRef] [Green Version]
- Kargarzadeh, H. Recent developments on nanocellulose reinforced polymer nanocomposites: A review. Polymer 2017, 132, 368–393. [Google Scholar] [CrossRef]
- Pogorelova, N.; Rogachev, E. Bacterial Cellulose Nanocomposites: Morphology and Mechanical Properties. Materials 2020, 13, 2849. [Google Scholar] [CrossRef]
- Hao, W.; Wang, M. A review on nanocellulose as a lightweight filler of polyolefin Composite. Carbohydr. Polym. 2020, 243, 116466. [Google Scholar] [CrossRef] [PubMed]
- Mohammad, F.; Sanyang, M.L. Thermal and dynamic mechanical properties of cellulose nanofibers reinforced epoxy Composite. Int. J. Biol. Macromol. 2017, 102, 822–828. [Google Scholar]
- Thomas, P. Comprehensive review on nanocellulose: Recent developments, challenges and future prospects. J. Mech. Behav. Biomed. Mater. 2020, 110, 103884. [Google Scholar] [CrossRef] [PubMed]
- Silva, F.; Gama, M. Nanocellulose Bio-Based Composites for Food Packaging. Nanomaterials 2020, 10, 2041. [Google Scholar] [CrossRef] [PubMed]
- Munteanu, S.; Vasile, C. Vegeteble Additives in Food Packaging Polymeric Materials. Polymers 2020, 12, 28. [Google Scholar] [CrossRef] [Green Version]
- Shen, R.; Xue, S. Research Progress and Development Demand of Nanocellulose Reinforced Polymer Composites. Polymers 2020, 12, 2113. [Google Scholar] [CrossRef]
- Lee, K.-Y.; Aitomäki, Y. On the use of nanocellulose as reinforcement in polymer matrix composites. Compos. Sci. Technol. 2014, 105, 15–27. [Google Scholar] [CrossRef] [Green Version]
- Krzyżak, A.; Grzesik, N. Application of polymer composites with plant reinforcement used in machine and aircraft construction in changeable environmental conditions. J. KONES Powertrain Transp. 2016, 23, 2. [Google Scholar] [CrossRef]
- Krzyżak, A.; Gil, L. Evaluation of the reliability of composite materials used in aviation. In Safety and Reliability–Safe Societies in a Changing World; Haugen, S., Barros, A., van Gulijk, C., Kongsvik, T., Vinnem, J.E., Eds.; Taylor & Francis Group: London, UK, 2018; Volume 1, pp. 2093–2098. [Google Scholar]
- Mucha, M.; Krzyżak, A. Effect of MWCNTs on Wear Behavior of Epoxy Resin for Aircraft Applications. Materials 2020, 13, 2696. [Google Scholar] [CrossRef]
- Wongjaiyen, T.; Brostow, W. Tensile properties and wear resistance of epoxy nanocomposites reinforced with cellulose nanofibers. Polym. Bull. 2018, 75, 2039–2051. [Google Scholar] [CrossRef]
- Yeo, J.-S. The effect of chemical surface treatment on the fracture toughness of microfibrillated cellulose reinforced epoxy composites. J. Ind. Eng. Chem. 2017, 45, 301. [Google Scholar] [CrossRef]
- Tang, L.; Weder, C. Cellulose Whisker/Epoxy Resin Nanocomposites. Appl. Mater. Interfaces 2010, 2, 1073. [Google Scholar] [CrossRef] [Green Version]
- Neves, R.M. Recent studies on modified cellulose/nanocellulose epoxy composites: A systematic review. Carbohydr. Polym. 2021, 255, 117366. [Google Scholar] [CrossRef] [PubMed]
- Xie, Y.; Hill, C.A.S.; Xiao, Z.; Militz, H.; Mai, C. Silane coupling agents used for natural fiber/polymer composites: A review Composites Part A. Appl. Sci. Manuf. 2010, 41, 806–819. [Google Scholar] [CrossRef]
- Le Hoang, S.; Vu, C.M.; Pham, L.T.; Choi, H.J. Preparation and physical characteristics of epoxy resin/ bacterial cellulose biocomposites. Polym. Bull. 2018, 75, 2607–2625. [Google Scholar] [CrossRef]
- Neves, R.M.; Lopes, K.S.; Zimmermann, M.G.V.; Poletto, M.; Zattera, A.J. Cellulose nanowhiskers extracted from tempo-oxidized curaua fibers. J. Nat. Fibers 2019, 90, 1355–1365. [Google Scholar]
- Isogai, A.; Saito, T.; Fukuzumi, H. TEMPO-oxidized cellulose nanofibers. Nanoscale 2011, 3, 71–85. [Google Scholar] [CrossRef]
- Abraham, E.; Kam, D.; Nevo, Y.; Slattegard, R.; Rivkin, A.; Lapidot, S.; Shoseyov, O. Highly modified cellulose nanocrystals and formation of epoxy-nanocrystalline cellulose (CNC) nanocomposites. ACS Appl. Mater. Interfaces 2016, 8, 28086–28095. [Google Scholar] [CrossRef]
- Luo, Q.; Li, Y.; Ren, L.; Xu, X.; Lu, S. Hyperbranched liquid crystals modified with sisal cellulose fibers for reinforcement of epoxy composites. Polymers 2018, 10, 1024. [Google Scholar] [CrossRef] [PubMed] [Green Version]
- Ansari, F.; Galland, S. Cellulose nanofiber network for moisture, strong and ductile biocomposites and increased epoxy curing rate. Compos. Part A 2014, 63, 35–44. [Google Scholar] [CrossRef] [Green Version]
- Lu, J.; Askeland, P.; Drzal, L.T. Surface modification of microfibrillated cellulose for epoxy composite applications. Polymer 2008, 49, 1285–1296. [Google Scholar] [CrossRef]
- Barari, B.; Ellingham, T.K.; Pillai, K.; El-Hajjar, R.; Qamhia, I.; Sabo, R. Mechanical characterization of scalable cellulose nano-fiber basedcomposites made using liquid composite molding process. Compos. Part B 2016, 84, 277–284. [Google Scholar] [CrossRef]
- Shibata, M.; Nakai, K. Preparation and properties of biocomposites composed of bio-based epoxy resin, tannic acid, and microfibrillated cellulose. Physics 2010, 48, 425–433. [Google Scholar] [CrossRef]
- Guzman, T.; Silard, J. Chemically extracted nanocellulose from sisal fibres by a simple and inustrially relevant proces. Cellulose 2017, 24, 107. [Google Scholar]
- PN-EN ISO 179-1:2010. Plastics–Determination of Charpy Impact Properties–Part 1: Non-Instrumented Impact Test; PKN: Warsaw, Poland, 2010. [Google Scholar]
- Roszowska, M.; Masiewicz, J. Właściwości wytrzymałościowe żywicy epoksydowej zmodyfikowanej termoplastami. Przetwórstwo Tworzyw 2018, 24, 45–51. [Google Scholar]
- Bakar, M.; Kostrzewa, M. Effect of Glass Beads and Polyurethane on the Fracture Properties of Epoxy Resin. J. Thermoplast. Compos. Mater. 2009, 22, 749–764. [Google Scholar] [CrossRef]
- PN-EN ISO 178:2019-06. Plastics–Determination of Flexural Properties; PKN: Warsaw, Poland, 2019. [Google Scholar]
- Szymańska, J.; Kostrzewa, M.; Bakar, M. Study on the adhesive properties of reactive liqid rubber toughened epoxy-clay hybrid nanocpomposites. J. Polym. Eng. 2017, 38, 231–238. [Google Scholar] [CrossRef]
- Kostrzewa, M.; Bakar, M.; Hausnerova, B. Preparation and Property Evaluation of Nanocomposities Based on Polyurethane-Modified Epoxy/Montmorillonite Systems. Adv. Polym. Technol. 2010, 29, 237–248. [Google Scholar]
- Chu, Y. Dispersion Properties of Nanocellulose: A Review. Carbohydr. Polym. 2020, 250, 116892. [Google Scholar] [CrossRef] [PubMed]
- Wetzel, B. Epoxy nanocomposites–fracture and toughening mechanisms. Eng. Fract. Mech. 2006, 73, 2375–2398. [Google Scholar] [CrossRef]
- Fu, S.-Y. Effects of particle size, particle/matrix interface adhesion and particle loading on mechanical properties of particulate–polymer composites. Compos. Part B 2008, 39, 933–961. [Google Scholar] [CrossRef]


| Material | Description |
|---|---|
| Epoxy resin | Low-molecular-weight epoxy resin Epidian 5, Bisphenol A diglycidyl ether, Viscosity at 25 °C: 20,000–30,000 mPa∙s Epoxide equivalent weight: 196–208 g/mol Epoxide number: 0.480–0.510 mol/100 g Density at 20 °C: 1.17 g/cm3 |
| Hardener | Z1 (triethylenetetramine) |
| Lignin | Thinly pressed cellulose sheets |
| Sodium hydroxide | Molecular weight: 40 g/mol Characteristics: white granules |
| 99.5% acetic acid | Molecular weight: 60 g/mol Characteristics: High concentration solution |
| 65% nitric acid (V) | Molecular weight: 63 g/mol Characteristics: Colorless solution |
| Sodium chlorate (V) | Molecular weight: 106 g/mol Characteristics: white powder |
| Acetone | Molecular weight: 58 g/mol Characteristics: liquid |
| Reagent | Volume (mL) | Number of Moles |
|---|---|---|
| Sodium hydroxide (2% water solution) | 1500 | 0.75 |
| Sodium hydroxide (10% water solution) | 4500 | 11.25 |
| Acetic acid, pure 95.5% | 956 | 16.65 |
| Nitric acid (V), pure 65% | 150 | 2.17 |
| Sodium chlorate (V) (25% water solution) | 280 | 0.79 |
| Acetone, pure 99.5% | 238.6 | 2.03 |
| Composition | Epoxy Resin Epidian 5 (g) | Hardener (g) | Nanocellulose (g) |
|---|---|---|---|
| Ep 0 | 89.3 | 10.7 | 0 |
| Ep + 0.5% NC | 88.8 | 10.7 | 0.5 |
| Ep + 1% NC | 88.4 | 10.6 | 1 |
| Ep + 1.5% NC | 88.0 | 10.5 | 1.5 |
| Composites | Impact Strength (kJ/m2) | Kc (MPa∙m1/2) |
|---|---|---|
| Ep 0 | 0.9 | 1.5 |
| Ep + 0.5% NC | 1.7 | 2.6 |
| Ep +1% NC | 1.5 | 2.5 |
| Ep + 1.5% NC | 1.9 | 2.3 |
| Weight Loss [%] | Degradation Temperature [°C] | ||
|---|---|---|---|
| EP 0 | EP + 0.5% NC | EP + 1% NC | |
| 2 | 333.2 | 317.8 | 235.3 |
| 5 | 342.1 | 340.0 | 333.2 |
| 10 | 349.0 | 349.7 | 347.5 |
| 50 | 381.7 | 382.7 | 382.2 |
Publisher’s Note: MDPI stays neutral with regard to jurisdictional claims in published maps and institutional affiliations. |
© 2021 by the authors. Licensee MDPI, Basel, Switzerland. This article is an open access article distributed under the terms and conditions of the Creative Commons Attribution (CC BY) license (https://creativecommons.org/licenses/by/4.0/).
Share and Cite
Roszowska-Jarosz, M.; Masiewicz, J.; Kostrzewa, M.; Kucharczyk, W.; Żurowski, W.; Kucińska-Lipka, J.; Przybyłek, P. Mechanical Properties of Bio-Composites Based on Epoxy Resin and Nanocellulose Fibres. Materials 2021, 14, 3576. https://doi.org/10.3390/ma14133576
Roszowska-Jarosz M, Masiewicz J, Kostrzewa M, Kucharczyk W, Żurowski W, Kucińska-Lipka J, Przybyłek P. Mechanical Properties of Bio-Composites Based on Epoxy Resin and Nanocellulose Fibres. Materials. 2021; 14(13):3576. https://doi.org/10.3390/ma14133576
Chicago/Turabian StyleRoszowska-Jarosz, Martyna, Joanna Masiewicz, Marcin Kostrzewa, Wojciech Kucharczyk, Wojciech Żurowski, Justyna Kucińska-Lipka, and Paweł Przybyłek. 2021. "Mechanical Properties of Bio-Composites Based on Epoxy Resin and Nanocellulose Fibres" Materials 14, no. 13: 3576. https://doi.org/10.3390/ma14133576