
Mechanical and Chemical Characterisation of TiN and AlTiSiN Coatings on a LPBF Processed IN718 Substrate

 ,
,  , ,
, , 

Abstract
:1. Introduction
2. Materials and Methods
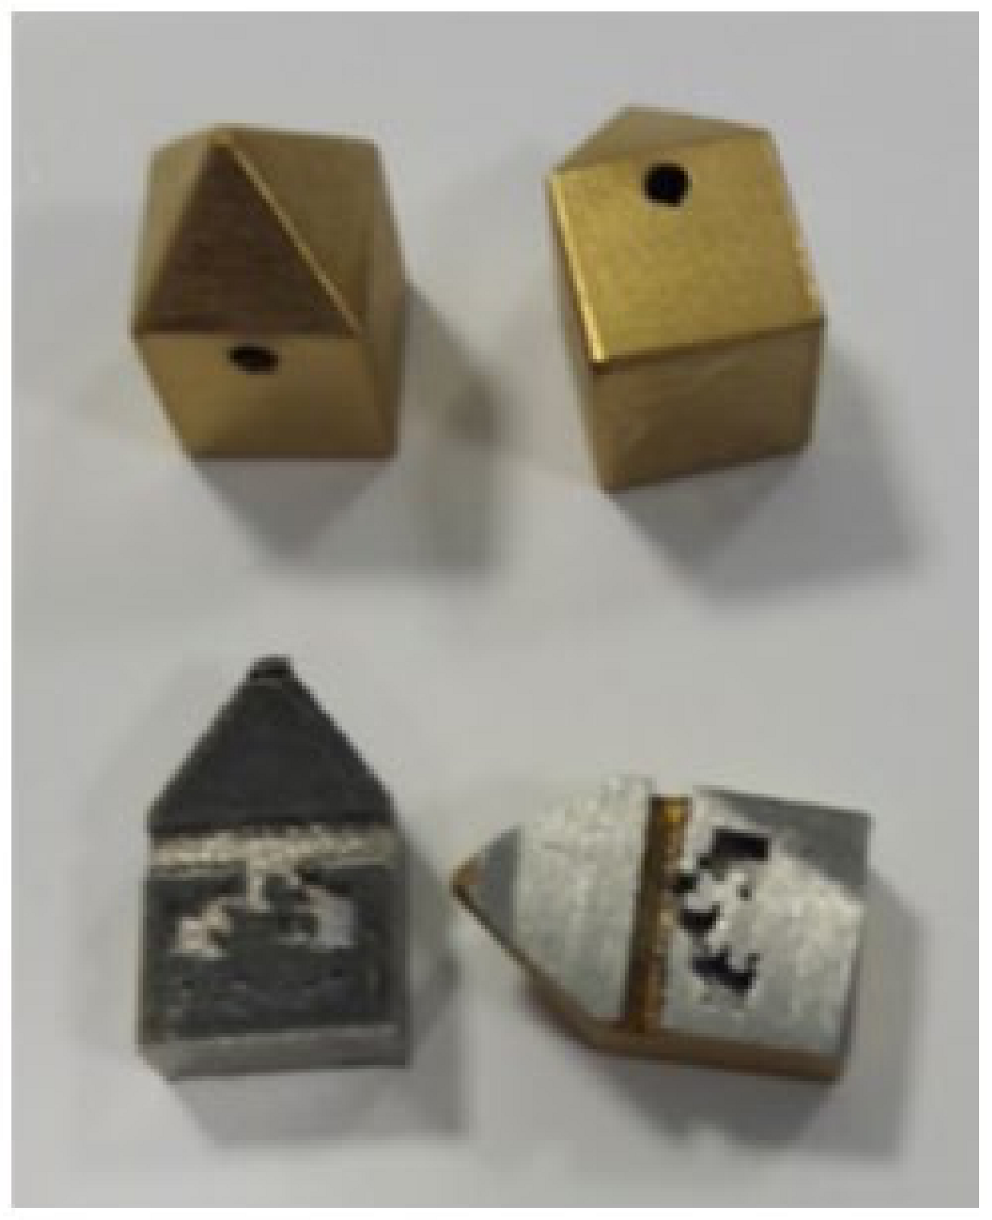
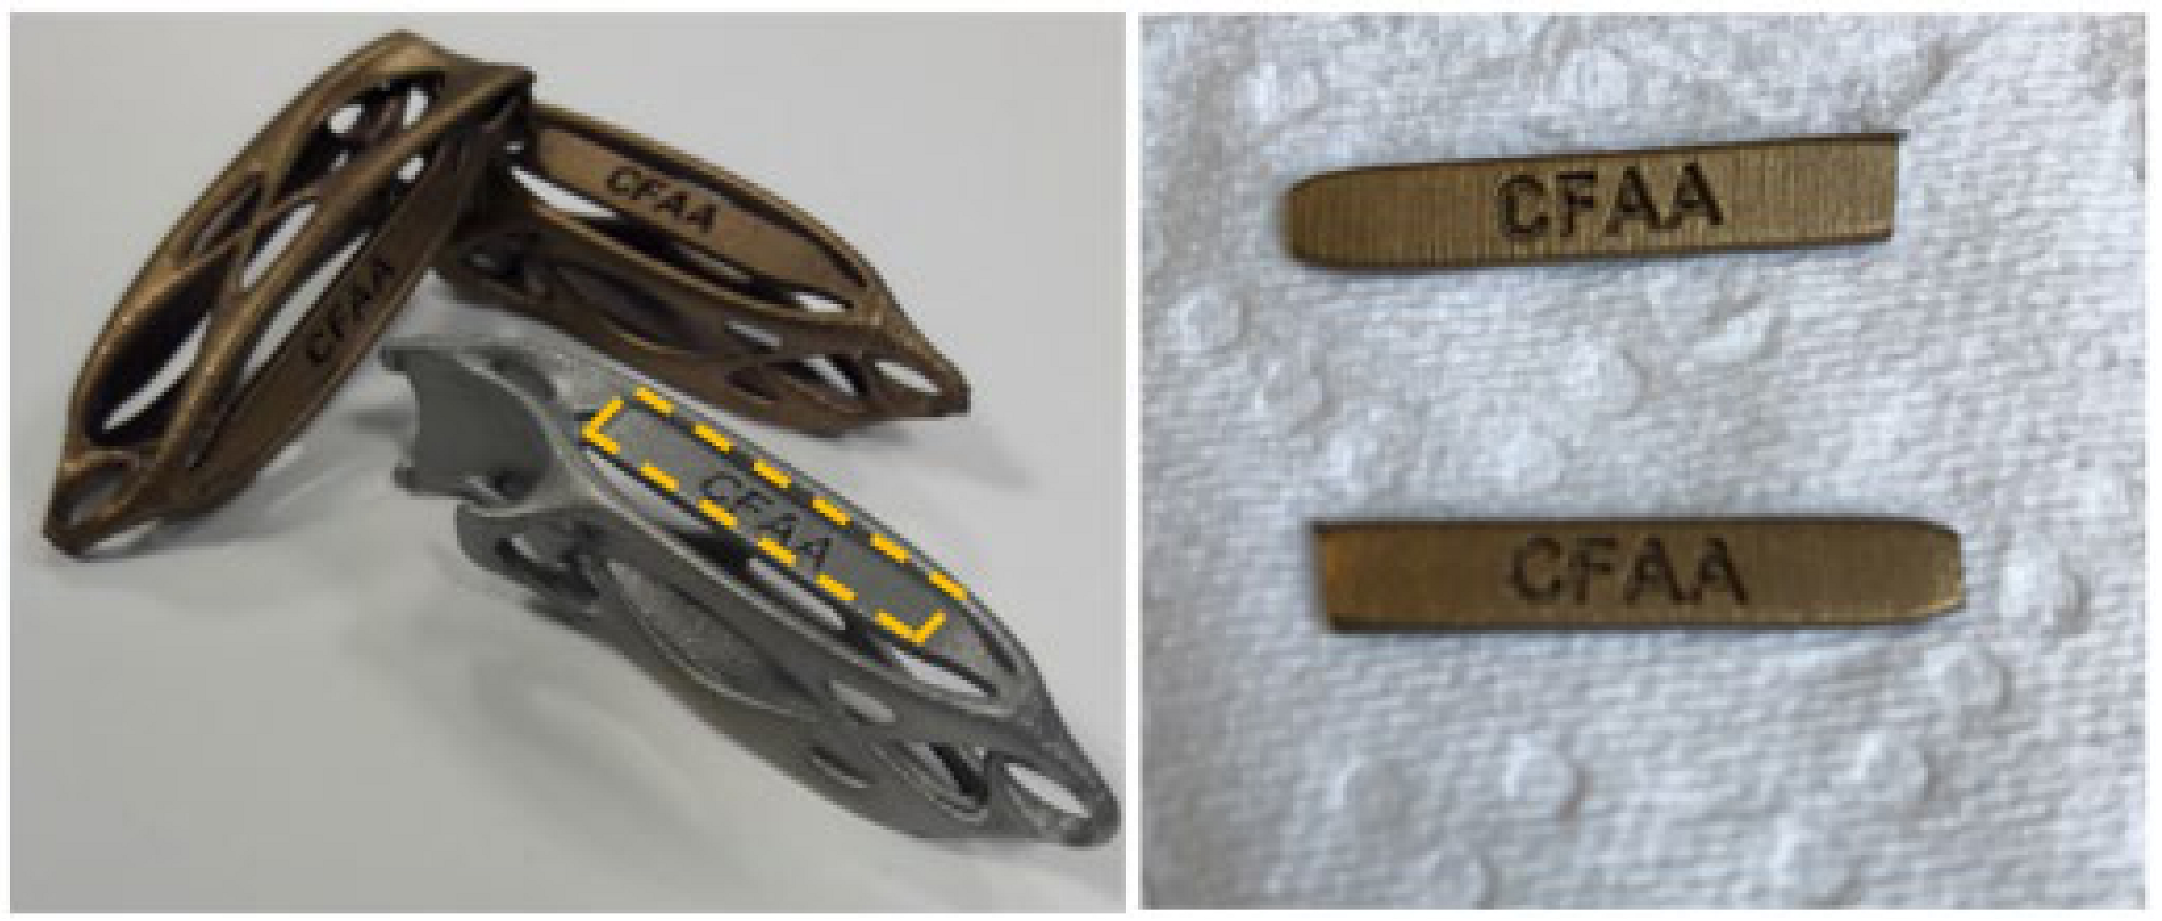
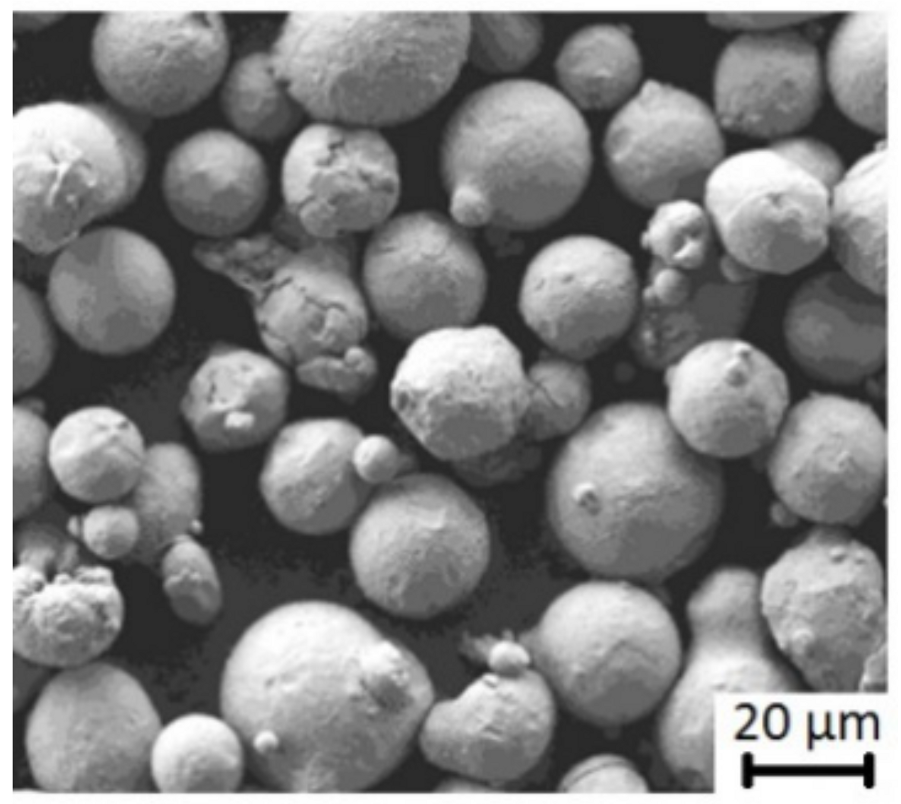
2.1. Materials and LPBF Samples
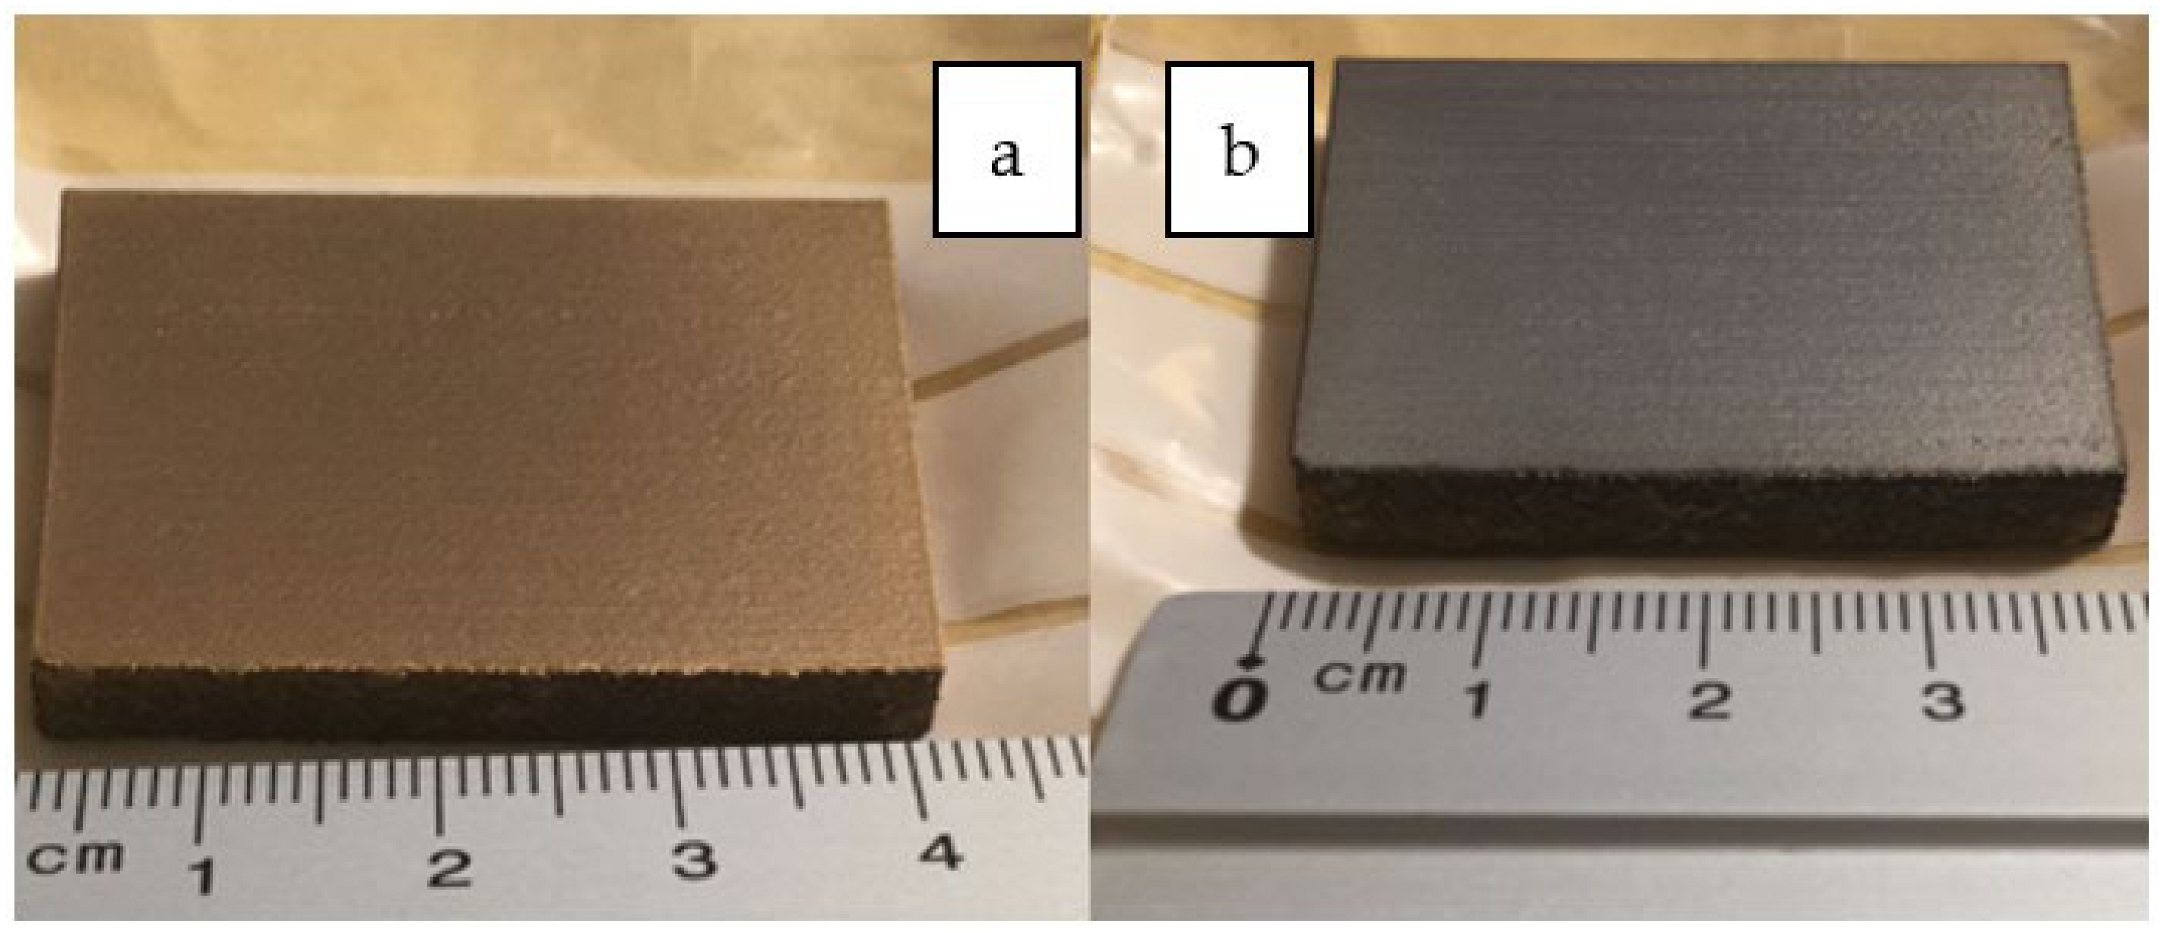
2.2. Coating Process of Samples
2.3. Methods
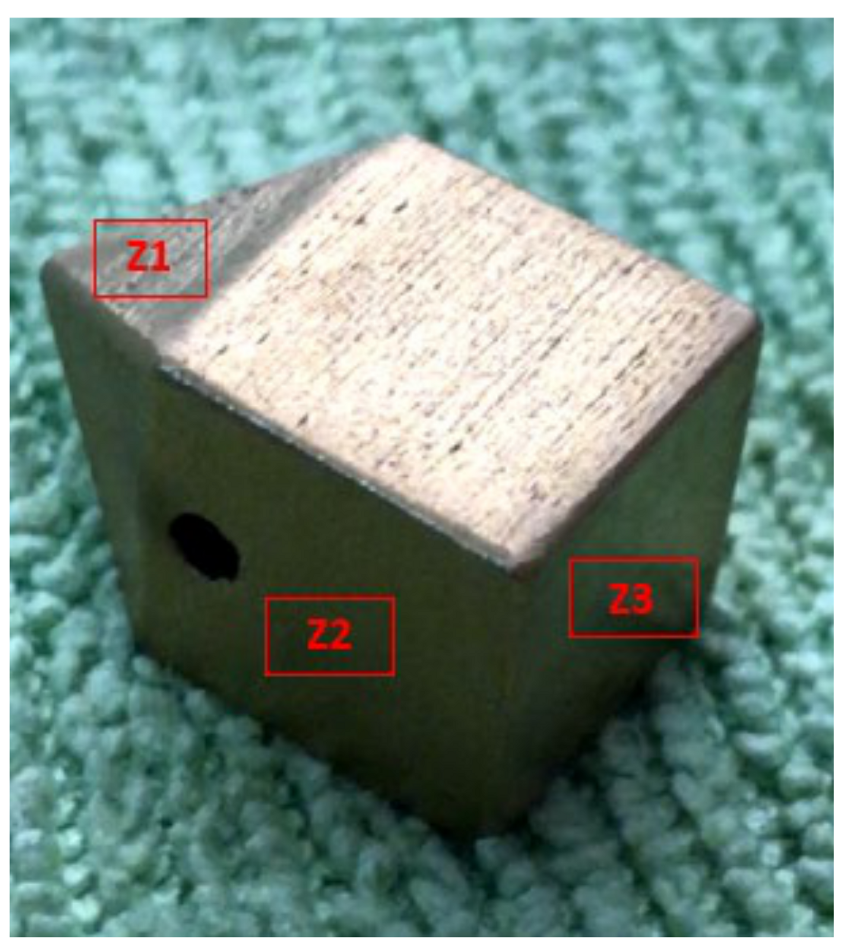
2.3.1. Microhardness
2.3.2. Thickness
2.3.3. Roughness
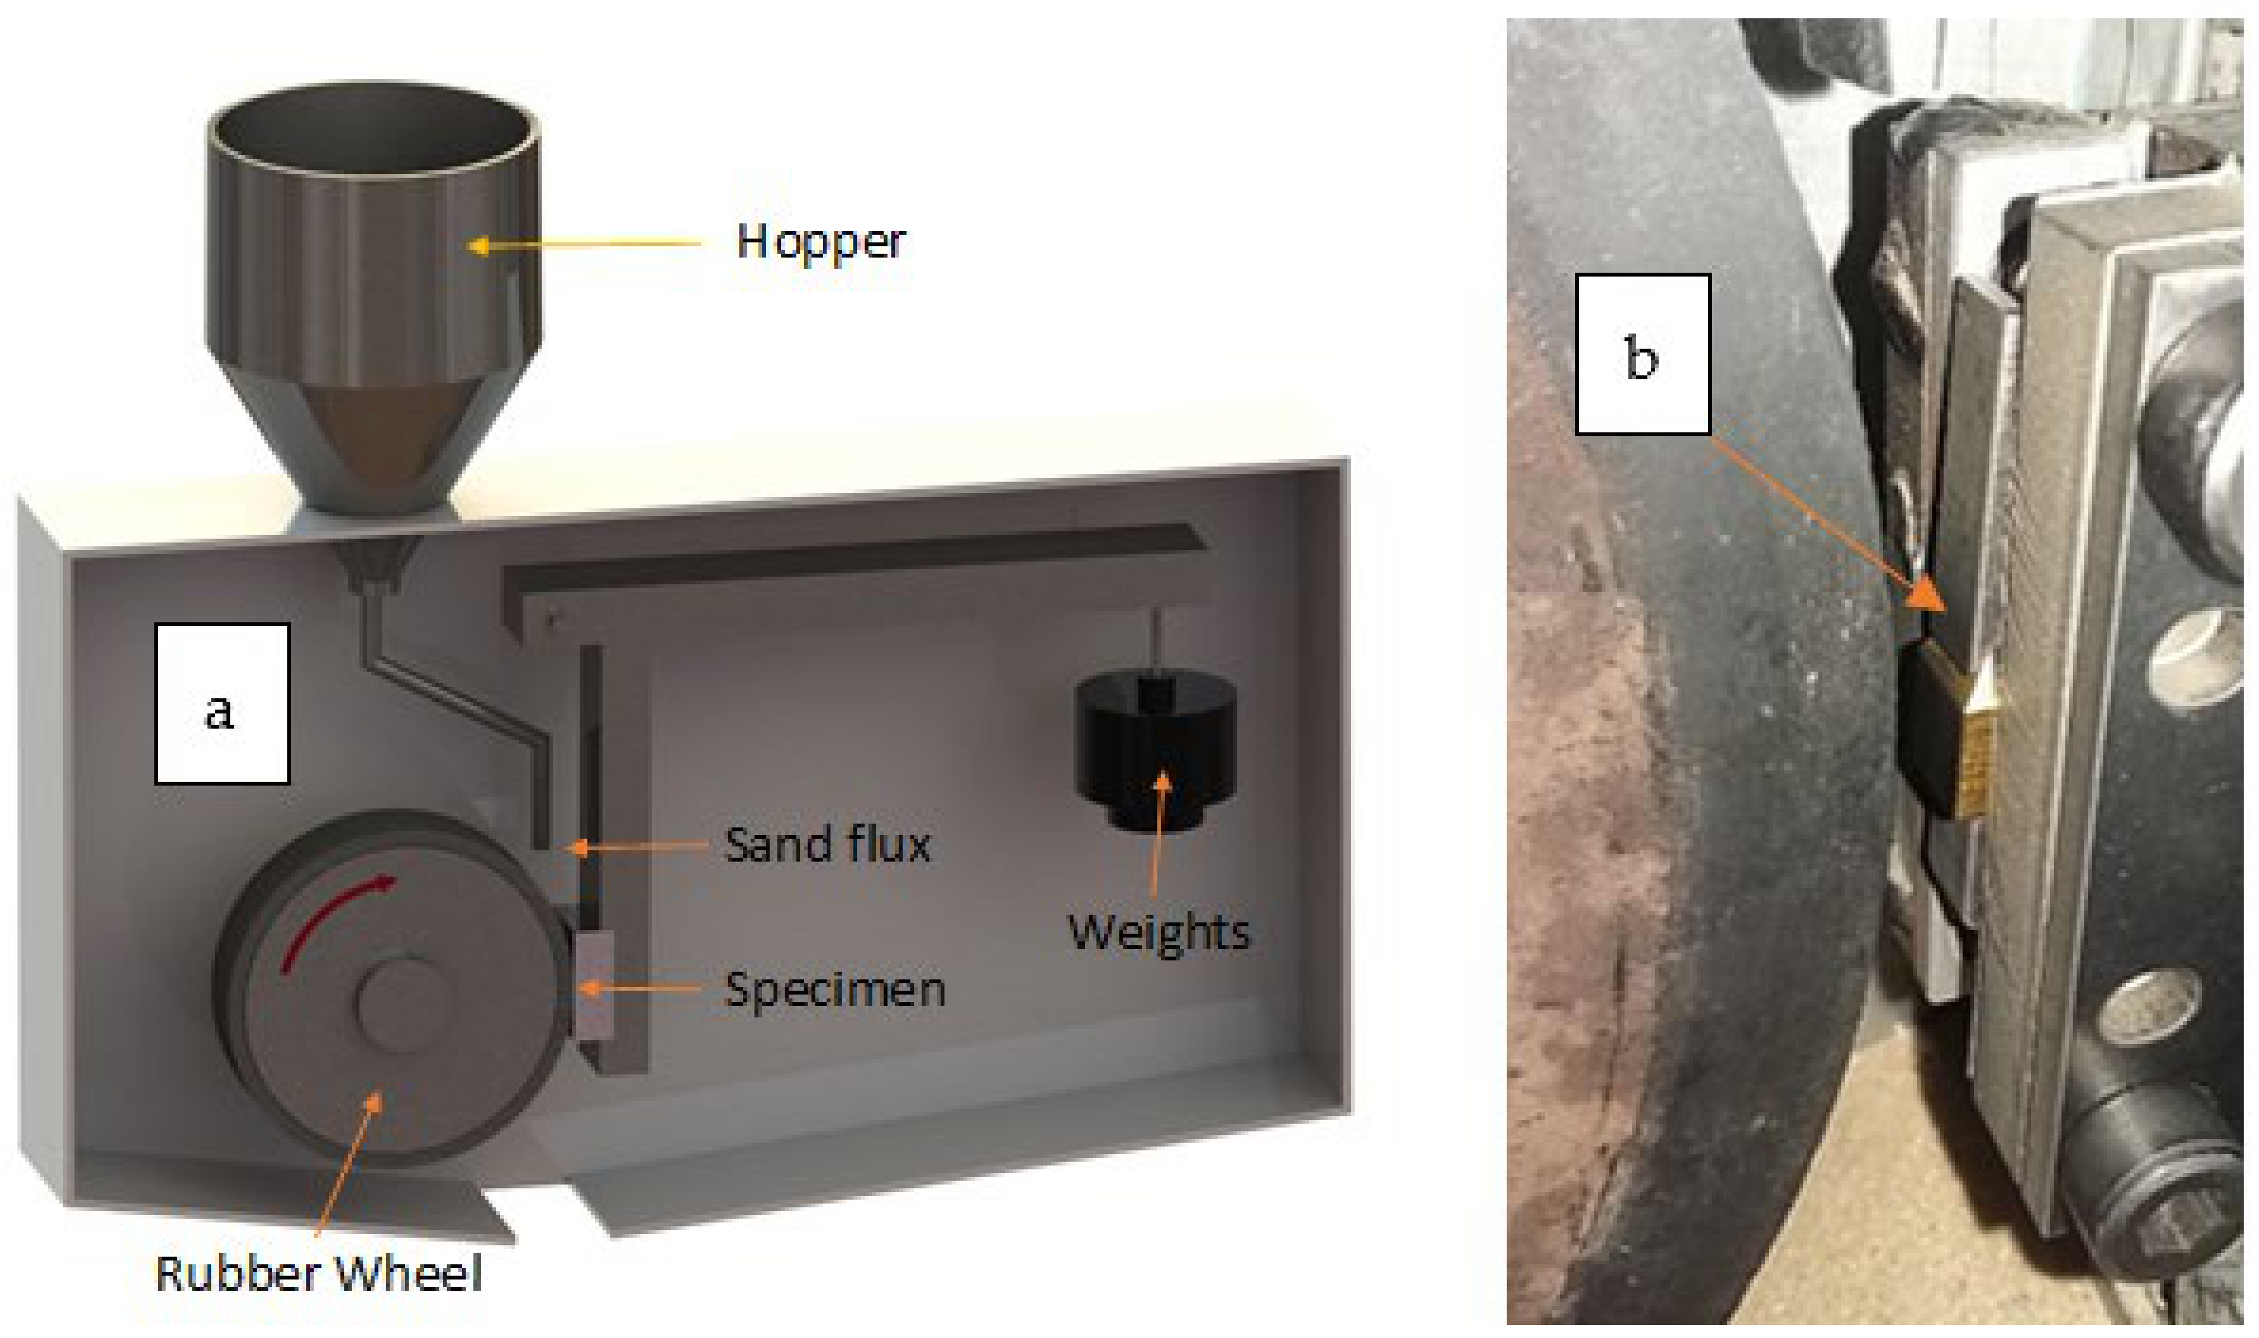
2.3.4. Wear
3. Results and Discussion
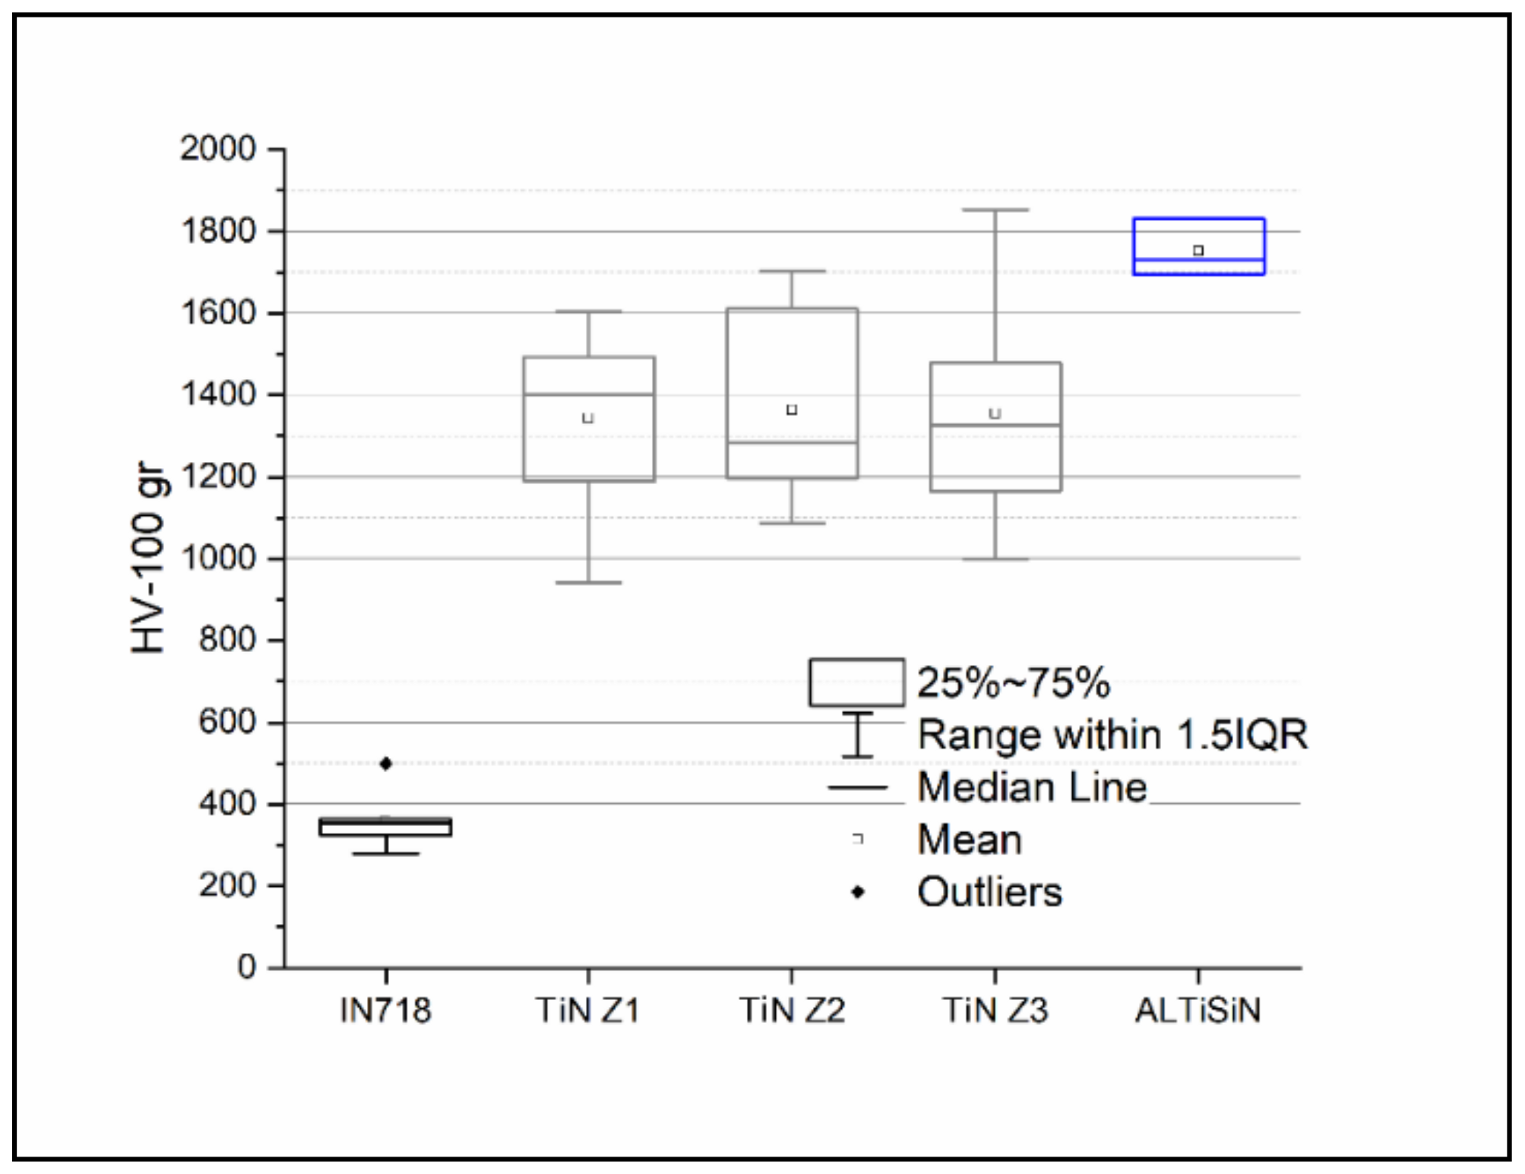
3.1. Microhardness
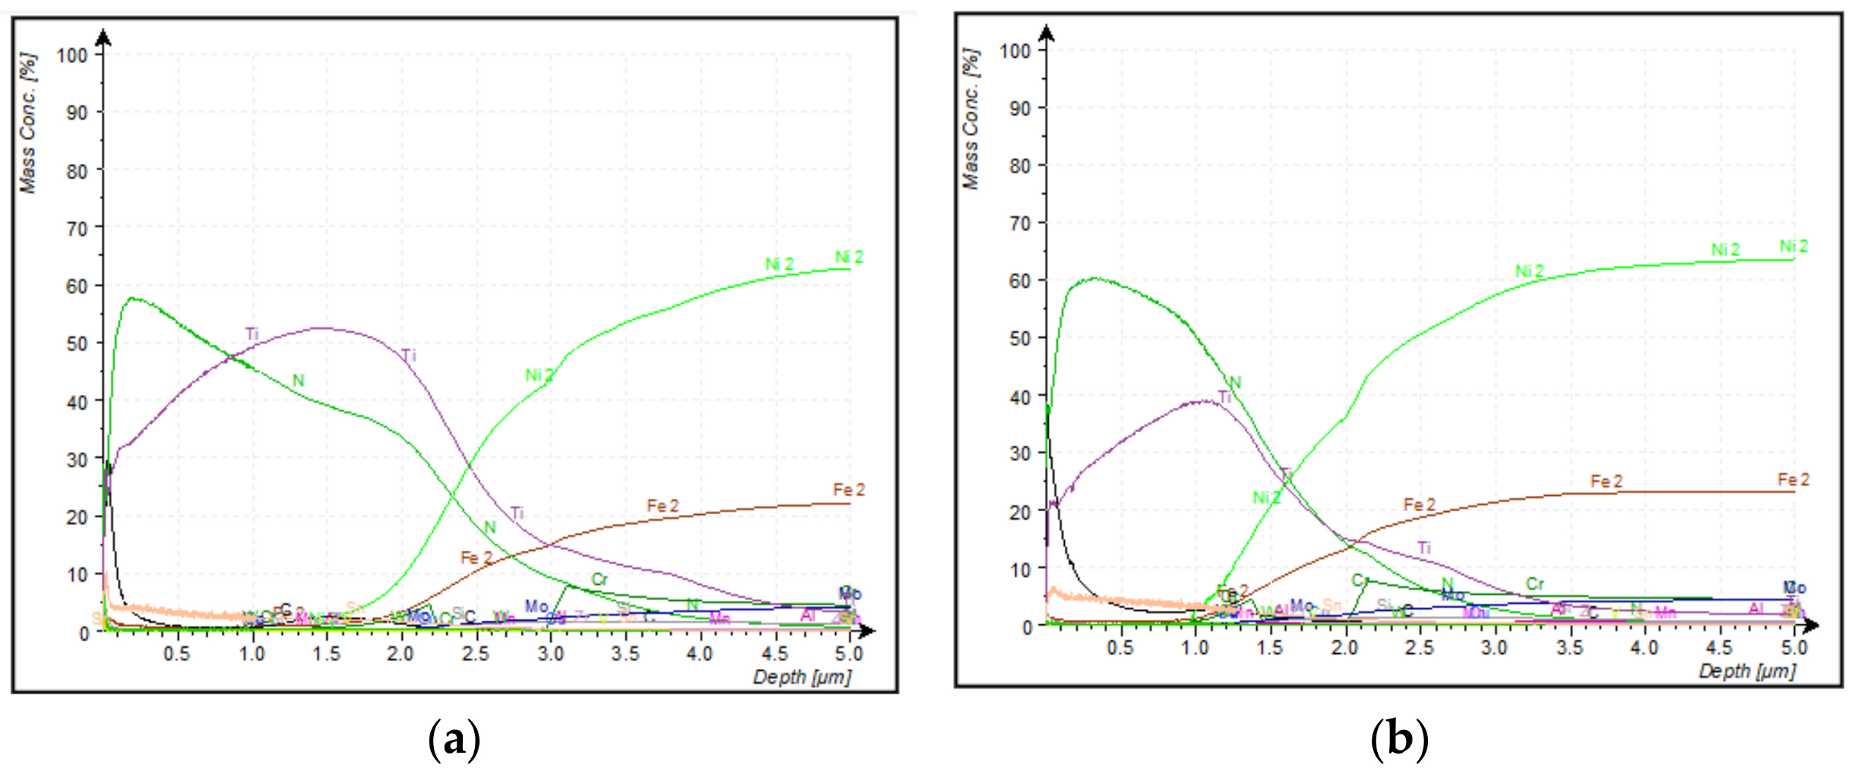
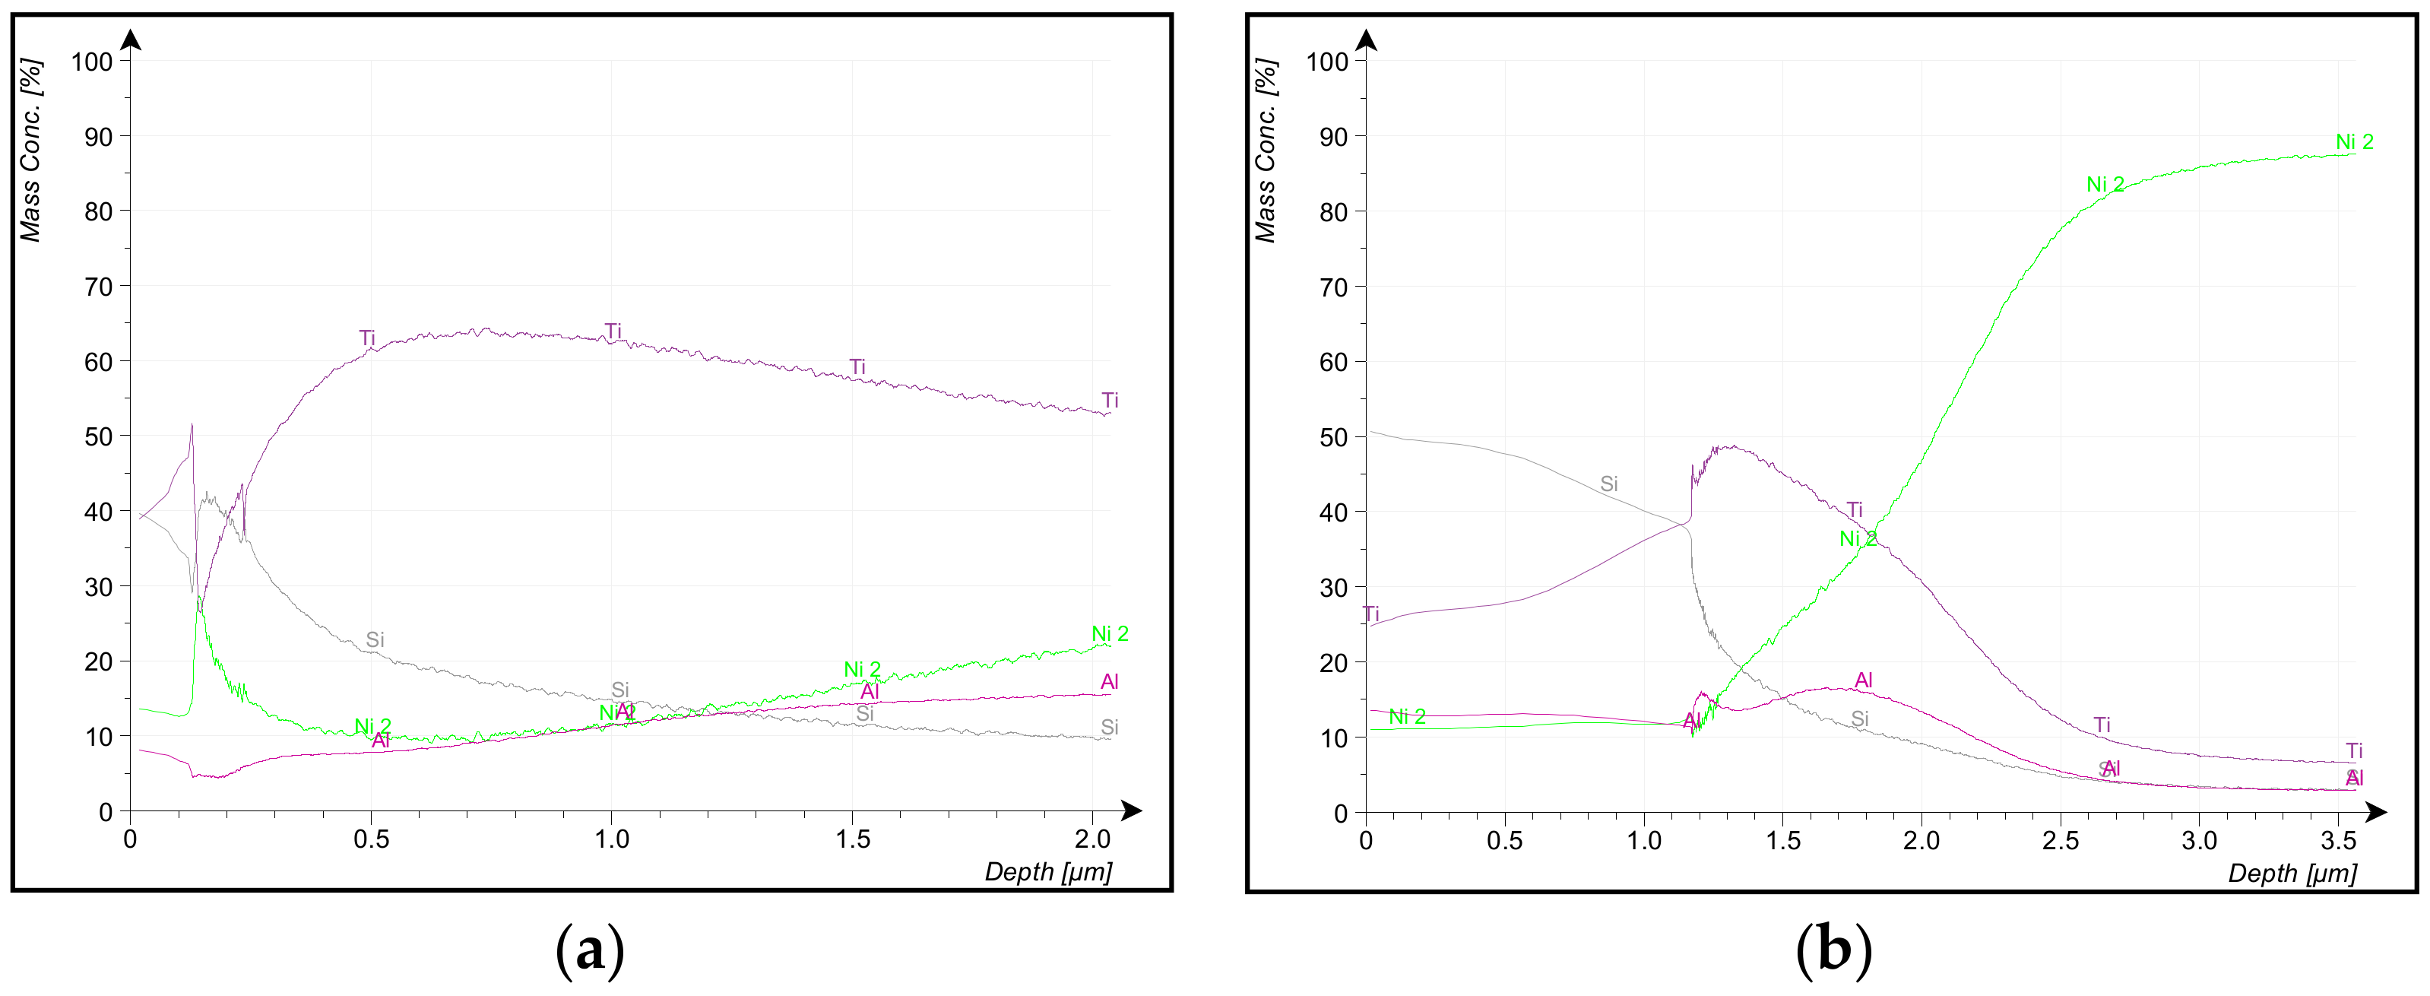
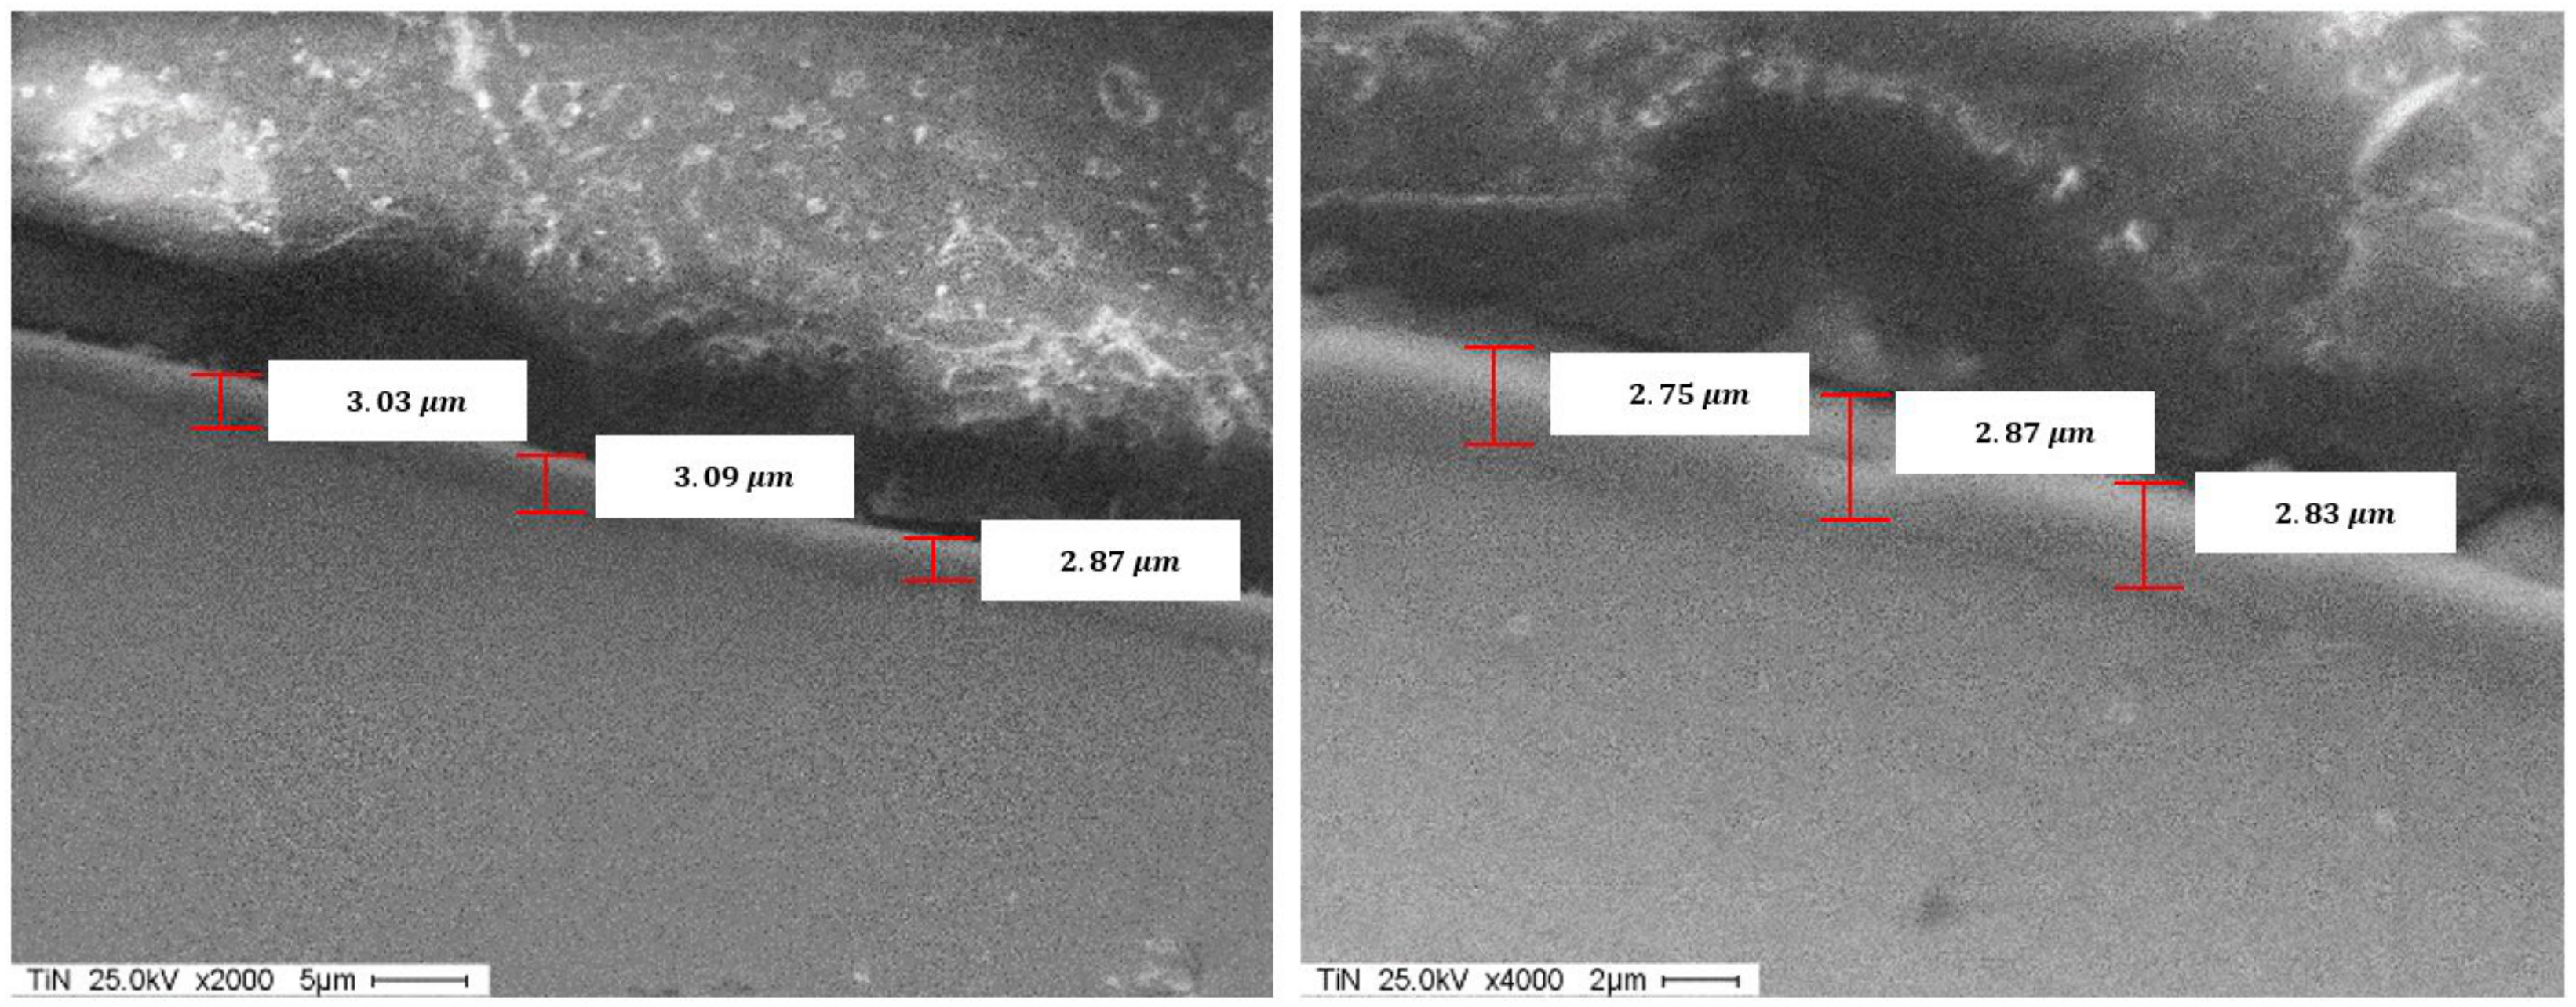
3.2. Thickness
3.3. Roughness
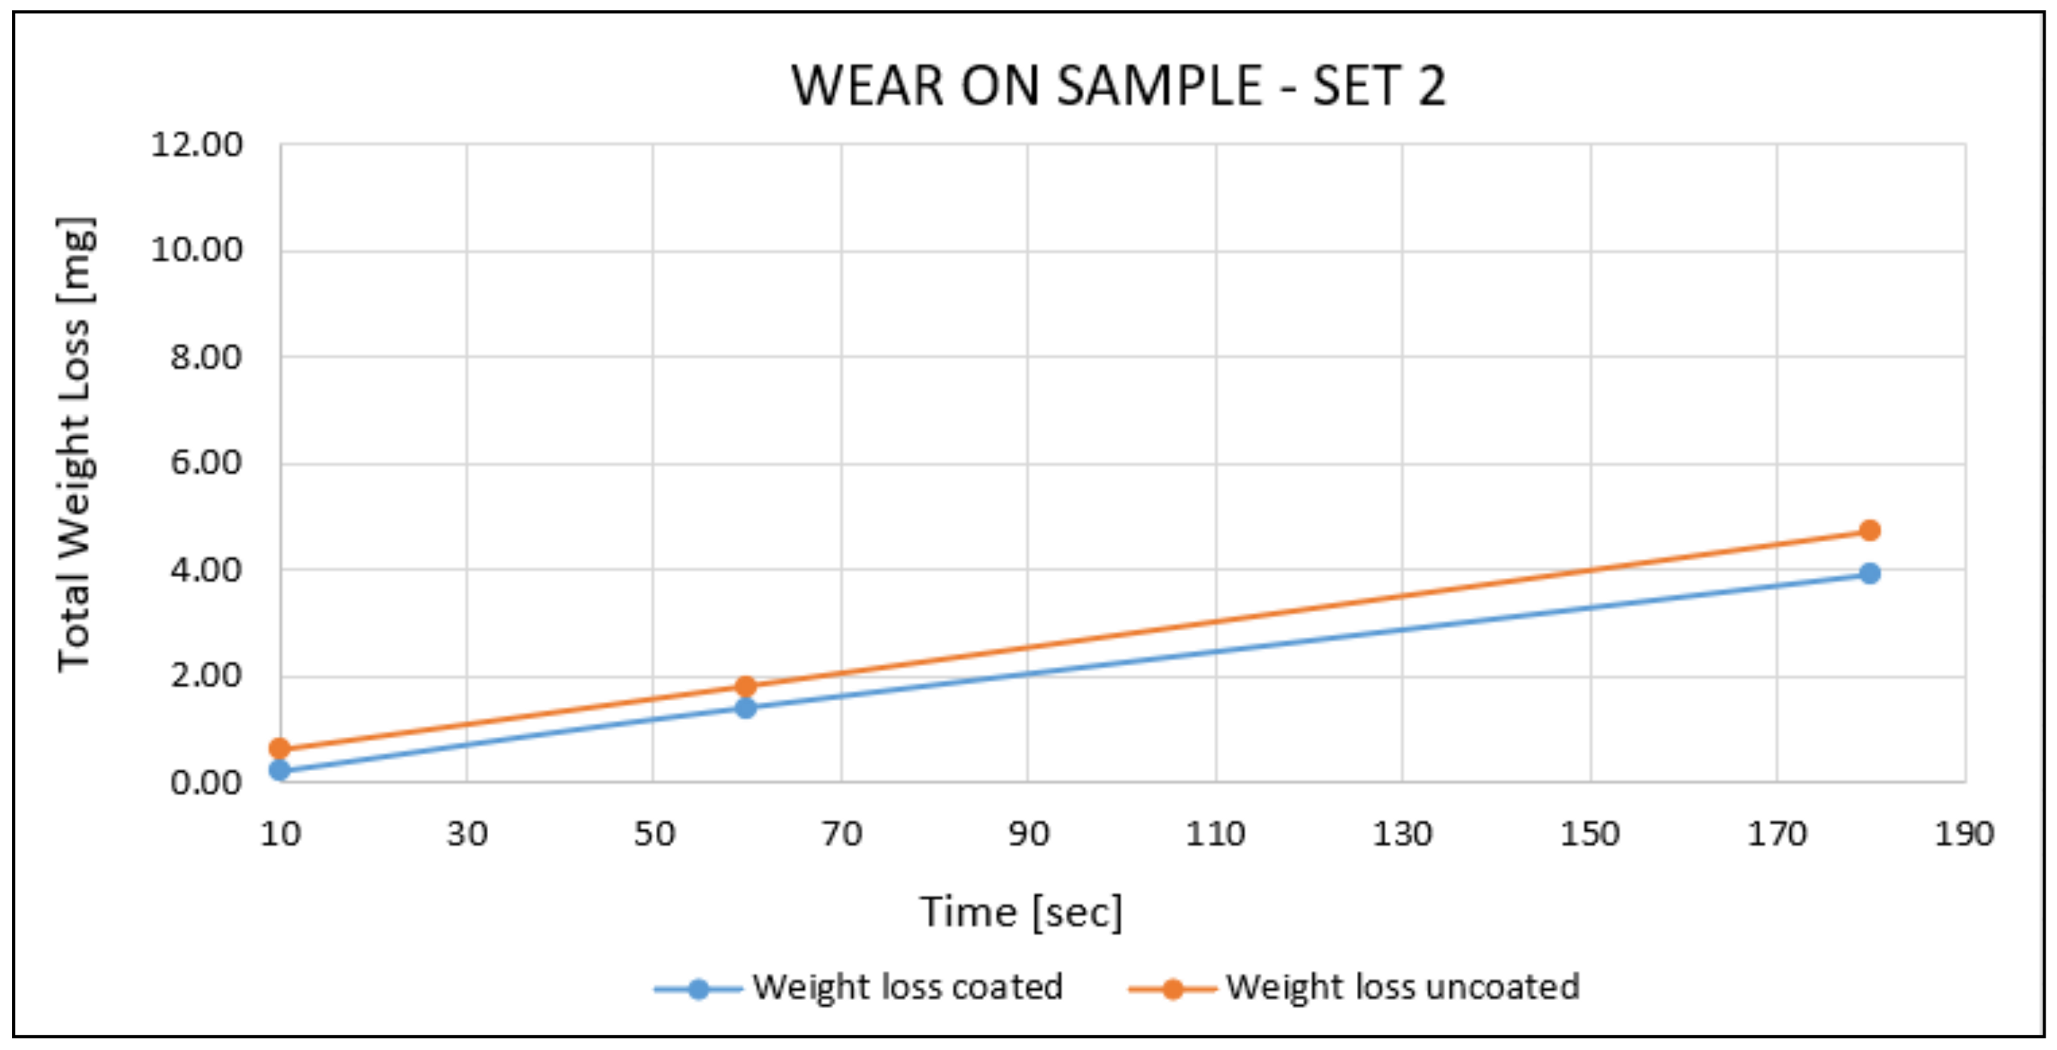
3.4. Wear
4. Conclusions
- The measured microhardness value on AlTiSiN and TiN was higher than the one of the substrate materials. Among them, the Vickers microhardness of the former is higher than the one of the latter. The microhardness measurement method is comparative.
- In the wear study, AlTiSiN showed better wear resistance as compared to TiN. By evaluating the same test-time values of both coatings with the rubber wheel (10 s, 60 s, and 180 s), there was found less relative weight loss in AlTiSiN by considering its respective weight loss of substrate material. The lower the relative weight loss, the better the mechanical adhesion of the coating to the substrate material.
- The roughness of AlTiSiN was found to be higher than the one of TiN. From the DPA results of the former, titanium accumulation was found to be present, so it may negatively affect the final quality of the surface and make it rougher.
- The thickness measurement results of both coatings were in good agreement by using two different measurement techniques. The thickness value of AlTiSiN was found to be smaller than the one of TiN. Despite this, its wear resistance was found to be better, as mentioned above.
Author Contributions
Funding
Institutional Review Board Statement
Informed Consent Statement
Data Availability Statement
Acknowledgments
Conflicts of Interest
References
- Mellor, B. Surface Coatings for Protection against Wear; Taylor & Francis: London, UK, 2006. [Google Scholar]
- Zhang, S.; Zhu, W. TiN coating of tool steels: A review. J. Mater. Process. Technol. 1993, 39, 165–177. [Google Scholar] [CrossRef]
- Santecchia, E.; Hamouda, A.M.; Musharavati, F.; Zalnezhad, E.; Cabibbo, M.; Spigarelli, S. Wear resistance investigation of titanium nitride-based coatings. Ceram. Int. 2015, 41, 10349–10379. [Google Scholar] [CrossRef]
- Dalibón, E.L.; Pecina, J.N.; Moscatelli, M.N.; Ramos, M.A.R.; Trava-Airoldi, V.J.; Brühl, S.P. Mechanical and Corrosion Behaviour of DLC and TiN Coatings Deposited on Martensitic Stainless Steel. J. Bio- Tribo-Corros. 2019, 5, 34. [Google Scholar] [CrossRef]
- Mesquita, R.A.; Barbosa, C.A. Desenvolvimento de aço com usinabilidade melhorada e aços endurecíveis por precipitação para moldes de plástico. Tecnol. Metal. Mater. Min. 2005, 1, 11–15. [Google Scholar] [CrossRef]
- García, J.; Ciprés, V.C.; Blomqvist, A.; Kaplan, B. Cemented carbide microstructures: A review. Int. J. Refract. Met. Hard Mater. 2019, 80, 40–68. [Google Scholar] [CrossRef]
- Tracton, A. Coatings Materials and Surface Coatings; CRC Press: Boca Raton, FL, USA, 2006. [Google Scholar]
- Da Silva, F.C.; Tunes, M.A.; Sagás, J.C.; Schön, C.G. Influence of substrate stiffness and of PVD parameters on the microstructure and tension fracture characteristics of TiN thin films. Procedia Struct. Integr. 2018, 13, 658–663. [Google Scholar] [CrossRef]
- Fage, S.W.; Faurschou, A.; Thyssen, J.P. Copper hypersensitivity. Contact Dermat. 2014, 71, 191–201. [Google Scholar] [CrossRef] [PubMed]
- Java, K.; Dodd, M. Allergic reaction to Nickel and Titanium In patients with TMJ replacements: 2 case reports. Br. J. Oral Maxillofac. Surg. 2019, 57, e70. [Google Scholar] [CrossRef]
- Grainger, S.; Blunt, J. Engineering Coatings Design and Application; Woodhead Publishing: Sawston, UK, 1998. [Google Scholar]
- Shaw, M.C.; Cookson, J. Metal cutting principles. Tribol. Int. 1985, 18, 55. [Google Scholar] [CrossRef] [Green Version]
- Othman, M.; Bushroa, A.; Abdullah, W.N.R. Evaluation techniques and improvements of adhesion strength for TiN coating in tool applications: A review. J. Adhes. Sci. Technol. 2015, 29, 569–591. [Google Scholar] [CrossRef]
- Calleja, A.; Urbikain, G.; González, H.; Cerrillo, I.; Polvorosa, R.; Lamikiz, A. Inconel®718 superalloy machinability evaluation after laser cladding additive manufacturing process. Int. J. Adv. Manuf. Technol. 2018, 97, 2873–2885. [Google Scholar] [CrossRef]
- Xu, J.; Sun, J.; Jiang, S. Mechanical properties of sputter-deposited nanocrystalline Cr3Si film. Mater. Lett. 2009, 63, 1082–1084. [Google Scholar] [CrossRef]
- Liu, L.; Xu, J.; Xie, Z.-H.; Munroe, P. The roles of passive layers in regulating the electrochemical behavior of Ti5Si3-based nanocomposite films. J. Mater. Chem. A 2013, 1, 2064–2078. [Google Scholar] [CrossRef]
- Ohring, M. The Materials Science of Thin Films; Academic Press: San Diego, CA, USA, 1992. [Google Scholar]
- Polvorosa, R.; de Lacalle, L.N.L.; Egea, A.J.S.; Fernandez, A.; Esparta, M.; Zamakona, I. Cutting edge control by monitoring the tapping torque of new and resharpened tapping tools in Inconel 718. Int. J. Adv. Manuf. Technol. 2020, 106, 3799–3808. [Google Scholar] [CrossRef]
- Xia, F.; Li, Q.; Ma, C.; Liu, W.; Ma, Z. Preparation and wear properties of Ni/TiN–SiC nanocoatings obtained by pulse current electrodeposition. Ceram. Int. 2020, 46, 7961–7969. [Google Scholar] [CrossRef]
- Nguyen, Q.B.; Nai, M.L.S.; Zhu, Z.; Sun, C.-N.; Wei, J.; Zhou, W. Characteristics of Inconel Powders for Powder-Bed Additive Manufacturing. Engineering 2017, 3, 695–700. [Google Scholar] [CrossRef]
- Wang, Z.; Guan, K.; Gao, M.; Li, X.; Chen, X.; Zeng, X. The microstructure and mechanical properties of deposited-IN718 by selective laser melting. J. Alloy. Compd. 2012, 513, 518–523. [Google Scholar] [CrossRef]
- Min-Chieh, C.; Ming-Der, G.; Shih-Tsung, K.; Ya-Ru, H.; Shinn-Tyan, W. The Ni–P–SiC composite produced by electro-codeposition. Mater. Chem. Phys. 2005, 92, 146–151. [Google Scholar]
- Aslayan, I.R.; Bonino, J.-P.; Celis, J.-P. Effect of submicron SiC particles on the wear of electrolytic NiP coatings Part 1. Uni-directional sliding. Surf. Coat. Tech. 2006, 200, 2909–2916. [Google Scholar] [CrossRef]
- Sendino, S.; Martinez, S.; Lamikiz, A. Characterisation of IN718 recycling powder and its effect on LPBF manufactured parts. Procedia CIRP 2020, 94, 227–232. [Google Scholar] [CrossRef]
- Zervas, M.N. High power ytterbium-doped fiber lasers—Fundamentals and applications. Int. J. Mod. Phys. B 2014, 28, 1442009. [Google Scholar] [CrossRef] [Green Version]
- Kleszczynski, S.; Ladewig, A.; Friedberger, K.; Zur Jacobsmühlen, J.; Merhof, D.; Witt, G. Position dependency of surface roughness in parts from laser beam melting systems. In Proceedings of the 26th Internation Solid Free Form Fabrication (SFF) Symposium, Austin, TX, USA, 10–12 August 2015. [Google Scholar]
- Garcia, J.; Pitonak, R. The role of cemented carbide functionally graded outer-layers on the wear performance of coated cutting tools. Int. J. Refract. Met. Hard Mater. 2013, 36, 52–59. [Google Scholar] [CrossRef]
- Doering, A.; Danks, D.; Mahmoud, S.; Scott, J. Evaluation of ASTM G65 abrasive—Spanning 13 years of sand. Wear 2011, 271, 1252–1257. [Google Scholar] [CrossRef]


| Fe | Ni | Mo | Ti | Nb | Cr | Al | C | Si | Co |
|---|---|---|---|---|---|---|---|---|---|
| Balance | 50–55 | 2.8–3–3 | 0.8–1.2 | 4.8–5-5 | 17–21 | 0.3–0.7 | 0.02–0.08 | 0.35–Max | 1.00–Max |
| Rubber Wheel Diameter (φRW) (mm) | Wheel Rotation (ω) (rpm) | Sand Flow (ϕs) (gr/min) |
|---|---|---|
| 230 | 200 | 360 ± 10 |
| Elements | Ni (%) | Fe (%) | Cr 2 (%) | Co (%) | Mo (%) | C (%) | Mn (%) | Si (%) | (P, S, Cu, Al, Ti, V, Nb, W) (%) |
|---|---|---|---|---|---|---|---|---|---|
| Test 1 | 48.86 | 18.61 | 22.33 | 0.28 | 3.43 | 0.21 | 0.07 | 0.10 | 6.11 |
| Test 2 | 50.66 | 18.24 | 20.81 | 0.27 | 3.48 | 0.15 | 0.08 | 0.10 | 6.21 |
| Test 3 | 51.66 | 17.99 | 19.96 | 0.27 | 3.55 | 0.05 | 0.08 | 0.09 | 6.34 |
| Average | 50.39 | 18.28 | 21.03 | 0.27 | 3.49 | 0.13 | 0.08 | 0.10 | 6.22 |
| E/T | Inner Face | Outer Face | ||
|---|---|---|---|---|
| Elements | Ti (%) | Si (%) | Ti (%) | Si (%) |
| Test 1 | 42.5 | 21.3 | 56.7 | 12.4 |
| Test 2 | 33.5 | 29.4 | 56.5 | 17.9 |
| AV | 38.0 | 25.4 | 56.6 | 15.2 |
| GDOES | SEM | |||||
|---|---|---|---|---|---|---|
| TiN|Z2 | TiN|Z3 | AlTiSiN|IF | AlTiSiN|OF | AV/σ | TiN | AlTiSiN |
| 2.5 µm | 1.5 µm | 1.2 µm | 1.0 µm | AV | 2.9 µm | 1.2 µm |
| σ | 0.1 | 0.1 | ||||
| U/C | Sample 1 [AlTiSiN]—Set 3 Rz DIN | Sample 2 [AlTiSiN]—Set 3 Rz DIN | Sample [TiN]—Set 2 Rz DIN | ||||||
|---|---|---|---|---|---|---|---|---|---|
 |  |  | |||||||
| AV | σ | COV | AV | σ | COV | AV | σ | COV | |
| Uncoated | 23.0 | 3.7 | 15.9 | 30.3 | 3.4 | 11.2 | - | ||
| Coated | 33.0 | 2.8 | 8.6 | 25.2 | 3.5 | 14.1 | 17.8 | 4.6 | 25.6 |
Publisher’s Note: MDPI stays neutral with regard to jurisdictional claims in published maps and institutional affiliations. |
© 2021 by the authors. Licensee MDPI, Basel, Switzerland. This article is an open access article distributed under the terms and conditions of the Creative Commons Attribution (CC BY) license (https://creativecommons.org/licenses/by/4.0/).
Share and Cite
Colombo-Pulgarín, J.C.; Sánchez Egea, A.J.; Celentano, D.J.; Krahmer, D.M.; Martynenko, V.; López de Lacalle, N. Mechanical and Chemical Characterisation of TiN and AlTiSiN Coatings on a LPBF Processed IN718 Substrate. Materials 2021, 14, 4626. https://doi.org/10.3390/ma14164626
Colombo-Pulgarín JC, Sánchez Egea AJ, Celentano DJ, Krahmer DM, Martynenko V, López de Lacalle N. Mechanical and Chemical Characterisation of TiN and AlTiSiN Coatings on a LPBF Processed IN718 Substrate. Materials. 2021; 14(16):4626. https://doi.org/10.3390/ma14164626
Chicago/Turabian StyleColombo-Pulgarín, Juan C., Antonio J. Sánchez Egea, Diego J. Celentano, Daniel Martínez Krahmer, Vitaliy Martynenko, and Norberto López de Lacalle. 2021. "Mechanical and Chemical Characterisation of TiN and AlTiSiN Coatings on a LPBF Processed IN718 Substrate" Materials 14, no. 16: 4626. https://doi.org/10.3390/ma14164626