
Estimation of Drag Finishing Abrasive Effect for Cutting Edge Preparation in Broaching Tool


1
Faculty of Civil and Mechanical Engineering, Universidad Técnica de Ambato, Ambato 180103, Ecuador
2
Aeronautics Advanced Manufacturing Centre (CFAA), University of the Basque Country (UPV/EHU), Parque Tecnológico de Bizkaia-Ed.202, 48170 Zamudio, Spain
3
Department of Mechanical Engineering, ESI Bilbao, University of the Basque Country, 48013 Bilbao, Spain
*
Author to whom correspondence should be addressed.
Materials 2022, 15(15), 5135; https://doi.org/10.3390/ma15155135
Submission received: 28 June 2022
/
Revised: 15 July 2022
/
Accepted: 21 July 2022
/
Published: 24 July 2022
(This article belongs to the Special Issue Composites, Alloys and Advanced Processes for Manufacturing in Aeronautics and Aerospace)
Abstract
:In recent years, cutting edge preparation became a topic of high interest in the manufacturing industry because of the important role it plays in the performance of the cutting tool. This paper describes the use of the drag finishing DF cutting edge preparation process on the cutting tool for the broaching process. The main process parameters were manipulated and analyzed, as well as their influence on the cutting edge rounding, material remove rate MRR, and surface quality/roughness (Ra, Rz). In parallel, a repeatability and reproducibility R&R analysis and cutting edge radius re prediction were performed using machine learning by an artificial neural network ANN. The results achieved indicate that the influencing factors on re, MRR, and roughness, in order of importance, are drag depth, drag time, mixing percentage, and grain size, respectively. The reproducibility accuracy of re is reliable compared to traditional processes, such as brushing and blasting. The prediction accuracy of the re of preparation with ANN is observed in the low training and prediction errors 1.22% and 0.77%, respectively, evidencing the effectiveness of the algorithm. Finally, it is demonstrated that the DF has reliable feasibility in the application of edge preparation on broaching tools under controlled conditions.
1. Introduction
Broaching is a machining process used in the manufacture of complex internal and external shapes required by many advanced industries, such as aeronautics, automotive, and marine [1]. The quality of the products manufactured in these industries is of the highest order, where the level of surface and dimensional integrity is commensurate with its critical application. Therefore, the manufacturing suppliers of these industries must comply with such requirements. One of the factors that directly influences the achievement of the desired standards is the cutting tool. Consequently, every process or controllable characteristic that can be applied to a cutting tool has its relevant importance.
The performance of metal removal tools is directly related to the macro and micro geometry of the tool, cutting materials, and coating systems. Macro geometry refers to the geometric shape and angles of the cutting profile. On the other hand, tool micro geometry focuses on the cutting edge. Recent studies show that tool micro geometry has a significant influence on the cutting process [2,3]. In addition, extending the life of the cutting edge is possible if it has a specific shape and quality. Different studies show that such life extension depends on the chip removal operation and cutting conditions [4,5,6]. In this sense, achieving the ideal geometry for each machining process is the main concern of researchers and the manufacturing industry.
There are traditional cutting edge preparation processes that are used by cutting tool manufacturers and other new technologies that are in the development or implementation process [3,7,8,9]. Examples of a traditional processes are brushing and brushing–polishing, which are widely used by cutting tool manufacturers [10]. A wide range of new tool edge preparation processes are being employed, and each of them has advantages and limitations. One process that gained relevance and great utility in recent years is the planetary drag finishing process [11], it is low cost and has a versatility that allows it to work with the sharpening of complex geometries, which are advantages that give it relevance and utility [12]. However, in the specialized literature, there is little information on the working methodology, its limitations, its accuracy, and its influential parameters in obtaining the cutting micro geometry. In machining, the main purpose of applying the dragging process is to obtain a specific radius on the cutting edge. However, it also brings benefits such as smoothing, polishing, and deburring contours.
The tool cutting edge micro geometry achieved by any edge preparation process has identifiable characteristics, such as the surface topography achieved [4]. Small deformations and chips along the surface of the cutting edge define such topography. The topography at the cutting edge is required to be as sharp as possible, as it affects the surface quality of the machining [3,13]. However, the sharpness depends on the cutting edge preparation process applied. Another important aspect to consider is how fast a given cutting edge radius can be obtained. This is because it is directly related to the costs of the process. For this purpose, the material removal rate (MRR) is a metric that helps to visualize the process of obtaining the cutting edge [4,14].
Measurement and test results are always subject to a certain uncertainty. Traditionally, accuracy, linearity, and stability were characteristics considered in the evaluation of measurement systems. However, it is now recognized that important properties, such as repeatability and reproducibility R&R, need to be included in the measurement system. R&R analysis is applied to several areas of interest, such as the validation of calibration methods or the variability of measurements and instruments, among others. However, it is worth highlighting the fact that it is useful to evaluate the measurement uncertainty and stability of instruments and equipment [15,16]. Consequently, its usefulness is feasible to evaluate the process of obtaining a cutting edge radius by DF. To determine whether a measurement system can evaluate the performance of a process, adequate estimates of process variation and measurement variation are needed [16,17].
Due to the rise of Industry 4.0, the inclusion of machine learning for process monitoring is a field of great importance and high demand in different industries. Artificial neural networks are a type of artificial intelligence that allow the prediction of variables. Authors such as [18,19] used the artificial neural network model to study and predict tool wear from machine work parameters. In machining works, such as [18,19,20], ANNs were used to predict intentional tool wear (cutting edge preparation). In all these works, small errors in training and prediction were found; therefore, it supports the feasibility of applying this technique to predict the desired radius of the cutting edge.
This paper describes the use of the drag cutting edge preparation process. The incidence of the process parameters on the response variables (roughness and MRR) is studied to obtain valuable information as well as to understand and improve the application of this process. In addition, its accuracy, capability, reproducibility, and limitations are verified. In the end, with the cutting edge rounding results, a re prediction was performed by means of an ANN for the purpose of suppressing real tests under experienced system considerations and capabilities. Consequently, the algorithm will help to select rounding conditions for future needs and applications.
2. Materials and Methods
In this section, the following aspects are detailed: materials and equipment used, execution of edge preparation tests by dragging, methods for the analysis of experimental results, R&R analysis, and prediction of re, respectively.
2.1. Materials and Equipment
Abrasive particles play an important role in the removal of material in various stock removal processes. In fact, in abrasive processes, every particle becomes the cutting tool. In addition, the abrasive material, its shape, and size are influential factors in the cutting ability. Therefore, the definition of these parameters is necessary for a good performance in the preparation of cutting edges.
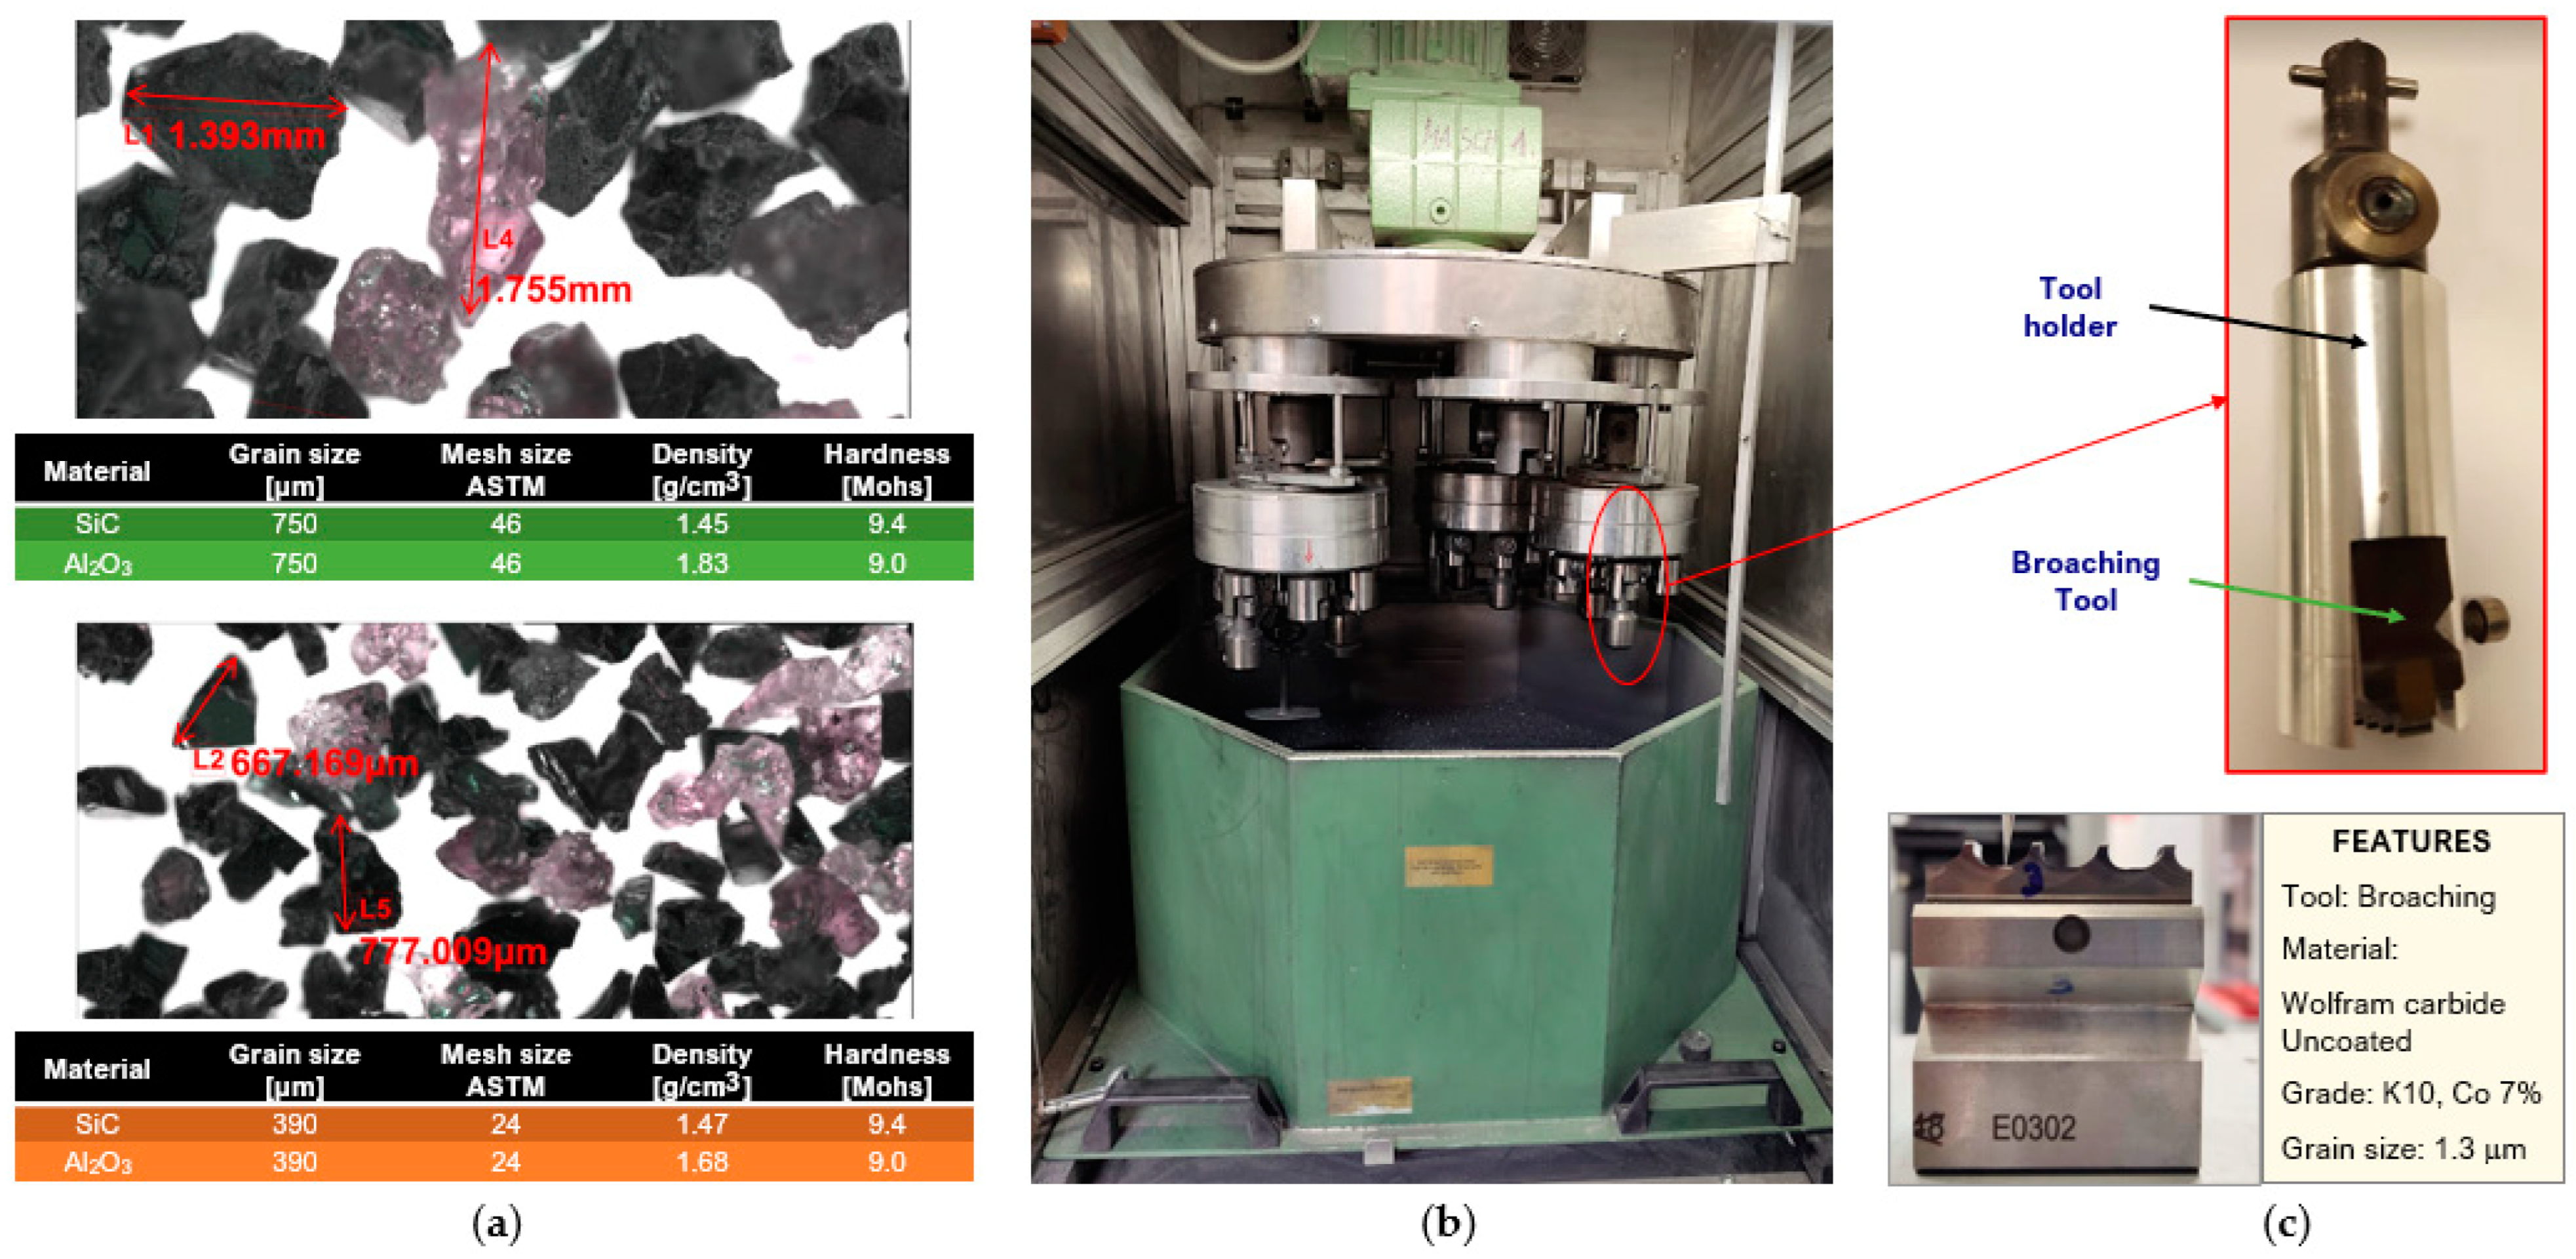
Silicon carbide (SiC) and alumina (Al2O3) abrasive grains were used in two different sizes, 24 and 46, according to the sieve aperture given by ASTM D E 11-70 (Figure 1a).
The cutting tool used for cutting edge preparation (Figure 1c) was an uncoated tungsten carbide broach section for external machining. Several 4-teeth broaching sections were cut by wire electrical discharge machining (WEDM) for the different test conditions.
2.2. Preparation by Drag Finishing
The cutting edge preparation process was carried out on the German OTEC DF-5 Tools machine (Figure 1b). The methodology for the execution of the experiments consisted of three varying drag depth (ID) levels, three abrasive mixing ratios (RM) according to the percentage by weight of SiC presence, two grit sizes (GZ), and drag duration times (DT) to achieve radius ranges recommended in the literature for the broaching process. The radii obtained in broach manufacturing are less than 10 microns. Meanwhile, the rounding of cutting edges depends fundamentally on the material to be machined and the tool material. Studies show that cutting edge radii between 10 and 25 microns improve machining performance on various materials [5]. The different levels for each factor are shown in Table 1. Three measurements were taken for each response variable for each combination.
Once the dragging is carried out with the indicated parameters, the prepared cutting edge is characterized (Figure 2). The roundness (re) is measured using an Alicona InfiniteFocusG5 profile measuring device. At this point, in addition to extracting the achieved edge radius, the removed area (Ar) is also determined geometrically by Equations (1) and (2) [4], for the purpose of observing the behavior with respect to time. Where, r1n is the nominal initial radius, r2n is the radius reached, and Kβ is the material removal coefficient function of the wedge angle β (Figure 2).
Subsequently, the surface roughness (Ra, Rz) is measured to obtain the surface quality obtained in each condition. For the determination of the roughness profile, a high pass of the main profile was filtered with a cut length of 80 μm. Finally, to contrast the surface topography achieved at the cutting edge, images of the treatment zone were captured. With the same equipment, the profile radius measurement was performed with a 10× lens, and both the topographic inspection and roughness measurement were performed with a 50× lens.
2.3. Repeatability and Reproducibility Analysis, R&R
The guidelines for the calculation of repeatability and reproducibility (R&R) are given by ISO 5725-2:2019. Process variation is composed of part-to-part and measurement variation. It can be estimated from a large sample of historical data or using the parts included in the study. In the absence of historical data, 24 parts or measurements are used, which is greater than the typical requirement of 10 parts. Measurement variation is estimated from the parts, reproducibility, and repeatability. In addition to the 24 parts chosen, measurements with 3 operators are used, a typical requirement of the R&R analysis. The 3 technicians performed the measurement of the re randomly from the parts. The 24 parts are composed of re measurements at DF times of 0, 20, 30, and 40 min at 3 immersion depth and 2 different locations. Three replicates of the 24 measurements are performed. Therefore, each technician performs 72 measurements for a total of 210 measurements.
2.4. Cutting Edge Radius Prediction
Based on the experimental results achieved, they are discussed, and a preparation radius prediction is applied by means of artificial intelligence (artificial neural network ANN). The ANN architecture is shown in Figure 3a; in the input layer there are 4 neurons and in the output layer only one neuron, which represents the cutting edge radius. To facilitate training and balance the importance of each parameter, the database was normalized between values 0 and 1. The experimental data set used for the training stage was divided by cross validation into: 80% for training and 20% for validation. It was developed with a feed-forward and backpropagation neural scheme on the total experimental data. The methodology applied for the estimation of cutting edge radius is described in Figure 3b.
The Equation (3) [21], is used to determine the synaptic connection weights, where CW′ij(n) is the new connection weight between node “i” and node “j” of the previous layer and ΔWij(n) is the synaptic weight correction.
For the evaluation of the evaluation performance, [22] recommends using the mean absolute error MAE, the mean squared error MSE, and the coefficient of determination R2. These metrics are presented in Equations (4), (5), and (6), respectively.
where, yexp represents the experimental values, and expresses the predicted values, SSE and SST are the sum of squares of the residuals and the total sum of squares, respectively.
3. Results and Discussion
This section details the results of the behavior and influence of the factors, the orientation of the tool on re, the results of the surface quality, the results of the R&R analysis, and the accuracy of the prediction through the artificial neural network.
3.1. Preliminary Tests, Influence and Behavior of Factors
The rounding results are analyzed in two possible locations for the tool (Figure 4a). The location of the broach will depend on its dimensions, being the most predominant length. In the industry, there is a diversity of lengths for broaches for the purpose of being able to be of great length and to be mounted in sections. Depending on the length L, the natural and practical location will be the vertical one, but it will be limited by the capacity of the container of the abrasive grain, especially its height (H).
However, a test was carried out to see the development of the rounding in a horizontal position. It was verified that the first cutting edge in contact with the abrasive particles is the one that suffers the greatest wear or rounding (Figure 5). This may be due to the fact that the first tooth absorbs the greatest impact energy with the particles as it opens its way in the dragging process (Figure 4b). However, the other cutting edges become uniformly rounded over time.
Due to the rotation on its own axis and the planetary-type rotation, along the cutting edge on the broach it changes from a convex to a concave shape (Figure 6). The convex shape is the shape obtained from the original manufacture of the tool, and the concave shape is the result of rounding by drag finishing after 30 min of operation.
The second part of the tests consisted of an in-depth analysis of the rounding evolution of the cutting edge in a vertical orientation, using tool blades at different heights as reference points. Figure 7 shows the incidence of each quantitative parameter (factors) manipulated in the experiment on the cutting edge radius, re (response). It can be observed that in no case is the behavior of the response variable linear, as it is increasing both for DT, GZ, and ID. In general, all the factors have a significant influence on re. Therefore, the control of each of them is important when obtaining a specific re in the tool.
As for the time factor DT, the influence increases as time increases, reaching a radius of 26 µm. The influence of grain size (GZ) is directly related to re, i.e., a large GZ gives a large re, while a smaller GZ gives a small re. The combination of abrasive grain sizes resulted in obtaining an approximate average re. The general trend of re as a function of ID is increasing. The trend of the curve indicates that with a deeper depth the radius can grow exponentially. However, the maximum depth of the tank limits the depth of the process and the amount of abrasive material. To minimize re variations, the particle mixer should be used whenever possible. This element uniforms the mixture and avoids the segregation of particles of different sizes or the appearance of the nutshell effect [23,24]. Finally, the effect of the SiC percentage on the cutting edge radius of the tool showed a particular behavior. At a SiC percentage in the mixture RM of 66%, a larger re is obtained than that obtained with an RM of 50% and 75%, respectively, being the RM of 75% with which relatively smaller radius edges were obtained.
The combined effect of DT and ID on re can be observed in Figure 8. In the first instance, the average values of the re increase over time are shown, starting from an original tool radii between 7 and 9 μm, and reaching a final radius of 26 μm. On the other hand, the progress of re obtained at different ID depths from 5 to 120 mm is shown, represented by points A to D, reaching a maximum radius of 43 µm. It follows from the above that the combined effect of DT and ID on re has a direct incremental relationship, but it is not linear.
The combined effect of GZ grain size and ID drag depth causing an increase in re is shown in Figure 9. For each GZ, the increase in re increases in different proportions as we increase ID. As an example, for combination A, the radius size is doubled from the initial radius to the final radius, and for combination B, the radius reached is about three times the initial radius. In industrial application, this result can be translated into different cutting edge preparation control possibilities. With combination B, the largest cutting edge radii could be obtained at any depth compared to the other two combinations. On the other hand, if a fine control of the cutting edge radius increment is desired, combinations A and AB will allow this control. This is possible primarily because of the size of the abrasive grain. That is, the larger the grain size, the greater the cutting edge and cutting capacity [14]. In addition, it is understood from physics that, as the immersion depth increases, the greater the pressure of the grain surface interaction of the cutting edge, which will contribute to greater material removal.
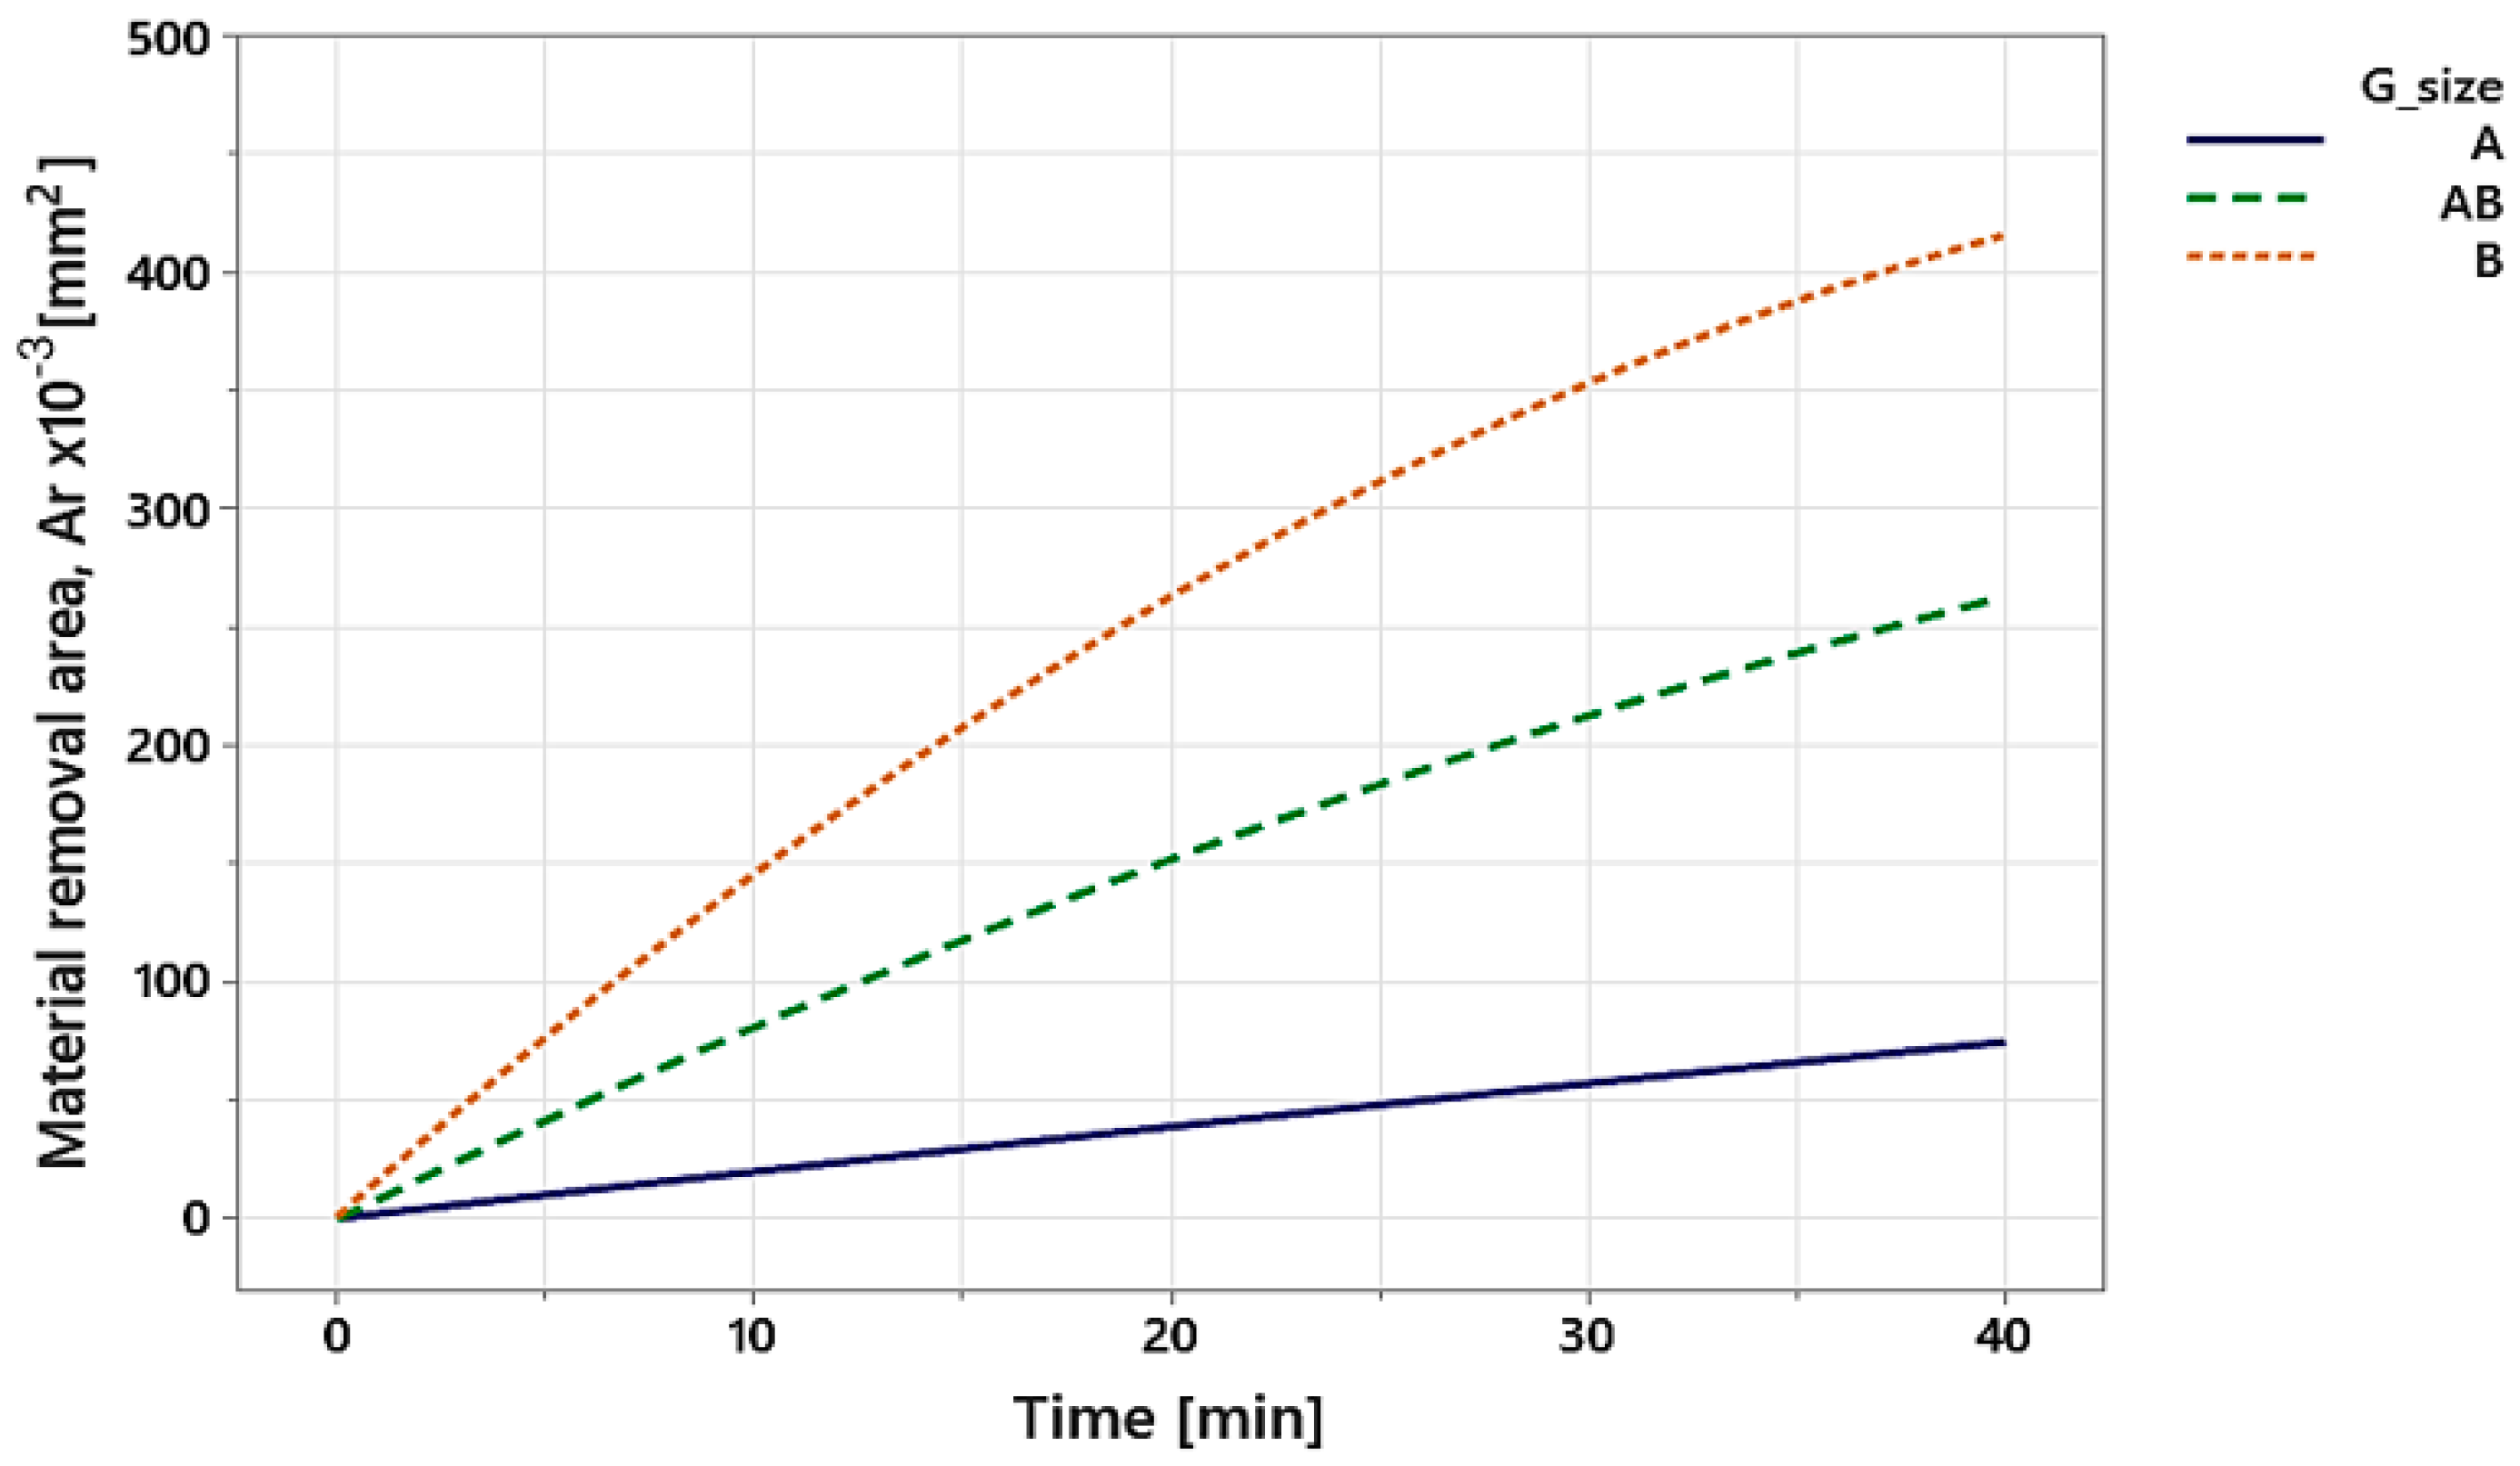
The result of the characterization of the removal process for the cutting edge preparation is shown in Figure 10. The trend of Ar versus the combined effect of DT and GZ is the result of the average of all tested combinations (Table 1). As Ar is directly dependent on the increase in radius (Equation (1)), the area removed, and consequently the material removal rate, will increase in such a way that the particle removal aggressiveness of the abrasive grains is increased. That is the reason why the abrasive grain mixture B is larger than AB and A, respectively. It also depends directly on the coefficient Kβ, but when analyzing the same cutting edge, it becomes a constant value, as it is directly dependent on the wedge width β.
3.2. Surface Roughness Analysis at the Cut Edge
Residual surface defects from the manufacturing process at the edges can reduce the quality of a workpiece. By applying the drag finishing process, these imperfections are eliminated and reduced, as in the case of surface roughness (Figure 11). Consequently, it will provide a smooth subsequent finishing and better handling.
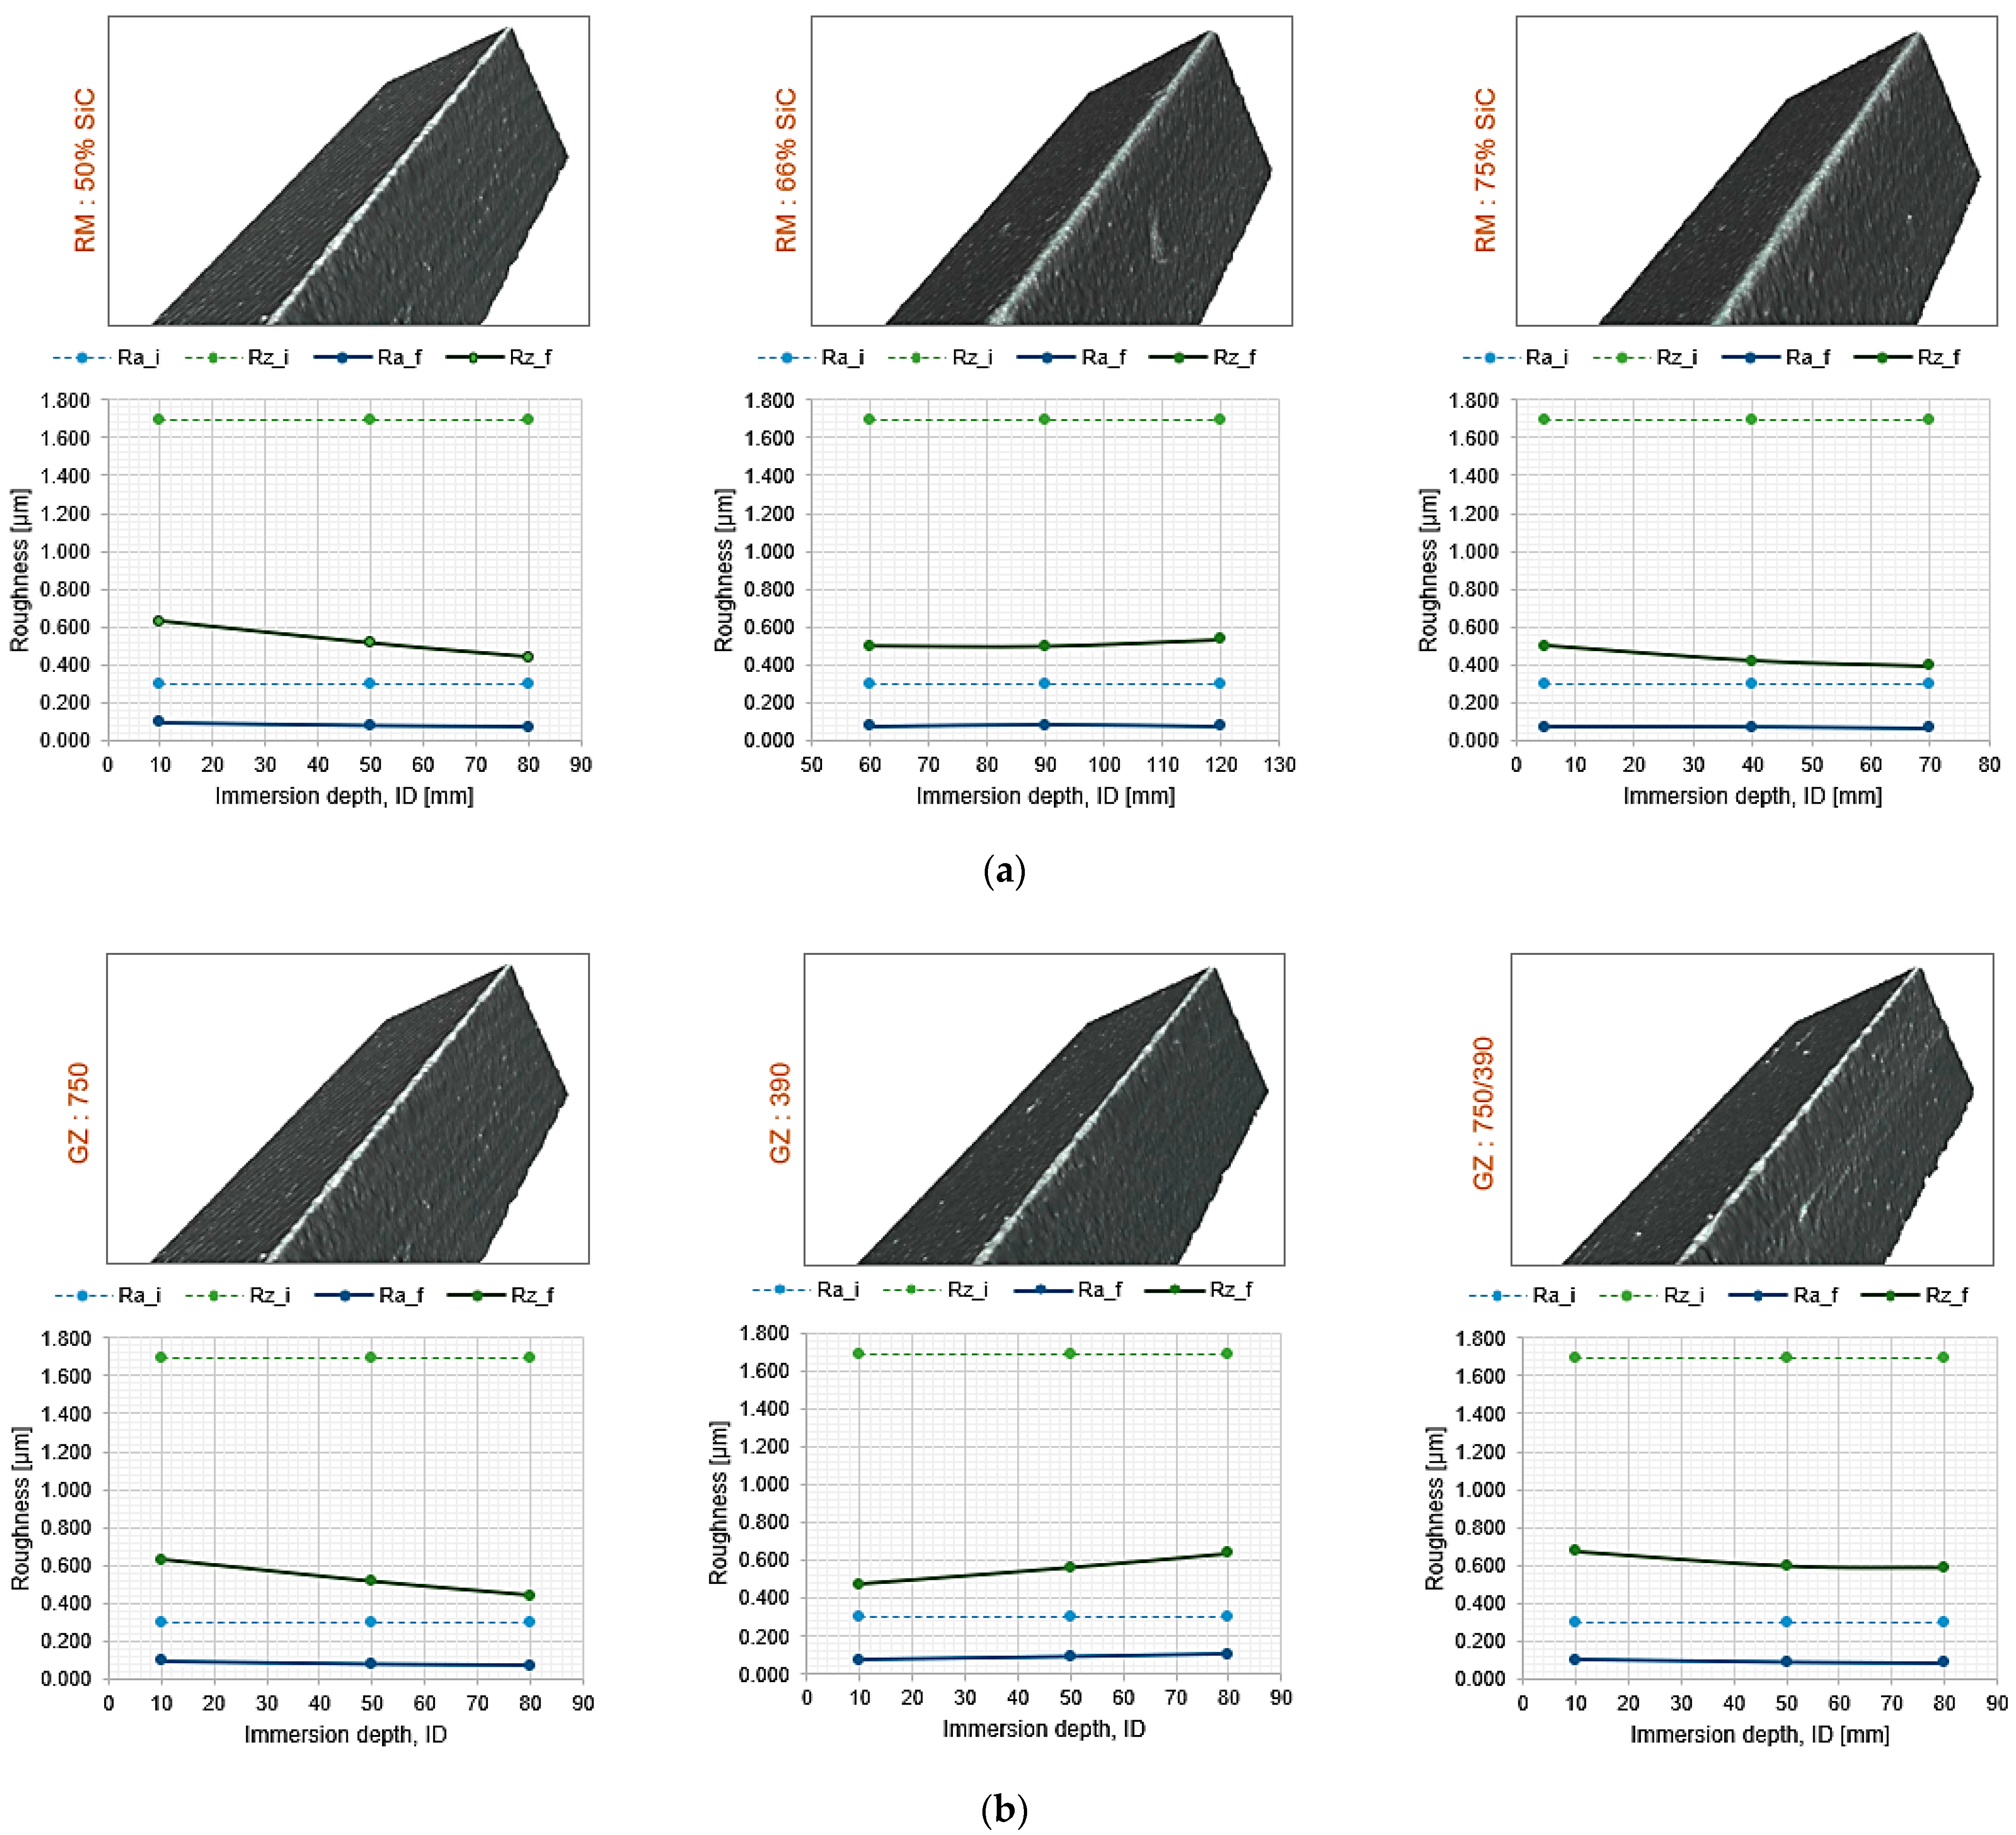
The roughness achieved on the surface of the re cutting edge radius by the drag finishing process versus the immersion depth is presented in Figure 12. Where, the subscripts i and f correspond to the initial and final roughness, respectively. For all the cases shown, the reduction in the surface roughness is remarkable. At the same time, there is greater uniformity in Ra and greater variability in Rz. By definition, Rz is more sensitive to the detection of imperfections in the machined surface; therefore, it is widely used for the control and monitoring of surface irregularities [25,26,27]. However, the Rz values obtained by drag finishing are lower or equal to those originally obtained in the manufacture of cutting tools by grinding operation [25,26]. Considering the effect produced by the percentage of SiC in the abrasive mixture (Figure 12a), it can be observed that lower SiC content allows for achieving a higher Rz compared to the higher inclusion of SiC in the mixture. This means that the presence of 50% alumina in the mixture has a higher abrasive capacity. Similarly, the effect of abrasive grain size on surface roughness is shown in Figure 12b. It is observed that there is no significant variation in the different abrasive grit sizes used, but there is a slight reduction when using a 750 grit rather than a 390 grit. A particular opposite effect occurs between the two grit sizes used as the immersion depth increases, which should be studied further to know if the behavior is maintained or is a particular case of the tested conditions. However, that proved to be the great advantage of applying drag finishing for edge rounding with a higher surface quality. This is clearly seen in the reduction in surface roughness by three times Ra and greater than two times Rz for all cases.
To illustrate the resulting defects, Figure 12 shows images of the cut edge, where the dullness measurements were performed. The presence of disturbances and chipping is identified in certain areas of the cutting edge, which implies that these defects are the result of the original treatment by grinding and are replicated by the process applied in this study. Finally, as for Ra, it can be observed that its value tends to be constant, regardless of ID.
3.3. Repeatability and Reproducibility R&R Analysis
The results of the repeatability and reproducibility R&R analysis are shown in Table 2. The analysis indicates that the contribution of repeatability is greater than reproducibility in obtaining the re of the process.
Table 2 shows the sources of variation in the measurement system in obtaining the edge radius re, as well as the percentage of contribution to the variance. First, it shows us that the measurement system variation is equal to 18.49% of the process variation. This indicates that the system is in the marginal zone (Figure 13a), where acceptance is possible as long as its limitations, the importance of the application, and the cost are known [19,20].
Second, it was found that the repetition component of each test (repeatability) has a measurement variation of 76.7% and represents 14.18% of the total variation of the process; on the other hand, the component referring to the operators or technicians (reproducibility) has a variation in the measurement of 64.2%, which represents 11.86% of the total variation of the process. In practice, it means that the measurements obtained by the three technicians are not noticeably scattered. This is illustrated in Figure 13b, where it is observed that the measurements of operators 1 and 3 are similar, while operator 2 has the greatest relative variability among technicians.
The result found in the present analysis is consistent with the criteria given by [12], where it is stated that the “Drag Finishing” process is an applicable cutting edge preparation method for improving cutting performance in terms of accuracy and repeatability.
3.4. Cutting Edge Radius Prediction by ANN
This section presents the results of the prediction of re by ANN, machine learning by the supervised learning method, with the backpropagation gradient descent training algorithm. A maximum number of interactions (epochs) of 1000 was chosen. Cross validation was used to improve the generalization capability. A data set of 324 re measurements was obtained as input. Eighty percent of the data were used for training and 20 for validation. It took 141 epochs to find the best training. This means that the errors are no longer reduced, but stabilized (Figure 14). A coefficient of determination of 0.961 with a standard deviation of 0.00631 was obtained. Therefore, the prediction was continued.
The ANN prediction results are summarized in Table 3. Depending on the mean absolute error MAE, mean square error MSE, and the coefficient of determination, an optimal network architecture was arrived at. Figure 14 shows the variation in training and validation errors with the number of iterations for the network used in the present study.
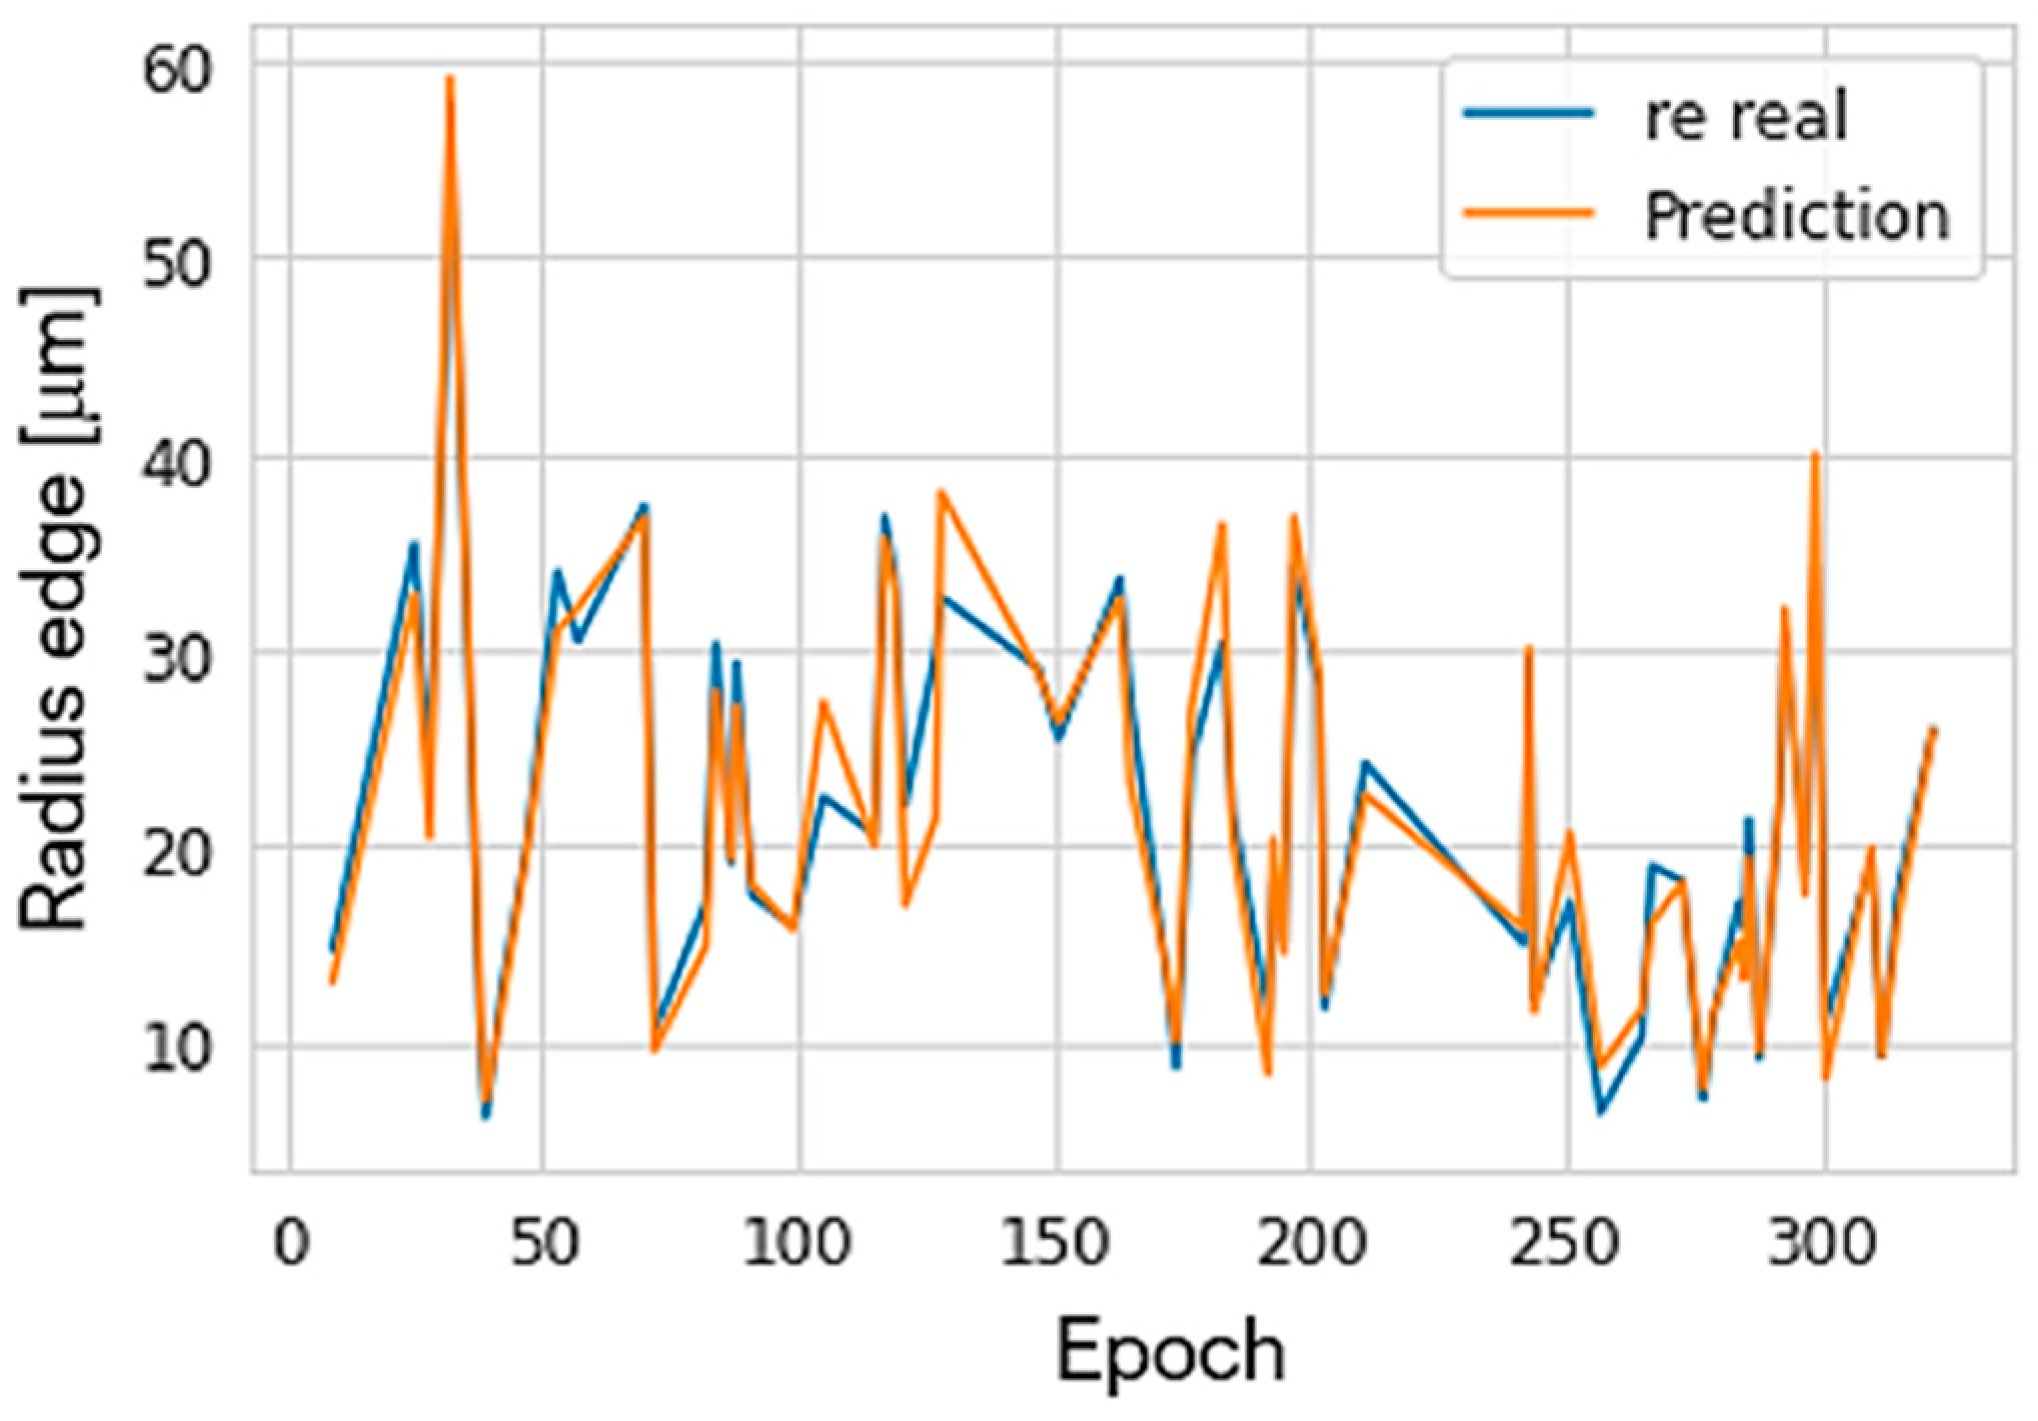
The re predicted by the neural network was compared with the corresponding experimental values and is shown in Figure 15. In addition, the average percentage of prediction errors was found to be 9.33% compared to the actual experimental values of the shear edge radius.
4. Conclusions
In this paper, the performance of an abrasive mixture of SiC and Al2O2 at different grain sizes and percentages of mixture are used to prepare uncoated tungsten carbide broaching tools by a drag finishing process. Important parameters, such as time and drag depth were controlled to determine the evolution of cutting edge rounding, material removal rate, repeatability and reproducibility, surface topography, and develop a prediction model by ANN. The important conclusions are:
- -
- The parameters incident to obtaining a cutting edge radius were, in order of importance: plunge depth, dragging time, abrasive mix percentage, and abrasive size.
- -
- The incidence of tool location is very important in obtaining a specific radius cutting edge value. In this process, location is understood as the positioning angle and depth of dragging. As for the positioning angle, the horizontal positioning of the broach during dragging causes a superior rounding on the first cutting edge (33 μm) which can be up to two times larger than the radius of the other cutting edges (18 μm). On the other hand, depending on the depth of dragging, the radius of the cutting edge increases in a progressive non-linear way. On average, the growth ranges from 12 μm at 5 mm depth to 31 μm at 120 mm depth. As far as roughness is concerned, it could be identified that the incidence is greater for the abrasive inclusion rate than the grain size. The substantial reduction in surface defects by Ra and Rz are a third of its original measure. On average from initial Ra: 0.3 microns to final Ra: 0.09 microns, and from initial Rz: 1.7 microns to final Rz: 0.5 microns.
- -
- In terms of accuracy of the reproduction of the tool cutting edge radius, it is very acceptable compared to traditional processes, such as brushing and blasting. Obtaining from the R&R study of the reproducibility source a standard deviation of 1.22 that corresponds to 11.86% of the process variation.
- -
- The prediction accuracy of the preparation radius with ANN was 93.7%, which demonstrates the effectiveness of the algorithm.
- -
- The limitation of the drag finishing process is essentially related to the tool dimensions. In this case, long broaches would make it difficult to locate, hold, and therefore reproduce the geometry of the cutting edge on all the teeth.
Author Contributions
Conceptualization, C.F.P.-S. and L.N.L.d.L.; methodology, A.d.O.; investigation, C.F.P.-S. and A.d.O.; resources, L.N.L.d.L.; writing—original draft preparation, C.F.P.-S.; writing—review and editing, C.F.P.-S. and A.d.O.; supervision, L.N.L.d.L.; project administration, L.N.L.d.L. All authors have read and agreed to the published version of the manuscript.
Funding
This research was funded by Basque government group IT 1573-22 and the Ministry of Mineco Grant PID2019-109340RB-I00 and PDC2021-121792-I00 funded by MCIN/AEI/10.13039/501100011033. Thanks, are also due to European commission by H2020 project n. 958357 InterQ Interlinked Process, Product and Data Quality framework for Zero-Defects Manufacturing. Experiments were performed by help of project (QUOLINK TED2021-130044B-I00) Ministerio de Ciencia e Innovación 2021.
Data Availability Statement
Not applicable.
Acknowledgments
Thanks, are also given to special Unit AIMS, funded by the university of the Basque Country, Ideko, IMH and BCAM. We would like to thank the Universidad Técnica de Ambato for its support in the execution of the research.
Conflicts of Interest
The authors declare no conflict of interest.
References
- Del Olmo, A.; López de Lacalle, L.N.; Martínez de Pissón, G.; Pérez-Salinas, C.; Ealo, J.A.; Sastoque, L.; Fernandes, M.H. Tool Wear Monitoring of High-Speed Broaching Process with Carbide Tools to Reduce Production Errors. Mech. Syst. Signal Process. 2022, 172, 109003. [Google Scholar] [CrossRef]
- Bergmann, B.; Grove, T. Basic Principles for the Design of Cutting Edge Roundings. CIRP Ann. 2018, 67, 73–78. [Google Scholar] [CrossRef]
- Zhuang, K.; Fu, C.; Weng, J.; Hu, C. Cutting Edge Microgeometries in Metal Cutting: A Review. Int. J. Adv. Manuf. Technol. 2021, 116, 2045–2092. [Google Scholar] [CrossRef]
- Cortés, C. Cutting Edge Preparation of Precision Cutting Tools by Applying Micro-Abrasive Jet Machining and Brushing; Kassel University Press GmbH: Kassel, Germany, 2009; ISBN 978-3-89958-713-5. [Google Scholar]
- Bouzakis, K.D.; Bouzakis, E.; Kombogiannis, S.; Makrimallakis, S.; Skordaris, G.; Michailidis, N.; Charalampous, P.; Paraskevopoulou, R.; M’Saoubi, R.; Aurich, J.C.; et al. Effect of Cutting Edge Preparation of Coated Tools on Their Performance in Milling Various Materials. CIRP J. Manuf. Sci. Technol. 2014, 7, 264–273. [Google Scholar] [CrossRef]
- Magalhães, F.C.; Ventura, C.E.H.; Abrão, A.M.; Denkena, B. Experimental and Numerical Analysis of Hard Turning with Multi-Chamfered Cutting Edges. J. Manuf. Process. 2020, 49, 126–134. [Google Scholar] [CrossRef]
- Vopát, T.; Podhorský, Š.; Sahul, M.; Haršáni, M. Cutting Edge Preparation of Cutting Tools Using Plasma Discharges in Electrolyte. J. Manuf. Process. 2019, 46, 234–240. [Google Scholar] [CrossRef]
- Aurich, J.C.; Zimmermann, M.; Leitz, L. The Preparation of Cutting Edges Using a Marking Laser. Prod. Eng. 2011, 5, 17–24. [Google Scholar] [CrossRef]
- Biermann, D.; Aßmuth, R.; Schumann, S.; Rieger, M.; Kuhlenkötter, B. Wet Abrasive Jet Machining to Prepare and Design the Cutting Edge Micro Shape. Procedia CIRP 2016, 45, 195–198. [Google Scholar] [CrossRef] [Green Version]
- Denkena, B.; Kramer, N.; Siegel, F.; Kästner, J. Leistungsoptimierung an Der Schneidkante; Leibniz University: Hannover, Germany, 2007. [Google Scholar]
- Priarone, P.C.; Rizzuti, S.; Settineri, L.; Vergnano, G. Effects of Cutting Angle, Edge Preparation, and Nano-Structured Coating on Milling Performance of a Gamma Titanium Aluminide. J. Mater. Process. Technol. 2012, 212, 2619–2628. [Google Scholar] [CrossRef] [Green Version]
- Denkena, B.; Biermann, D. Cutting Edge Geometries. CIRP Ann. 2014, 63, 631–653. [Google Scholar] [CrossRef]
- Malkorra, I.; Salvatore, F.; Rech, J.; Arrazola, P.; Tardelli, J.; Mathis, A. Influence of Lubrication Condition on the Surface Integrity Induced during Drag Finishing. Procedia CIRP 2020, 87, 245–250. [Google Scholar] [CrossRef]
- Lv, D.; Wang, Y.; Yu, X.; Chen, H.; Gao, Y. Analysis of Abrasives on Cutting Edge Preparation by Drag Finishing. Int. J. Adv. Manuf. Technol. 2022, 119, 3583–3594. [Google Scholar] [CrossRef]
- Zanobini, A.; Sereni, B.; Catelani, M.; Ciani, L. Repeatability and Reproducibility Techniques for the Analysis of Measurement Systems. Measurement 2016, 86, 125–132. [Google Scholar] [CrossRef]
- Maria Mendes Araújo, L.; Gomes Nobrega Paiva, R.; Santana Peruchi, R.; Rotela Junior, P.; Henrique de Freitas Gomes, J. New Indicators for Measurement Error Detection in GR&R Studies. Measurement 2019, 140, 557–564. [Google Scholar] [CrossRef]
- Shirodkar, A.; Rane, S. Evaluation of Coordinate Measuring Machine Using Gage Repeatability & Reproducibility. Int. J. Syst. Assur. Eng. Manag. 2021, 12, 84–90. [Google Scholar] [CrossRef]
- Ghosh, N.; Ravi, Y.B.; Patra, A.; Mukhopadhyay, S.; Paul, S.; Mohanty, A.R.; Chattopadhyay, A.B. Estimation of Tool Wear during CNC Milling Using Neural Network-Based Sensor Fusion. Mech. Syst. Signal Process. 2007, 21, 466–479. [Google Scholar] [CrossRef]
- Panda, S.S.; Chakraborty, D.; Pal, S.K. Flank Wear Prediction in Drilling Using Back Propagation Neural Network and Radial Basis Function Network. Appl. Soft Comput. 2008, 8, 858–871. [Google Scholar] [CrossRef]
- Shi, D.; Gindy, N.N. Tool Wear Predictive Model Based on Least Squares Support Vector Machines. Mech. Syst. Signal Process. 2007, 21, 1799–1814. [Google Scholar] [CrossRef]
- Abd El-Aziz, K.; Saber, D.; Megahed, A.A. Investigation and Prediction of Abrasive Wear Rate of Heat-Treated HCCIs with Different Cr/C Ratios Using Artificial Neural Networks. Int. J. Met. 2021, 15, 1149–1163. [Google Scholar] [CrossRef]
- Wu, D.; Jennings, C.; Terpenny, J.; Gao, R.X.; Kumara, S. A Comparative Study on Machine Learning Algorithms for Smart Manufacturing: Tool Wear Prediction Using Random Forests. J. Manuf. Sci. Eng. Trans. ASME 2017, 139, 71018. [Google Scholar] [CrossRef]
- Schlick, C.P.; Fan, Y.; Umbanhowar, P.B.; Ottino, J.M.; Lueptow, R.M. Granular Segregation in Circular Tumblers: Theoretical Model and Scaling Laws. J. Fluid Mech. 2015, 765, 632–652. [Google Scholar] [CrossRef] [Green Version]
- Jain, N.; Ottino, J.M.; Lueptow, R.M. Combined Size and Density Segregation and Mixing in Noncircular Tumblers. Phys. Rev. E Stat. Nonlinear Soft Matter Phys. 2005, 71, 51301. [Google Scholar] [CrossRef] [PubMed] [Green Version]
- Cruz, D.C.; Sordi, V.L.; Ventura, C.E.H. Surface Analysis of WC-5%Co Cemented Tungsten Carbide Cutting Insert after Plunge-Face Grinding. Int. J. Adv. Manuf. Technol. 2020, 108, 323–330. [Google Scholar] [CrossRef]
- Cruz, D.C.; Sordi, V.L.; Ventura, C.E.H. Assessment of the Surface Integrity of Ground Cemented Tungsten Carbide Cutting Inserts and Its Influence on Tool Wear in Turning of Ferritic Nodular Cast Iron. CIRP J. Manuf. Sci. Technol. 2022, 37, 613–622. [Google Scholar] [CrossRef]
- Núñez, D.; Arroba, C.; Vaca, H.; Pérez, C.; Morales, C. Spray Lubrication in Turning Processes, Effects on Productivity and Quality. Dyna 2019, 94, 561–567. [Google Scholar] [CrossRef]
Figure 1.
Drag finishing process: (a) microscope images of abrasive particles and characteristic, (b) drag finishing machine, and (c) broaching tool.
Figure 1.
Drag finishing process: (a) microscope images of abrasive particles and characteristic, (b) drag finishing machine, and (c) broaching tool.

Figure 2.
Characterization of the honed cutting edge.
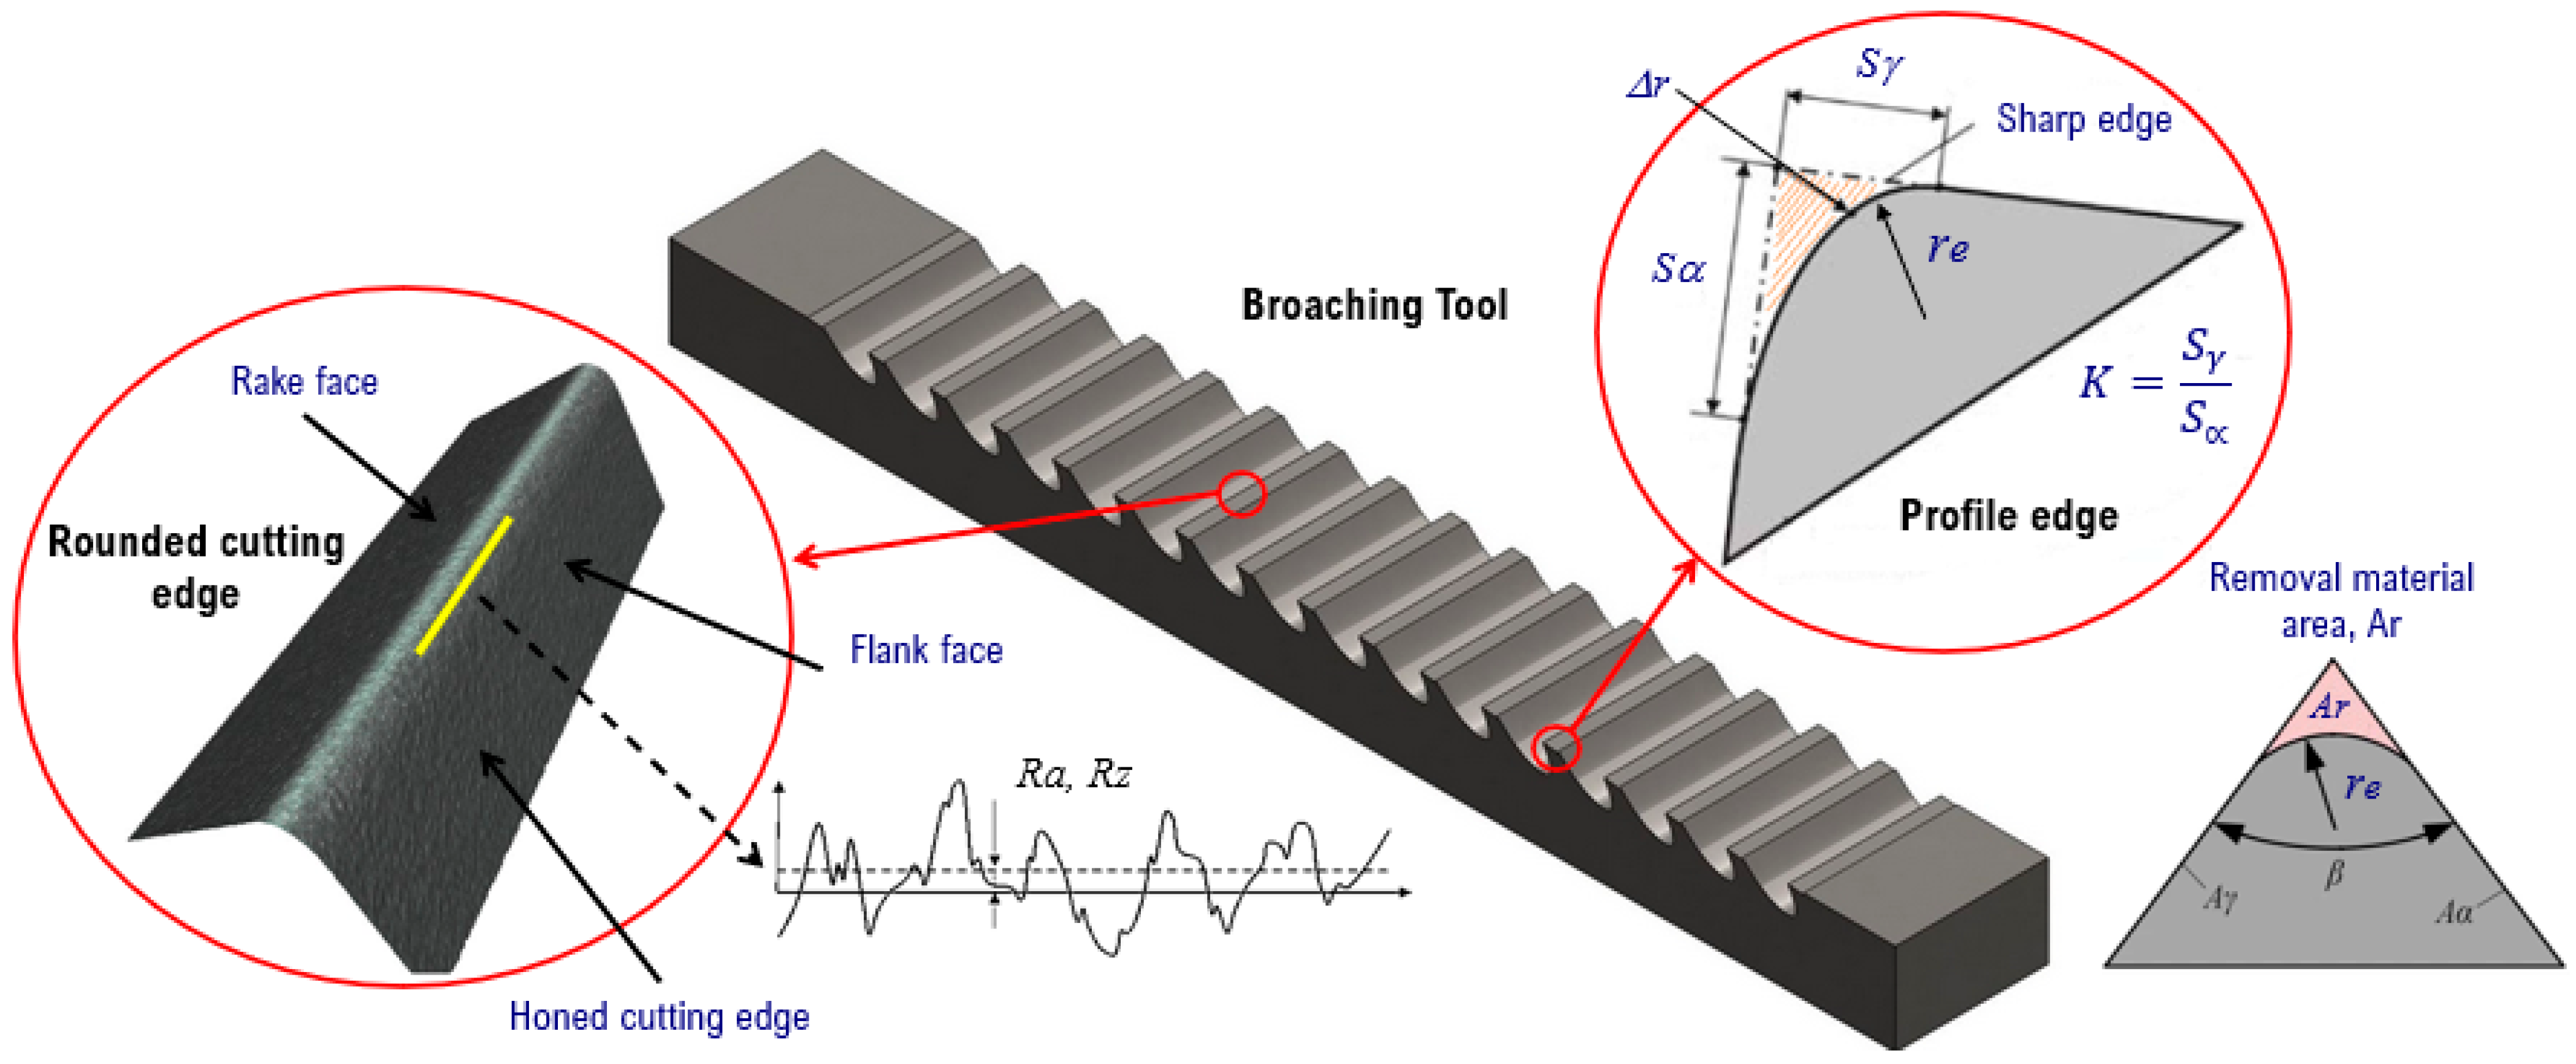
Figure 3.
Characterization of the honed cutting edge. (a) network layout; (b) flowchart.
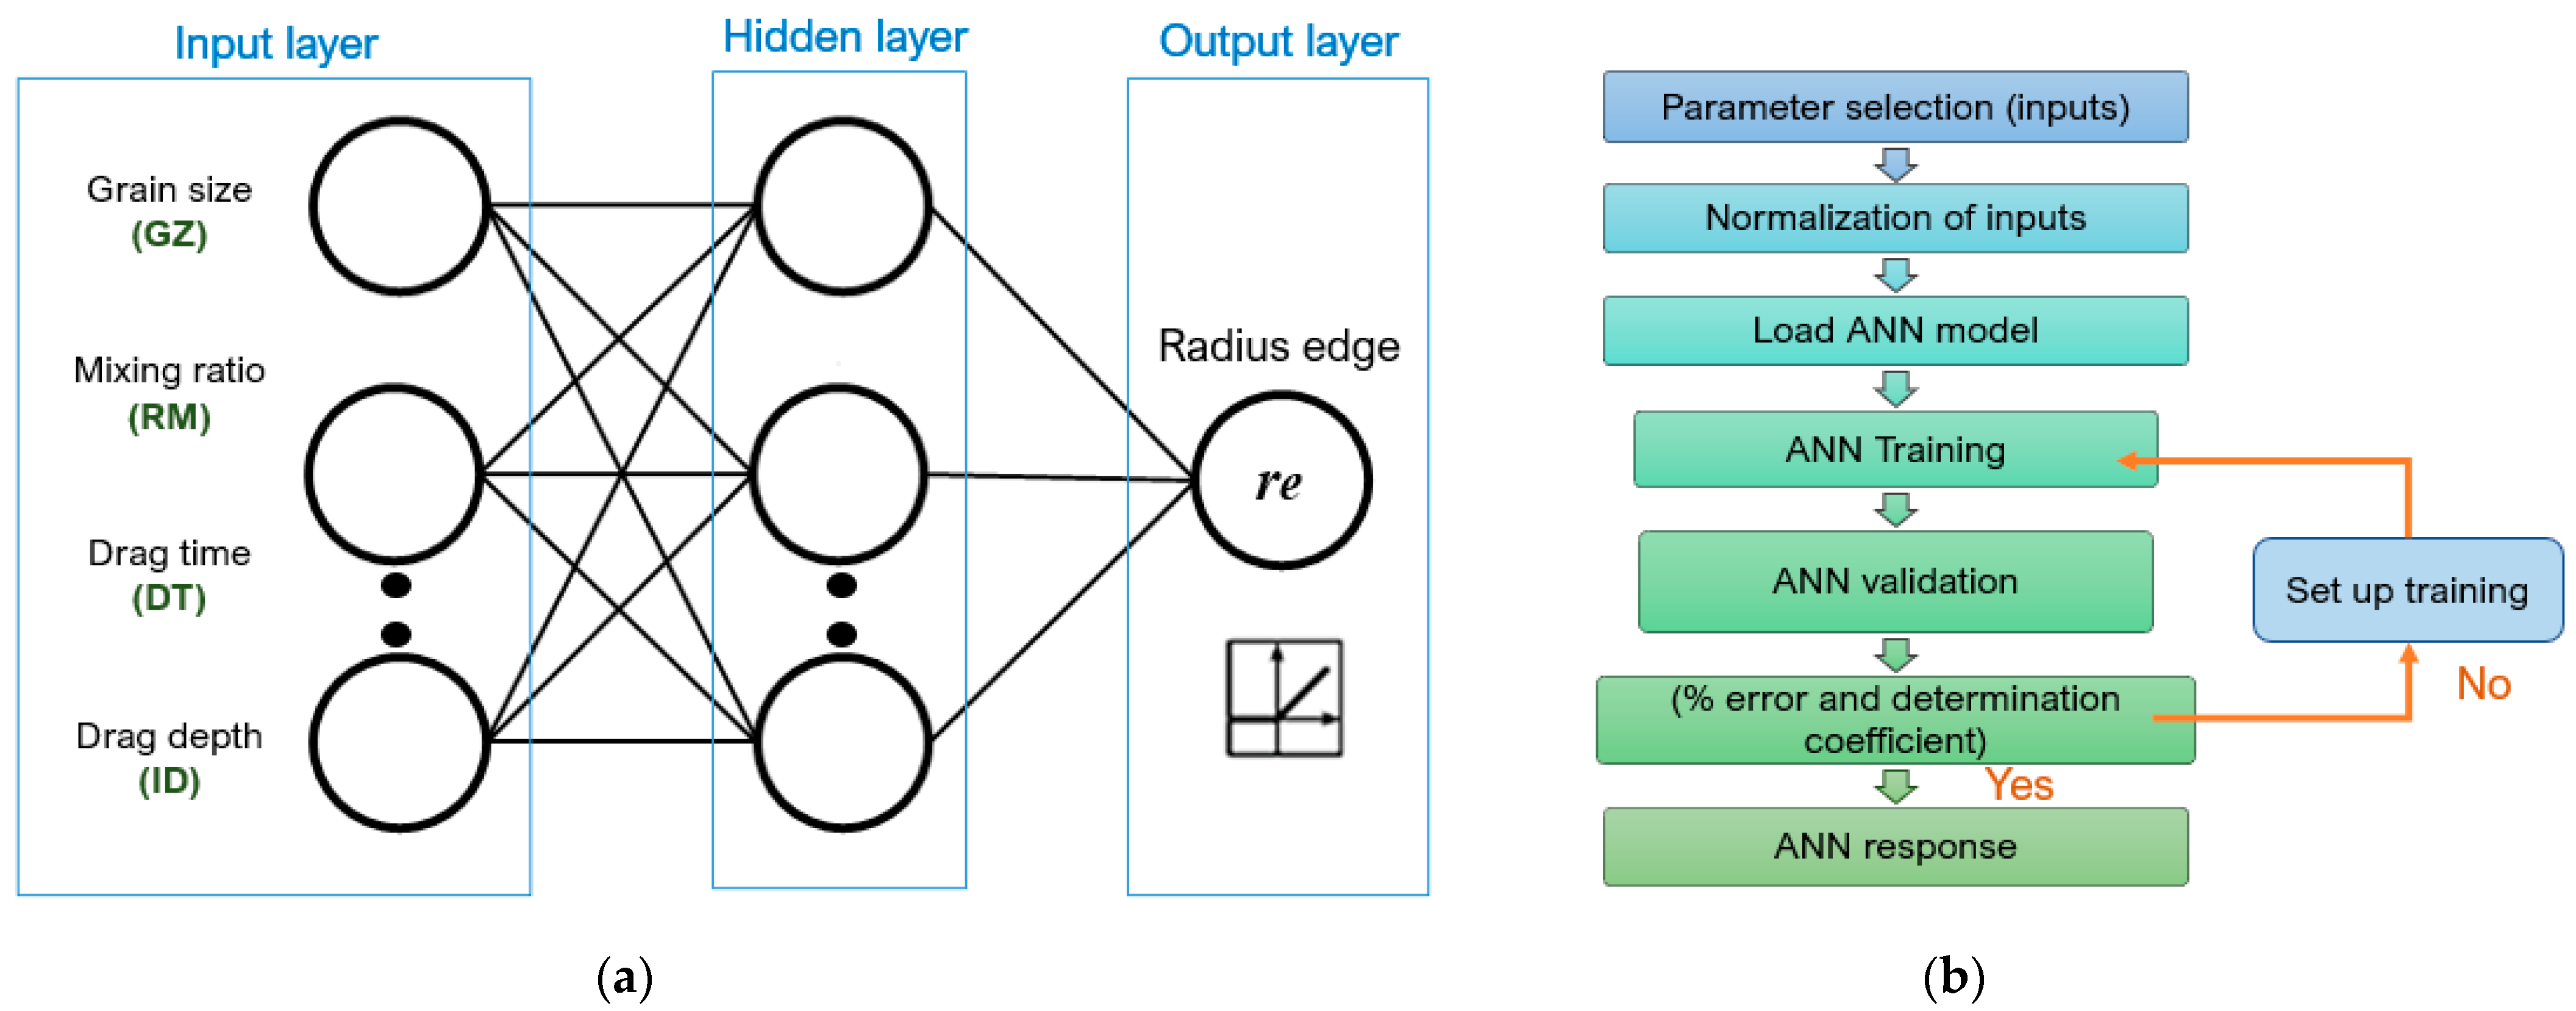
Figure 4.
(a) The mounting of the broaching tool with different orientations, (b) the movement of abrasive particles against the first dragged tooth in horizontal orientation, and (c) relative movements of the tool in the drag finishing process.
Figure 4.
(a) The mounting of the broaching tool with different orientations, (b) the movement of abrasive particles against the first dragged tooth in horizontal orientation, and (c) relative movements of the tool in the drag finishing process.
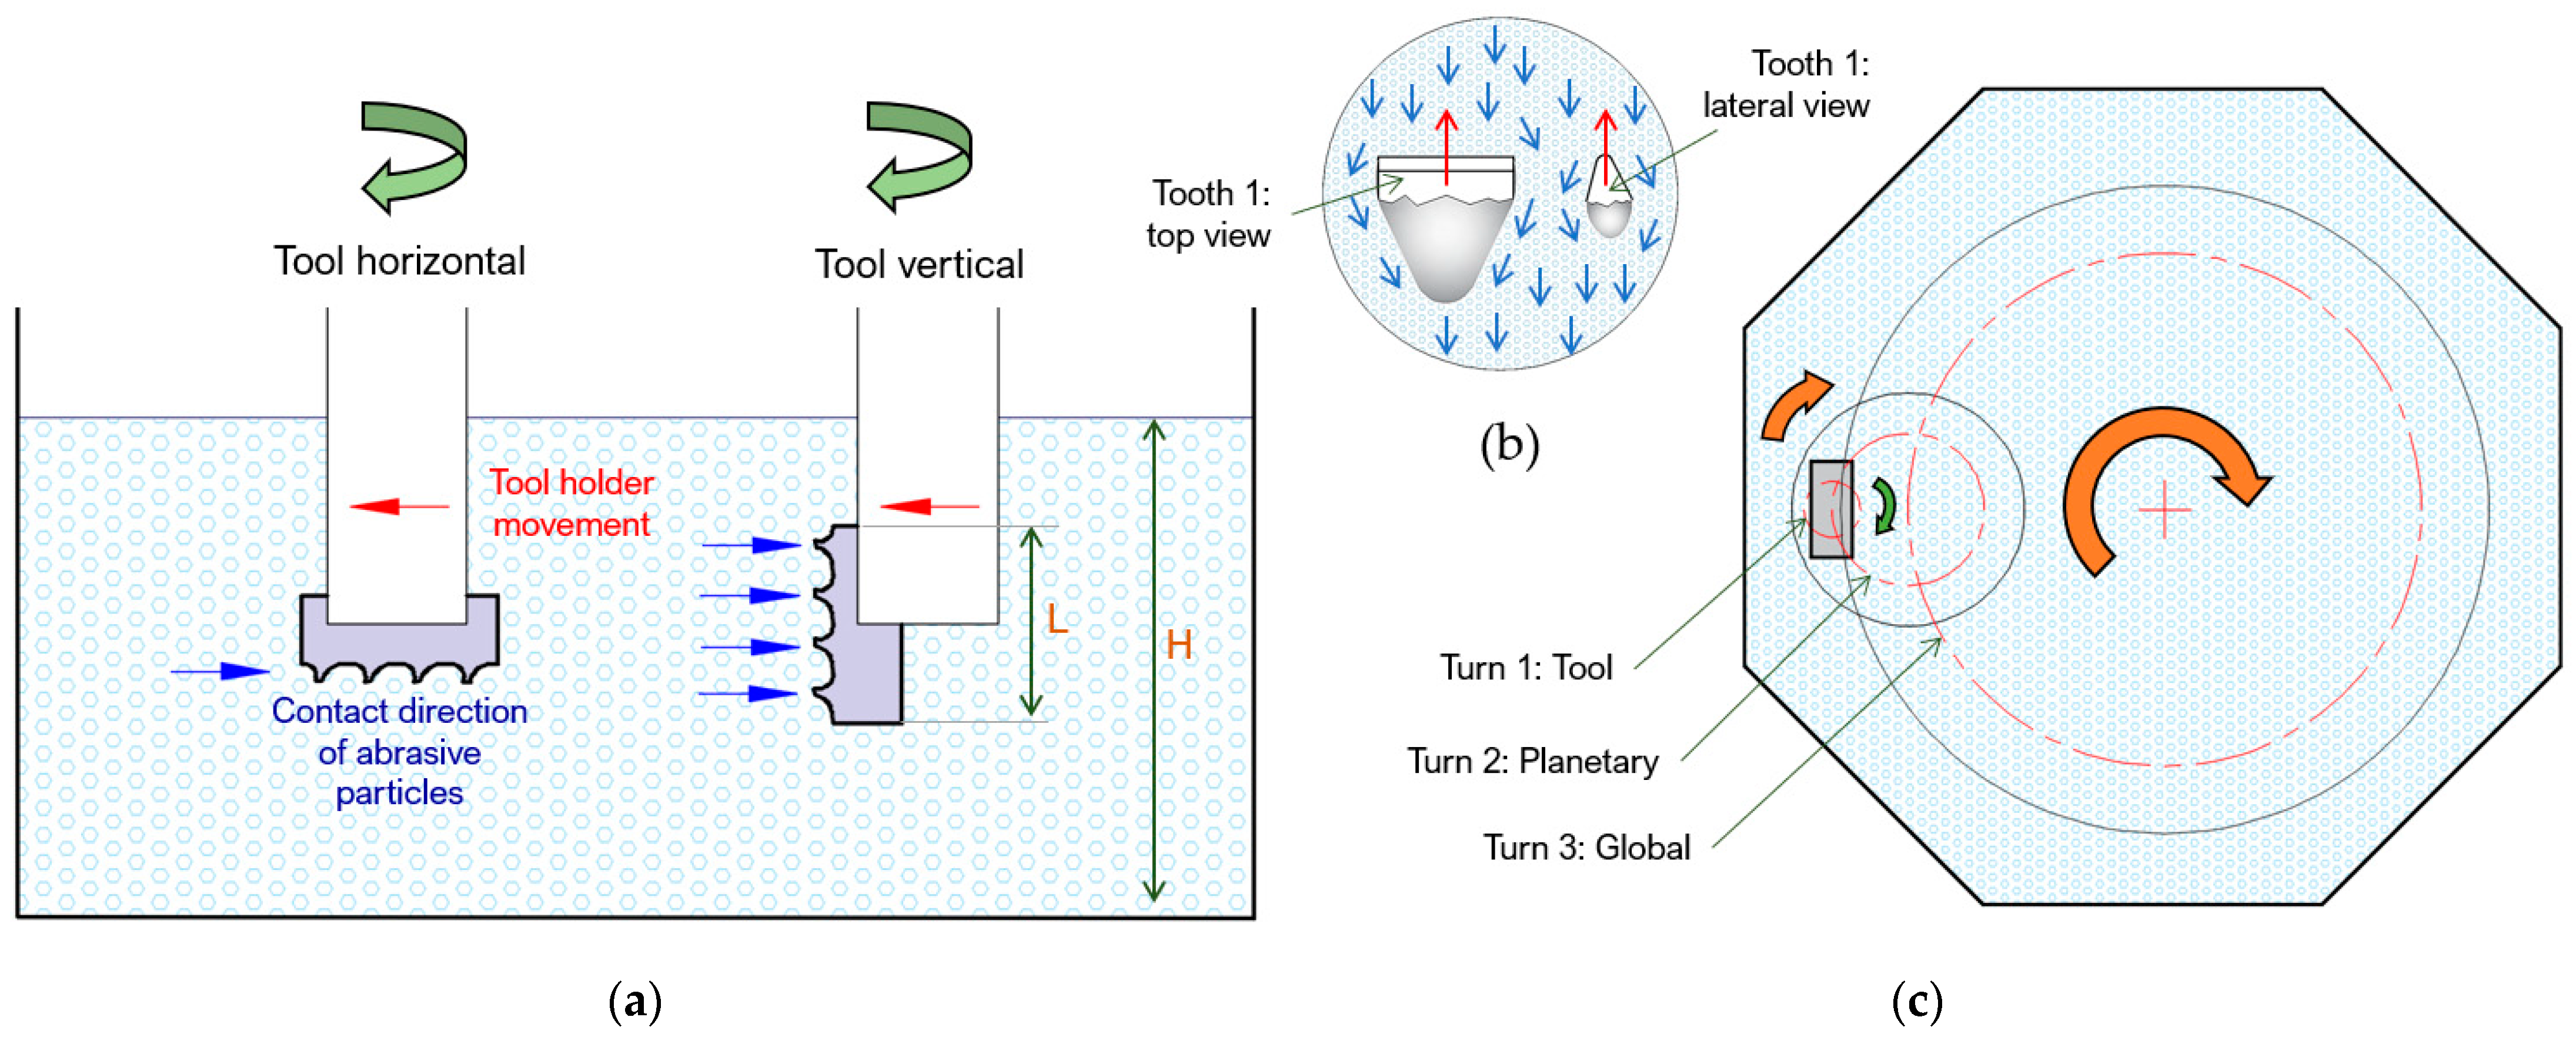
Figure 5.
Results of the four cutting edge rounding of the broaching tool, drag finishing in a horizontal position.
Figure 5.
Results of the four cutting edge rounding of the broaching tool, drag finishing in a horizontal position.
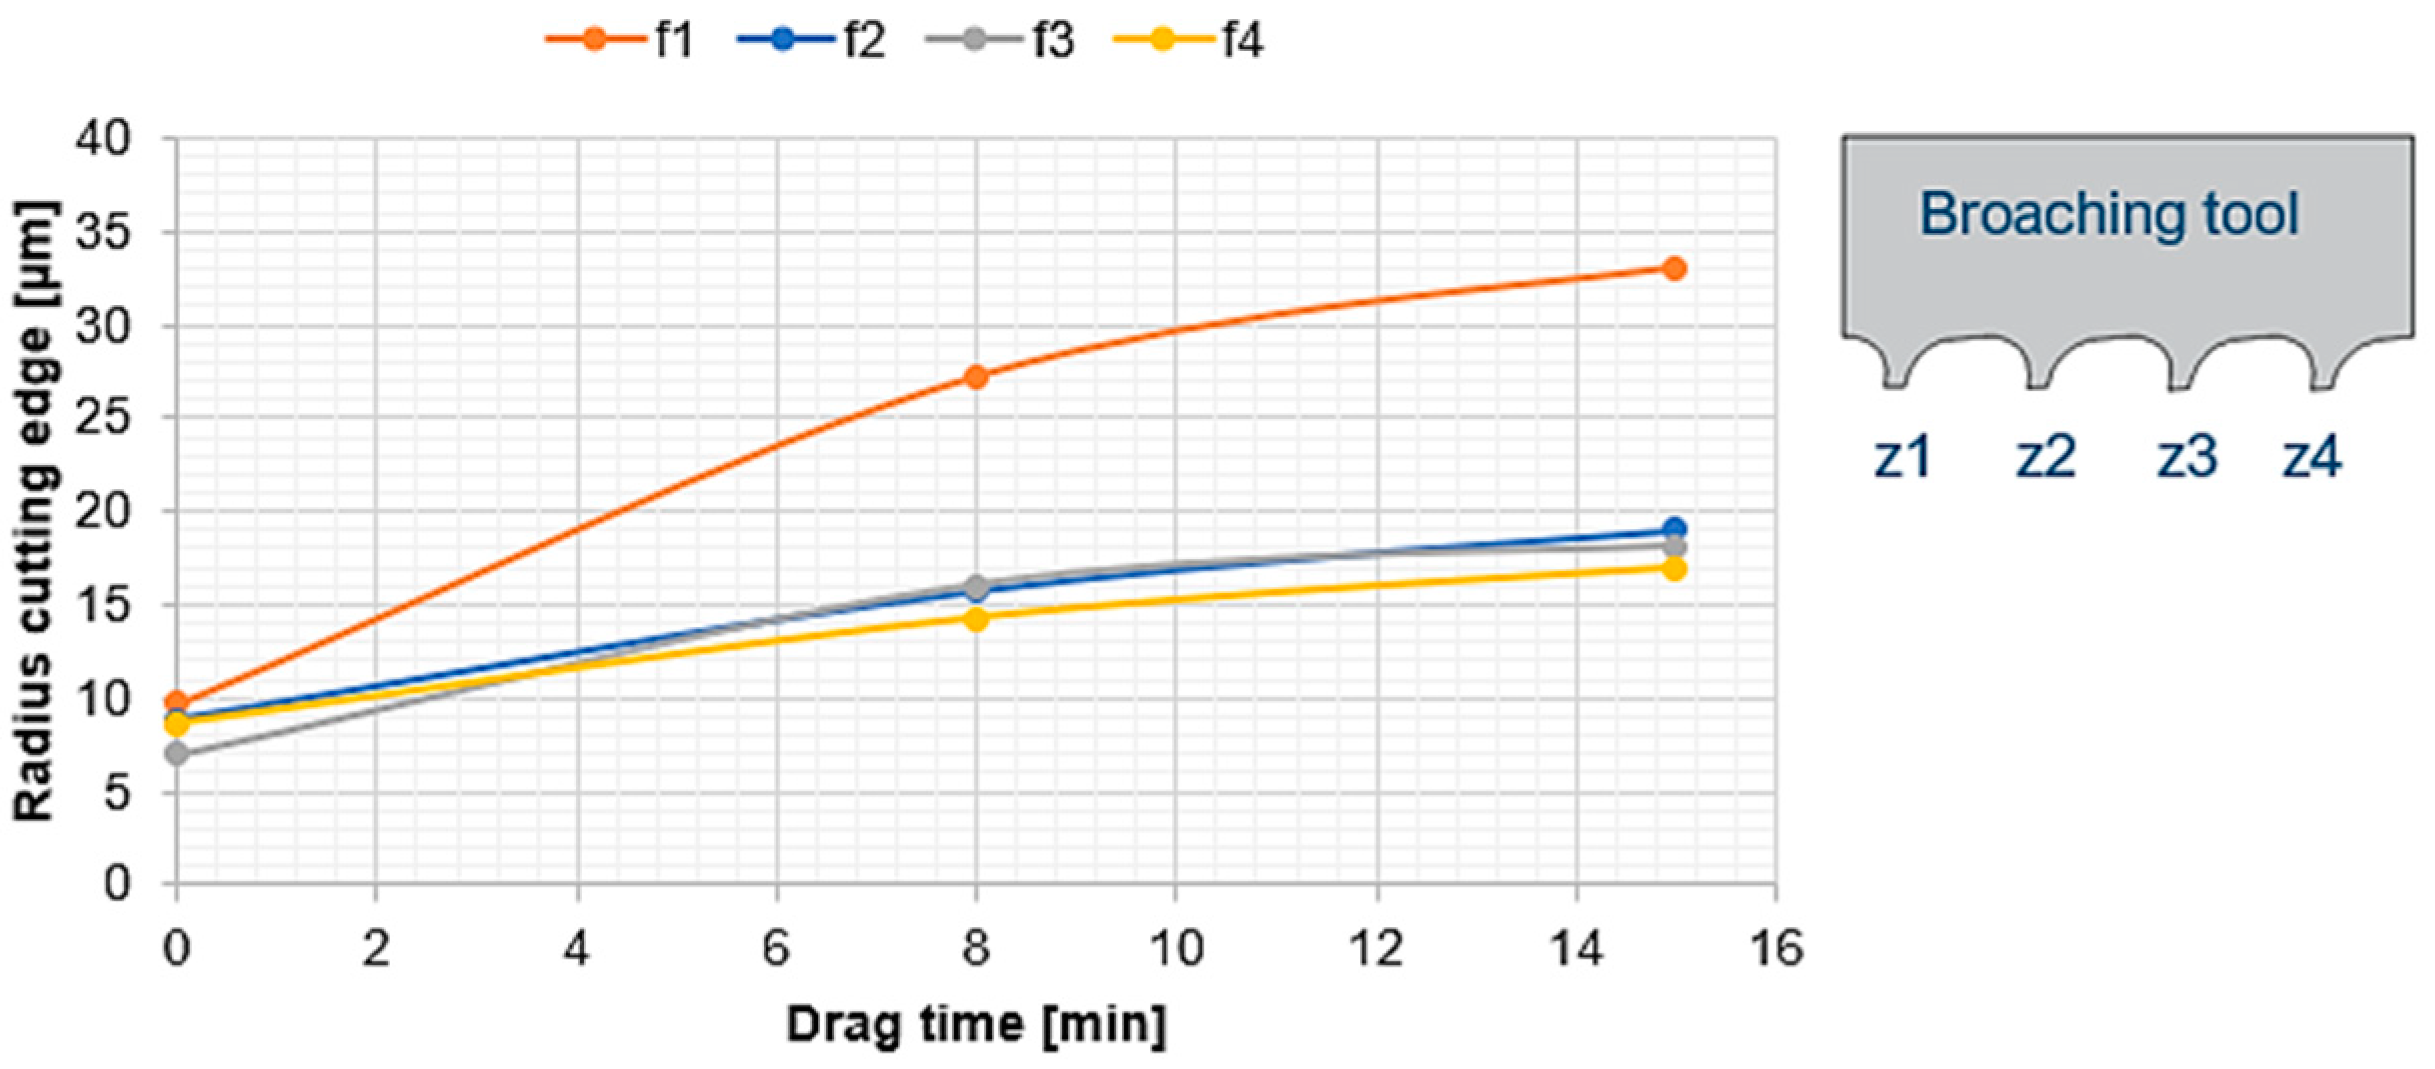
Figure 6.
Cutting edge radius measurement at three different points along the cutting edge.
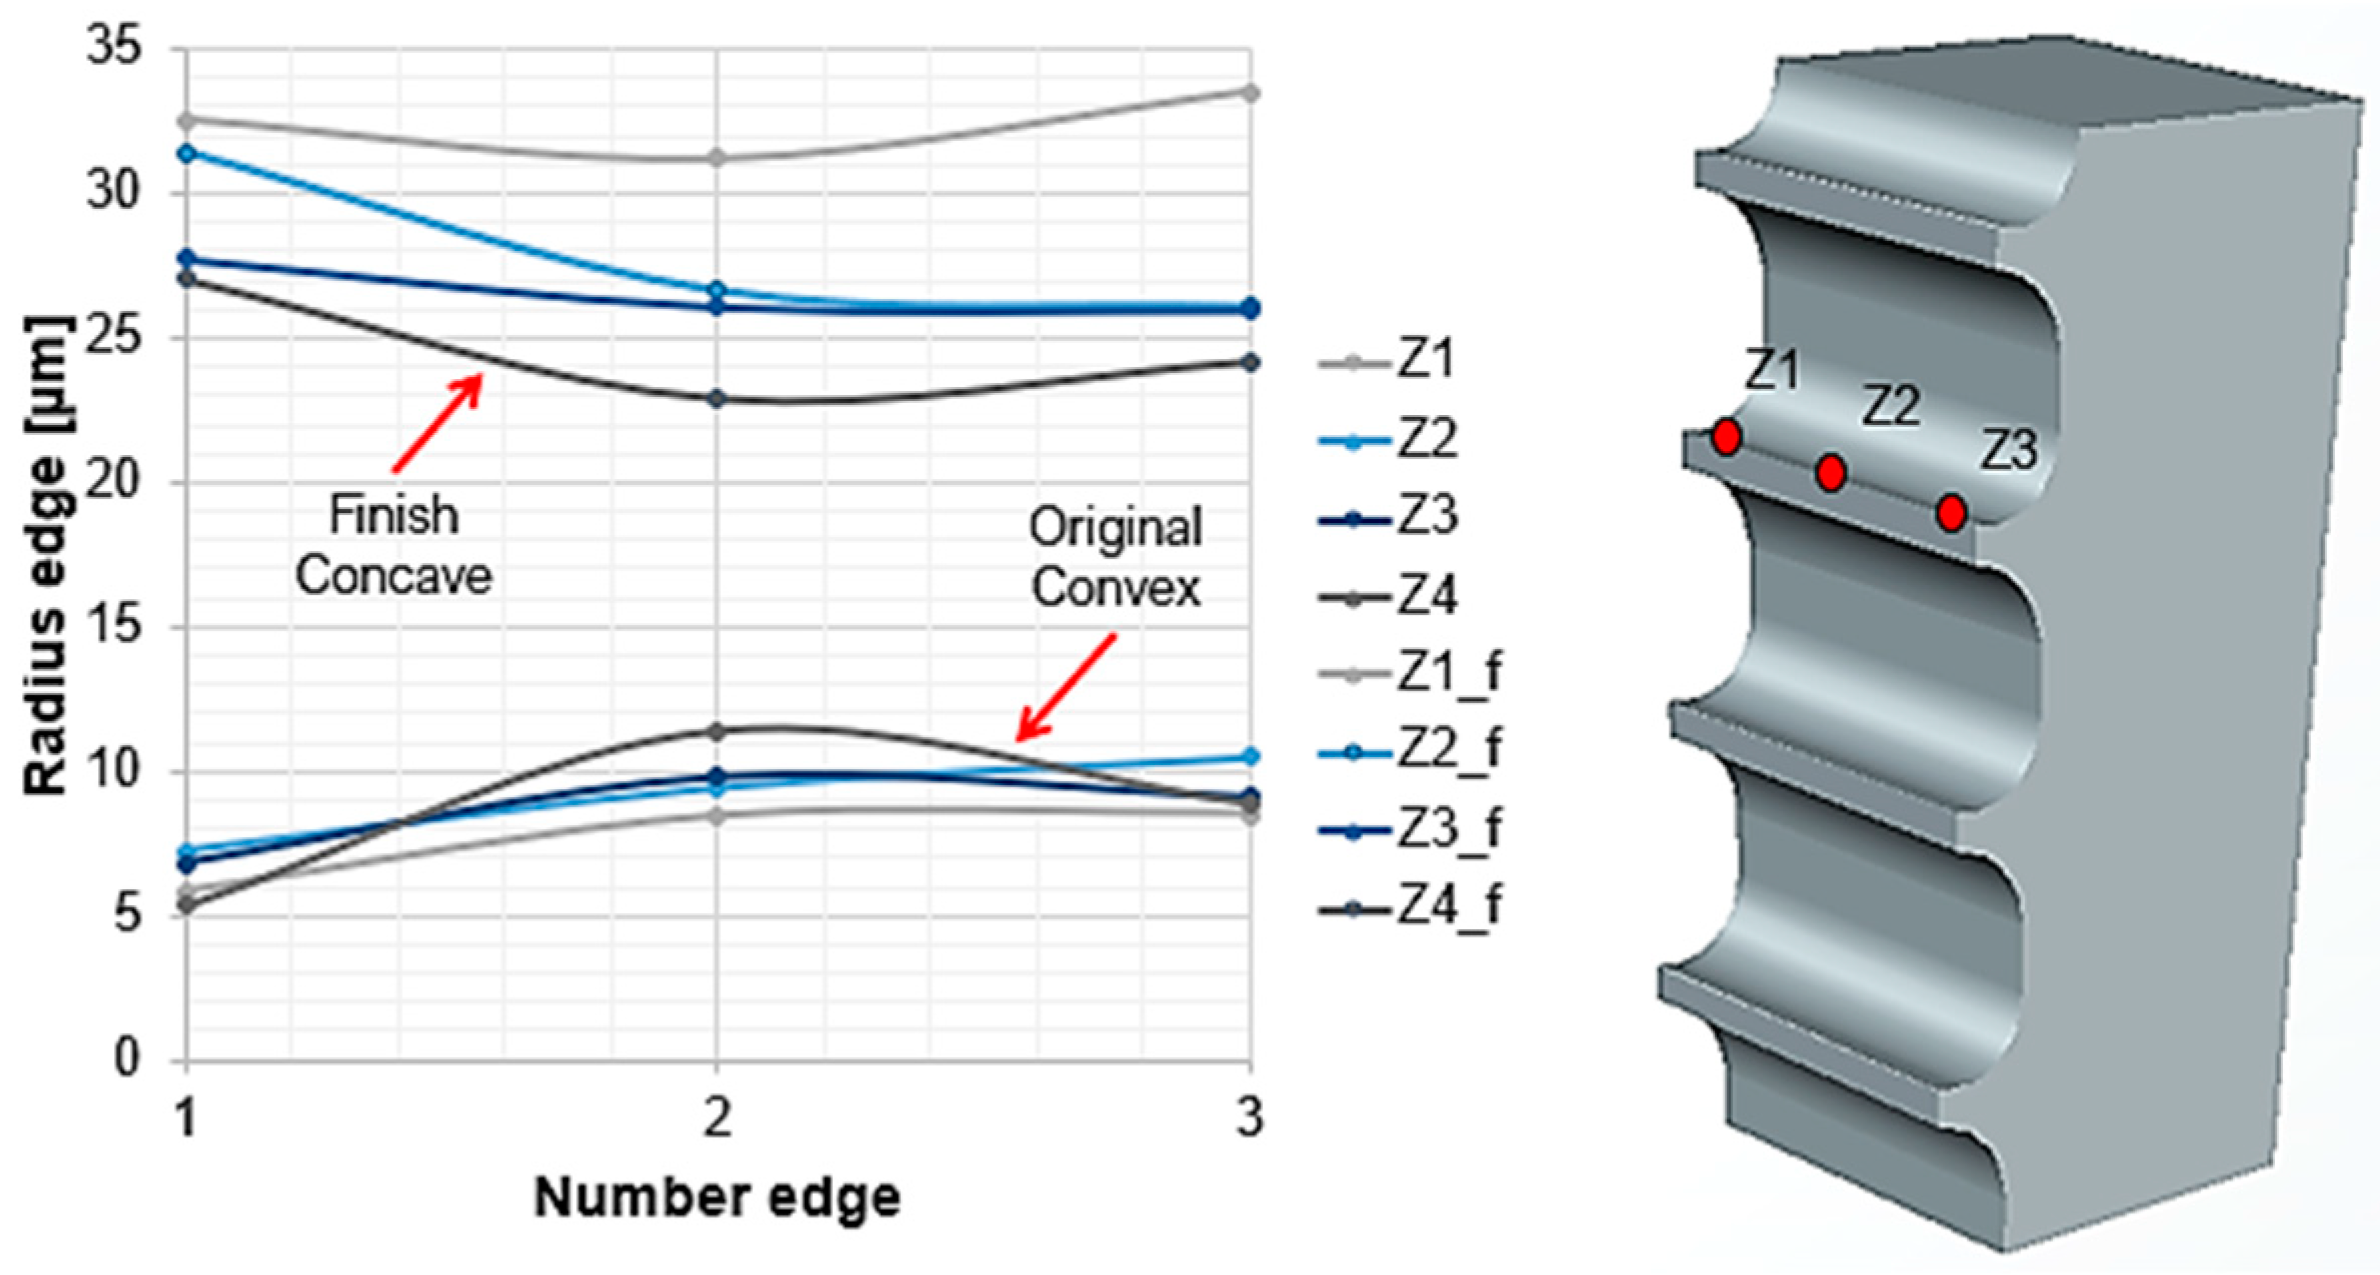
Figure 7.
Effect of experimental parameters on cutting edge radius.
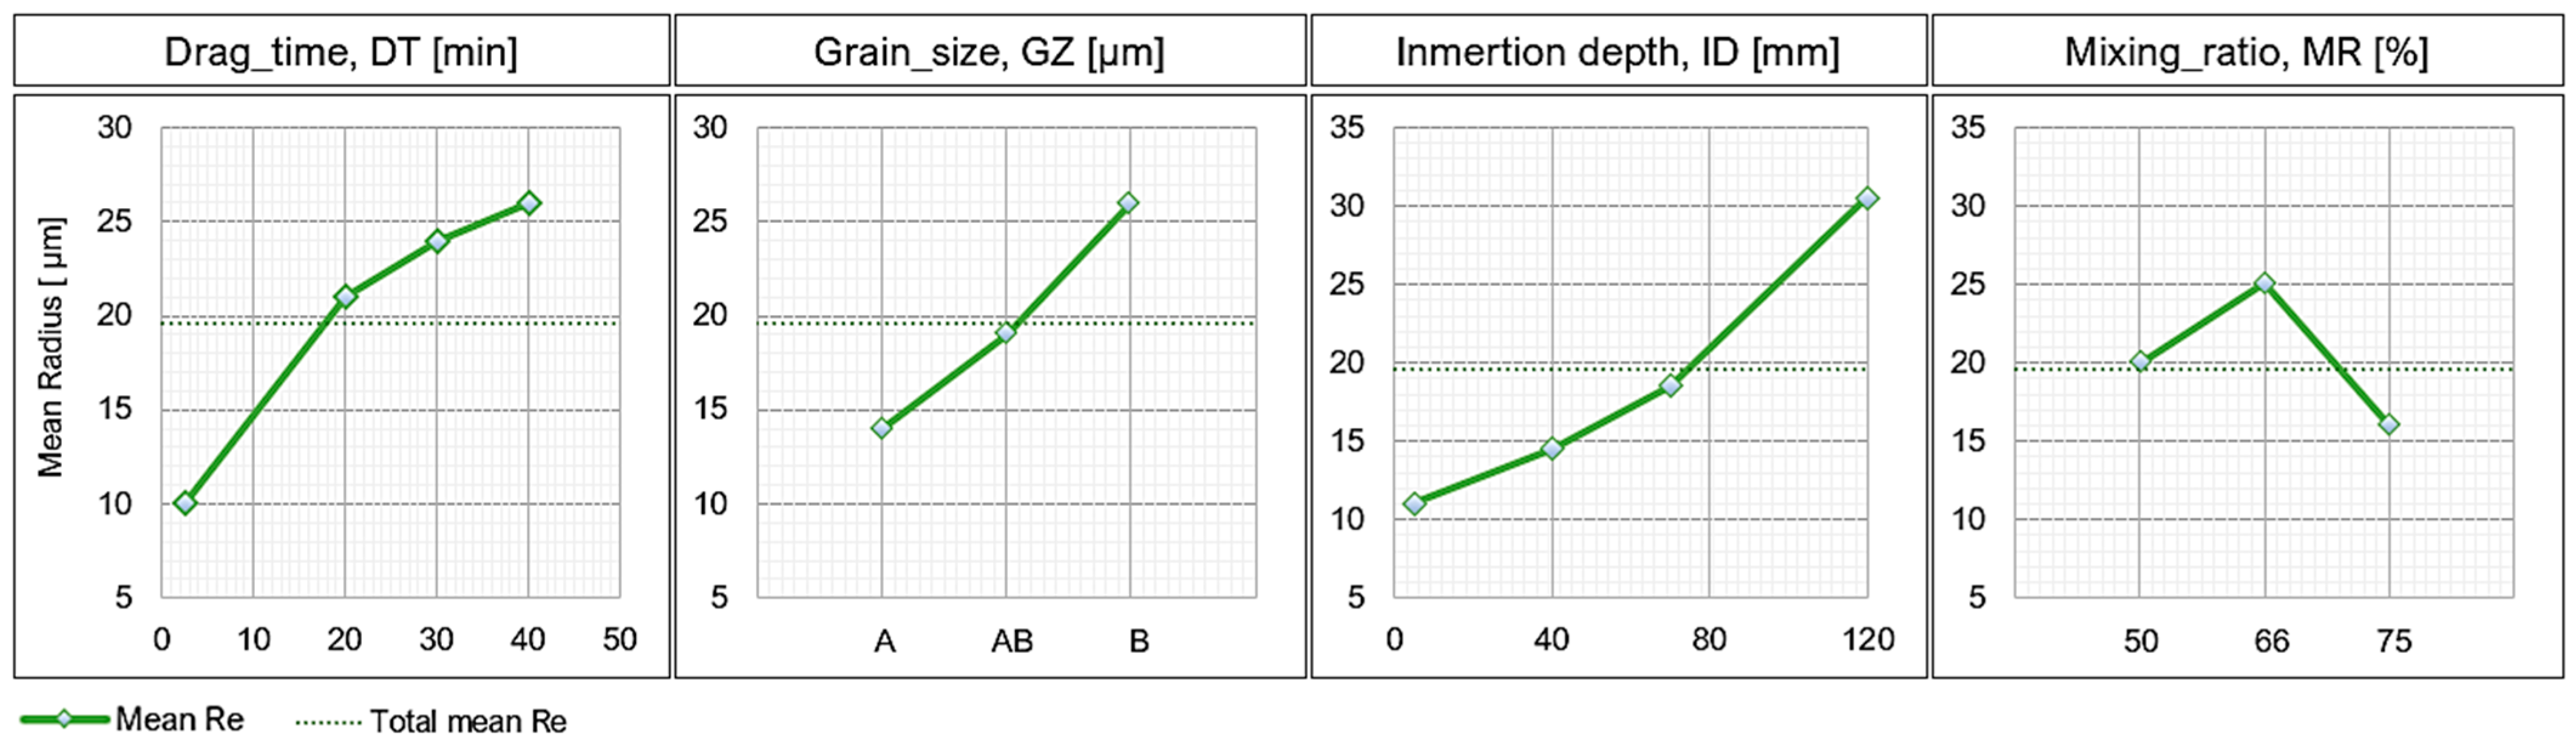
Figure 8.
Combined effect of the drag time DT and the drag depth ID on the cutting edge radius re.

Figure 9.
Combined effect of grain size and drag depth on cutting edge radius re.
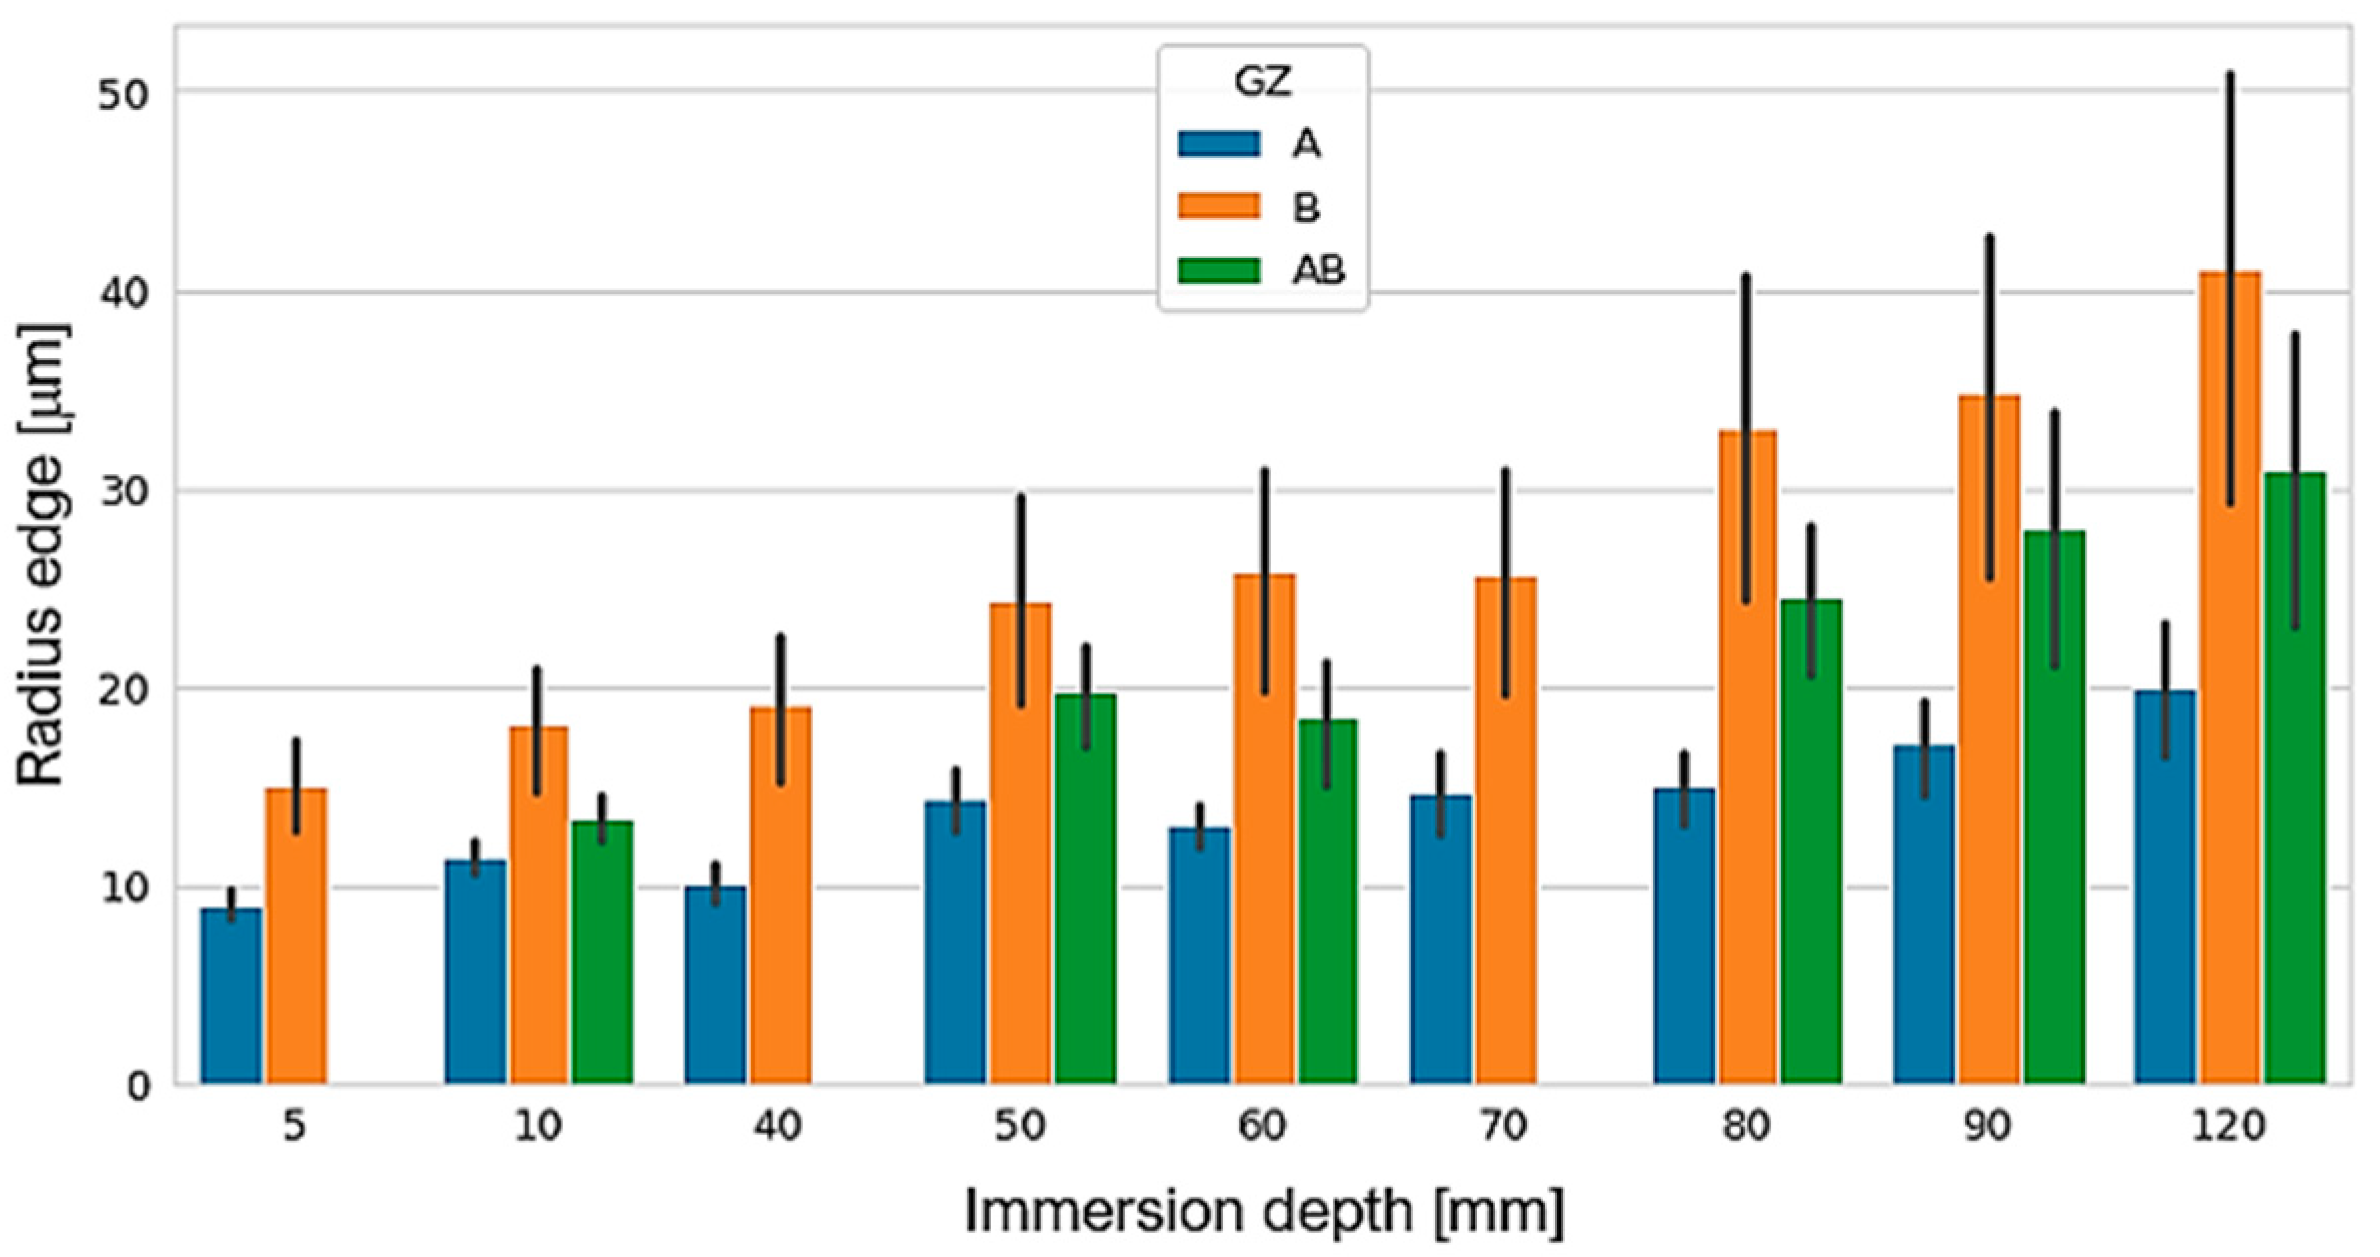
Figure 10.
Material removal area of the three abrasive blends with time variation.

Figure 11.
Improvement of surface defects at the cutting edge, (a) original factory surface, (b) post-treatment improved surface.
Figure 11.
Improvement of surface defects at the cutting edge, (a) original factory surface, (b) post-treatment improved surface.
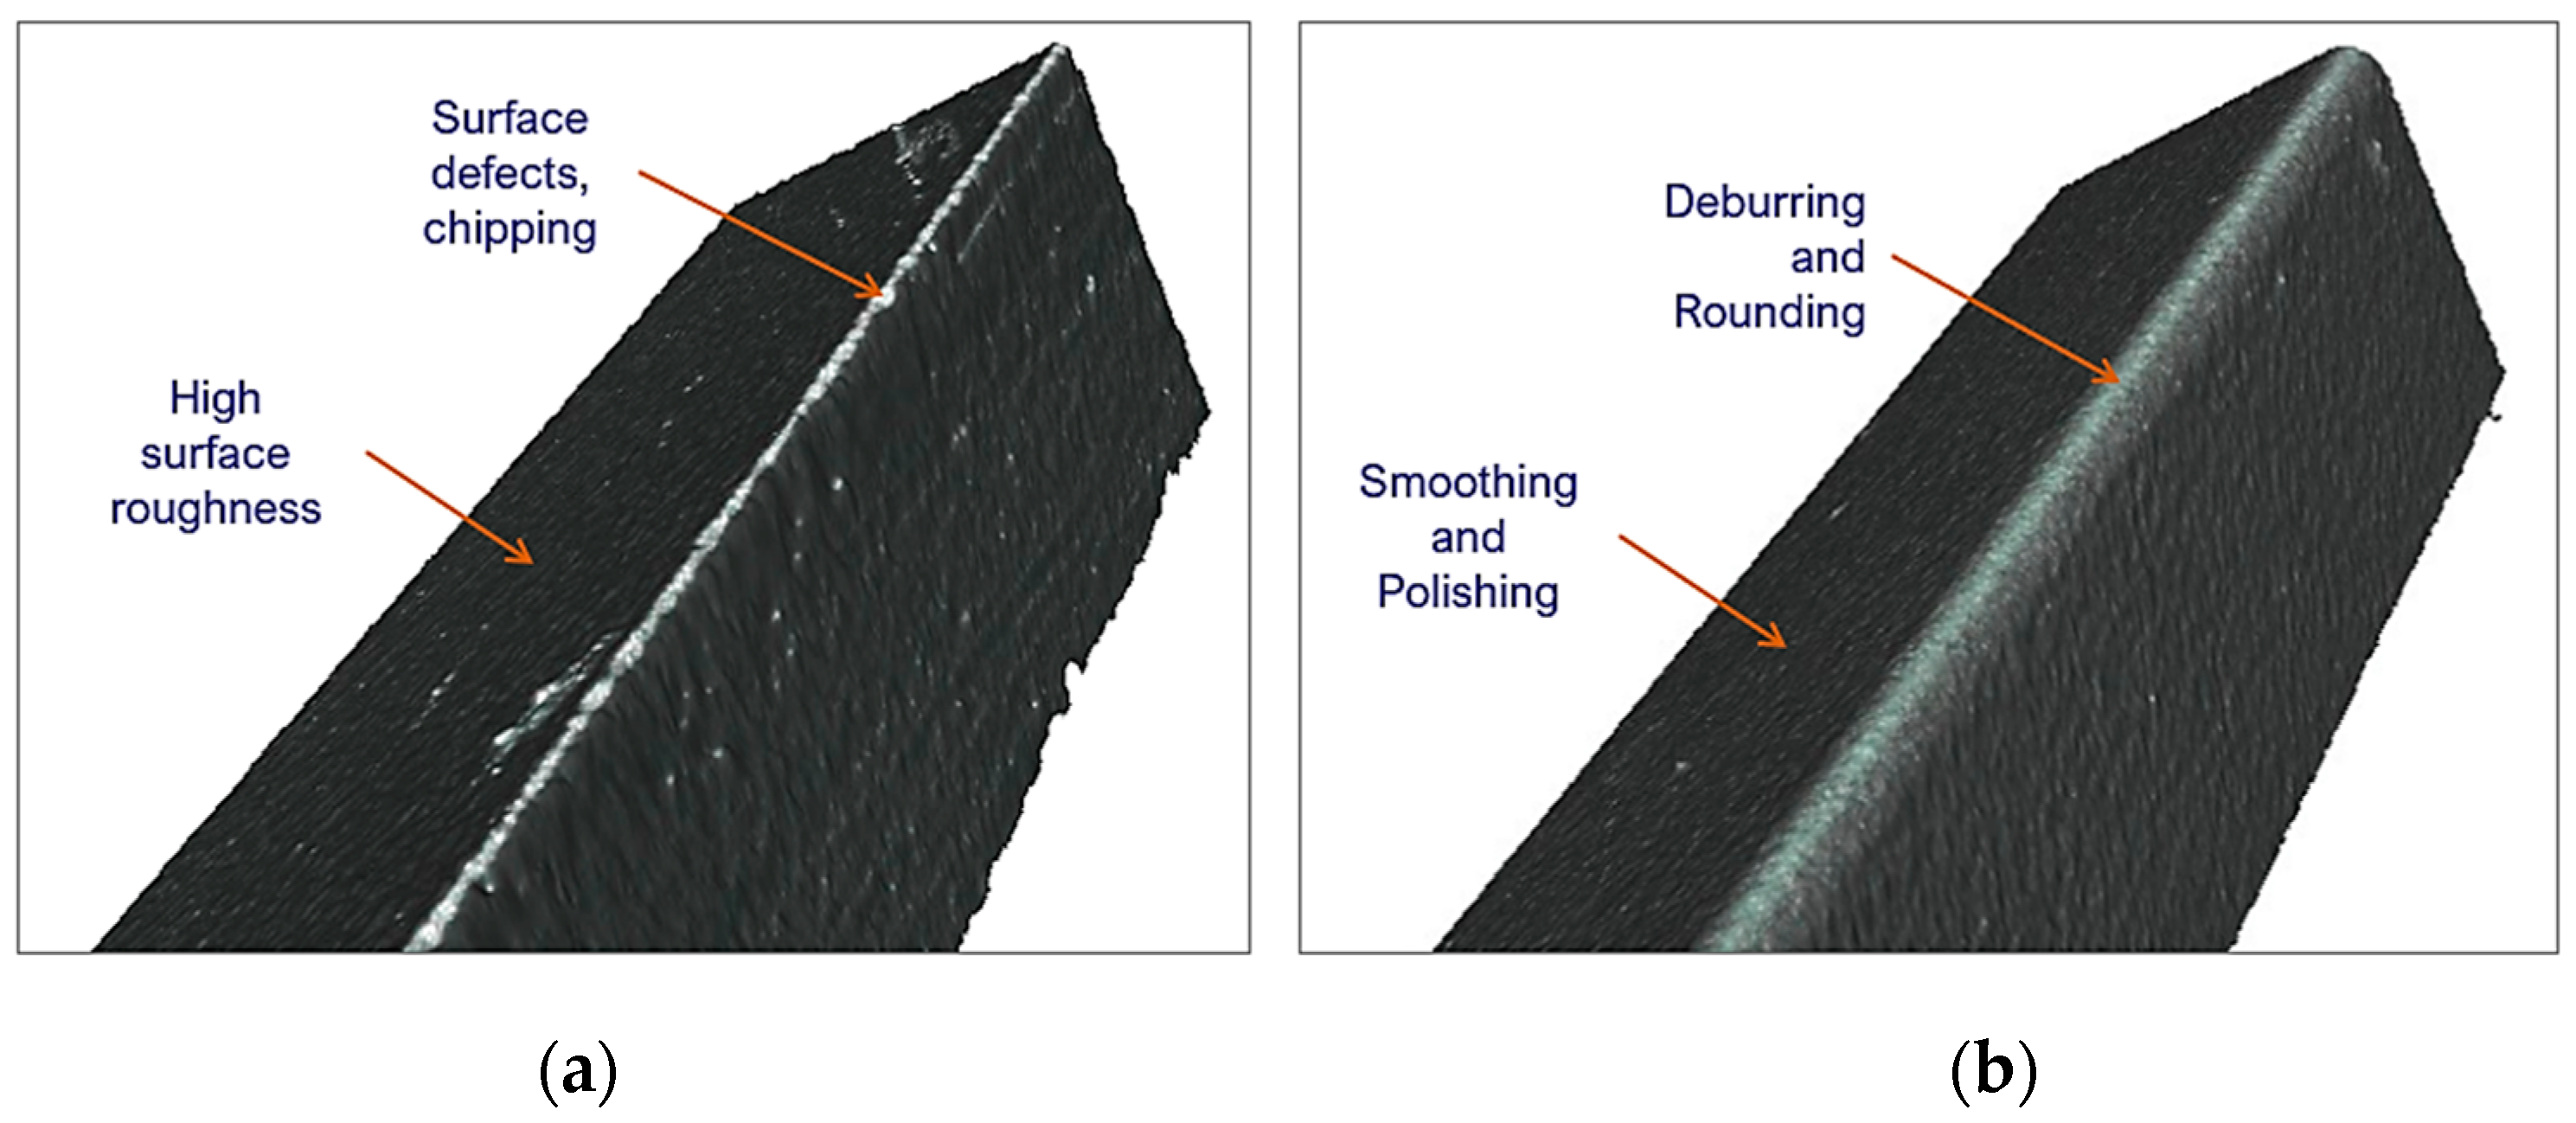
Figure 12.
Behavior of the surface roughness against, (a) percentage of silicon carbide RM, (b) abrasive grain size GZ.
Figure 12.
Behavior of the surface roughness against, (a) percentage of silicon carbide RM, (b) abrasive grain size GZ.

Figure 13.
Measurement system capacity, (a) determination zones, general rule, (b) variability of measurement by technician.
Figure 13.
Measurement system capacity, (a) determination zones, general rule, (b) variability of measurement by technician.

Figure 14.
ANN application prediction errors, (a) mean absolute error (MAE), (b) mean squared error (MSE).
Figure 14.
ANN application prediction errors, (a) mean absolute error (MAE), (b) mean squared error (MSE).
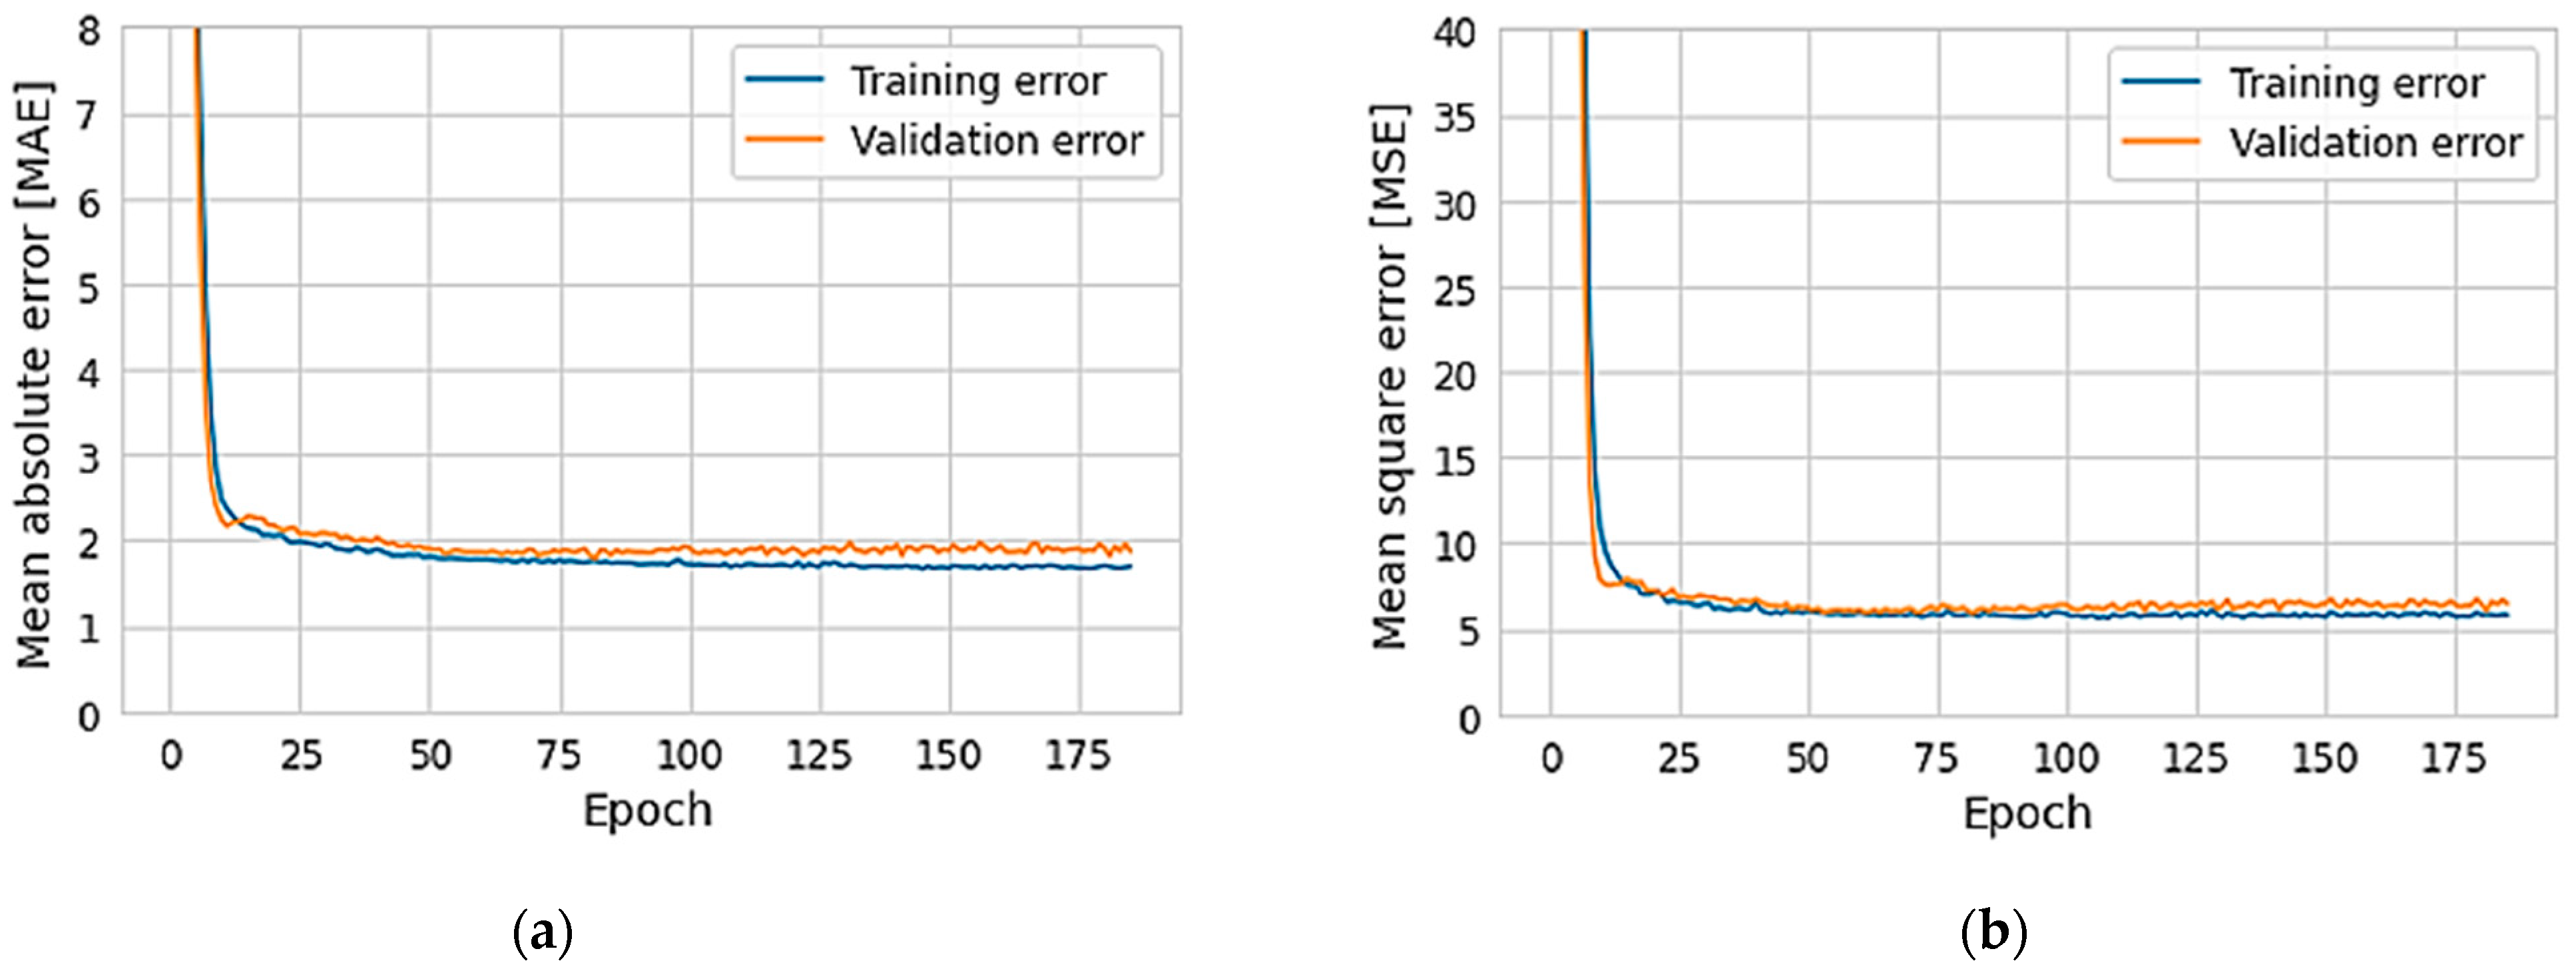
Figure 15.
Comparison of the experimental radius with that predicted by ANN.


Table 1.
Factors levels for experimental application.
| Factors | I | II | III |
|---|---|---|---|
| Abrasive type | SiC | Al2O3 | - |
| Grain size [µm] | 390 (A) | 390 + 750 (AB) | 750 (B) |
| SiC mixing ratio [%] | 50 | 66 | 75 |
| Drag time [min] | 10/10 | 15/15 | 20/20 |
| Drag depth [mm] | 40 | 60 | 80 |
Table 2.
Characterization of the honed cutting edge.
| Fuente | Standard Deviation (SD) | Study Variation (6 × SD) | % Study Variation (% SV) | Variance Component (CV) | % Contribution (CV) |
|---|---|---|---|---|---|
| Gage R&R total | 1.9132 | 11.4793 | 18.49 | 3.660 | 3.42 |
| Repeatability | 1.4676 | 8.8058 | 14.18 | 2.154 | 2.01 |
| Reproducibility | 1.2274 | 7.3643 | 11.86 | 1.506 | 1.41 |
| Technician | 0.2474 | 1.4842 | 2.39 | 0.061 | 0.06 |
| Technician*Ref_measure | 1.2022 | 7.2132 | 11.62 | 1.445 | 1.35 |
| Part to part | 10.1703 | 61.0216 | 98.28 | 103.434 | 96.58 |
| Total variation | 10.3487 | 62.0920 | 100.00 | 107.095 | 100.00 |
Table 3.
Summary of ANN prediction results.
| Data Set | MAE | MSE | R2 |
|---|---|---|---|
| Training | 0.0162 | 0.0585 | |
| Validation | 0.01869 | 0.0643 | 0.937 |
Publisher’s Note: MDPI stays neutral with regard to jurisdictional claims in published maps and institutional affiliations. |
© 2022 by the authors. Licensee MDPI, Basel, Switzerland. This article is an open access article distributed under the terms and conditions of the Creative Commons Attribution (CC BY) license (https://creativecommons.org/licenses/by/4.0/).
Share and Cite
MDPI and ACS Style
Pérez-Salinas, C.F.; del Olmo, A.; López de Lacalle, L.N. Estimation of Drag Finishing Abrasive Effect for Cutting Edge Preparation in Broaching Tool. Materials 2022, 15, 5135. https://doi.org/10.3390/ma15155135
AMA Style
Pérez-Salinas CF, del Olmo A, López de Lacalle LN. Estimation of Drag Finishing Abrasive Effect for Cutting Edge Preparation in Broaching Tool. Materials. 2022; 15(15):5135. https://doi.org/10.3390/ma15155135
Chicago/Turabian StylePérez-Salinas, Cristian F., Ander del Olmo, and L. Norberto López de Lacalle. 2022. "Estimation of Drag Finishing Abrasive Effect for Cutting Edge Preparation in Broaching Tool" Materials 15, no. 15: 5135. https://doi.org/10.3390/ma15155135
Note that from the first issue of 2016, this journal uses article numbers instead of page numbers. See further details here.