Article

Regularities of Structure Formation in 30 mm Rods of Thermoelectric Material during Hot Extrusion

by
Mikhail G. Lavrentev
1,2,
Vladimir T. Bublik
1,
Filipp O. Milovich
1,
Viktoriya P. Panchenko
3,
Yuri N. Parkhomenko
1,3,
Anatoly I. Prostomolotov
4,
Nataliya Yu. Tabachkova
1,5,*,
Nataliya A. Verezub
4,
Mikhail V. Voronov
3 and
Ivan Yu. Yarkov
1
1
Department of Materials Science of Semiconductors and Dielectrics, National University of Science and Technology MISiS, Leninsky Prospekt 4, 119049 Moscow, Russia
2
RMT Ltd., Warshavskoe Shosse 46, 115230 Moscow, Russia
3
State Scientific-Research and Design Institute of Rare-Metal Industry «Giredmet», Elektrodnaya St. 2, 111524 Moscow, Russia
4
Ishlinsky Institute for Problems in Mechanics, Russian Academy of Sciences, 119526 Moscow, Russia
5
Prokhorov General Physics Institute RAS, Vavilova St. 38, 119991 Moscow, Russia
*
Author to whom correspondence should be addressed.
Materials 2021, 14(22), 7059; https://doi.org/10.3390/ma14227059
Submission received: 14 October 2021 / Revised: 12 November 2021 / Accepted: 16 November 2021 / Published: 21 November 2021

Abstract

:
In this study, Ingots of (Bi, Sb)2Te3 thermoelectric material with p-type conductivity have been obtained by hot extrusion. The main regularities of hot extrusion of 30 mm rods have been analyzed with the aid of a mathematical simulation on the basis of the joint use of elastic-plastic body approximations. The phase composition, texture and microstructure of the (Bi, Sb)2Te3 solid solutions have been studied using X-ray diffraction and scanning electron microscopy. The thermoelectric properties have been studied using the Harman method. We show that extrusion through a 30 mm diameter die produces a homogeneous strain. The extruded specimens exhibit a fine-grained structure and a clear axial texture in which the cleavage planes are parallel to the extrusion axis. The quantity of defects in the grains of the (Bi, Sb)2Te3 thermoelectric material decreases with an increase in the extrusion rate. An increase in the extrusion temperature leads to a decrease in the Seebeck coefficient and an increase in the electrical conductivity. The specimens extruded at 450 °C and a 0.5 mm/min extrusion rate have the highest thermoelectric figure of merit (Z = 3.2 × 10⁻³ K−1).

1. Introduction

Bismuth and antimony chalcogenide based solid solutions are the main thermoelectric materials used by the manufacturers of thermoelectric cooling and generator modules [1,2]. The materials of thermoelectric module cells work under severe thermal conditions and loads. The temperature gradients produced in these materials during operation may induce large thermal stresses which can ultimately cause destruction of the material and module cell failure. For this reason, the technology of these materials is the key aspect in the fabrication of thermoelectric devices, its importance being greater when it comes to the fabrication of miniaturized cooling systems for microelectronics, optoelectronics, and laser devices where the thermoelectric material quality and reliability requirements are extremely stringent [3].
Bismuth and antimony chalcogenides have a rhombohedral structure with the R 3 ¯ m symmetry group, and their physical properties are anisotropic [4]. Their parameters, such as their electrical conductivity and heat conductivity in the direction of the third order symmetry axis and in directions perpendicular to this axis, may differ by several times (hence the anisotropy of the thermoelectric figure of merit) [5].
The most widely used technologies of Bi2Te3 based materials are zone melting [6,7,8], spark plasma sintering [9,10,11,12], and hot extrusion [13,14,15]. The preferable technology is hot extrusion for which plastic strain produces a predominant grain orientation (i.e., a texture) in the polycrystalline material and, as a result, the final ingots exhibit good mechanical and thermoelectric properties [16,17,18].
Hot extrusion technology is a well-known and practically important process for synthesizing bismuth telluride-based thermoelectric materials. However, the need to increase the process output and the product quality gives impetus to permanent improvement of both the geometry of the dies used and the process parameters (e.g., die extrusion rate) [19,20].
The aim of this work is to obtain homogeneous 30 mm diameter ingots of (Bi, Sb)2Te3 solid solutions by hot extrusion and to study the effect of process parameters on the structure and thermoelectric properties of the material.

2. Materials and Methods

The p-type conductivity (Bi, Sb)2Te3 thermoelectric material was synthesized by direct smelting of the raw components taken in the stoichiometric ratio in quartz ampoules at 750 °C. The synthesis duration was 2 h. The raw components for solid solution synthesis were as follows: 99.999 wt.% pure tellurium, 99.999 wt.% pure antimony, 99.999 wt.% pure bismuth. The synthesized material was crushed in an XS-10 blade mill (Hebei, China). The as-milled powder size was <500 μm. The thermoelectric material powder was preliminary compacted in an IP2500 M auto hydraulic press (Armavir, Russia) with a specific pressure force of 3 g/cm2. The hot extrusion process was carried out in the following mode: temperature 400 ÷ 500 °C, extrusion rate 0.1 ÷ 0.5 mm/min, and extrusion coefficient 10.
The structure of the samples was studied by X-ray diffraction and scanning electron microscopy (SEM). The samples for X-ray diffraction studies were disks with a diameter of 30 mm and a thickness of 3 mm, which were cut from different parts of the extruded rod perpendicular to the axis of extrusion. After cutting, a broken layer is formed on the surface of the samples, the structure of which differs from the structure in the volume of the material. Before the study of the structure, the samples were etched in a solution of HBr and K2Cr2O7 (1:1) for 5 min to remove the broken layer.
The phase composition of the specimens was studied by X-ray diffraction on a Bruker D8 instrument (Karlsruhe, Germany) with CuKα incident radiation. The scan time per step was fixed to 1 s with the step size of 0.02° in the 2θ range of 15°–105°. The fine structure (crystallite size and microdeformations) was assessed by comparing the broadening of the first and second order diffraction peaks (HKL and 2H2K2L) using the reference profile. The reference was an as-annealed Bi0.4Se1.6Te3 solid solution powder. The texture was characterized by plotting reciprocal pole figures based on the X-ray diffraction patterns taken for sections perpendicular to the extrusion axis (so as to evaluate the probability of coincidence between poles for different planes and the extrusion axis). The statistical weights of the poles were calculated with normalization with respect to the calculated reflection intensities. The morphology of bulk specimens was characterized under a scanning electron microscope (JSM-6480LV, JEOL, Tokyo, Japan). The grain size was determined using an SEM of the cleaved surfaces. The samples were chipped at room temperature. As chalcogenide grains cleave preliminarily along the cleavage planes of the chalcogenide structure, the cleaved surfaces show the grain structure of the material. The sizes of the cleaved structural features were assessed using the intercept method.
The thermoelectric parameters (electrical conductivity, Seebeck coefficient, thermal conductivity, and thermoelectric figure of merit) of the materials were measured using the Harman method at room temperature on 2.5 × 2.5 × 4.0 mm3 samples cut from the ingots parallel to the extrusion axis [21,22].

3. Results

The extrusion technology has a number of specific features which may deleteriously affect the electrophysical properties of extruded branches. The large strain developed in the extruded material triggers processes which may destabilize the properties of the branches and impair their parameters.
The conditions of extrusion process (die shape, strain temperature and rate, amount of strain and workpiece structure) affect the final structure and properties of the extruded material. One effective method of studying the effect of plastic molding parameters on the structural parameters of the thermoelectric material is to develop a mathematical simulation of the extrusion process.
A mathematical simulation of extrusion process can deliver information on a number of process parameters that cannot be studied experimentally such as stress, strain, and strain rate fields both at the final stage and in evolution during rod extrusion. Mathematical simulation provides the possibility of compare the evolution of these parameters with the development of the structure and to identify the process stages which prove to be the most critical ones for the structure formation in extruded rods. Simulation of virtual extrusion processes under various boundary conditions (in particular for different die designs given the same rod diameter) provides an opportunity to significantly reduce the effort for the fabrication of expensive equipment. The regularities of the hot extrusion process for 30 mm diameter rods of the (Bi, Sb)2Te3 thermoelectric material were analyzed by the joint use of elastic-plastic body approximations.

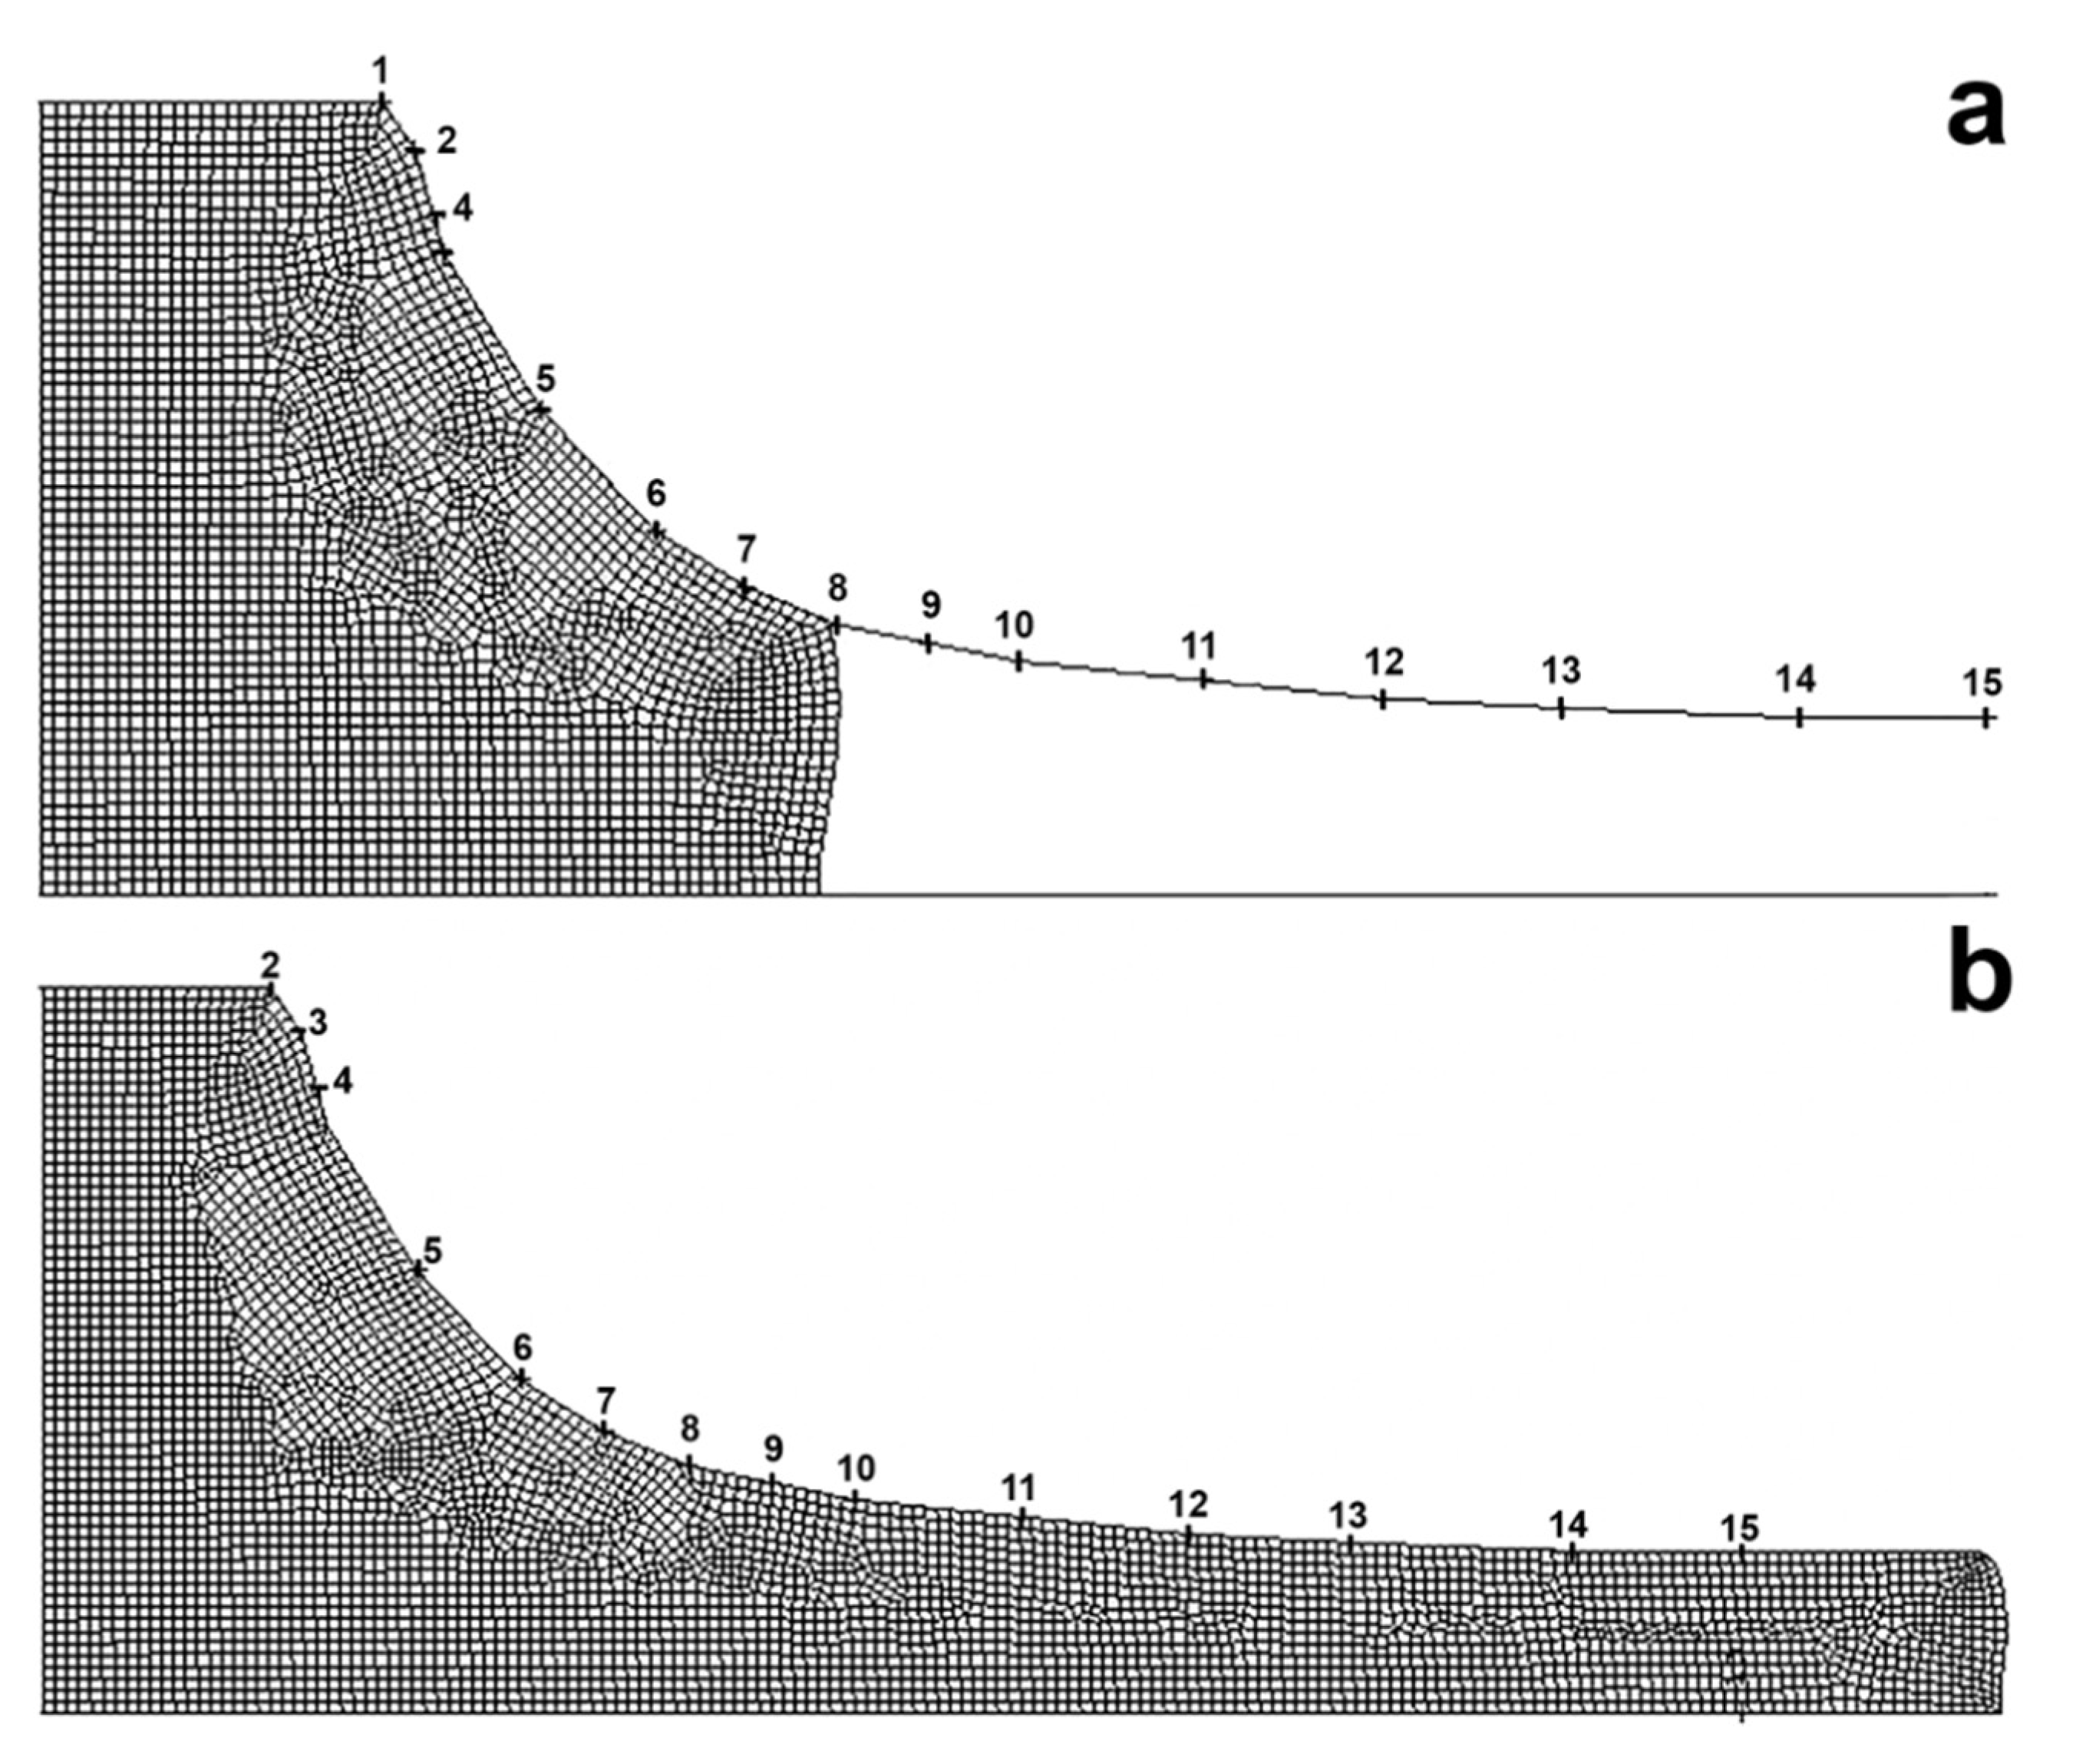
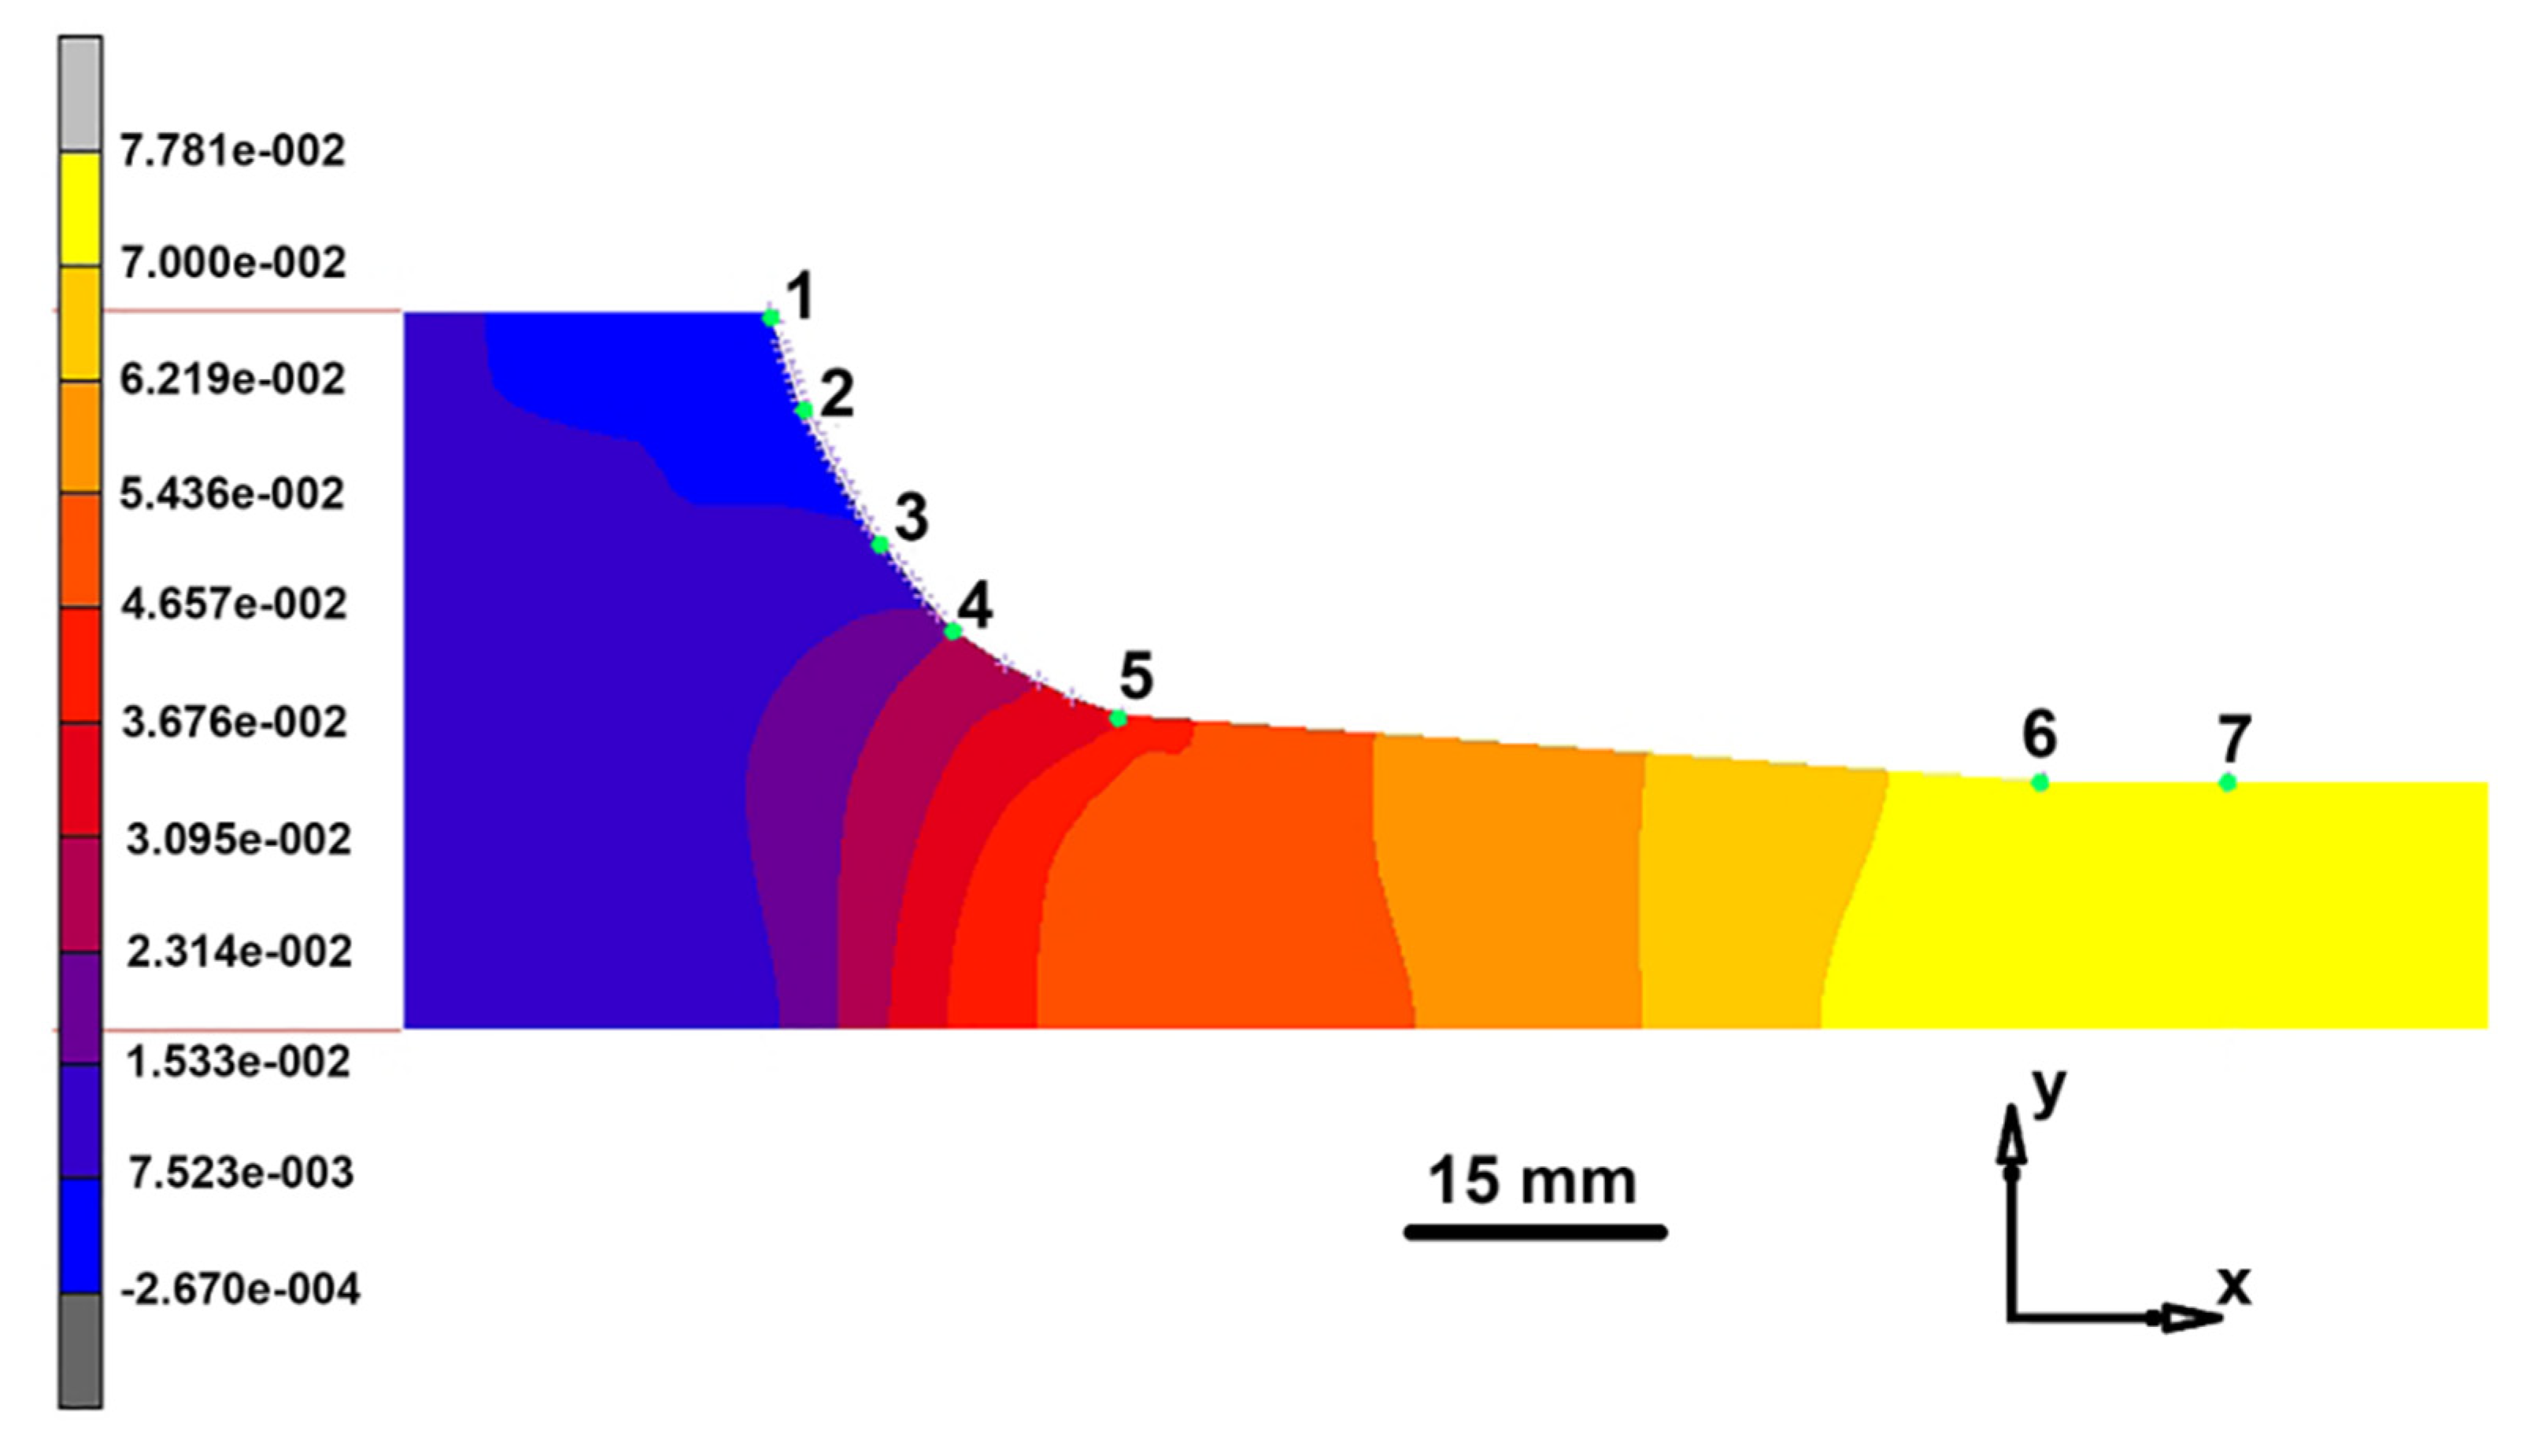
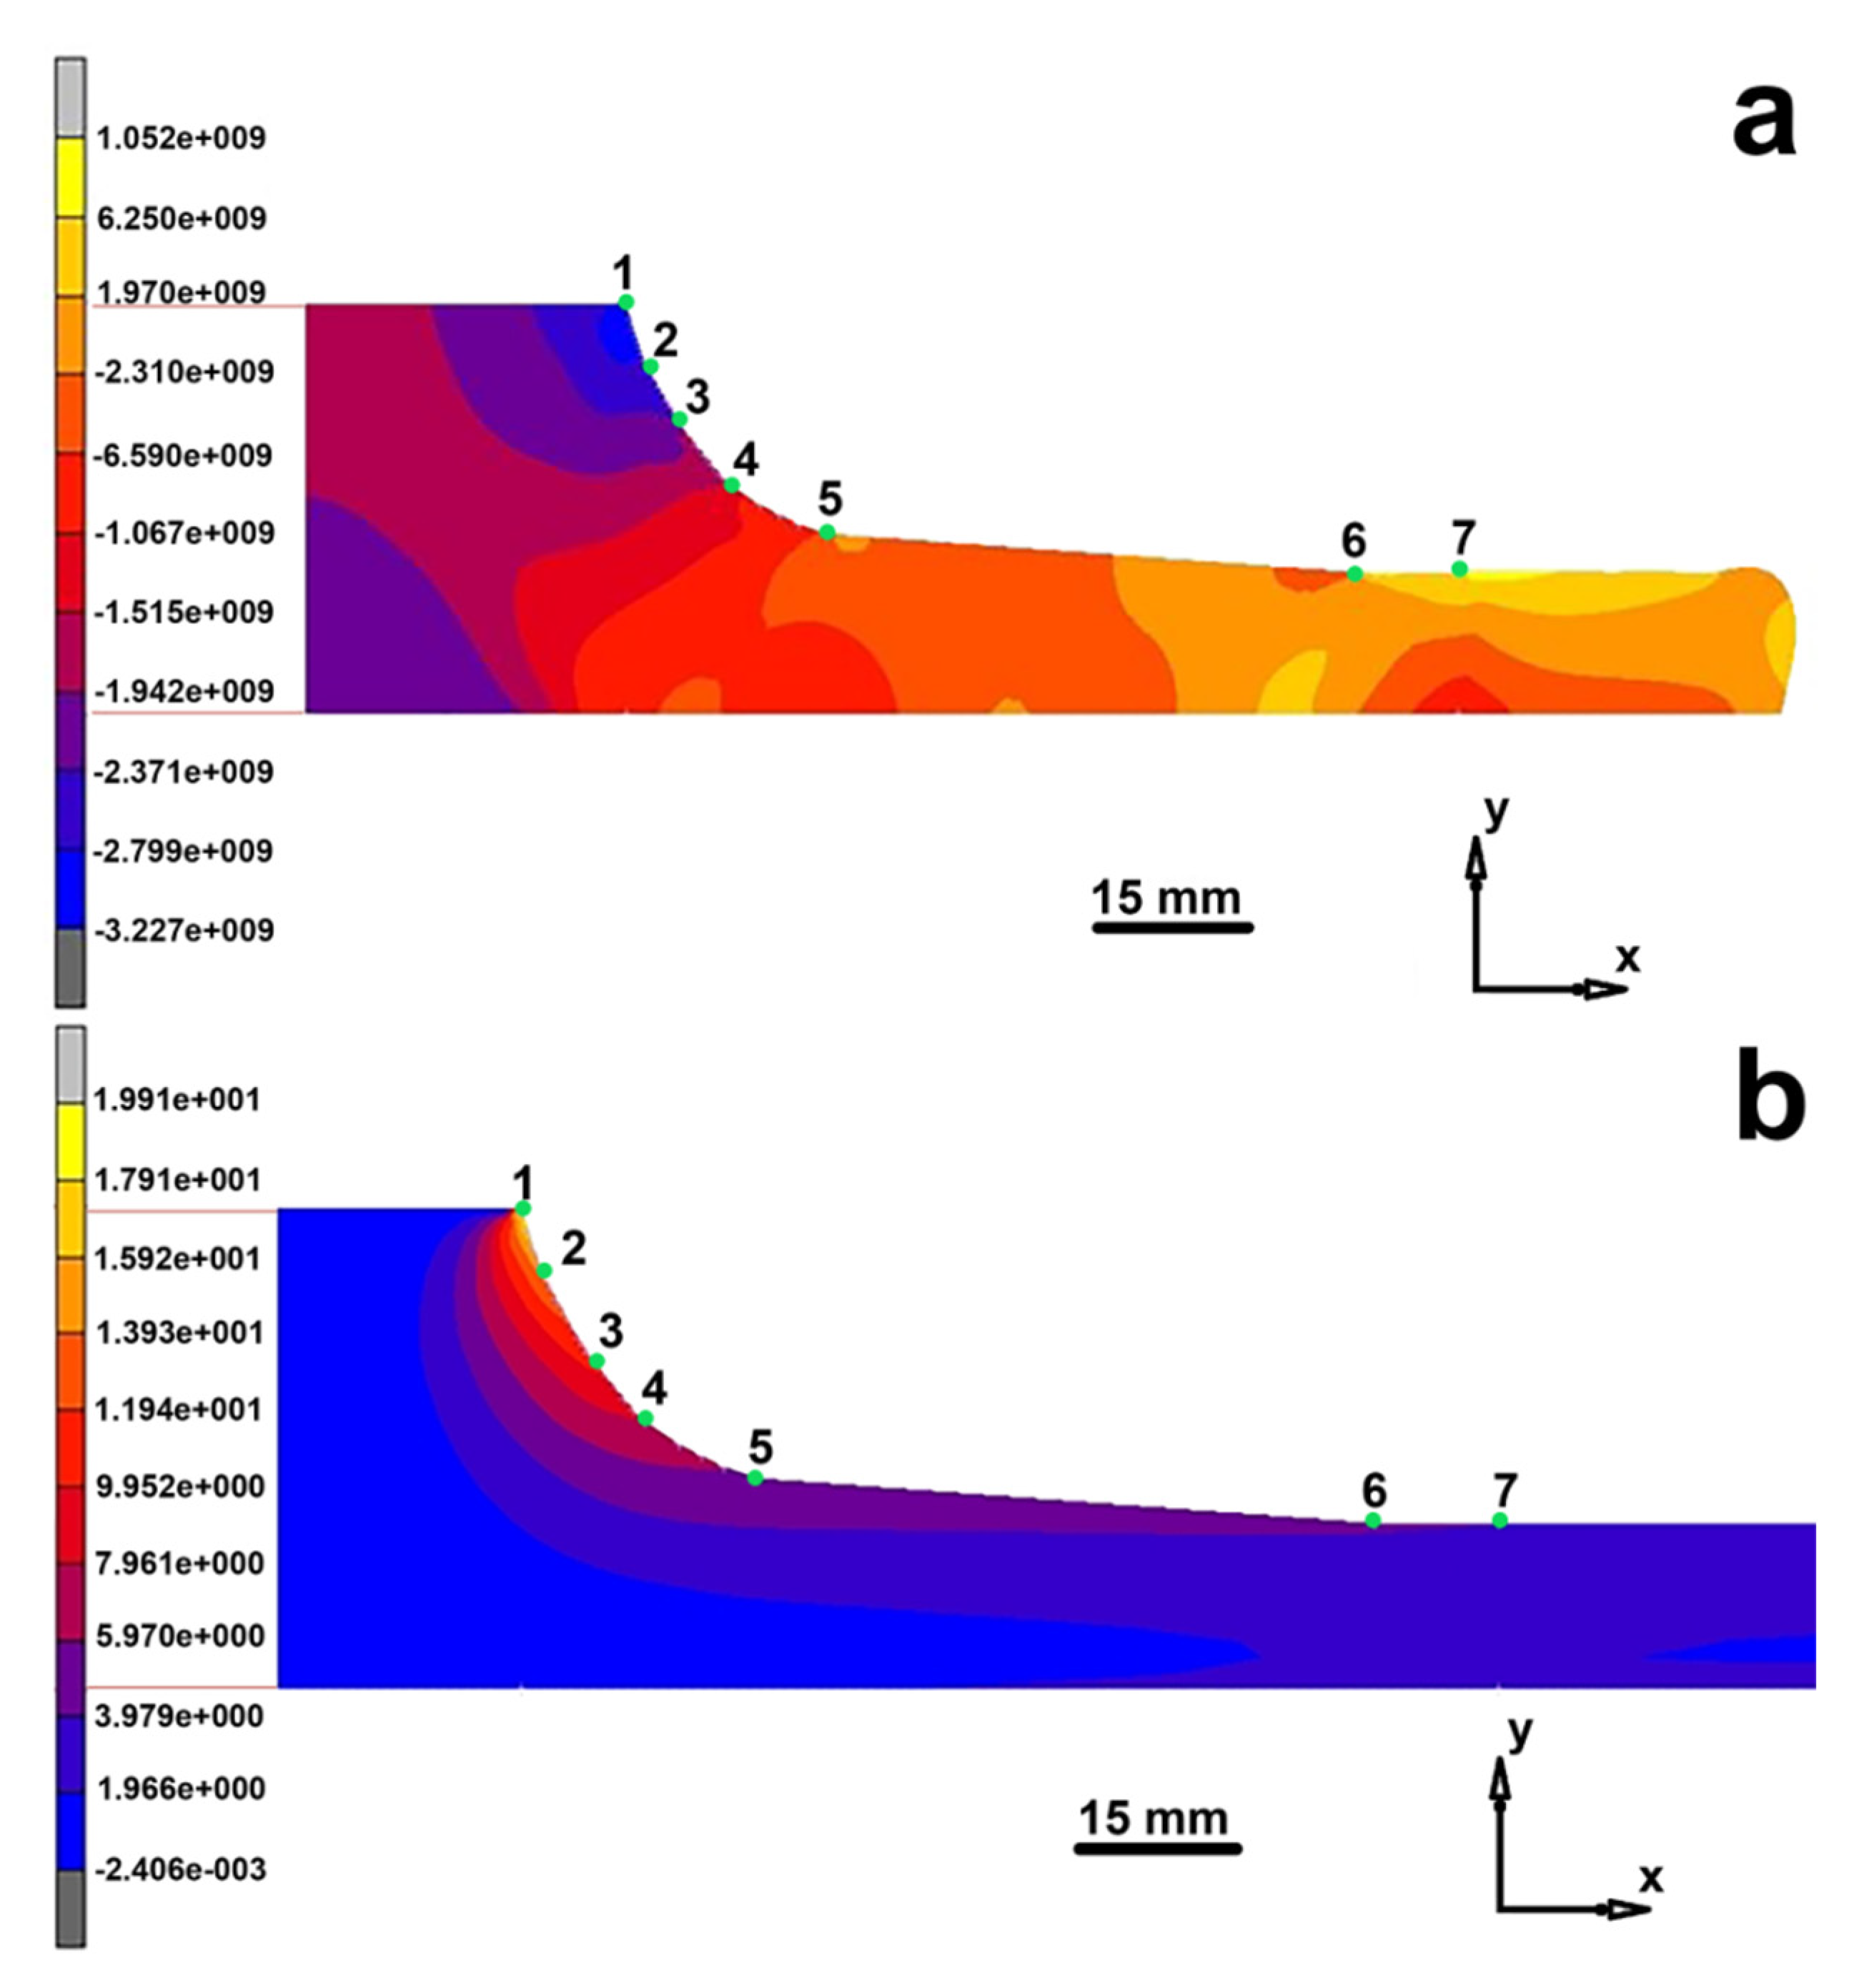
3.1. Mathematical Simulation of Extrusion Process

The scheme of the hot extrusion process for mathematical simulation is shown in Figure 1. In accordance with the schematic presented above, the geometrical parameters of the hot extrusion plant were set up as follows: D = 85 mm is the diameter, L = 26 mm is the length of the workpiece, and θ = 60 deg is the die rounding angle; l = 10 mm is the length and d = 30 mm is the diameter of the cylindrical section at the die output. Also, a process rate of V = 0.1 mm/s was set up. The D2/d2 parameter describes the hot extrusion process efficiency and is referred to as the extrusion ratio.
The physical and mechanical parameters of the process were chosen in accordance with earlier work [19]: E = 40 GPa is Young’s modulus, ν = 0.3 is Poisson’s ratio, and σo = 102 MPa is the elastic to plastic transition threshold stress. The elastic to plastic transition is illustrated in the stress vs. strain graph in Figure 2. As reported earlier [19], the friction coefficient between the workpiece and the die is 0.04. The model takes the friction into account but the calculations ignored it due to the process uses graphite lining for workpiece slipping.

3.1.1. Methodical Approach to Calculation of Elastic-Plastic Strains during Hot Extrusion

The methods used in this work are based on a solid-state approach and joint use of elastic and plastic body approximations in accordance with the fundamentals of the elasticity and plasticity theory [23]. Thermal stresses can be ignored for hot extrusion processes. A detailed justification of the choice of this approximation was reported earlier [24]. Data on an alternative approach based on the mechanics of rheological liquid media were provided elsewhere [25] for cold extrusion of high plasticity materials. We will now consider the fundamentals of the elastic-plastic approximation used in this work.
The dependence between stresses and strains for an elastic isotropic body are as follows: if σ1, σ2, σ3 and ε1, ε2, ε3 are the main stresses and strains then, considering them as being related to the main axes, one can establish the following relationship between them:
σ1 = (λ + 2G) ε1 + λ ε2 + λ ε3, σ2 = λ ε1 + (λ + 2G) ε2 + λ ε3, σ3 = λ ε1 + λ ε2 + (λ + 2G) ε3
where λ is the Lamé coefficient and G is the shear modulus. Young’s modulus E determines the relationship between the stress and the relative elongation during tension:
E = σ1/ ε1 = G(3λ + 2G)/(λ + G)
Poisson’s ratio determines the relationship between the transverse strain and the longitudinal strain:
ν = λ/2(λ + G)
The strain continuity equation is as follows:
2εx/∂y2 + ∂2εy/∂x2 = ∂γxy/∂x∂y
The stress balance equations are as follows:
∂σx/∂x + ∂τyx/∂y + ∂τzx/∂z + ρX = 0    
∂τxy/∂x + ∂σy/∂y + ∂τzy/∂z + ρY = 0
∂τxz/∂x + ∂τyz/∂y + ∂σz/∂z + ρZ = 0
The invariants are as follows:
I1 = σx + σy + σz, I2 = − (σyσz + σzσx + σxσy) + τ2yx + τ2zx + τ2xy
When the plasticity conditions are considered, the hydrostatic pressure is excluded from the common set of equations and the remainder is referred to as the deviator of stresses and it is accepted that the latter parameter determines the onset of the plastic transition and is the only tool to for expressing the plasticity condition. The average stress is determined as follows:
s = (σx, σy, σz)/3 = (σ1, σ2, σ3)/3
which is an invariant value. The stress deviator is determined by the components sx, sy, sz, syz, szx, sxy in accordance with the following equations:
sx = σx − s, sy = σy − s, sz = σz − s, syz = τyz, szx = τzx, sxy = τxy
The strain components determine the average strain:
e = (εx, εy, εz)/3 = (ε1, ε2, ε3)/3
Then the strain deviator components ex, ey, ez, eyz, ezx, exy are determined by the following expressions:
ex = εx − e, ey = εy − e, ez = εz − e, eyz = γyz, ezx = γzx, exy = γxy
The mathematical notation of the plasticity condition follows from the Tresca condition [23] of the greatest tangent stresses, which states that plastic strain onsets at the point where the greatest tangent stresses reach the value σo/2 which is the constant of a material. Since the greatest tangent stresses are (σ1 − σ3)/2, Trask’s condition is written as follows:
1 − σ3) = (s1 − s3) = σo
This condition determines the similar values of the yield stress σo for uniaxial tension and compression. One of the requirements imposed on the plasticity condition is its invariance with respect to the coordination axes. Moreover, it is assumed that the average normal stress does not affect the plasticity and that, therefore, the plasticity condition can only be expressed in stress deviator components. This results in the necessity of studying the invariance of the stress deviator. The stress invariants J1, J2, J3 are introduced formally and by analogy with the stress invariants I1, I2, I3:
J1 = sx + sy + sz, J2 = − (sysz + szsx+ sxsy) + s2yx + s2zx + s2xy
The simplest case corresponds to J2, which is considered constant and referred to as the von Mises condition:
2J2 = s21 + s22 + s23 = 2σo2/3 or (σ2 − σ3)2 + (σ3 − σ1)2 + (σ1 − σ2)2 = 2σo2/3
where σo is the constant of the material.
In accordance with the von Mises condition [23], flow occurs when the shape change elastic strain energy reaches the characteristic value for the material in question.
Ignoring elastic strains we will consider plastic flow for a two-dimensional (2D) case. The principal stress in the z axis direction will then be ½(σ1 + σ2). In this case the von Mises plasticity condition takes on as follows: σ1 − σ2 = 2k, where k= σo/31/2. For the stress components along the xy axes, this expression follows:
¼(σx − σy)2 + ∂τxy2 = k2
For a 2D case the stress balance Equation (5) have the following form:
∂σx/∂x + ∂τxy/∂y = 0
∂τxy/∂x + ∂σy/∂y = 0
Repeatedly differentiating Equation (15) and subtracting it, we obtain taking into account Equation (11) the following:
2τxy/∂x2 − ∂2τxy/∂y2 = ± 2∂2/∂x∂x√ (k2 − τxy2)
Equation (16) is solved relative to τxy. From the calculated stresses one can find the strain rate:
sx = 2φε’x, sy = 2φε’y, sxy = 2φγ’xy
The tangential friction stress is related to the stress normal to the surface by the following relationship: σt = −μσn t, or for acting forces: ft = −μfn t, where ft is the tangential friction force, fn is the normal force, σt is the tangential friction stress, σn is the normal stress, μ is the friction coefficient, and t is the tangential vector in the velocity direction.

3.1.2. Results of Mathematical Simulation of Extrusion Process

The extrusion process was simulated using the Crystmo/Marc finite elements simulation complex [26]. The mathematical model developed allowed us to carry out a virtual simulation of extrusion process which resulted in the extrusion of cylindrical specimens 20 and 30 mm in diameter. During the calculation, the computational (Lagrange’s) mesh and the specimen shape changed in time at sequential steps of the extrusion process, suggesting that the specimen output from the die starts as early as in 150 s.
For cylindrical specimen 20 mm in diameter the main zones of the stress-strain specimen state have been analyzed in [27], which determine its strength (the high compression zone) and quality (the structure formation zone and the potential longitudinal cracking zone) for the stage of specimen output from the die.
For cylindrical specimens 20 mm in diameter, Figure 3 shows the evolution of the computational (Lagrange) mesh and the specimen shape in time at sequential steps of the extrusion process, suggesting that the specimen output from the die starts as early as 140 s.
For cylindrical specimen 30 mm in diameter the distributions of the plastic flow velocity V isocontours suggest that at an early process stage (t = 90 s), the flow velocity is higher at the die wall. This is accounted for by the greater contribution of material pressing from the sides (Zone 1) to the center where the compression degree is the highest. However, at the stage of specimen output from the die (t = 360 s) the radial flow profile changes so that the flow velocity in the center becomes greater than near the die wall (Figure 4).
The key parameter for analysis of the stress-strain state of specimens is the time corresponding to the start of specimen output from the die. The absolute mass transport velocity in the conical section of the die (marks 6 and 7) and at the die output is 0.78 mm/s. Near the die surface (marks 1 and 2) the extruded material undergoes counter flow, its zone being expanded in the course of extrusion until the end of the process.
In article [27], similar data corresponding to Figure 4 and Figure 5 are cited for 20 mm rod extrusion process.
Figure 5 shows the distributions of the principal maximum stresses and total maximum strains for extrusion of a 30 mm diameter rod.
The stress distribution shown in Figure 5 suggests that at the die throat between side marks 1 and 4 the stress is negative, varying from −280 to −27 MPa which corresponds to a reduction of the tensile stress with an increase in the distance from the press position. Downstream of mark 4 the stress sign changes and the corresponding compression stress reaches approximately 75 MPa. Below marks 6–7 (at the cylindrical die section) and in the free part of the specimen, the radial stress inhomogeneity spans from 67 MPa compression (at the die wall) to 70 MPa tension (in the specimen center). The overall radial stress scatter in the specimen at the die output is about 70% of the respective scatter for extrusion of a 20 mm diameter rod. The strain distribution suggests that the greatest strain (7.0 and 14.0) is developed at the corner point of the die (Figure 5b, marks 1–2). Between marks 2 and 5 the strain decreases to 3.7. Below marks 6–7 and in the free part of the specimen, the strain decreases to 1. This section exhibits radial strain scatter corresponding to the respective changes in the stress state of this specimen section. The comparison of two variants of the die (20 and 30 mm in diameter) shows that more homogeneous strain is developed during a hot extrusion through 30 mm die.

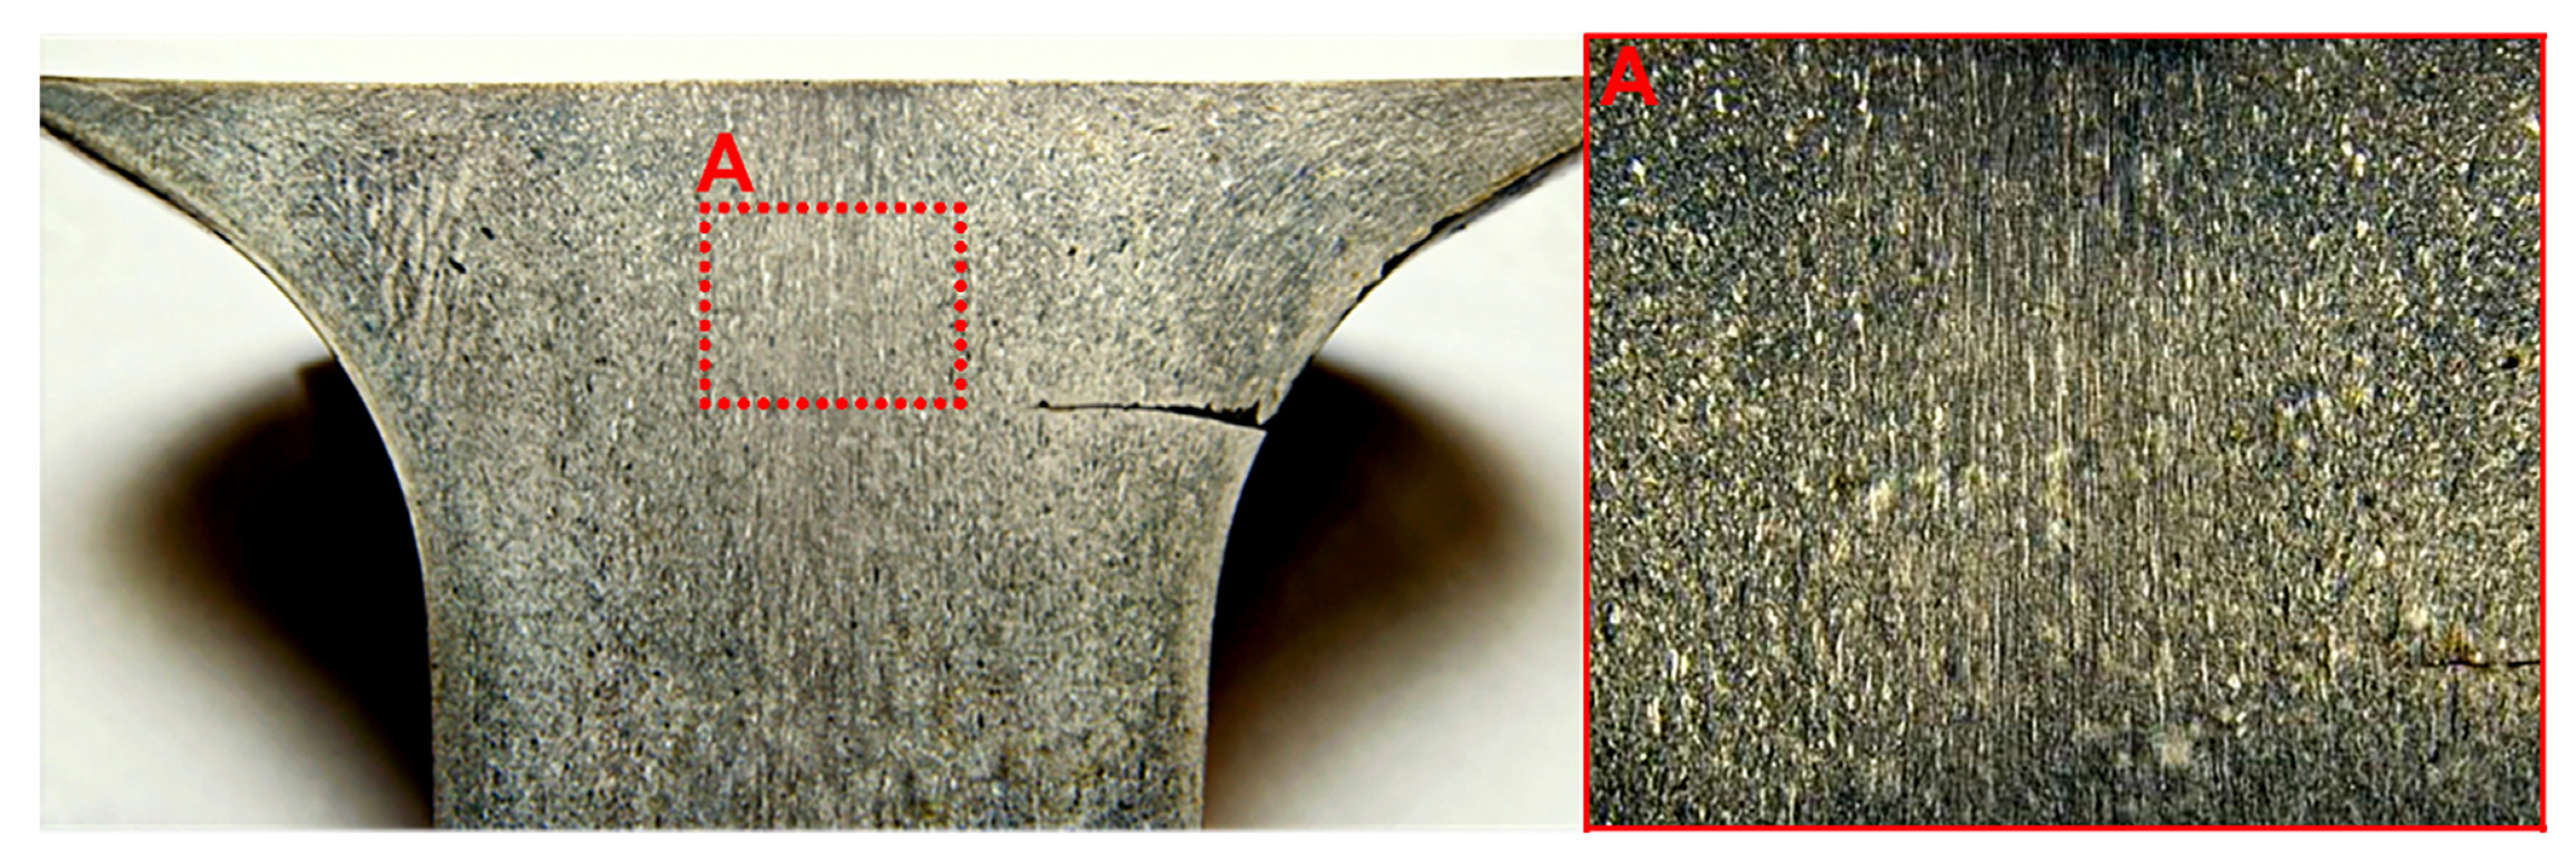
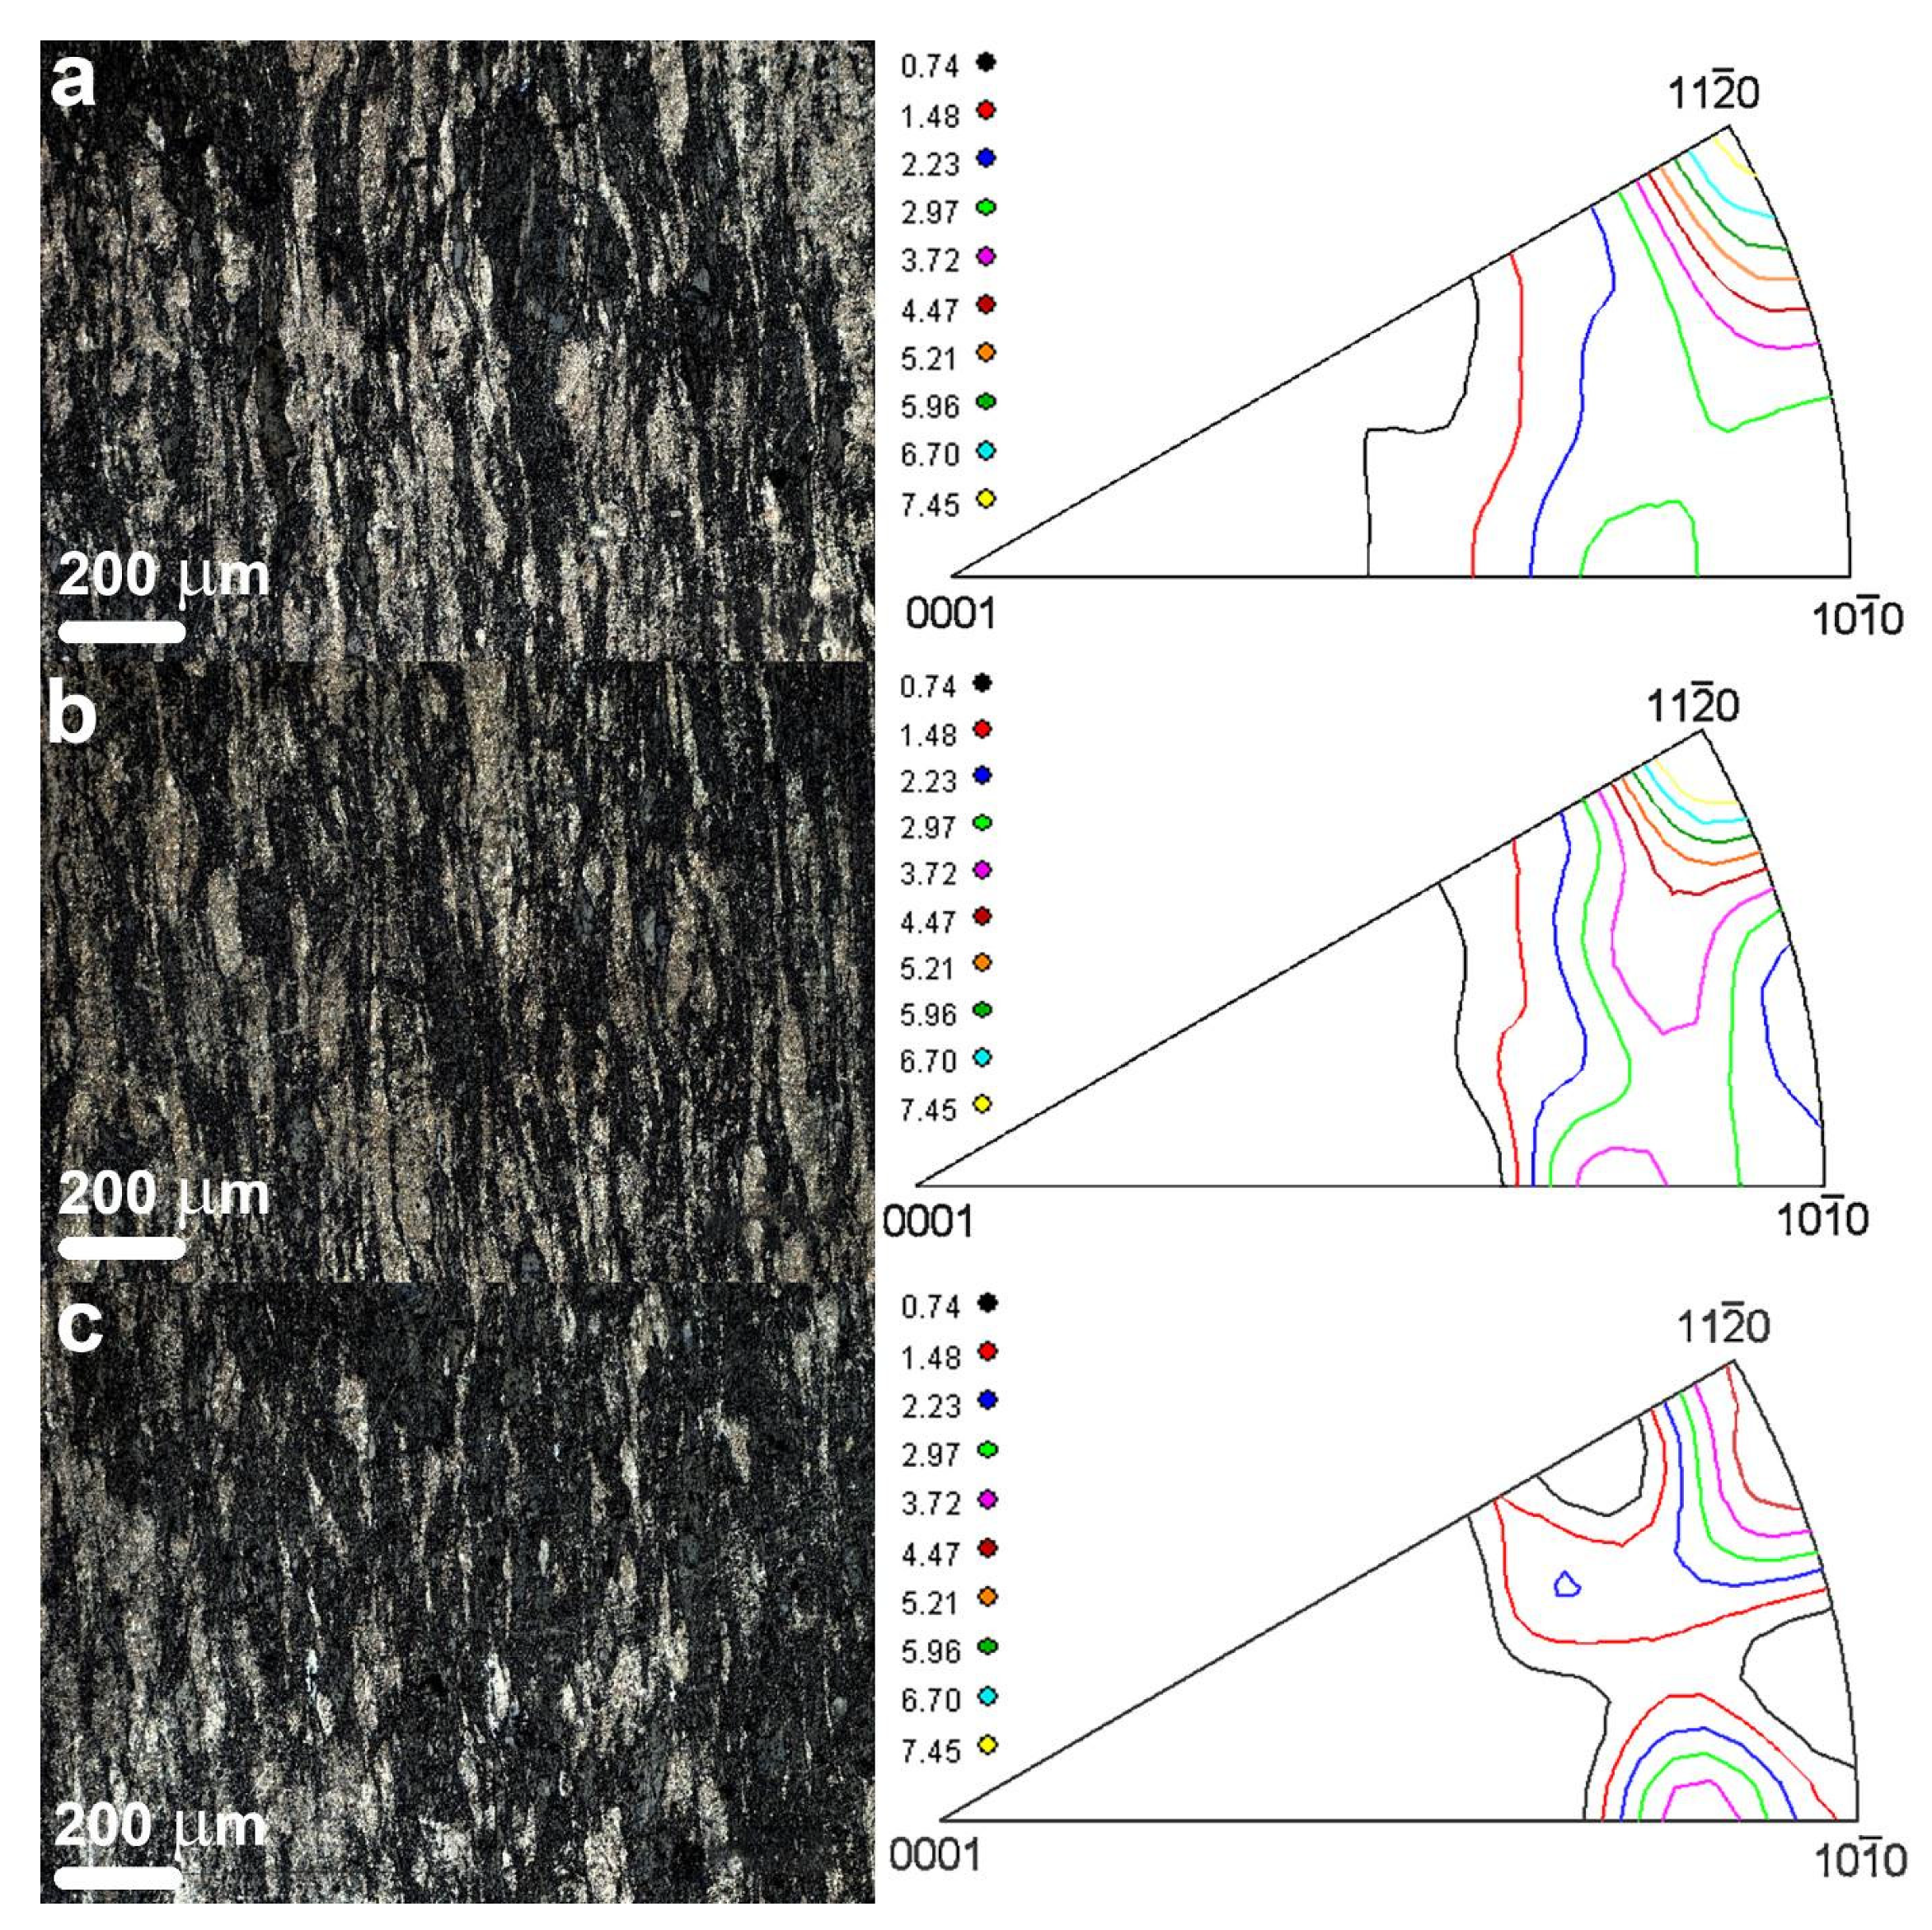
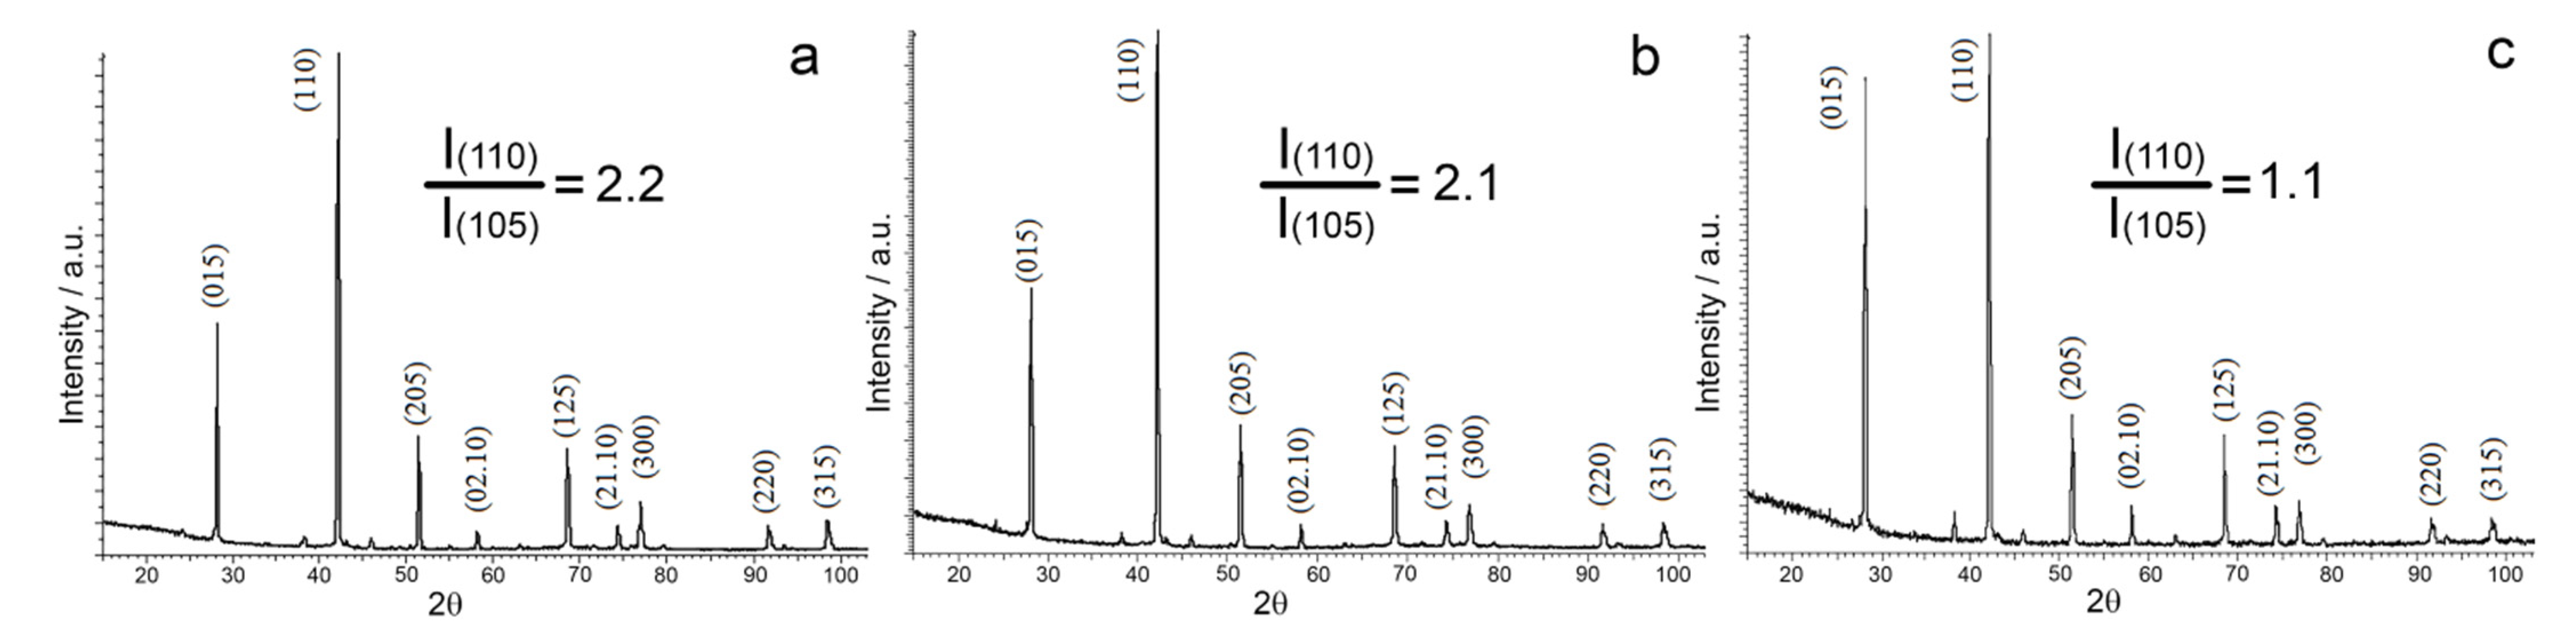
3.2. Structural Study of Extruded Rod

Structural study of 30 mm diameter extruded rods of (Bi, Sb)2Te3 solid solution showed that the initial press workpiece has a texture in which the (0001) cleavage planes are perpendicular to the strain direction. A strain texture starts to form in the center of the transition zone. Thereafter, the strain texture develops, the predominant grain orientation being such that the (0001) cleavage planes are parallel to the extrusion axis. The microstructure image presented in Figure 6 shows elongated grains or grain agglomerations along the extrusion axis. The extruded rod has a channel in the center in which the flow of material is far more intense as compared with the rest of the initial section of the extruded rod. This strain pattern can be accounted for by opposite pressing of the material by the outer layers.
Figure 7 shows the microstructure and inverse pole figures of wafers cut out from the working part of the rod perpendicularly to the extrusion axis. The microstructure image clearly resolves grains or grain agglomerations with close orientations elongated in the extrusion direction. The elongation and orientations of the grains reflect the plastic flow pattern and its radial homogeneity. The texture of the extruded rod is almost similar in the longitudinal direction, the predominant grain orientation being with the cleavage planes parallel to the extrusion axis.
Figure 8 shows diffraction patterns for wafers cut out from the middle part of the extruded rod for different extrusion temperatures.
Phase analysis data suggest that all of the test materials are single phase. The diffraction patterns exhibit only the (Bi, Sb)2Te3 solid solution reflections. However, the diffraction peak intensity ratio varies depending on extrusion temperature. For the purposes of illustration, Figure 8 shows intensity ratio between the (110) line for which the cleavage planes are parallel to the extrusion axis and the most intense line for the textureless material (105). With an increase in the extrusion temperature, the texture of the material degrades. As the extrusion temperature grows from 430 to 450 °C, there is a slight change in the intensity ratio of the diffraction peaks, whereas the quantity of the grains whose cleavage planes are parallel to the texture axis remains almost the same at these temperatures. The texture degradation becomes considerable as the extrusion temperature increases to 470 °C. The texture of the material does not change noticeably depending on extrusion rate. An increase in the extrusion rate leads to a decrease in the quantity of defects in the grains. Table 1 summarizes characteristics of the fine structure of the material, i.e., sizes of coherent scattering regions (CSR) and microstrain.
Fine structure characterization (determination of coherent scattering region sizes and microstrain) of the test material showed that the microstrain degree decreases with an increase in the extrusion rate. The average size of coherent scattering regions depends on the extrusion rate (albeit slightly).
Figure 9 shows images of the cleave surface structure for solid solutions obtained at different extrusion rates. Since bismuth and antimony chalcogenide based solid solutions are cleaved mainly along their cleavage planes, their cleave surface images exhibit textures reflecting the grain structure of the material. Specimens extruded at different temperatures have almost similar sizes of structural features (about 1–5 μm). Only the cleave surface image of the specimen extruded at 470 °C shows pores (Figure 10c). These pores can be seen both along the grain boundaries and inside the grains. Pore formation at this extrusion temperature can be accounted for by coagulation of point defects and/or changes in stoichiometry due to tellurium evaporation.

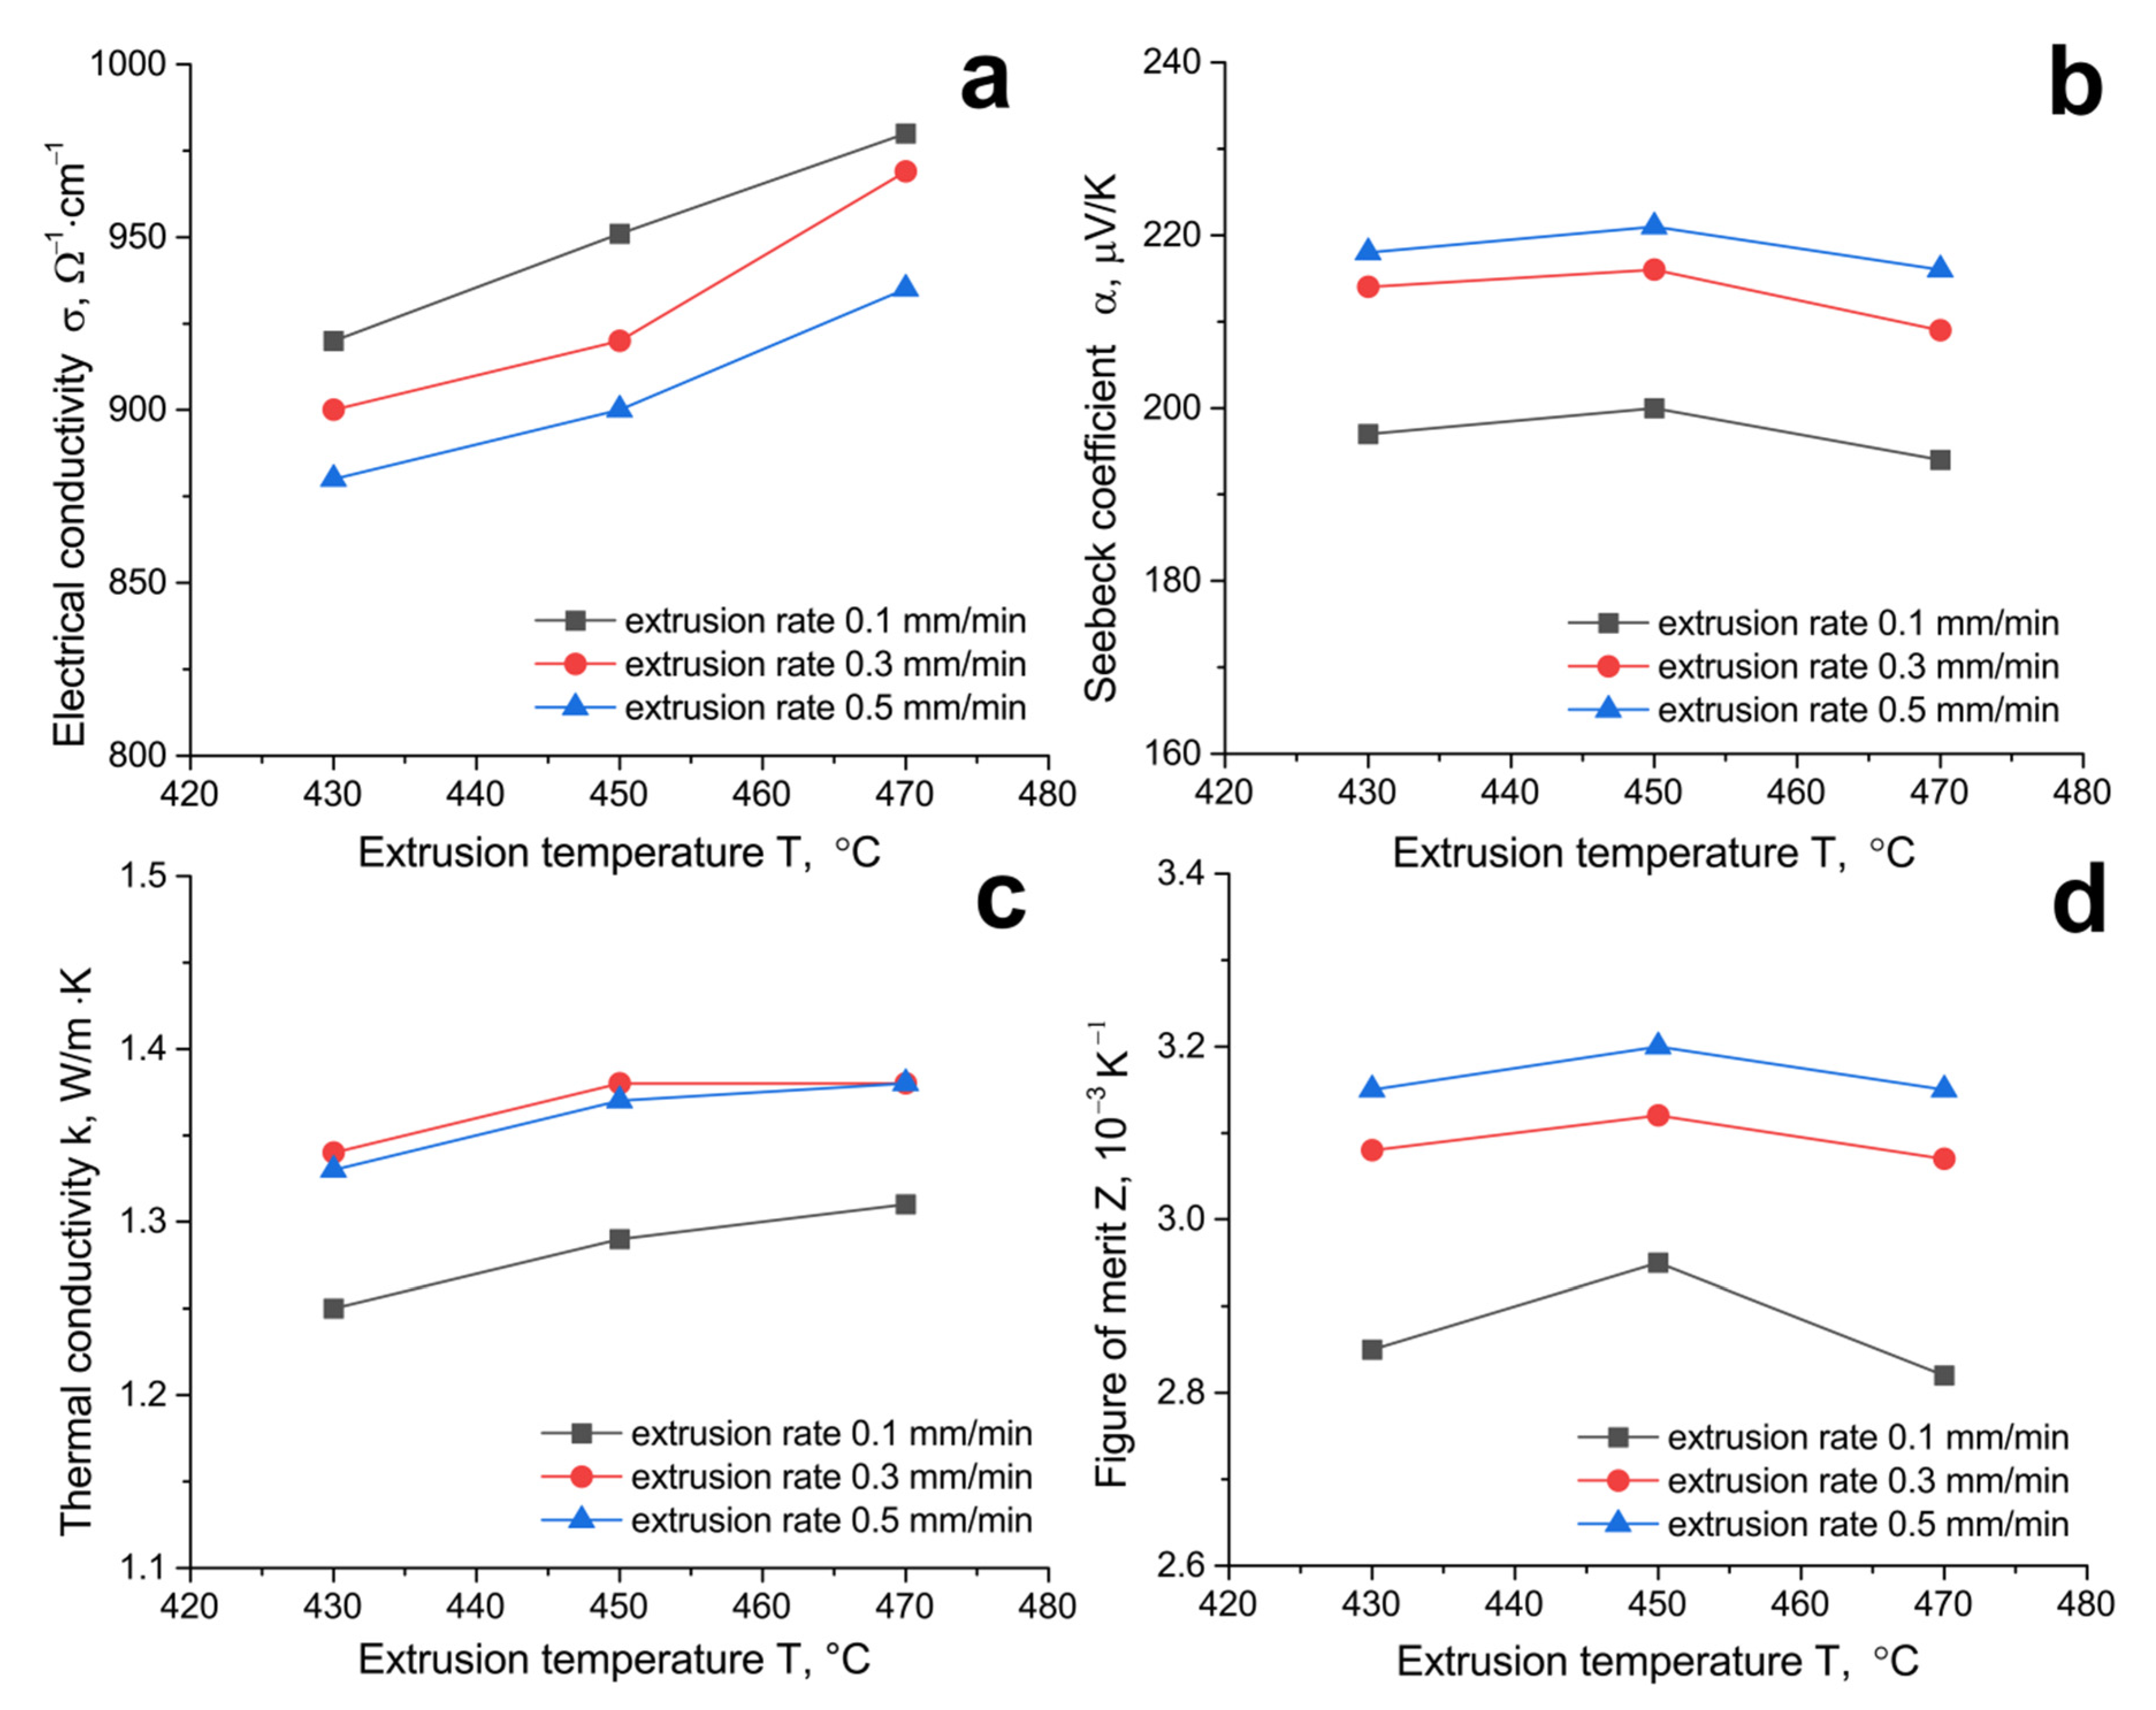
3.3. Thermoelectric Properties of Extruded (Bi Sb)2Te3 Solid Solutions Depending on Extrusion Temperature and Rate

Figure 10 shows electrical conductivity, Seebeck coefficient, thermal conductivity, and thermoelectric figure of merit as a function of extrusion temperature for different extrusion rates.
As can be seen from the data presented in Figure 10, an increase in the extrusion temperature leads to an increase in the electrical conductivity of the solid solutions. At each experimental extrusion temperature, the electrical conductivity of the solid solutions decreases with an increase in the extrusion rate. The Seebeck coefficient increases slightly with an increase in the extrusion temperature from 430 to 450 °C and decreases noticeably with an increase in the extrusion temperature to 470 °C. The dependence of thermal conductivity on the extrusion temperature correlates well with the electrical conductivity curves. The minimum value of thermal conductivity has a sample obtained at an extrusion rate of 0.1 mm/min. This is explained by the fact that at a low value of the extrusion rate, the compaction process proceeds with the formation of many structural defects. The thermal conductivity of the samples obtained at an extrusion rate of 0.3 and 0.5 mm/min practically does not differ at comparable extrusion temperatures. At comparable extrusion temperatures, the Seebeck coefficient increases with an increase in the extrusion rate. The thermoelectric figure of merit changes nonmonotonically with an increase in the extrusion temperature and has a clear peak at a 450 °C extrusion temperature. Similarly, the Seebeck coefficient changes in Figure 10b. An increase in the extrusion rate leads to an increase in the thermoelectric figure of merit. The specimens extruded at 450 °C with a 0.5 mm/min extrusion rate have the highest thermoelectric figure of merit (Z = 3.2 × 10⁻³ K−1).
When the extrusion temperature changes from a temperature of 430 °C to 450 °C, the values of electrical conductivity and the Seebeck coefficient simultaneously increase, and the study of the fine structure shows a decrease in the value of microdeformations at a temperature of 450 °C. Such a change in the electrophysical parameters is probably due to a decrease in grain defects and an increase in the mobility of the main charge carriers. Comparison between the data on the structure and properties of the material suggests that primary recrystallization onsets at 470 °C and leads to structure degradation. Furthermore, boundary migration during primary recrystallization changes the carrier concentration. On the one hand, deformed defects that produce acceptor levels are annealed and, on the other hand, point defects are generated during high-angle boundary migration in the course of recrystallization. In our opinion, the acceptor levels are associated with defect formation during plastic strain due to the intersection of dislocations migrating in different slip planes. Since the main type of defects in the bismuth telluride based solid solutions are tellurium vacancies and cation atoms in antisite positions, the thermal impact during extrusion may cause bismuth atoms to substitute tellurium ones in the antisite positions. Both of these mechanisms lead to the formation of acceptor centers.
The hypothesis of the onset of primary recrystallization in the p-type conductivity material at 470 °C is confirmed by electrophysical data since the electrical conductivity increases and the Seebeck coefficient decreases at this temperature. This change of the electrophysical parameters is caused by an increase in the carrier concentration which is plausible since the defect generation is the most intense at the recrystallization center formation temperature.
The data on the structure and thermoelectric properties reported herein suggest that the optimum extrusion temperature for the (Bi, Sb)2Te3 solid solutions is 450 °C. At this extrusion temperature, the materials do not contain pores and have a fine-grained structure with a clear axial texture for which the cleavage planes of the grains are oriented along the extrusion axis.

4. Conclusions

30 mm diameter ingots of the (Bi, Sb)2Te3 thermoelectric material were produced by hot extrusion. Mathematical simulation showed that extrusion through a 30 mm diameter die produces a homogeneous strain. Variations of the process temperature revealed regularities in the structure formation and allowed us to choose the optimum extrusion mode for the selected temperature range. We show that p-type conductivity (Bi, Sb)2Te3 solid solutions with the best properties are obtained at a 450 °C extrusion temperature. At this extrusion temperature, the strain texture is retained and pores do not form. We show that the quantity of defects in the grains of the (Bi, Sb)2Te3 solid solutions decreases with an increase in the extrusion rate. The specimens extruded at 450 °C with a 0.5 mm/min extrusion rate have the highest thermoelectric figure of merit (Z = 3.2 × 10⁻³ K−1).

Author Contributions

Conceptualization, M.G.L. and N.Y.T.; methodology, V.T.B.; computer simulation, A.I.P.; validation, M.G.L., N.Y.T. and V.T.B.; formal analysis, V.P.P.; investigation, V.P.P., M.V.V., I.Y.Y., N.Y.T. and M.G.L.; resources, N.Y.T. and Y.N.P.; data curation, N.Y.T.; writing—original draft preparation, N.A.V.; writing—review and editing, M.G.L. and N.Y.T.; visualization, F.O.M.; supervision, N.Y.T.; project administration, Y.N.P.; funding acquisition, N.Y.T. All authors have read and agreed to the published version of the manuscript.

Funding

The reported study was funded by RFBR, project number 20-32-90051.

Institutional Review Board Statement

Not applicable.

Informed Consent Statement

Not applicable.

Data Availability Statement

The study did not report any data.

Acknowledgments

Computer simulation was supported by the Ministry of Science and Higher Education within the framework of the Russian State Assignment under contract No. AAAA-A20-120011690136-2. The study of the structure was carried out on the equipment of the Center Collective Use “Materials Science and Metallurgy” with the financial support of the Russian Federation represented by the Ministry of Education and Science (agreement No. 075-15-2021-696).

Conflicts of Interest

The authors declare no conflict of interest.

References

  1. Lavrentev, M.G.; Drabkin, I.A.; Ershova, L.B.; Volkov, M.P. Improved Extruded Thermoelectric Materials. J. Electron. Mater. 2020, 49, 2937–2942. [Google Scholar] [CrossRef]
  2. Parashchuk, T.; Sidorenko, N.; Ivantsov, L.; Sorokin, A.; Maksymuk, M.; Dzundza, B.; Dashevsky, Z. Development of a solid-state multi-stage thermoelectric cooler. J. Power Sources 2021, 496, 229821. [Google Scholar] [CrossRef]
  3. Pourkiaei, S.M.; Ahmadi, M.H.; Sadeghzadehm, M.; Moosavi, S.; Kumar, R. Thermoelectric cooler and thermoelectric generator devices: A review of present and potential applications, modeling and materials. Energy 2019, 186, 115849. [Google Scholar] [CrossRef]
  4. Kozhemyakin, G.N.; Belov, Y.S.; Parashenko, A.N.; Artemov, V.V.; Soklakova, O.N. Morphology and nanostructured features in BiSbTe and BiSeTe solid solutions obtained by hot extrusion. Mater. Sci. Eng. B 2021, 271, 115270. [Google Scholar] [CrossRef]
  5. Skipidarov, S.; Nikitin, M. Novel Thermoelectric Materials and Device Design Concepts, 1st ed.; Springer: Basel, Switzerland, 2019; pp. 3–21. [Google Scholar]
  6. Zheng, Y.; Xie, H.; Shu, S.; Yan, Y.; Li, H.; Tang, X. High-Temperature Mechanical and Thermoelectric Properties of p-Type Bi0.5Sb1.5Te3 Commercial Zone Melting Ingots. J. Electron. Mater. 2014, 43, 2017–2022. [Google Scholar] [CrossRef]
  7. Xu, Z.J.; Hu, L.P.; Ying, P.J.; Zhao, X.B.; Zhu, T.J. Enhanced thermoelectric and mechanical properties of zone melted p-type (Bi, Sb)2Te3 thermoelectric materials by hot deformation. Acta Mater. 2015, 84, 385–392. [Google Scholar] [CrossRef]
  8. Hu, X.; Fan, X.A.; Jiang, C.; Pan, Z.; Feng, B.; Liu, P.; Li, G.; Li, Y. Thermal stability of n-type zone-melting Bi2(Te, Se)3 alloys for thermoelectric generation. Mater. Res. Express 2019, 6, 035907. [Google Scholar] [CrossRef]
  9. Cai, B.; Zhuang, H.-L.; Pei, J.; Su, B.; Li, J.-W.; Hu, H.; Jiang, Y. Spark plasma sintered Bi-Sb-Te alloys derived from ingot scrap: Maximizing thermoelectric performance by tailoring their composition and optimizing sintering time. Nano Energy 2021, 85, 106040. [Google Scholar] [CrossRef]
  10. Li, D.; Li, J.M.; Wang, Y.S.; Zhang, J.; Qin, X.Y.; Cao, Y.; Li, Y.S.; Tang, G.D. High thermoelectric performance of n-type Bi2Te2.7Se0.3 via nanostructure engineering. J. Mater. Chem. A 2018, 6, 9642–9649. [Google Scholar] [CrossRef]
  11. Tong, X.; Liu, Z.; Zhu, J.; Yang, T.; Wang, Y.; Xia, A. Enhanced thermoelectric performance of solution-derived bismuth telluride based nanocomposites via liquid-phase Sintering. Nano Energy 2016, 30, 630–638. [Google Scholar]
  12. Ivanov, O.; Yaprintsev, M.; Vasil’ev, A. Anisotropy of the grain size effect on the electrical resistivity of n-type Bi1.9Gd0.1Te3 thermoelectric textured by spark plasma sintering. J. Eur. Ceram. Soc. 2020, 40, 3431–3436. [Google Scholar] [CrossRef]
  13. Jung, W.-J.; Kim, I.-H. Thermoelectric and mechanical properties of Bi0.4Sb1.6Te3 prepared by using encapsulated melting and hot extrusion. J. Korean Phys. Soc. 2017, 70, 511–516. [Google Scholar] [CrossRef]
  14. Wang, Z.; Yokoyama, Y.; Onda, T.; Adachi, Y.; Chen, Z. Improved Thermoelectric Properties of Hot-Extruded Bi–Te–Se Bulk Materials with Cu Doping and Property Predictions via Machine Learning. Adv. Electron. Mater. 2019, 5, 1900079. [Google Scholar] [CrossRef]
  15. Wang, Z.L.; Araki, T.; Onda, T.; Chen, Z.C. Effect of annealing on microstructure and thermoelectric properties of hot-extruded Bi–Sb–Te bulk materials. J. Mater. Sci. 2018, 53, 9117–9130. [Google Scholar] [CrossRef]
  16. Lavrentev, M.G.; Osvenskii, V.B.; Parkhomenko, Y.N.; Pivovarov, G.I.; Sorokin, A.I.; Bulat, L.P.; Kim, H.-S.; Witting, I.T.; Snyder, G.J.; Bublik, V.T.; et al. Improved mechanical properties of thermoelectric (Bi0.2Sb0.8)2Te3 by nanostructuring. APL Mater. 2016, 4, 104807. [Google Scholar] [CrossRef] [Green Version]
  17. Lavrentev, M.G.; Osvenskii, V.B.; Parkhomenko, Y.N.; Pivovarov, G.I.; Sorokin, A.I.; Bulat, L.P.; Kim, H.-S.; Witting, I.T.; Snyder, G.J.; Bublik, V.T.; et al. Texture-induced reduction in electrical resistivity of p-type (Bi, Sb)2Te3 by a hot extrusion. J. Alloys Compd. 2018, 764, 261–266. [Google Scholar]
  18. Cho, H.; Yun, J.H.; Back, S.Y.; Lee, J.S.; Kang, N.; Jang, Y.I.; Lim, J.; Son, J.H.; Park, J.Y.; Kim, J.; et al. Superior thermoelectric cooling performance by suppressing bipolar diffusion effect and enhancing anisotropic texture in p-/n-type Bi2Te3 based compounds. J. Alloys Compd. 2021, 888, 161572. [Google Scholar] [CrossRef]
  19. Yang, J.; Chen, R.; Fan, X.; Zhu, W.; Bao, S.; Duan, X. Microstructure control and thermoelectric properties improvement to n-type bismuth telluride, based materials by hot extrusion. J. Alloys Compd. 2007, 429, 156–162. [Google Scholar] [CrossRef]
  20. Lysko, V.V. Computer simulation of extrusion process of Bi2Te3 based tape thermoelectric materials. J. Thermoelectr. 2019, 1, 58–64. [Google Scholar]
  21. Harman, T.C. Special Techniques for Measurement of Thermoelectric Properties. J. Appl. Phys. 1958, 29, 1373. [Google Scholar] [CrossRef]
  22. Nolas, G.S.; Sharp, J.; Goldsmid, H.J. Thermoelectrics: Basic Principles and New Material Developments; Springer: Berlin/Heidelberg, Germany, 2001; pp. 99–105. [Google Scholar]
  23. Eger, J.K. Uprugost’, Prochnost’ i Tekuchest’ [Elasticity, Strength and Fluidity]; Mashgiz: Moscow, Russia, 1961; p. 170. [Google Scholar]
  24. Horrobin, D.J.; Nedderman, R.M. Die entry pressure drops in paste extrusion. Chem. Eng. Sci. 1998, 53, 3215–3225. [Google Scholar] [CrossRef]
  25. Tiernan, P.; Hillery, M.T.; Graganescu, B.; Gheorghe, M. Modelling of cold extrusion with experimental verification. J. Mater. Process. Technol. 2005, 168, 360–366. [Google Scholar] [CrossRef]
  26. Prostomolotov, A.I.; Verezub, N.A.; Ilyasov, H.H. “CRYSTMO/MARC” Program for Conjugate Thermal Simulation. Comput. Programs 2009, 4, 110. [Google Scholar]
  27. Lavrentyev, M.G.; Osvensky, V.B.; Mezhennyi, M.V.; Prostomolotov, A.I.; Bublik, V.T.; Tabachkova, N.Y. Experiment-calculated study on structure formation of thermoelectric material based on solid solutions of bismuth and antimony chalcogenides prepared by hot extrusion method. J. Thermoelectr. 2012, 4, 33–38. [Google Scholar]
Figure 1. The scheme of hot extrusion process.
Materials 14 07059 g001
Figure 2. Stress vs. strain graph for elastic-plastic approximation.
Materials 14 07059 g002
Figure 3. Lagrange mesh and specimen shape vs. time t, s: (a) 90, (b) 150.
Materials 14 07059 g003
Figure 4. Distribution of plastic flow velocity V during extrusion of 30 mm rod at time 360 s from process start. Values for color isocontours correspond to mass flow velocities V × 0.1 mm/s.
Materials 14 07059 g004
Figure 5. Distribution of main maximum stresses ×107 MPa (a) and total maximum strains for extrusion of 30 mm diameter rod (b).
Materials 14 07059 g005
Figure 6. Macrostructure image of the initial section of the extruded rod.
Materials 14 07059 g006
Figure 7. Evolution of rod texture and microstructure along extrusion axis: (a) 1 cm from die beginning, (b) 3 cm from die beginning, and (c) 5 cm from die beginning.
Materials 14 07059 g007
Figure 8. Evolution of diffraction peak intensity as a function of extrusion temperature: (a) 430 °C, (b) 450 °C, and (c) 470 °C.
Materials 14 07059 g008
Figure 9. Cleave surface structure images of (Bi Sb)2Te3 solid solutions extruded at different temperatures: (a) 430 °C, (b) 450 °C, and (c) 470 °C.
Materials 14 07059 g009
Figure 10. (a) Electrical conductivity, (b) Seebeck coefficient, (c) thermal conductivity, and (d) figure of merit as a function of extrusion temperature.
Materials 14 07059 g010
Table 1. CSR size and microstrain in (Bi, Sb)2Te3 solid solutions as a function of extrusion rate.
Extrusion Rate, mm/minCSR Size, nmMicrostrain, %
0.11200.16
0.31150.12
0.51250.08
Publisher’s Note: MDPI stays neutral with regard to jurisdictional claims in published maps and institutional affiliations.

