
Investigation of PbSnTeSe High-Entropy Thermoelectric Alloy: A DFT Approach

1
Department of Chemistry, Aix-Marseille University, CNRS, IM2NP, 13007 Marseille, France
2
Department of Chemistry, Aix-Marseille University, CNRS, MADIREL, 13007 Marseille, France
*
Author to whom correspondence should be addressed.
Materials 2023, 16(1), 235; https://doi.org/10.3390/ma16010235
Submission received: 10 November 2022
/
Revised: 19 December 2022
/
Accepted: 20 December 2022
/
Published: 27 December 2022
(This article belongs to the Special Issue Recent Advances in Thermoelectricity: Materials Processing, Characterization and Modelling)
Abstract
:Thermoelectric materials have attracted extensive attention because they can directly convert waste heat into electric energy. As a brand-new method of alloying, high-entropy alloys (HEAs) have attracted much attention in the fields of materials science and engineering. Recent researches have found that HEAs could be potentially good thermoelectric (TE) materials. In this study, special quasi-random structures (SQS) of PbSnTeSe high-entropy alloys consisting of 64 atoms have been generated. The thermoelectric transport properties of the highest-entropy PbSnTeSe-optimized structure were investigated by combining calculations from first-principles density-functional theory and on-the-fly machine learning with the semiclassical Boltzmann transport theory and Green–Kubo theory. The results demonstrate that PbSnTeSe HEA has a very low lattice thermal conductivity. The electrical conductivity, thermal electronic conductivity and Seebeck coefficient have been evaluated for both n-type and p-type doping. N-type PbSnTeSe exhibits better power factor (PF = S2σ) than p-type PbSnTeSe because of larger electrical conductivity for n-type doping. Despite high electrical thermal conductivities, the calculated ZT are satisfactory. The maximum ZT (about 1.1) is found at 500 K for n-type doping. These results confirm that PbSnTeSe HEA is a promising thermoelectric material.
1. Introduction
In recent years, the energy problem has become increasingly serious. Thermoelectric materials have attracted extensive attention as they can directly convert waste heat into electric energy [1,2,3,4]. The figure of merit ZT = S2σT/κ [5] is used to evaluate the thermoelectric conversion efficiency in which S, σ, T, and κ are the Seebeck coefficient, electrical conductivity, temperature, and thermal conductivity (electronic and lattice), respectively. However, due to the strong coupling between these parameters, it is not easy to improve the thermoelectric efficiency [6]. Therefore, in order to improve the thermoelectric efficiency, various routes have been explored, e.g., using band engineering to improve power factor (S2σ) [7,8], and reducing the dimensionality of the material to reduce the lattice thermal conductivity [9,10,11]. In addition to improving the thermoelectric efficiency of existing materials with these strategies, finding new thermoelectric materials is also an important approach [12,13,14].
As a recent method of alloying, high-entropy alloys has attracted much attention in the fields of materials science and engineering [15,16,17,18,19,20]. A bibliographic search from the Chemical abstract Service/SciFinder database indicates that more than 11,000 papers have been published on high-entropy alloys (HEA) since 2002. Most of these references deals with materials containing mainly transition metal elements (Ti, Cr, Fe, Cu, Mo, Co, Ni, Nb, Ta, Pt, …) occasionally combined with metals or non-metals of the principal elements (Al, Si, P, …). These HEA have been investigated for, e.g., their mechanical (see Refs. [21,22,23,24]), catalytic [25,26,27,28], photocatalytic [29,30,31,32], and refractory [33,34,35,36] properties. To date, over 350 reviews have been published on HEAs various properties [37,38,39,40,41,42]. High-entropy alloys are typically defined as a single-phase, solid solution with five or more principal elements, each in a 5 to 35% molar ratio, resulting in high configurational mixing entropy (∆Smix), defined as ∆Smix = −R∑icilnci, where ci and R are the compositional ratio and the gas constant, respectively [15]. It is generally admitted that the high entropy of mixing favors the formation of solid solutions and reduces the number of phases [15]. Because of the lattice distortion effects [43], which reduce phonon velocity and enhance the scattering of phonons, high-entropy alloys generally have low lattice thermal conductivity [44,45,46]. As high-entropy sulfides, Cu5Sn1.2MgGeZnS9 has been reported with a ZT value of 0.58 at 773 K [47]. The high-entropy metal chalcogenide (Ag,Pb,Bi)(S,Se,Te) alloy with a NaCl-type structure has been investigated and it was found that this compound is a n-type semiconductor with very low κL and good power factor resulting in a figure of merit of 0.54 at 723 K [48]. Recently, an n-type PbSe-based high-entropy material formed by entropy-driven structural stabilization was studied for its thermoelectric properties. The ZT value was found to reach 1.8 at 900 K, which corresponds to a material exhibiting good thermoelectric properties [49]. Apart from HEA, other, more conventional, types of compounds have been reported bearing low thermal conductivity, such as Zintl phases (e.g., Ba2ZnSb2 [50]), argyrodites [51], sulfide-containing films [52], rare-earth molybdates [53], perovskites (e.g., [54]), and defective metal chalcogenide thin films [55], to cite a few. Typically, the thermal conductivity of these compounds lies below 1 W/(m K). The reasons, or the conjunction of reasons, for this low thermal conductivity have been identified by means of the combined density-functional theory and Boltzmann transport theory approaches. The investigations have evidenced large Grüneisen parameters, low-lying optical and acoustic phonon frequencies, short phonon lifetime, and the presence of defects. We shall mention that, to date, several papers report on the prediction of the thermal conductivity of materials using a combined approached based on ab initio molecular dynamics used to train a machine-learned force field subsequently used with the Green–Kubo formalism to derive the heat flux and thermal conductivity [56,57,58]. These approaches are similar to the one used in this work, which is based on the work from Verdi et al. [59]. It has been shown that this machine-learned approach is very effective and yields property data close to those obtained from the Boltzmann transport theory (see, e.g., Ref. [60]).
The fact remains that, so far, most of the research driven on the thermoelectric properties of high-entropy alloys are mainly experimental studies, theoretical studies on TE performance of high-entropy alloys being more seldom. Recently, PbSnTeSe has been experimentally investigated by Fan et al. [61] and Raphel et al. [62,63], who report appreciably similar results for the thermoelectric performance of the material (see below). The modelling of HEAs transport properties constitute a challenge, and both the simulation methods and their derived predictions have to be confronted to experimental data to assess their validity. In this context, we present in this paper for the first time a complete approach that allows one to obtain all the transport coefficients, including the figure of merit, of a high-entropy alloy. The thermoelectric transport properties of the PbSnTeSe high-entropy alloy have been calculated by combining state-of-the-art methods based on the special quasi-random structures approach to generate the HEA structure, the first-principles density-functional theory (DFT), and the Boltzmann transport and Green–Kubo theories. First, from the DFT-computed material electronic states, the electronic transport properties (electronic conductivity, Seebeck coefficient and electronic thermal conductivity) were calculated using the linearized Boltzmann transport equation, and the power factor was obtained. Next, the lattice thermal conductivity was evaluated according to the Green–Kubo (GK) theory [64] using on-the-fly machine-learned force fields (MLFF) [65,66]. Finally, the figure of merit of PbSnTeSe was determined. The results demonstrate that PbSnTeSe has very low lattice thermal conductivities. Despite high electrical thermal conductivities, the calculated ZT are satisfactory. The maximum ZT (about 1.1) is found at 500 K for n-type doping. These results confirm the interest of this HEA for thermoelectric applications.
2. Computational Details
Our computations were performed within the DFT framework utilizing the projector augmented wave (PAW) [67] technique, as implemented in the Vienna Ab Initio Simulation Package (VASP) [68,69,70]. The Perdew–Burke–Ernzerhof (PBE) functional under the generalized gradient approximation (GGA) [71] was utilized as the exchange-correlation functional. The nonempirical PBE functional is known to yield accurate crystal parameters and properties, and is known to fulfil many sum rules on the exchange-correlation hole [72]. Generally, where GGA functionals fail, local density functionals fail too. Concerning the thermal conductivity, compared to local density functionals, PBE does not over bind structures (it slightly under binds), hence the interatomic force constants are not too soft. Overall, the lattice thermal conductivity is quite the same whether using local density or GGA functionals [73].
The special quasi-random structures (SQS) of high-entropy alloys have been generated using the Monte Carlo SQS (MCSQS) tool as implemented in the alloy theoretic automated toolkit (ATAT) [74]. A 2 × 2 × 2 supercell consisting of 64 atoms was built for calculations. A 3 × 3 × 3 Monkhorst–Pack k-point mesh was used, and the kinetic energy cutoff was set to 400 eV. The geometric structures were totally relaxed until the Hellmann-Feynman forces were less than 0.01 eV/Å. The electronic transport properties were computed with the Boltztrap2 code, which implements the semiclassical Boltzmann theory under the relaxation time approximation (RTA) [75]. As the calculation of transport coefficients is very demanding in term of the band structure accuracy, a much denser, 9 × 9 × 9 k-point mesh was employed to obtain the electrons energy eigenvalues for the subsequent electronic transport properties calculation. As within the RTA the lifetime of electrons has to be determined separately, which constitutes an inherent limitation to the linearized Boltzmann transport equation approach, the relaxation time (τ) was determined using the deformation potential (DP) theory [76]. Due to heavy elements present in the structure, the spin–orbit coupling (SOC) effect was considered in our calculations. The lattice thermal conductivity was calculated using the Green–Kubo theory for which the heat flux was obtained from the on-the-fly machine-learned force fields [65,66] module of VASP. The evident advantage of using this approach is that classical molecular dynamics allows for catching the phonon dynamics at any order and is applicable to potentially extremely large structures. The difficulty is that interatomic parameters of good quality have to be available. The first step of the MLFF elaboration consists in training the force field by machine learning through molecular dynamics (MD) simulations in the NVT ensemble, where N, V, and T are the number of particles, volume and temperature, respectively, that are kept constant during the simulations (canonical ensemble). A supercell of 512 atoms was used for the training, and the MD simulations were run with a time step of 1 fs. Then, after training, the force field was used to equilibrate the system in the NVT ensemble at the desired temperature with a time step of 1 fs for 100 ps. Finally, the heat flux was calculated through molecular dynamics simulations in the NVE ensemble, where N, V and the energy E are kept constant (microcanonical ensemble), with a time step of 1 fs for 100 ps. For the ensemble average, 10 independent molecular dynamics simulations were performed for the calculation of the heat flux.
The design of the force-field (FF) is described in detail in Ref. [59]. We give a brief summary here. The fitting of the force-field parameters relies on the availability of a database (DB) of structures, the quality of the fitting being assessed from energies, atomic forces, and stress tensors. This DB is built on-the-fly through the ab initio molecular dynamics (AIMD) simulations. At each step of the AIMD a decision is made as to whether a new AIMD step should be run to add a new structure to the DB or if the MD step is run with the FF. The decision is made after the estimated errors between the ab initio atomic forces and the FF ones based on a Bayesian inference. Hence, the algorithm relies on the Bayesian linear regression to assess the quality of the FF parameters. In our case, the force-field parameters were built from a DB containing more than 2100 structures. The Bayesian error on the atomic forces, energies and stress are below 0.006 eV/Å, 0.5 meV and 0.04 kB, respectively. The FF parameters quality is assessed based on the capability of the FF to reproduce properly the two-body and three-body distributions (Equations (2) and (3) in Ref. [59]) that represent the likelihood to find, around a given atom, an atom at a certain distance or a pair of atoms at a certain distance and angle, respectively. Thereupon, the calculated cell parameters with the FF yields are the same as those obtained ab initio.
3. Results and Discussion
3.1. Structural and Electronic Properties of PbSnTeSe High-Entropy Alloy
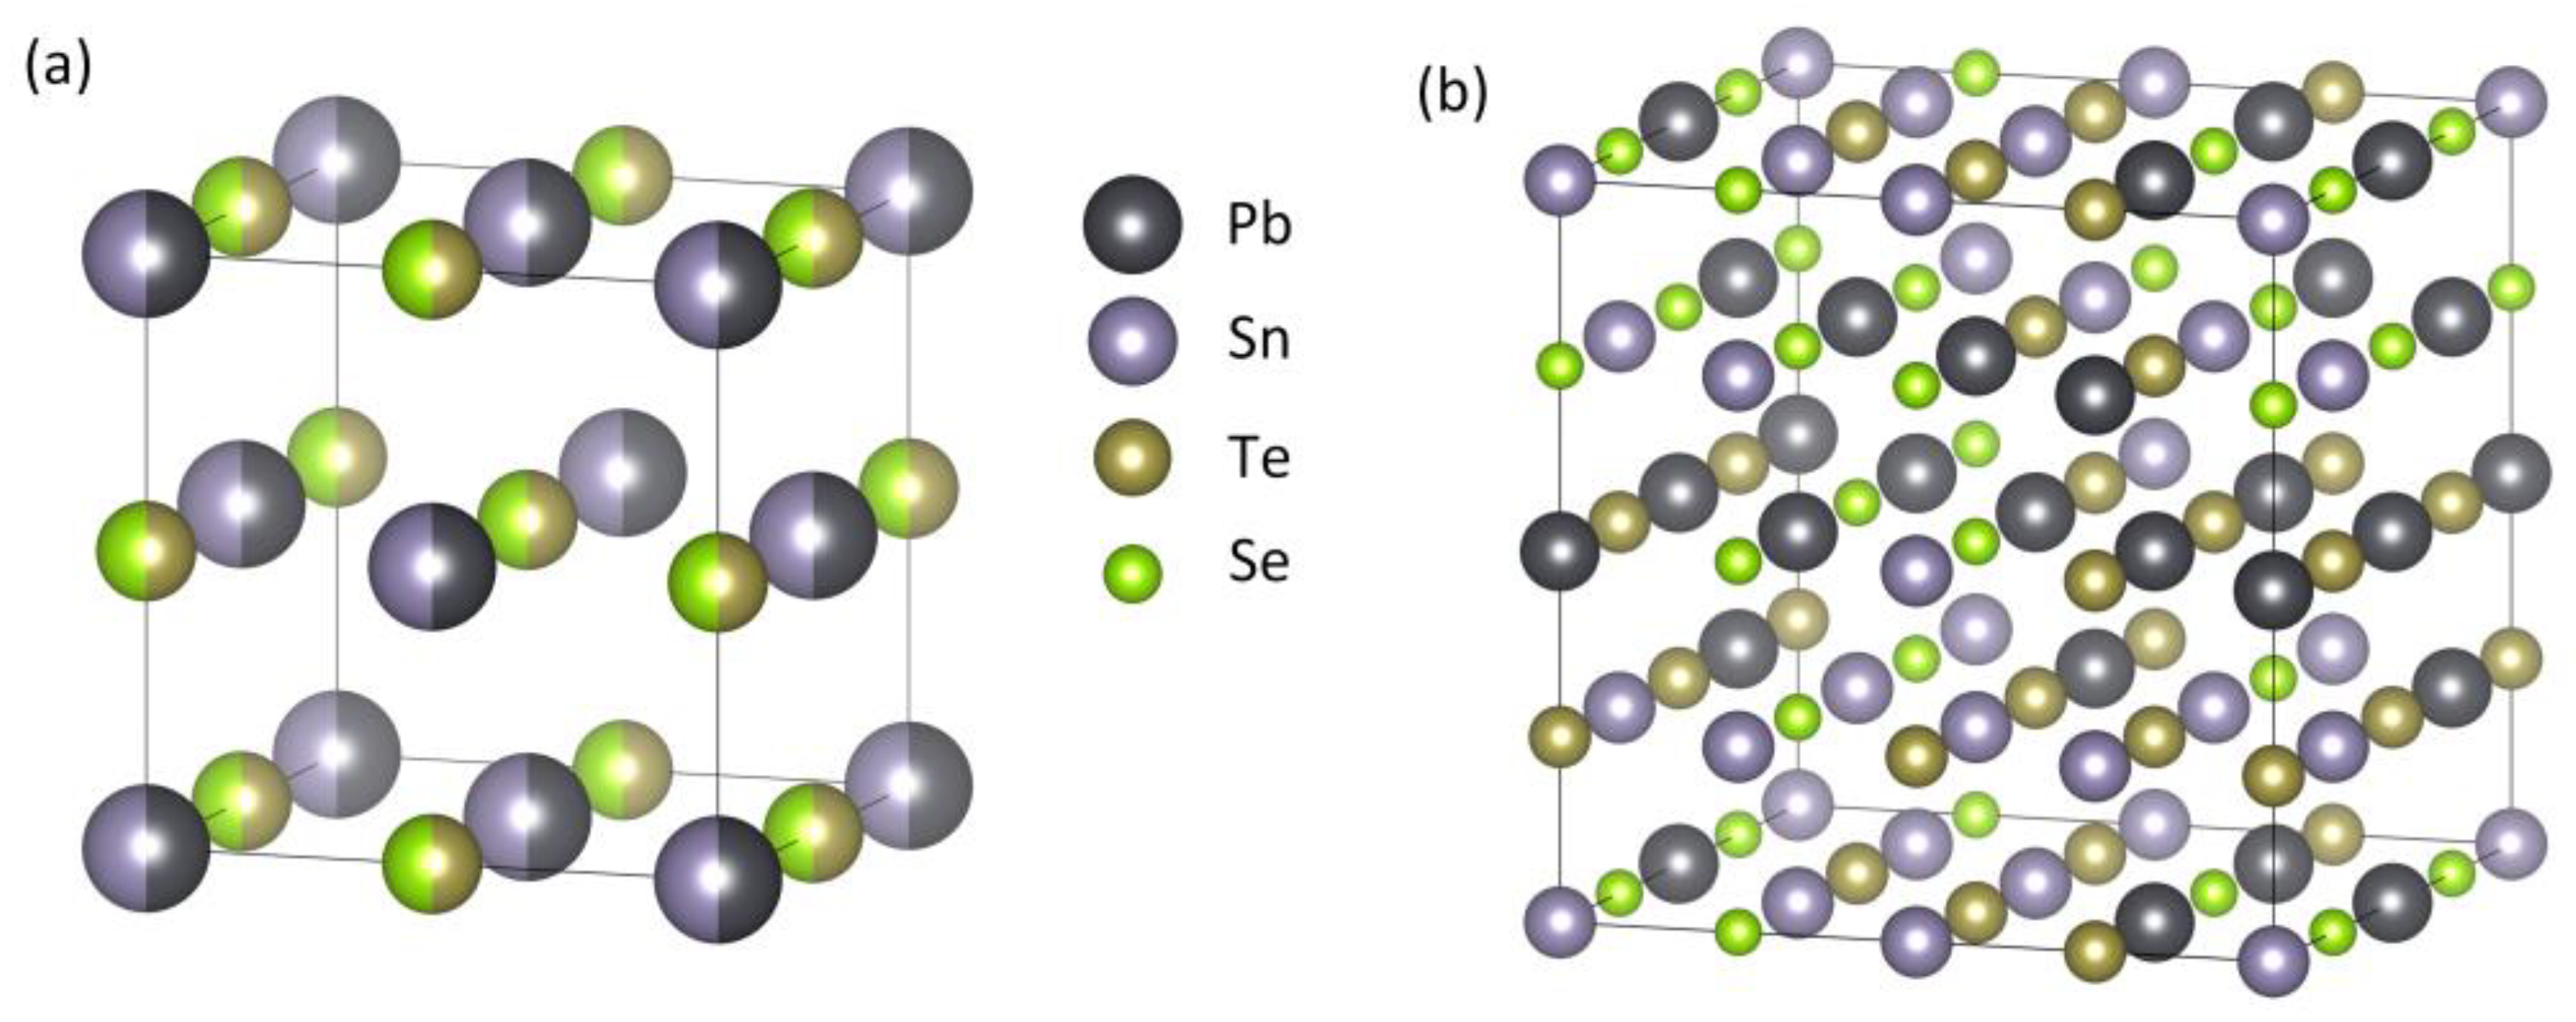
The PbSnTeSe high-entropy alloy is based on the NaCl-type face-centered cubic (FCC) crystal structure and a 2 × 2 × 2 supercell containing 64 atoms was constructed. Figure 1a shows the schematic illustration of the crystal structure of the PbSnTeSe HEA. The HEA structure was built from the PbTe crystal structure for which the same atomic ratio of 50% was employed for both Pb and Sn on the Pb Wyckoff positions, and Te and Se on the Te Wyckoff positions. Figure 1b shows the special quasi-random structure of PbSnTeSe high-entropy alloys generated by the MCSQS tool of ATAT. The optimized lattice parameters of the PbSnTeSe are a = 12.74 Å, b = 12.65 Å, and c = 12.68 Å, α = 89.8°, β = 90.2°, and γ = 90.6°.
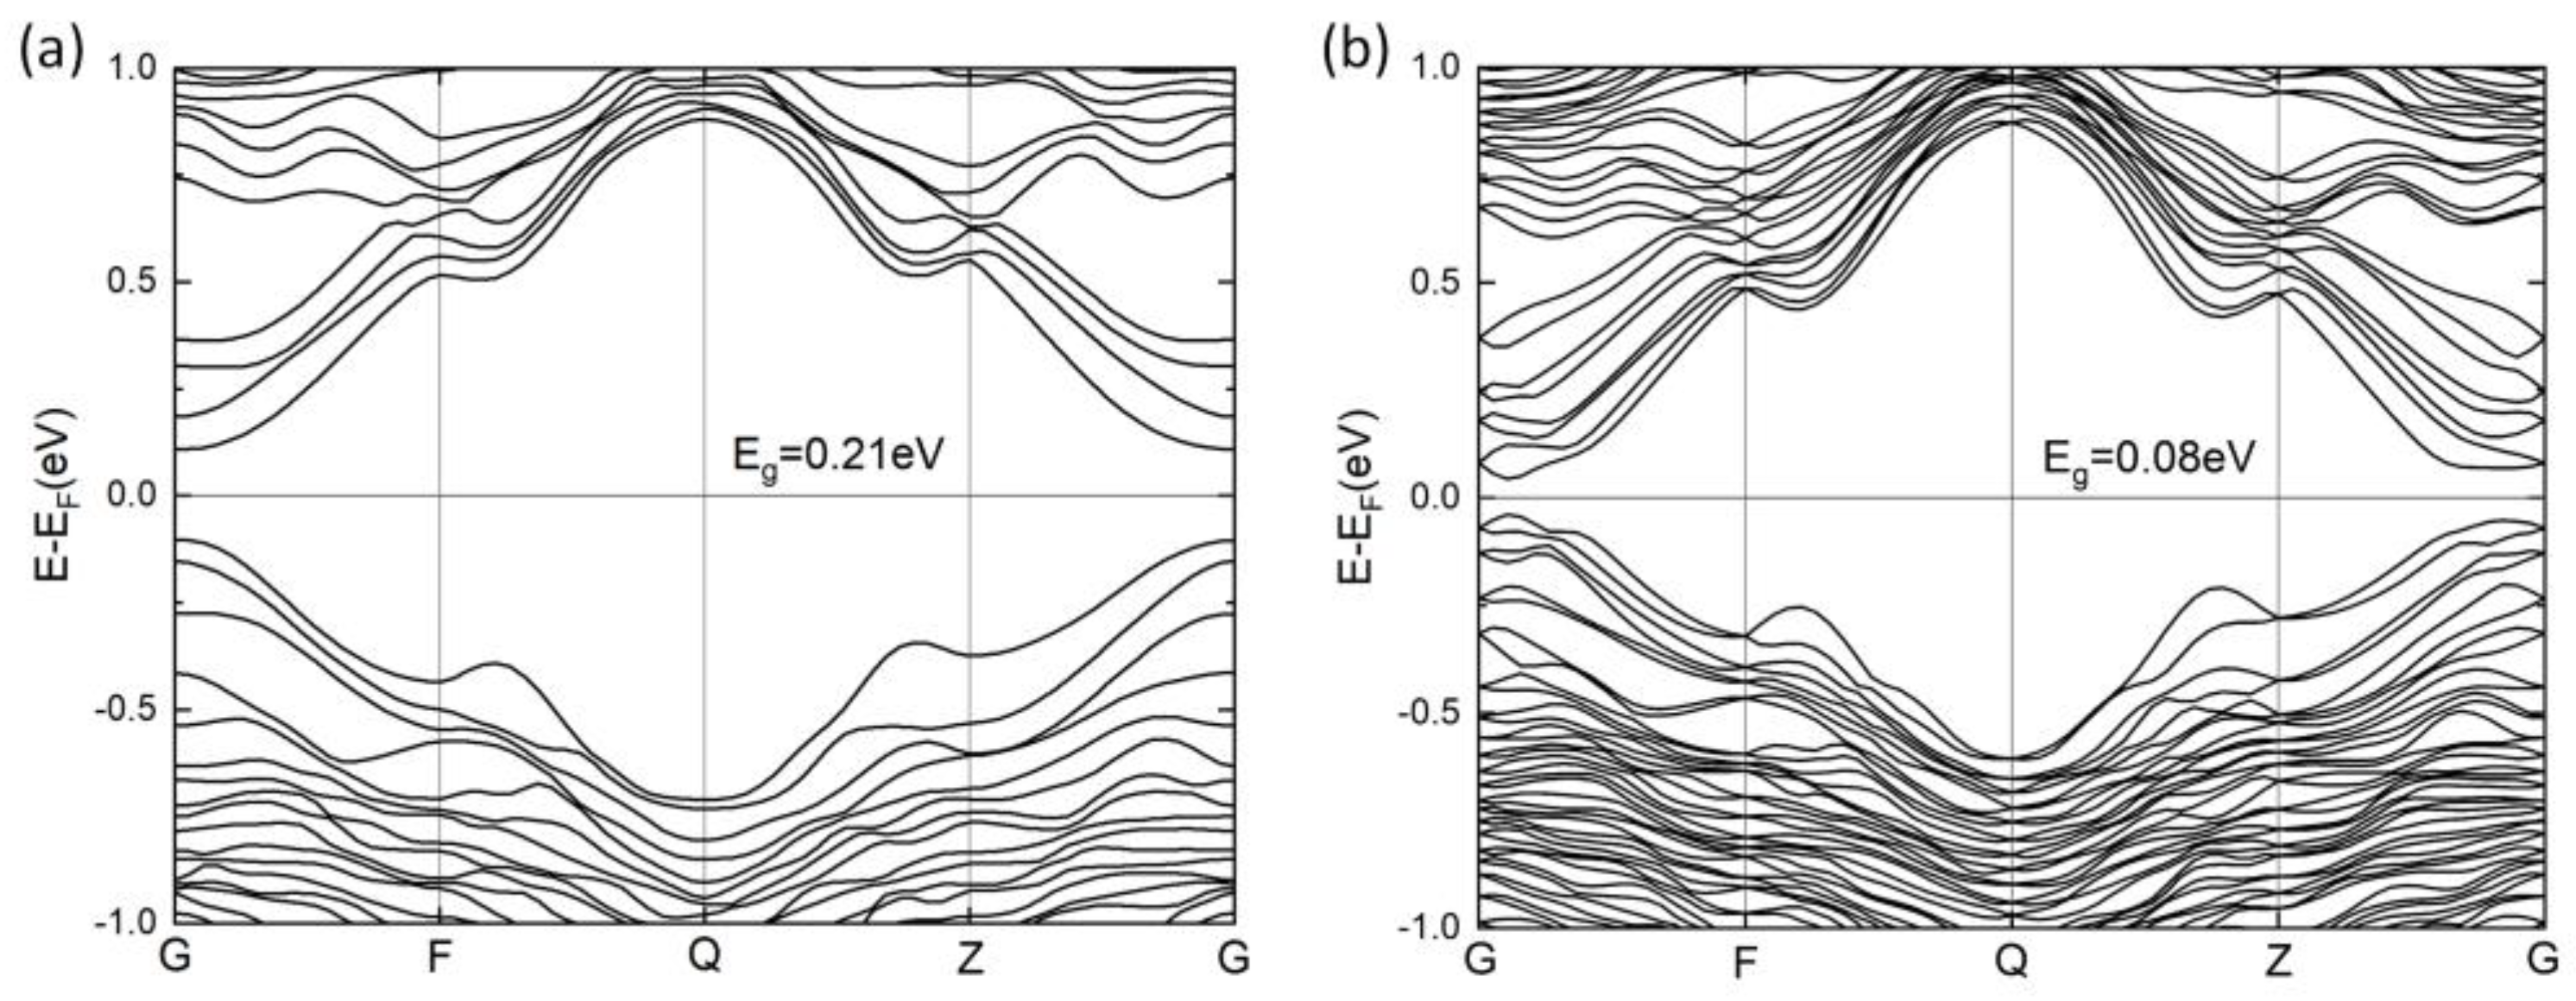
The band structure of PbSnTeSe was calculated along the line (0 0 0)-(0 ½ 0)-(0 ½ ½)-(0 0 ½)-(0 0 0) of the Brillouin zone and is depicted in Figure 2. PbSnTeSe is a semiconductor with a direct band gap. Without spin–orbit coupling, the valence-band maximum (VBM) and the conduction-band minimum (CBM) are both located at the Γ point. Because of the heavy elements Pb, Te and Sn, the spin–orbit coupling effect was accounted for. The band gap decreases from 0.21 eV to 0.08 eV when considering the SOC effects, and the direct bandgap shifts slightly away from Γ. In addition, the SOC lifts the degeneracy of the crystal states leading to two states (j = l ± ½) between the high symmetry k-points, which can be explained by the main contribution of the p atomic orbitals of the atoms.
3.2. Seebeck Coefficient, Electrical Conductivity, and Power Factor of PbSnTeSe
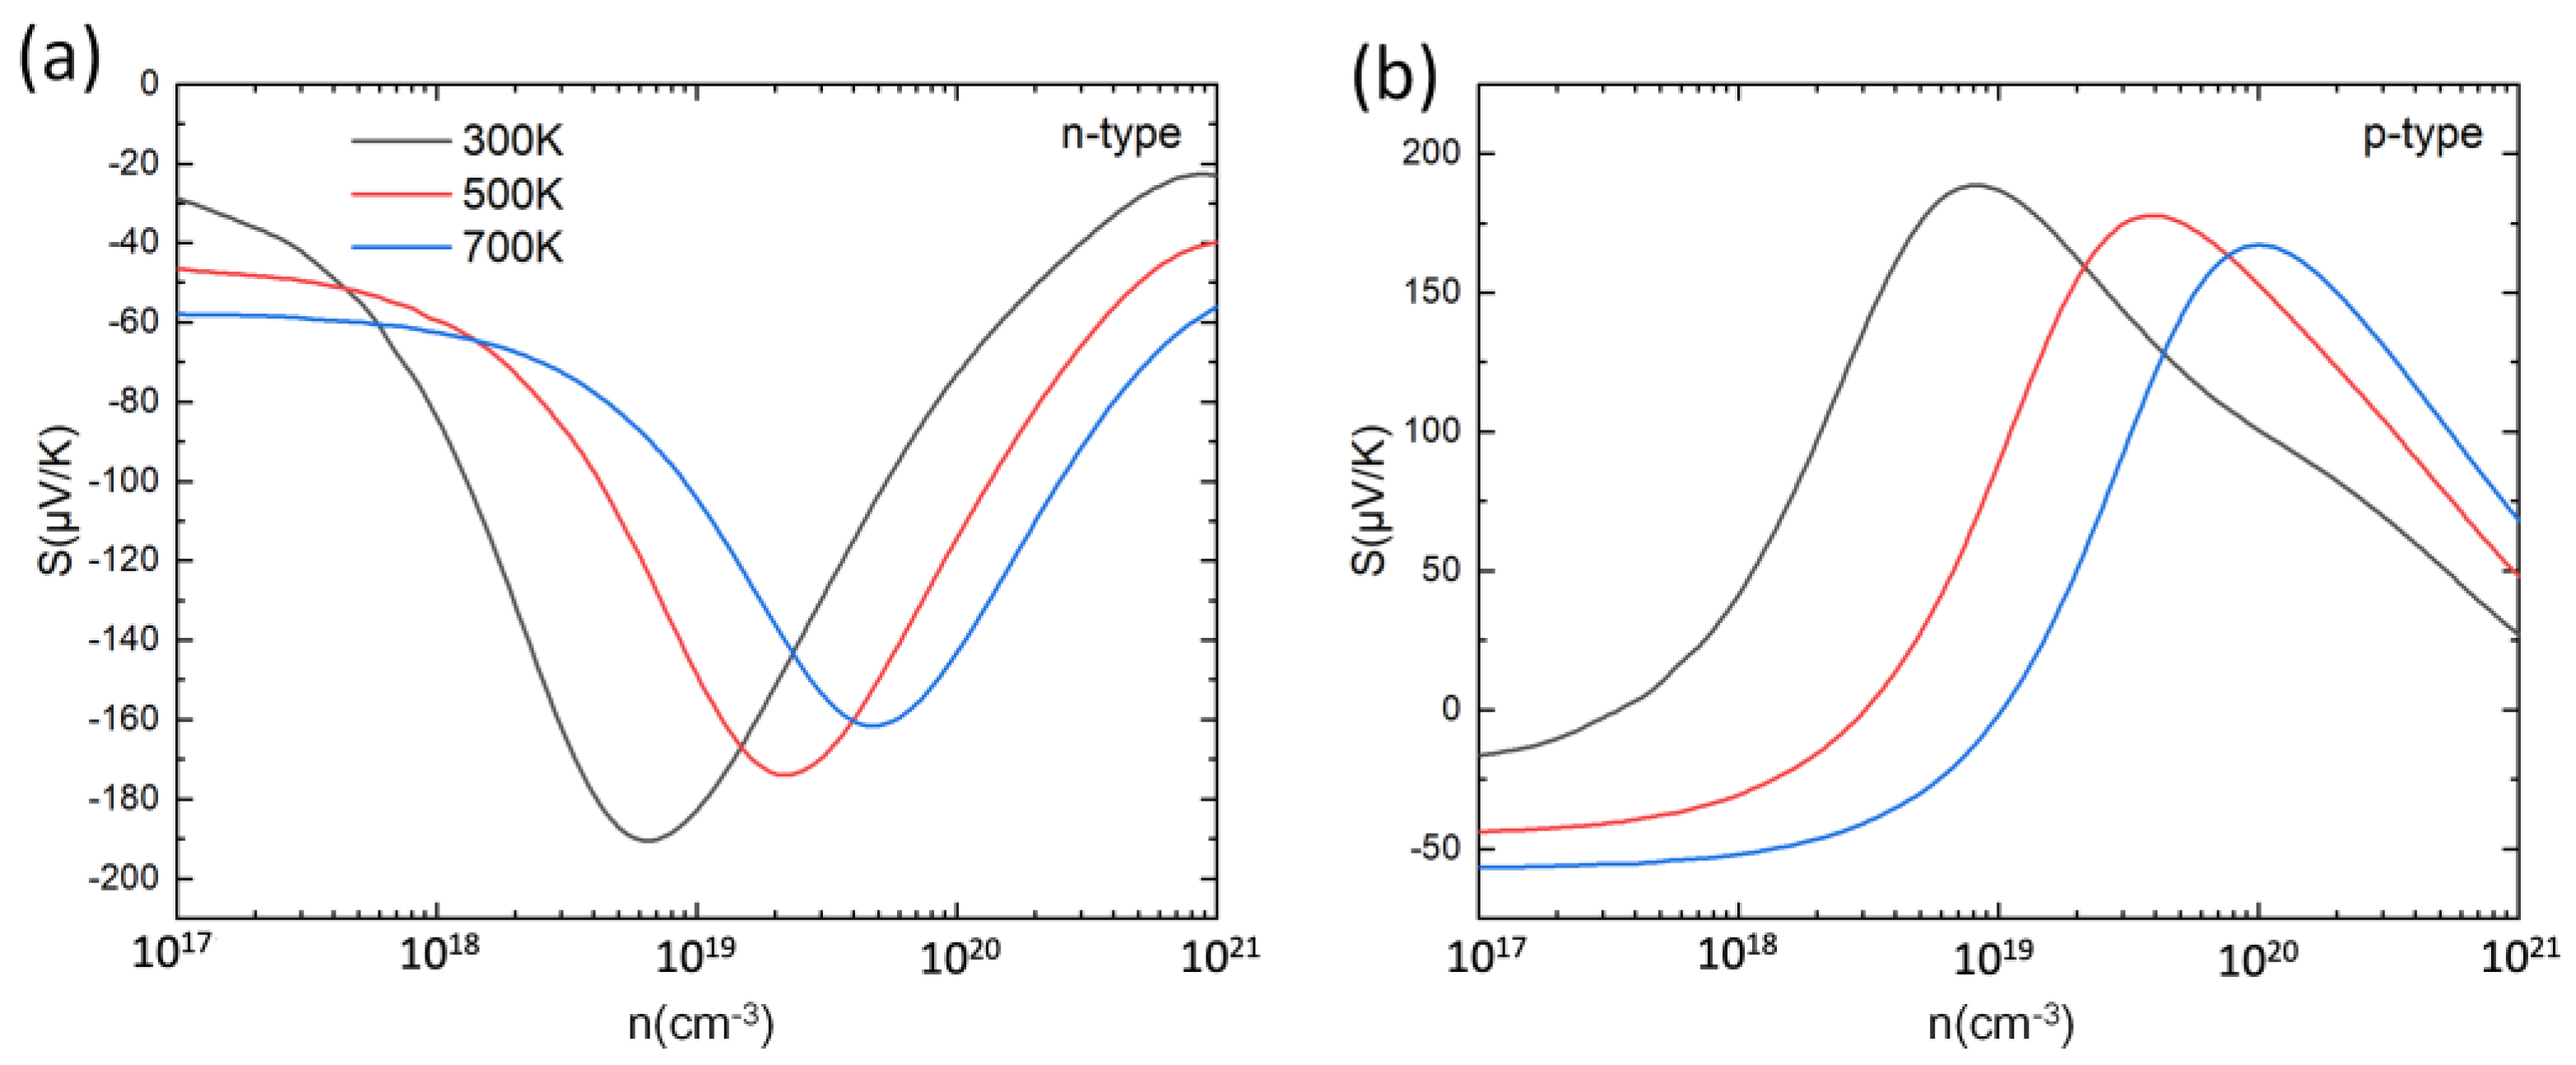
Based on the calculated electronic structure, the Seebeck coefficient (S) of PbSnTeSe was determined. Figure 3 shows the Seebeck coefficient at 300 K, 500 K, and 700 K as a function of carrier concentration. For both n-type and p-type doping, the Seebeck coefficients first rise then decrease as the carrier concentration increases, which can be interpreted from the Mott formula [77]
where h, kB, m*d, T and n are the Planck constant, Boltzmann constant, density of states effective mass and carrier concentration, respectively. According to this expression, apart from the effect of temperature, the Seebeck coefficient is governed by the ratio m*d n−2/3. Assuming the simple evolution of the density of states (DOS) for 3D materials as the square-root of the state energies (see, e.g., Figure 39.1 in Ref. [78]), at low doping level the curvature radius increases drastically and hence the DOS mass, and overall, the Seebeck coefficient increases sharply. As the doping level increases further, the DOS mass becomes roughly constant, and the n−2/3 term starts dominating in the Mott formula, leading to a decrease of S. For both low and highly doped compound (n ~ 1017 cm−3 and n ≥ 1021 cm−3), the Seebeck coefficient is improved with the increase in the temperature, which can also be understood by this formula. In the meantime, the maximum S values are reduced with the temperature increase. The peak values of S for PbSnTeSe are all in the range of 160–190 μV/K with little difference between n-type and p-type.
As in RTA the electrical conductivity is scaled by the carrier relaxation time τ, this parameter has to be determined to get the values of σ. For this, the deformation potential (DP) theory [76] was utilized, from which the expression of τ reads:
where and are the reduced Planck constant and temperature, respectively. The effective mass of the carrier is calculated by , and the elastic constant is defined as where , and are the total energy of the system, the change of the lattice parameter and the equilibrium volume, respectively. The DP constant corresponds to the shift of the band edge energy and is given by , where is the band edge energy. The calculated values are listed in Table 1. At the temperatures of 300 K, 500 K, and 700 K, the relaxation times for n-type and p-type PbSnTeSe vary from 158 to 44.3 fs and from 17.3 to 4.78 fs, respectively. The relaxation time for the n-type PbSnTeSe is larger than that of the p-type because the effective mass and deformation potential of the n-type compound are smaller than those of the p-type. The decrease in the relaxation time with increasing temperature means that the scattering of carriers is gradually enhanced. The scattering inhibits the transport of carriers, which should lead to a decrease of the conductivity with increasing temperature.
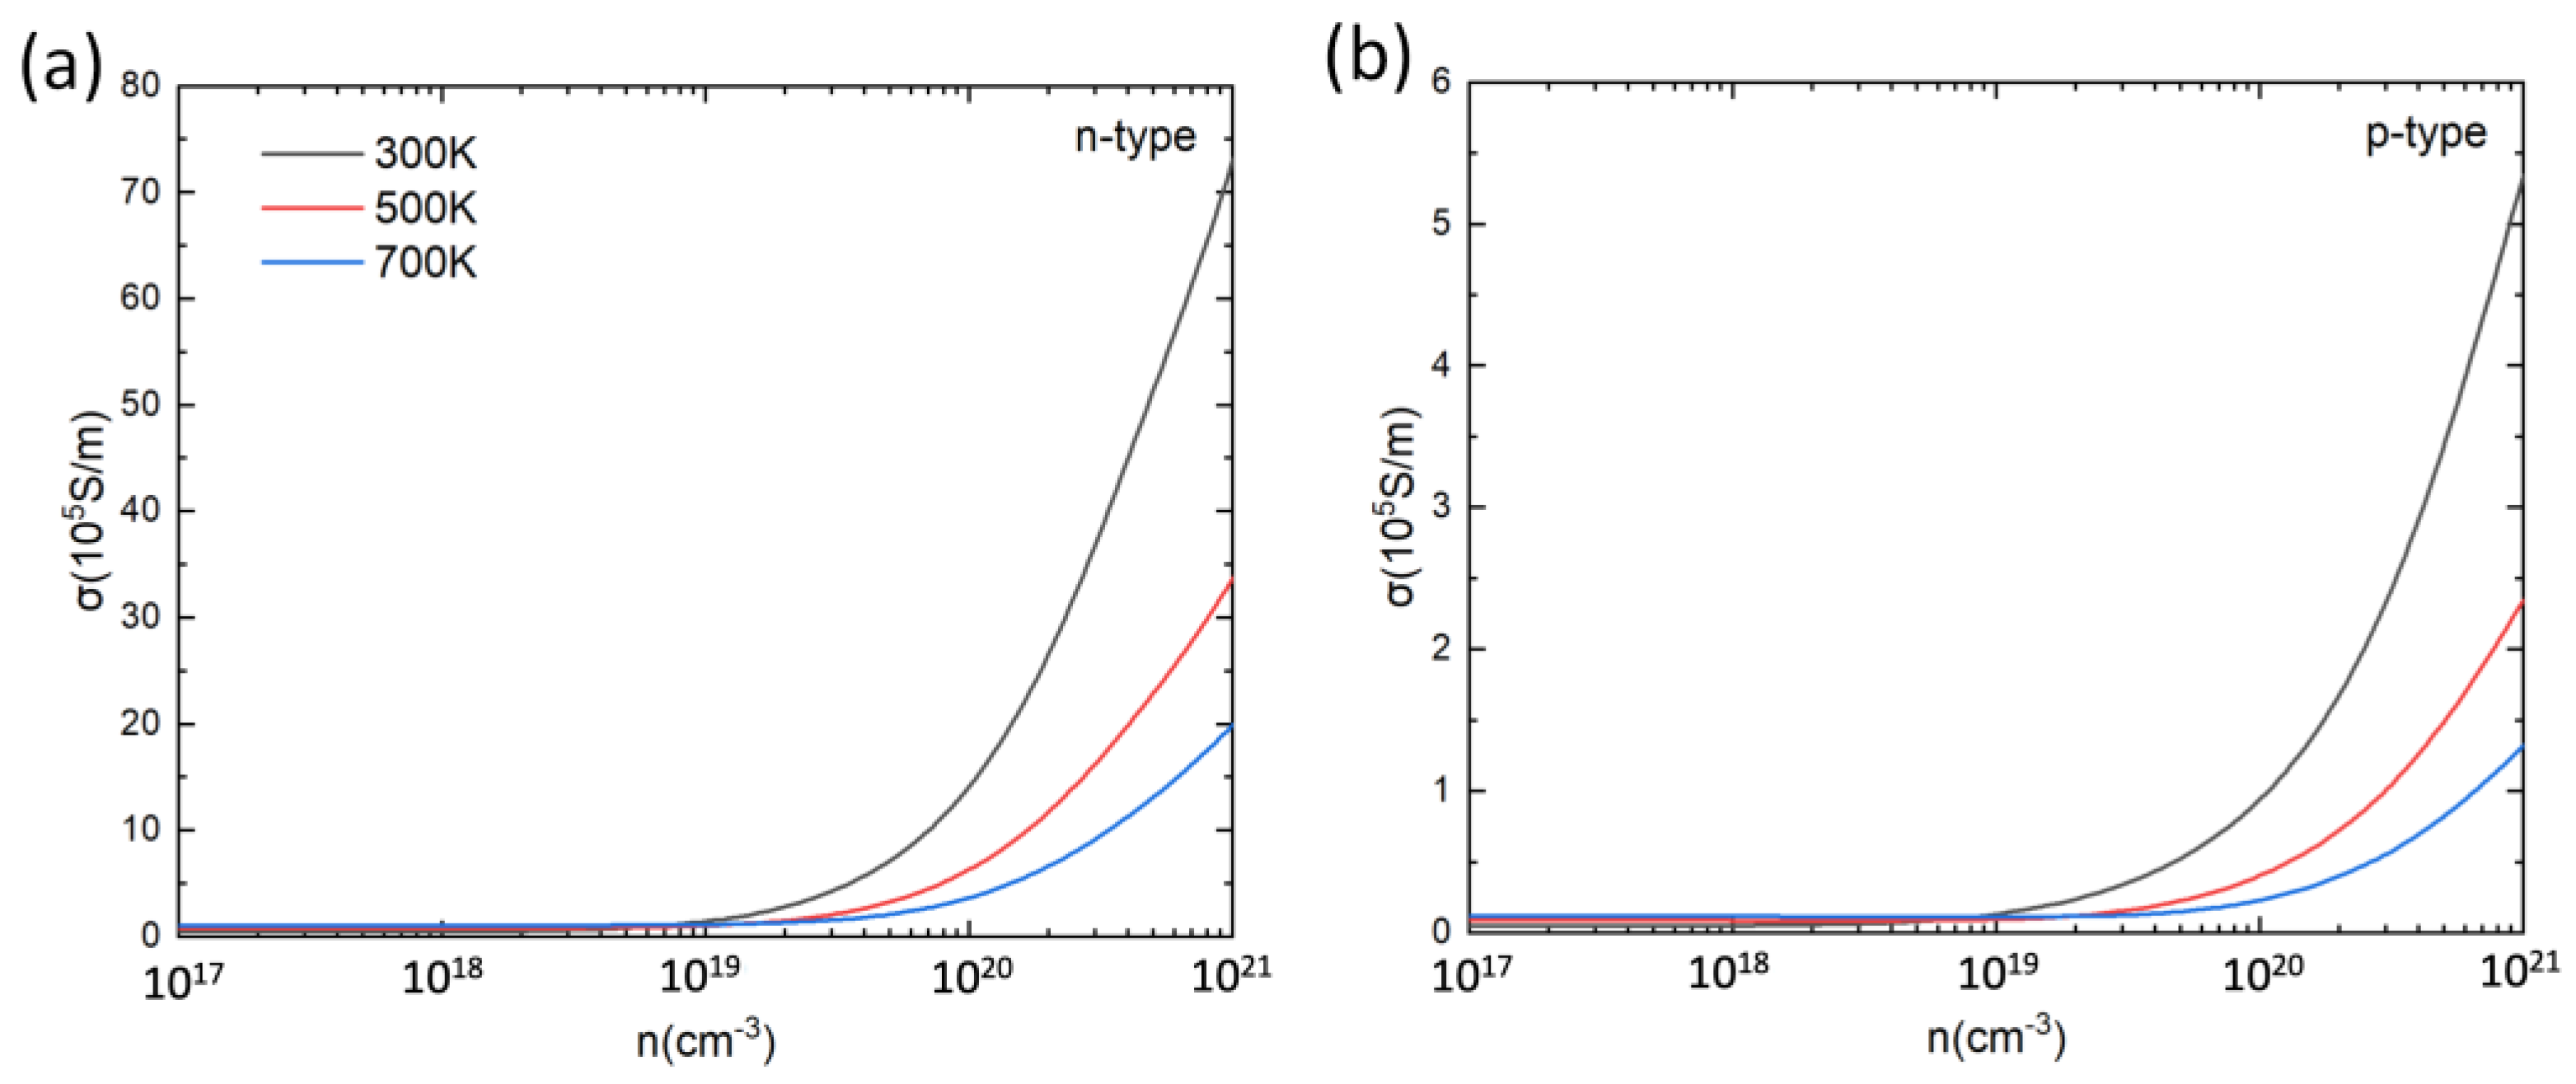
Based on the calculated relaxation time, the electrical conductivity (σ) of PbSnTeSe was obtained. Figure 4 shows the calculated σ at 300 K, 500 K and 700 K as a function of the carrier concentration. For both n-type and p-type doping, increases with the increase in carrier concentration. For low carrier concentrations increases with temperature, and for high concentrations (>1019 cm−3) decreases with the increase in temperature, which can be understood from the Drude–Sommerfeld formula [79,80,81]:
where is the carrier concentration and μ is the mobility of the carriers. As mentioned above, with the temperature increase the relaxation time decreases, which leads to a decrease in mobility, hence the conductivity decreases as the temperature increases. In each case, the n-type PbSnTeSe has a better electrical conductivity than the p-type, which is caused by a larger relaxation time for the n-type than for the p-type PbSnTeSe.
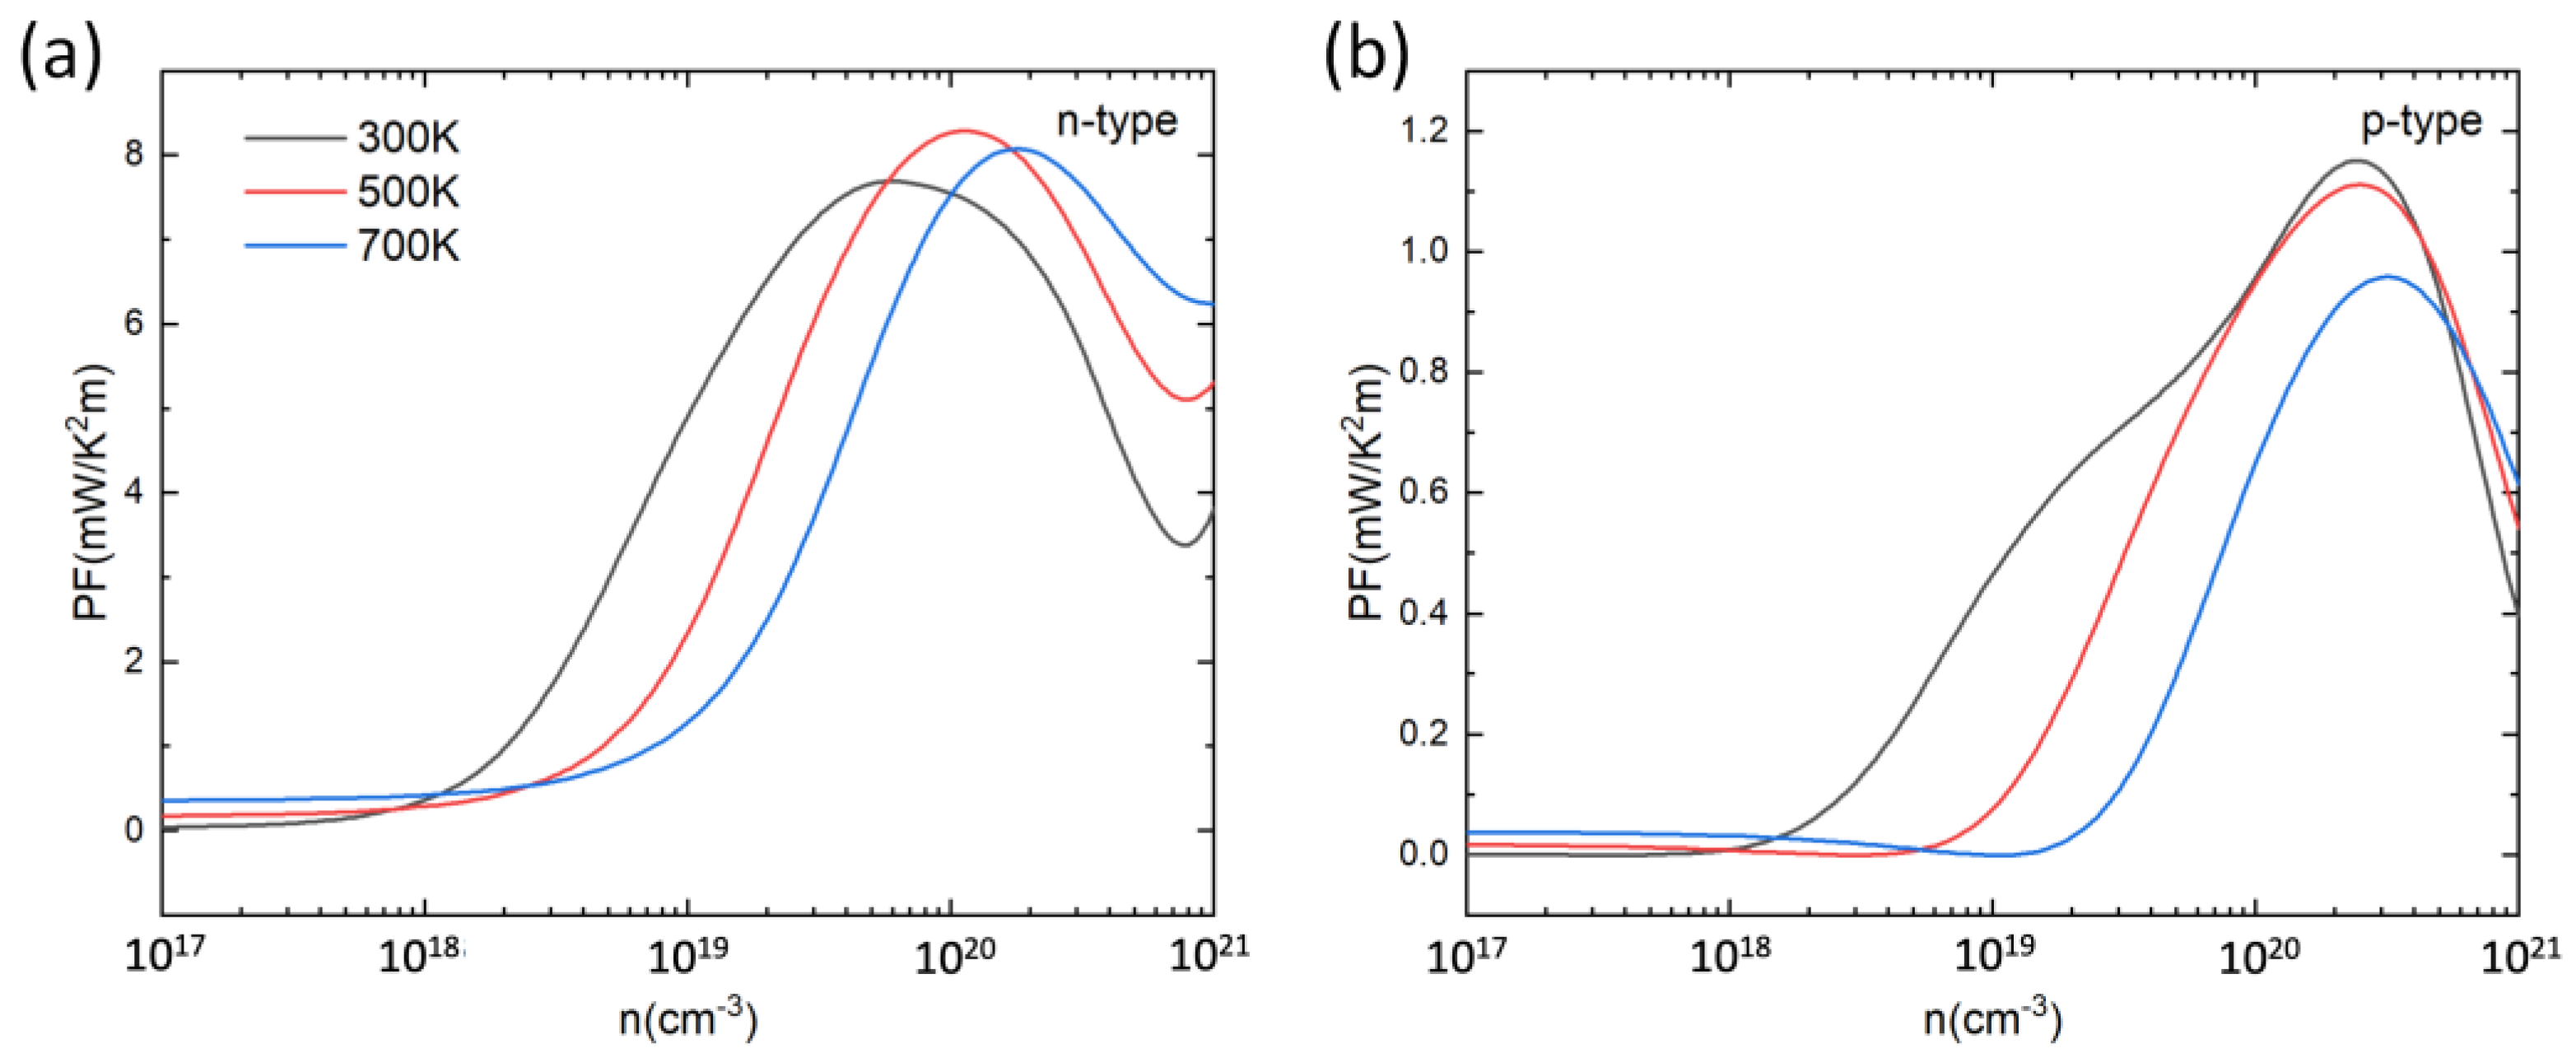
Based on the calculated and , the power factor PF () was determined. Figure 5 shows the calculated PF at 300 K, 500 K, and 700 K as a function of carrier concentration. For both n-type and p-type doping, the PF first increases then decreases with the increase in carrier concentration. The peak values of PF for p-type and n-type PbSnTeSe are in the range of 0.9–1.2 mW/(m K2) and 7–8 mW/(m K2), respectively. In each case, the optimal PF values for n-type doping are larger than those for p-type doping because of the higher electrical conductivity, indicating that n-type doping is more efficient than the p-type at improving the TE performance of PbSnTeSe.
3.3. Electronic Thermal Conductivity of PbSnTeSe
Thermal conductivity is composed of two parts, the electronic thermal conductivity () and the lattice thermal conductivity (). The electronic thermal conductivity was calculated using the Wiedemann–Franz law [82,83],
where L was approximated by the Lorenz number L0 that takes the value 2.44 × 10⁸ WΩK−1. Whereas the deviation of the L/L0 ratio from one is still an open question for nanoscale materials [84], it seems that the deviation from the Wiedemann–Franz law occurs mainly at low temperature (well below 300 K) where lattice vibrations increase the L/L0 ratio above 1. However, this tendency can also be counteracted by electronic corrections, leading finally to a small change of the L/L0 ratio (between 0.8 and 1.2, at most). For bulk compounds, the same effects can occur. Therefore, we are confident that the conclusions presented hereafter should not change drastically with L. Figure 6 shows the calculated at 300 K, 500 K, and 700 K as a function of the carrier concentration. Due to the linear correlation between and , the impact of carrier concentration and temperature on the electronic thermal conductivity is the same to that on the electrical conductivity. For both n-type and p-type doping, increases with the increase in carrier concentration, and increases (decreases, resp.) with temperature for low (high, resp.) carrier concentrations. In each case, the n-type PbSnTeSe has a larger than the p-type.
3.4. Machine-Learned Force-Field Potential
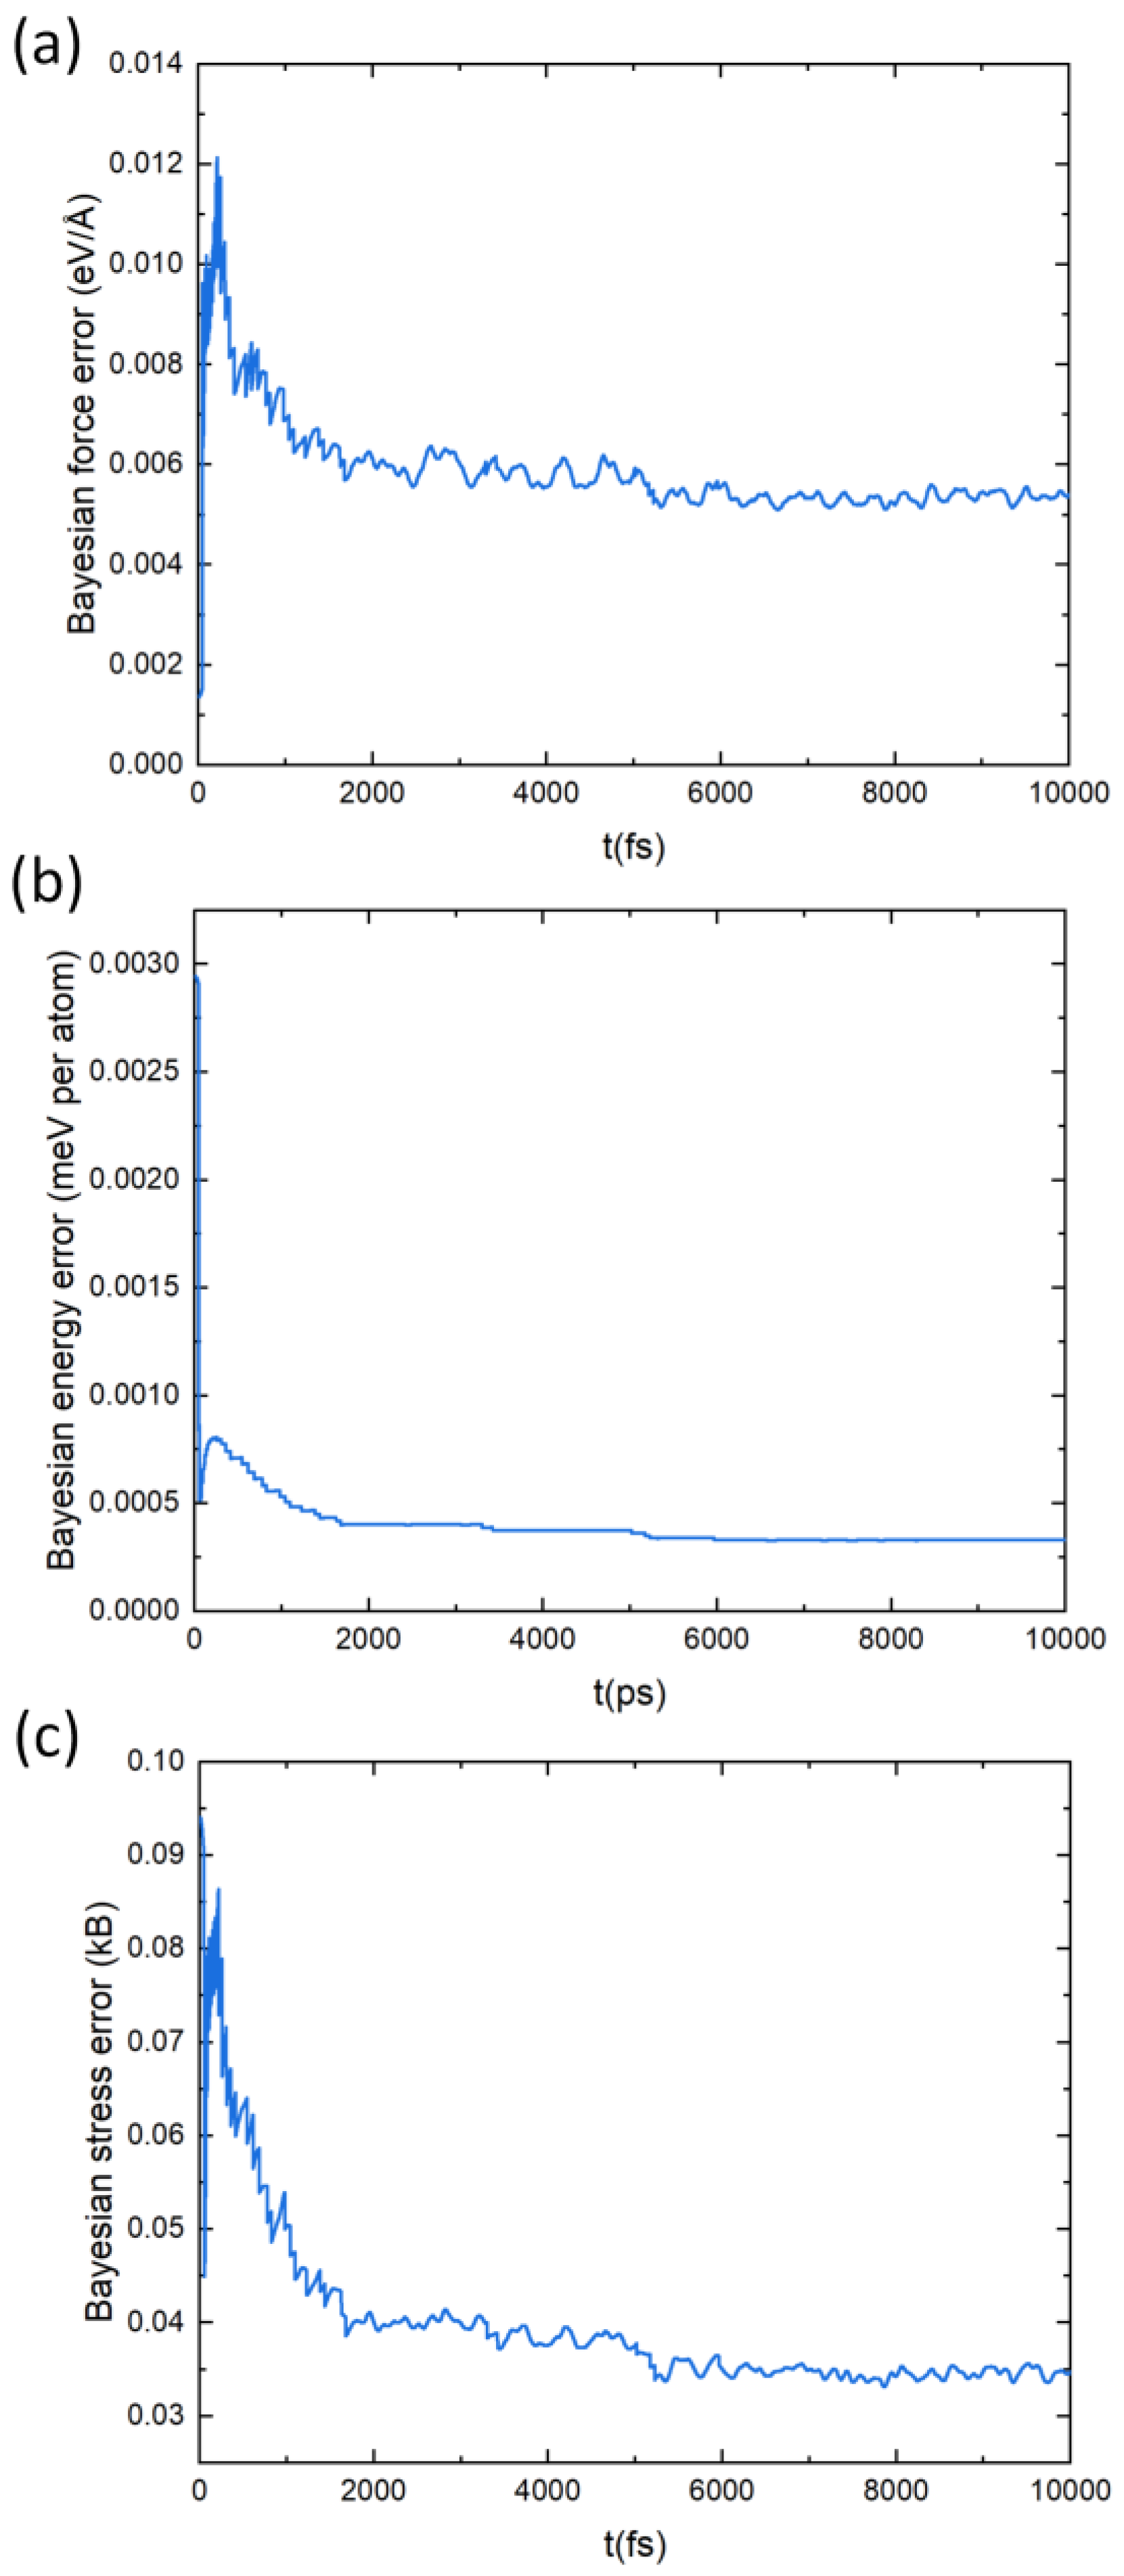
To build an interatomic potential force field (FF) for PbSnTeSe the on-the-fly machine-learned FF algorithm integrated in the VASP code was used. The training strategy of MLFF consists in constructing the force field on the fly during MD simulation and the predicted Bayesian error is used at every MD step to judge whether additional first-principle calculations need to be performed and a new structure be included in the dataset or not. When the force field is trained by the on-the-fly machine-learning algorithm, many of the MD steps are carried out with the force field, and first-principles calculations are executed only when the predicted Bayesian error is large. Figure 7 depicts the estimated Bayesian error of the MLFF, which shows that it is consistently lowering. Table 2 shows the root-means-square errors (RMSE) in the energies, forces, and stress tensors predicted by MLFFs for the training dataset. The predicted errors are low, which agrees with the general observation that the Bayesian linear regression (BLR), which was adopted to obtain the regression coefficients of kernel-based methods, leads to lower errors than other methods [59]. The lattice parameters calculated with the MLFF are a = 12.72 Å, b = 12.64 Å, c = 12.67 Å, α = 89.9°, β = 90.1° and γ = 90.2°, which are very close to those calculated with PBE.
3.5. Lattice Thermal Conductivity of PbSnTeSe
According to the Green–Kubo theory, the thermal conductivity and the heat flux are related by [64]:
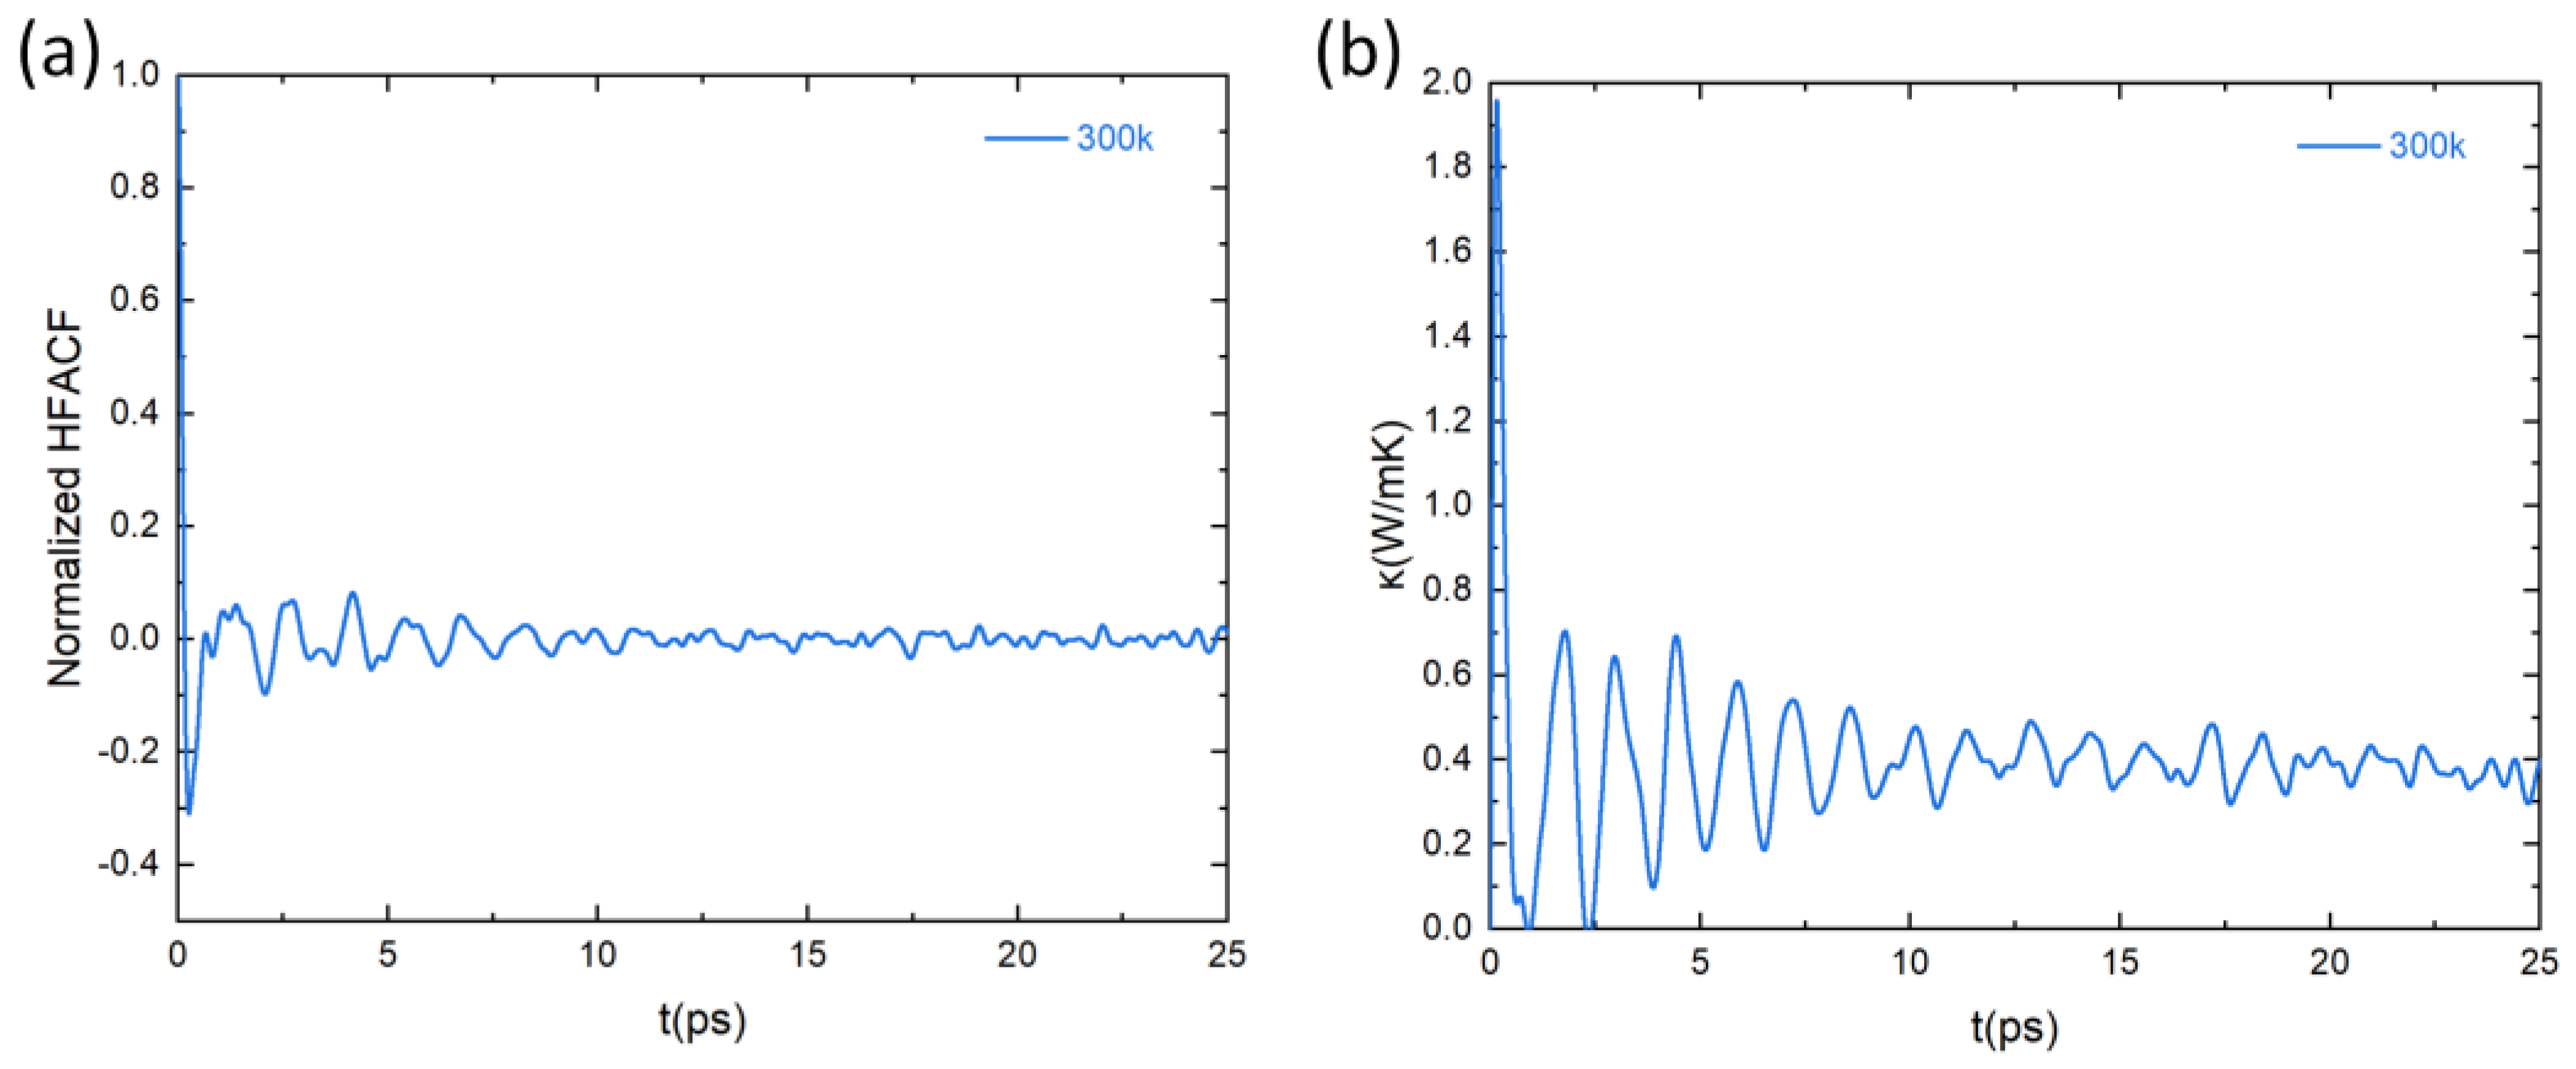
where , and denote the Boltzmann constant, the temperature, and the volume of the system, respectively. is the heat flux and the symbols represent the ensemble average over every MD simulation. Based on the heat flux calculated by the MLFF, the heat-flux autocorrelation function (HFACF) of PbSnTeSe was obtained. Figure 8a shows the calculated normalized averaged HFACF at the temperature of 300 K as a function of correlation time. At the beginning, the HFACF starts at one and rapidly drops to oscillate around zero. As correlation time increases, the oscillation gradually decreases, and finally approaches zero, indicating that the HFACF has converged. The HFACF is then used to determine the thermal conductivity () of PbSnTeSe. Figure 8b shows the calculated at the temperature of 300 K as a function of correlation time. The trend of over correlation time is the same as that of HFACF. Initially, the oscillation is relatively large and finally tends to stabilize converging towards a constant value, hence asserting the proper convergence of our simulations.
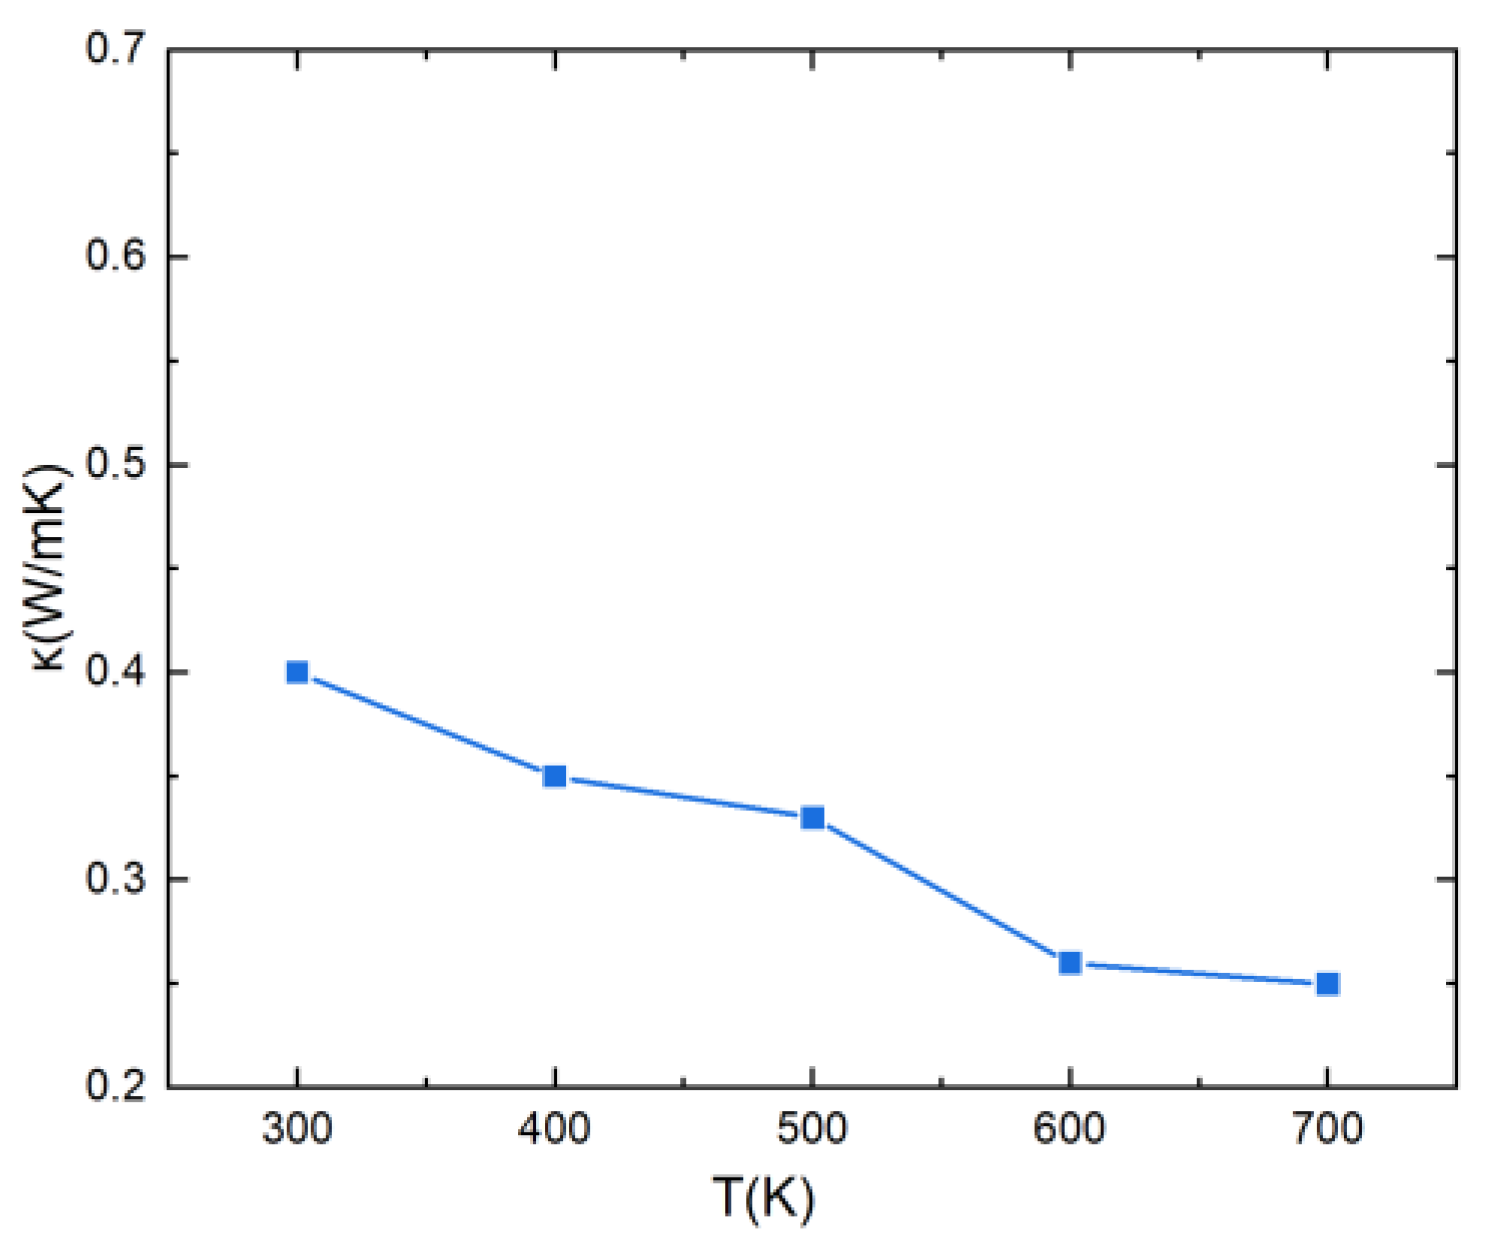
Using the same approach, the value of was computed for various temperatures in the range 300–700 K (Figure 9). At 300 K, the value is 0.4 W K−1 m−1, which is a very low value of the lattice thermal conductivity, favorable for thermoelectric materials. This is due to the lattice distortion effect of high-entropy alloys that can reduce phonon velocity and enhance phonon scattering, resulting in low thermal conductivity. Additionally, one can observe that when the temperature rises, the thermal conductivity of the lattice decreases, which is also due to an increase in phonon scattering at higher temperatures.
3.6. Figure of Merit of PbSnTeSe
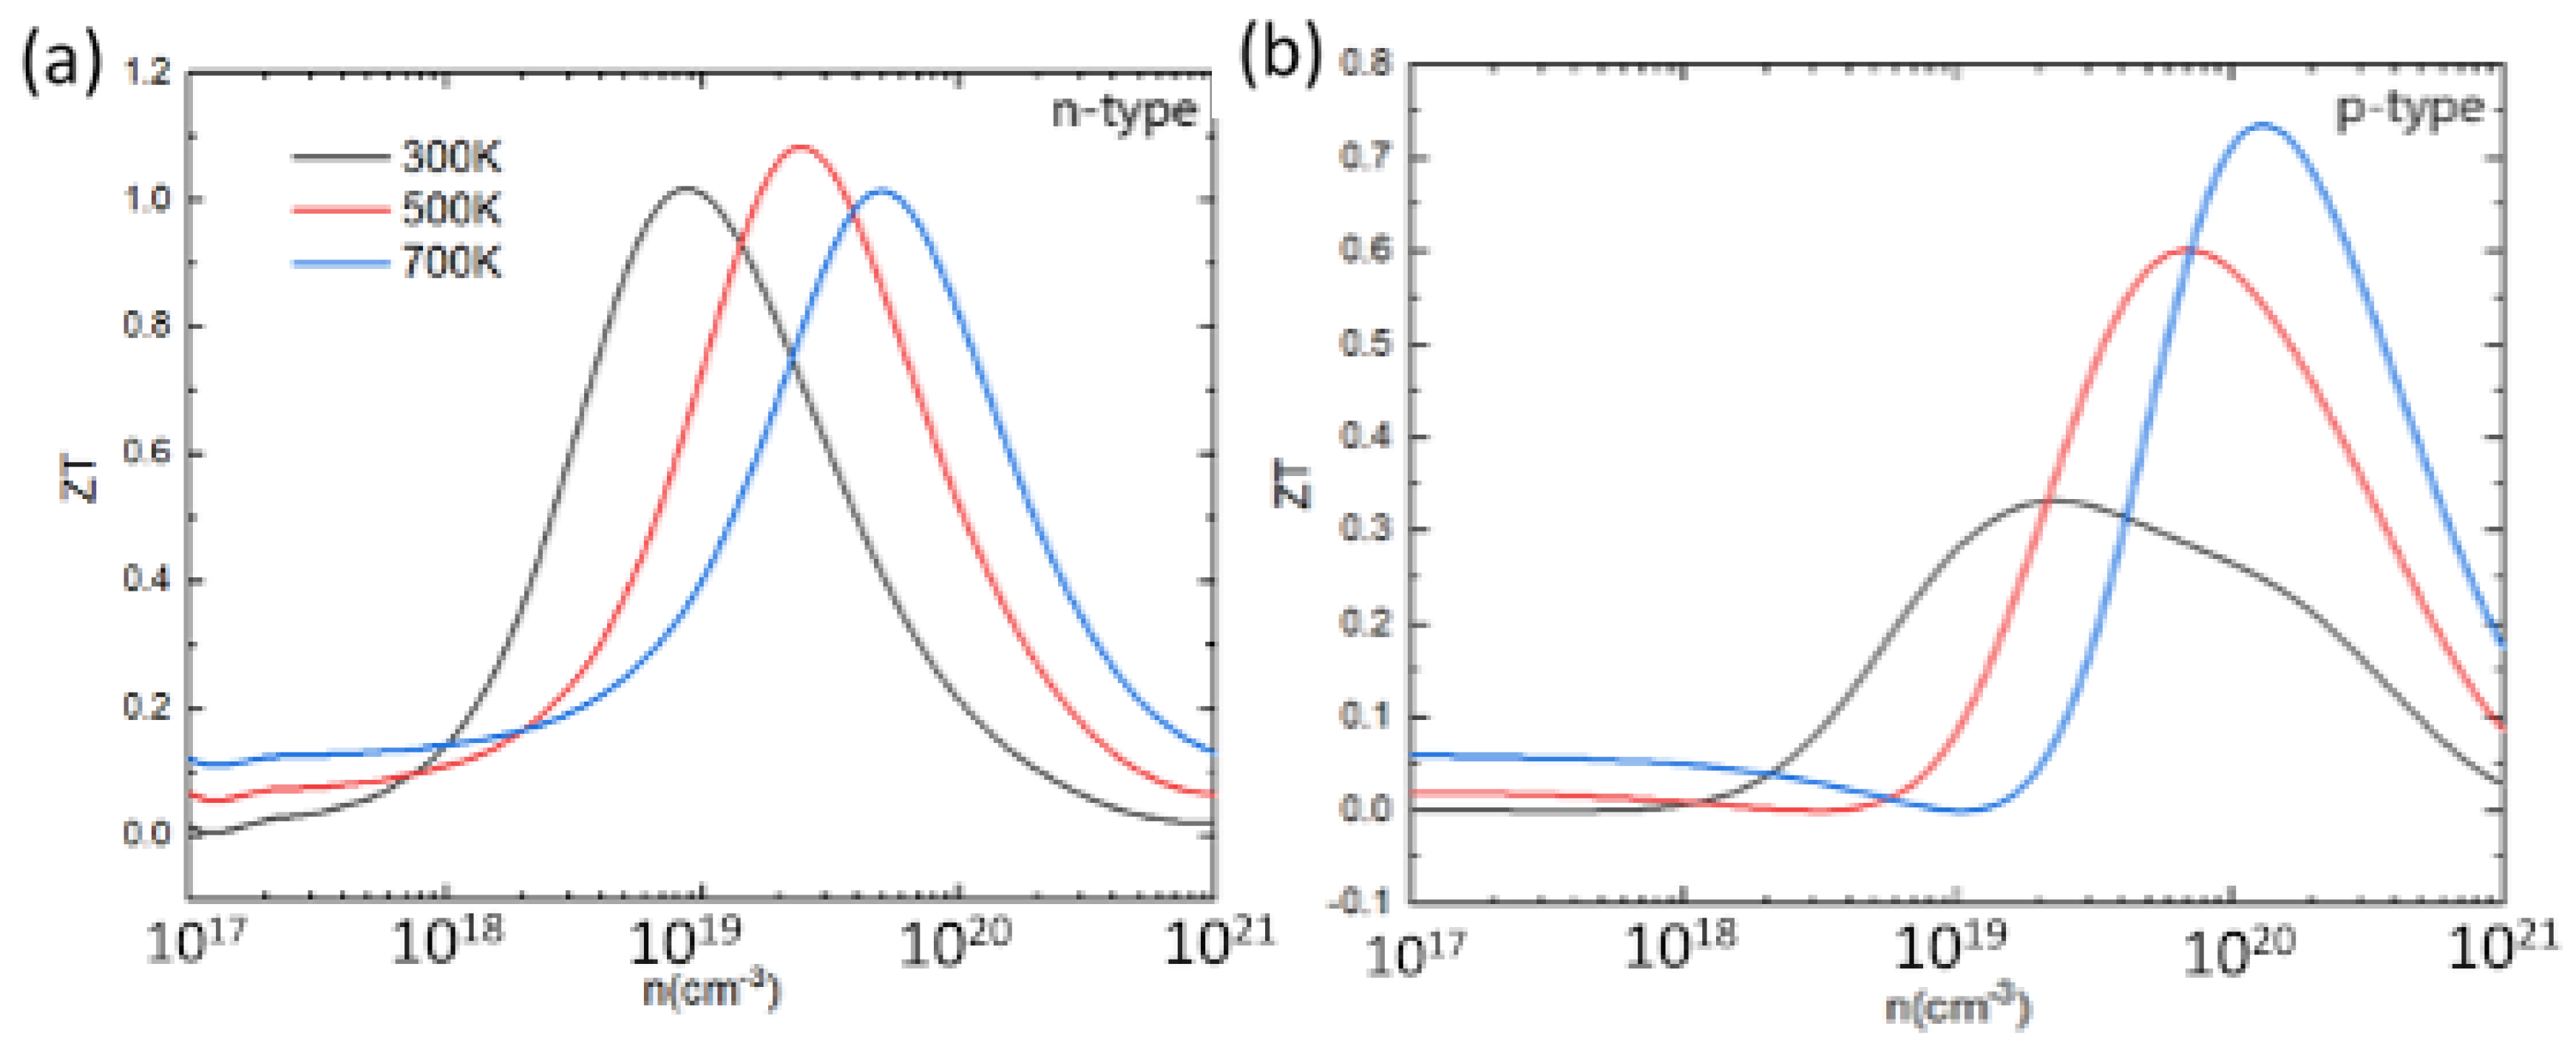
Based on the electronic and thermal transport coefficients, the ZT value can be determined. Figure 10 shows the calculated ZT at 300 K, 500 K, and 700 K as a function of the carrier concentration. For both p-type and n-type PbSnTeSe, the ZT value first increases to an optimal value then decreases with increasing concentration. The peak value of ZT for n-type does not vary significantly as the temperature rises, only the ideal carrier concentration shifts a little towards higher values. However, for p-type, the peak of ZT increases significantly with increasing temperature, and the ideal carrier concentration shifts to higher values. The best ZT value for n-type PbSnTeSe is 1.1 at 500 K, while for p-type doping it amounts to 0.75 at 700 K. At each temperature, the ZT value for n-type compound is greater than that of p-type, mainly resulting from the large electrical conductivity for n-type doping, indicating that n-type PbSnTeSe exhibits better thermoelectric properties than the p-type.
3.7. Comparison with Available Data on PbSnTeSe and Other HEA
As mentioned in the introduction section, Fan et al. [61] and Raphel et al. [62,63] have reported experimental investigations on the thermoelectric properties of PbSnTeSe. The transport coefficients reported by these groups are presented in Table 3. We first note that the experimental figures of merit ZT are lower than ours by a factor of around two. To trace back the origin of this difference, we compare the predicted transport coefficients at 700 K and for the carrier concentration in electrons of 6 × 10¹⁹ e/cm−3 with the experimental results from Fan et al. The calculated total thermal conductivity (2.3 W/(mK)) is higher than that obtained experimentally, which should degrade the theoretical ZT value, but this is not what we observe. By contrast the calculated power factor S2σ is much higher (almost eight times as high). As our Seebeck coefficient is the same as the experimental one, the reason for the difference is to be found in the electrical conductivity. Indeed, σtheo amounts to 15 × 104 S/m. This large value can be explained by two factors. First, the calculated gap that includes the spin–orbit interaction is smaller by a factor of three than the experimental result, and second, we are modeling a pure, defect-free compound. In real compounds, electrons are scattered by impurities, defects, and grains boundaries, which are not accounted for in our model.
Recently, Bafekry et al. [85] have reported thermoelectric properties for the GeSnPbSSeTe HEA. Their investigation is limited to the electronic transport properties (Seebeck coefficient and electrical and electronic thermal conductivities) but the electrons relaxation time was not determined. Interestingly, the Seebeck coefficient for the n-doped compound is very similar to that of PbSnTeSe (around −150 μV/K). Assuming about the same value of the electron relaxation time the electrical conductivity of GeSnPbSSeTe is of the same order of magnitude (~20 × 104 S/m) as that of PbSnTeSe. Assuming further that the thermal conductivity is similar for both compounds, one can infer that these compounds perform equally. From the experimental side [86], GeSnPbSSeTe shows a similar Seebeck coefficient, but the electrical conductivity is much lower, being of the order of 600 S/m.
As a different HEA, Sn0.25Pb0.25Mn0.25Ge0.25Te was investigated both experimentally and theoretically by Wang et al. [87]. A ZT value of 1.0 was found at 700 K, probably due to a drastic decrease in the thermal conductivity down to 0.76 W/(mK) by entropy engineering, compared to SnTe (4 W/(mK)). Compared to PbSnTeSe, the Seebeck coefficient of Sn0.25Pb0.25Mn0.25Ge0.25Te is twice as small (~100 μV/K), but the power factor is notably higher (14 × 10−4 W/(mK2)). It was indeed observed that the electrical conductivity increases with alloying with more elements. This result shows that, PbSnTeSe could be an interesting candidate for thermoelectric application as a high-entropy alloy materials, but there is probably room for improvement, in particular on the electrical conductivity by further alloying with other elements.
4. Conclusions
In summary, by combining first-principles calculations and on-the-fly machine learning technique with the semiclassical Boltzmann transport theory and Green–Kubo theory, the thermoelectric transport properties of PbSnTeSe high-entropy alloy have been thoroughly investigated. The electronic and thermal transport coefficients of PbSnTeSe high entropy-alloy have been discussed in detail. The results indicate that PbSnTeSe has very low lattice thermal conductivities, below 0.4 W K−1 m−1. It has been found that the PF values for n-type doping are always larger than those for p-type doping because of the higher electrical conductivity. The n-type PbSnTeSe exhibits better thermoelectric properties than the p-type. The maximum ZT (≈1.1) is found at 500 K for n-type doping. These results confirm that the PbSnTeSe HEA is a promising thermoelectric (TE) material.
Author Contributions
Conceptualization, M.-C.R. and P.B.; Methodology, M.X., M.-C.R. and P.B.; Software, M.X.; Validation, M.-C.R. and P.B.; Formal analysis, M.X.; Investigation, M.X.; Data curation, M.X.; Writing—original draft, M.X.; Writing—review & editing, M.-C.R. and P.B.; Supervision, M.-C.R. and P.B.; Project administration, M.-C.R. and P.B. All authors have read and agreed to the published version of the manuscript.
Funding
This research received no external funding.
Institutional Review Board Statement
Not applicable.
Informed Consent Statement
Not applicable.
Data Availability Statement
Data available upon request.
Acknowledgments
The China Scholarship Council is acknowledged for supporting MX PhD thesis. This work has been carried out under the allocation A0110806881 granted by the Grand Equipement National de Calcul Intensif (HPC resources of GENCI—France). The Centre de Calcul Intensif d’Aix-Marseille is acknowledged for granting access to its high-performance computing resources.
Conflicts of Interest
The authors declare no conflict of interest.
References
- Jaworski, C.M.; Wiendlocha, B.; Jovovic, V.; Heremans, J.P. Combining alloy scattering of phonons and resonant electronic levels to reach a high thermoelectric figure of merit in PbTeSe and PbTeS alloys. Energy Environ. Sci. 2011, 4, 4155–4162. [Google Scholar] [CrossRef]
- Snyder, G.J.; Toberer, E.S. Complex thermoelectric materials. Nat. Mater. 2008, 7, 105–114. [Google Scholar] [CrossRef] [PubMed] [Green Version]
- Biswas, K.; He, J.; Blum, I.D.; Wu, C.-I.; Hogan, T.P.; Seidman, D.N.; Dravid, V.P.; Kanatzidis, M.G. High-performance bulk thermoelectrics with all-scale hierarchical architectures. Nature 2012, 489, 414–418. [Google Scholar] [CrossRef] [PubMed]
- Sootsman, J.R.; Chung, D.Y.; Kanatzidis, M.G. New and Old Concepts in Thermoelectric Materials. Angew. Chem. Int. Ed. 2009, 48, 8616–8639. [Google Scholar] [CrossRef] [PubMed]
- Ioffe, A.F.; Stil’Bans, L.S.; Iordanishvili, E.K.; Stavitskaya, T.S.; Gelbtuch, A.; Vineyard, G. Semiconductor Thermoelements and Thermoelectric Cooling. Phys. Today 1959, 12, 42. [Google Scholar] [CrossRef]
- Vineis, C.J.; Shakouri, A.; Majumdar, A.; Kanatzidis, M.G. Nanostructured Thermoelectrics: Big Efficiency Gains from Small Features. Adv. Mater. 2010, 22, 3970–3980. [Google Scholar] [CrossRef] [PubMed]
- Pei, Y.; Shi, X.; LaLonde, A.; Wang, H.; Chen, L.; Snyder, G.J. Convergence of electronic bands for high performance bulk thermoelectrics. Nature 2011, 473, 66–69. [Google Scholar] [CrossRef] [Green Version]
- Pei, Y.; Wang, H.; Snyder, G.J. Band Engineering of Thermoelectric Materials. Adv. Mater. 2012, 24, 6125–6135. [Google Scholar] [CrossRef]
- Dresselhaus, M.S.; Chen, G.; Tang, M.Y.; Yang, R.G.; Lee, H.; Wang, D.Z.; Ren, Z.F.; Fleurial, J.; Gogna, P. New Directions for Low-Dimensional Thermoelectric Materials. Adv. Mater. 2007, 19, 1043–1053. [Google Scholar] [CrossRef]
- Zhang, J.; Liu, H.J.; Cheng, L.; Wei, J.; Liang, J.H.; Fan, D.D.; Shi, J.; Tang, X.F.; Zhang, Q.J. Phosphorene nanoribbon as a promising candidate for thermoelectric applications. Sci. Rep. 2014, 4, 6452. [Google Scholar] [CrossRef] [Green Version]
- Park, K.H.; Martin, P.N.; Ravaioli, U. Electronic and thermal transport study of sinusoidally corrugated nanowires aiming to improve thermoelectric efficiency. Nanotechnology 2015, 27, 35401. [Google Scholar] [CrossRef] [PubMed]
- Ouyang, T.; Jiang, E.; Tang, C.; Li, J.; He, C.; Zhong, J. Thermal and thermoelectric properties of monolayer indium triphosphide (InP3): A first-principles study. J. Mater. Chem. A 2018, 6, 21532–21541. [Google Scholar] [CrossRef]
- Luu, S.D.; Vaqueiro, P. Synthesis, characterisation and thermoelectric properties of the oxytelluride Bi2O2Te. J. Solid State Chem. 2015, 226, 219–223. [Google Scholar] [CrossRef]
- Chen, W.; Pöhls, J.-H.; Hautier, G.; Broberg, D.; Bajaj, S.; Aydemir, U.; Gibbs, Z.M.; Zhu, H.; Asta, M.; Snyder, G.J. Under-standing thermoelectric properties from high-throughput calculations: Trends, insights, and comparisons with experiment. J. Mater. Chem. C 2016, 4, 4414–4426. [Google Scholar] [CrossRef] [Green Version]
- Tsai, M.-H.; Yeh, J.-W. High-Entropy Alloys: A Critical Review. Mater. Res. Let. 2014, 2, 107–123. [Google Scholar] [CrossRef]
- Yeh, J.-W.; Chen, S.K.; Lin, S.-J.; Gan, J.-Y.; Chin, T.-S.; Shun, T.-T.; Tsau, C.-H.; Chang, S.-Y. Nanostructured High-Entropy Alloys with Multiple Principal Elements: Novel Alloy Design Concepts and Outcomes. Adv. Eng. Mater. 2004, 6, 299–303. [Google Scholar] [CrossRef]
- Yeh, J.-W. Recent progress in high-entropy alloys. Eur. J. Control 2006, 31, 633–648. [Google Scholar] [CrossRef]
- Santodonato, L.J.; Zhang, Y.; Feygenson, M.; Parish, C.M.; Gao, M.C.; Weber, R.J.; Neuefeind, J.C.; Tang, Z.; Liaw, P.K. Deviation from high-entropy configurations in the atomic distributions of a multi-principal-element alloy. Nat. Commun. 2015, 6, 5964. [Google Scholar] [CrossRef] [Green Version]
- Senkov, O.; Miller, J.; Miracle, D.; Woodward, C. Accelerated exploration of multi-principal element alloys with solid solution phases. Nat. Commun. 2015, 6, 6529. [Google Scholar] [CrossRef] [Green Version]
- Dragoe, N.; Bérardan, D. Order emerging from disorder. Science 2019, 366, 573–574. [Google Scholar] [CrossRef]
- Ataie, S.; Keshtmand, R.; Zamani-Meymian, M. Nano-mechanical properties of Cr-Zr-Nb-N medium entropy alloy films produced by reactive sputtering. Int. J. Refract. Met. Hard Mater. 2023, 110, 106006. [Google Scholar] [CrossRef]
- Qin, J.; Liu, Z.; Tan, P.; Yi, D.; Wang, B. Study on the formation and regulation mechanism of W phase and the improvement of mechanical properties in homogenization of cast Al–Cu-Sc-Zr alloys: Experiments and calculations. Vacuum 2023, 207, 111631. [Google Scholar] [CrossRef]
- Yu, Z.; Yan, Y.; Qiang, J.; Gao, W.; Wang, X.; Liu, X.; Du, W. Microstructure evolution and compressive property variation of AlxCoCrFeNi high entropy alloys produced by directional solidification. Intermetallics 2023, 152, 107749. [Google Scholar] [CrossRef]
- Ali, N.; Zhang, L.; Liu, D.; Zhou, H.; Sanaullah, K.; Zhang, C.; Chu, J.; Nian, Y.; Cheng, J. Strengthening mechanisms in high entropy alloys: A review. Mater. Today Commun. 2022, 33, 104686. [Google Scholar] [CrossRef]
- Łoński, W.; Spilka, M.; Kądziołka-Gaweł, M.; Gębara, P.; Radoń, A.; Warski, T.; Łoński, S.; Barbusiński, K.; Młynarek-Żak, K.; Babilas, R. Microstructure, magnetic properties, corrosion resistance and catalytic activity of dual-phase AlCoNiFeTi and AlCoNiFeTiSi high entropy alloys. J. Alloy. Compd. 2023, 934, 167827. [Google Scholar] [CrossRef]
- Xing, F.; Ma, J.; Shimizu, K.; Furukawa, S. High-entropy intermetallics on ceria as efficient catalysts for the oxidative de-hydrogenation of propane using CO2. Nat. Commun. 2022, 13, 5065. [Google Scholar] [CrossRef]
- Mori, K.; Hashimoto, N.; Kamiuchi, N.; Yoshida, H.; Kobayashi, H.; Yamashita, H. Hydrogen spillover-driven synthesis of high-entropy alloy nanoparticles as robust catalyst for CO2 hydrogenation. Nat. Commun. 2021, 12, 3884. [Google Scholar] [CrossRef]
- Liu, Y.; Chen, Z.; Yang, X.; Zhang, J.; Sun, Z.; Chen, Y.; Liu, F. High entropy nanoparticles of CoCrXFeNi (X=Al, Cu, Mn) loaded on activated carbon for efficient degradation of methylene blue. J. Mater. Res. Technol. 2021, 15, 256–267. [Google Scholar] [CrossRef]
- Nundy, S.; Tatar, D.; Kojcinovic, J.; Ullah, H.; Ghosh, A.; Mallick, T.K.; Meinusch, R.; Smarsly, B.M.; Tahir, A.A.; Djerdj, I. Bandgap Engineering in Novel Fluorite-Type Rare Earth High-Entropy Oxides (RE-HEOs) with Computational and Experi-mental Validation for Photocatalytic Water Splitting Applications. Adv. Sustain. Syst. 2022, 6, 2200067. [Google Scholar] [CrossRef]
- Pang, Z.; Wang, B.; Yan, X.; Wang, C.; Yin, S.; Li, H.; Xia, J. Unique Sillén-structured multimetal high entropy oxyhalide PbxCd1-xBiO2Br with enhanced photocatalytic activity. Appl. Surf. Sci. 2022, 578, 151921. [Google Scholar] [CrossRef]
- Wang, T.; Wang, Y.; Wang, N.; Xu, S.; Han, Z.; Wang, Y. Development of a novel (Ni40Fe30Co20Al10)90Ti10 high-entropy alloy with excellent photocatalytic performance. Mater. Lett. 2021, 283, 128817. [Google Scholar] [CrossRef]
- Edalati, P.; Shen, X.-F.; Watanabe, M.; Ishihara, T.; Arita, M.; Fuji, M.; Edalati, K. High-entropy oxynitride as a low-bandgap and stable photocatalyst for hydrogen production. J. Mater. Chem. A 2021, 9, 15076–15086. [Google Scholar] [CrossRef]
- Ju, S.-P.; Li, C.-C.; Shih, H.-T. How atoms of polycrystalline Nb20.6Mo21.7Ta15.6W21.1V21.0 refractory high-entropy alloys rearrange during the melting process. Sci. Rep. 2022, 12, 5183. [Google Scholar] [CrossRef] [PubMed]
- Detor, A.; Oppenheimer, S.; Casey, R.; Crawford, C. Refractory high entropy alloy dataset with room temperature ductility screening. Data Brief 2022, 45, 108582. [Google Scholar] [CrossRef]
- Lee, C.; Maresca, F.; Feng, R.; Chou, Y.; Ungar, T.; Widom, M.; An, K.; Poplawsky, J.D.; Chou, Y.-C.; Liaw, P.K.; et al. Strength can be controlled by edge dislocations in refractory high-entropy alloys. Nat. Commun. 2021, 12, 5474. [Google Scholar] [CrossRef] [PubMed]
- Das, S.; Robi, P.S. A novel refractory WMoVCrTa high-entropy alloy possessing fine combination of compressive stress-strain and high hardness properties. Adv. Powder Technol. 2020, 31, 4619–4631. [Google Scholar] [CrossRef]
- Chen, B.; Zhuo, L. Latest progress on refractory high entropy alloys: Composition, fabrication, post processing, performance, simulation and prospect. Int. J. Refract. Met. Hard Mater. 2023, 110, 105993. [Google Scholar] [CrossRef]
- Pan, Y.; Liu, J.-X.; Tu, T.-Z.; Wang, W.; Zhang, G.-J. High-entropy oxides for catalysis: A diamond in the rough. Chem. Eng. J. 2023, 451, 138659. [Google Scholar] [CrossRef]
- Mirzoev, A.A.; Gelchinski, B.R.; Rempel, A.A. Neural Network Prediction of Interatomic Interaction in Multielement Sub-stances and High-Entropy Alloys: A Review. In Doklady Physical Chemistry; Springer: Berlin/Heidelberg, Germany, 2022; Volume 504, pp. 51–77. [Google Scholar]
- Tiwary, C.S.; Pandey, P.; Sarkar, S.; Das, R.; Samal, S.; Biswas, K.; Chattopadhyay, K. Five decades of research on the development of eutectic as engineering materials. Prog. Mater. Sci. 2022, 123, 100793. [Google Scholar] [CrossRef]
- Yadav, T.P.; Kumar, A.; Verma, S.K.; Mukhopadhyay, N.K. High-Entropy Alloys for Solid Hydrogen Storage: Potentials and Prospects. Trans. Indian Natl. Acad. Eng. 2022, 7, 147–156. [Google Scholar] [CrossRef]
- Chen, Y.; Fu, H.; Huang, Y.; Huang, L.; Zheng, X.; Dai, Y.; Huang, Y.; Luo, W. Opportunities for High-Entropy Materials in Rechargeable Batteries. ACS Mater. Lett. 2020, 3, 160–170. [Google Scholar] [CrossRef]
- Zhang, Y.; Zuo, T.T.; Tang, Z.; Gao, M.C.; Dahmen, K.A.; Liaw, P.K.; Lu, Z.P. Microstructures and properties of high-entropy alloys. Prog. Mater. Sci. 2014, 61, 1–93. [Google Scholar] [CrossRef]
- Rost, C.M.; Borman, T.; Hossain, M.D.; Lim, M.; Quiambao-Tomko, K.F.; Tomko, J.A.; Brenner, D.W.; Maria, J.-P.; Hopkins, P.E. Electron and phonon thermal conductivity in high entropy carbides with variable carbon content. Acta Mater. 2020, 196, 231–239. [Google Scholar] [CrossRef]
- Wang, H.; LaLonde, A.D.; Pei, Y.; Snyder, G.J. The Criteria for Beneficial Disorder in Thermoelectric Solid Solutions. Adv. Funct. Mater. 2013, 23, 1586–1596. [Google Scholar] [CrossRef]
- Berardan, D.; Meena, A.K.; Franger, S.; Herrero, C.; Dragoe, N. Controlled Jahn-Teller distortion in (MgCoNiCuZn)O-based high entropy oxides. J. Alloys Compd. 2017, 704, 693–700. [Google Scholar] [CrossRef]
- Zhang, R.-Z.; Gucci, F.; Zhu, H.; Chen, K.; Reece, M.J. Data-Driven Design of Ecofriendly Thermoelectric High-Entropy Sulfides. Inorg. Chem. 2018, 57, 13027–13033. [Google Scholar] [CrossRef] [Green Version]
- Yamashita, A.; Goto, Y.; Miura, A.; Moriyoshi, C.; Kuroiwa, Y.; Mizuguchi, Y. n-Type thermoelectric metal chalcogenide (Ag,Pb,Bi)(S,Se,Te) designed by multi-site-type high-entropy alloying. Mater. Res. Lett. 2021, 9, 366–372. [Google Scholar] [CrossRef]
- Jiang, B.; Yu, Y.; Cui, J.; Liu, X.; Xie, L.; Liao, J.; Zhang, Q.; Huang, Y.; Ning, S.; Jia, B.; et al. High-entropy-stabilized chalcogenides with high thermoelectric performance. Science 2021, 371, 830–834. [Google Scholar] [CrossRef]
- Zhai, W.; Li, L.; Zhao, M.; Hu, Q.; Li, J.; Yang, G.; Yan, Y.; Zhang, C.; Liu, P.-F. Phonon transport in Zintl Ba2ZnAs2 and Ba2ZnSb2: A first-principles study. Mater. Sci. Semicond. Process. 2022, 141, 106446. [Google Scholar] [CrossRef]
- Andriyevsky, B.; Barchiy, I.E.; Studenyak, I.P.; Kashuba, A.I.; Piasecki, M. Electron, phonon and thermoelectric properties of Cu7PS6 crystal calculated at DFT level. Sci. Rep. 2021, 11, 19065. [Google Scholar] [CrossRef]
- Cheng, S.; He, Y.; Chang, Z.; Sun, Z.; Zhang, X.; Tang, D.; Li, G.K.; Wang, N.; Shen, C.; Jiang, B. Structural, elastic, phononic, optical and electronic properties investigation of two-dimensional aluminum, gallium, indium iodide sulfide for photocatalytic water splitting. Int. J. Hydrog. Energy 2022, 47, 41640–41647. [Google Scholar] [CrossRef]
- Shao, X.; Sun, Y.; Zhang, Y.; Wu, Q.; Zhao, J.; Li, Y.; Liu, B. Contributions of bonding heterogeneity to mechanical and thermal properties of rare earth molybdates for thermal barrier coatings. J. Phys. Chem. Solids 2023, 173, 111087. [Google Scholar] [CrossRef]
- Wang, X.; Zhao, Y.; Zeng, S.; Wang, Z.; Chen, Y.; Ni, J. Cubic halide perovskites as potential low thermal conductivity materials: A combined approach of machine learning and first-principles calculations. Phys. Rev. B 2022, 105, 014310. [Google Scholar] [CrossRef]
- Wang, Y.; Zhang, X. On the role of crystal defects on the lattice thermal conductivity of monolayer WSe2 (P63/mmc) thermoelectric materials by DFT calculation. Superlattices Microstruct. 2021, 160, 107057. [Google Scholar] [CrossRef]
- Gupta, M.K.; Ding, J.; Bansal, D.; Abernathy, D.L.; Ehlers, G.; Osti, N.C.; Zeier, W.G.; Delaire, O. Strongly Anharmonic Pho-nons and Their Role in Superionic Diffusion and Ultralow Thermal Conductivity of Cu7PSe6. Adv. Energy Mater. 2022, 12, 2200596. [Google Scholar] [CrossRef]
- Han, L.; Chen, X.; Wang, Q.; Chen, Y.; Xu, M.; Wu, L.; Chen, C.; Lu, P.; Guan, P. Neural network potential for studying the thermal conductivity of Sn. Comput. Mater. Sci. 2021, 200, 110829. [Google Scholar] [CrossRef]
- Li, R.; Liu, Z.; Rohskopf, A.; Gordiz, K.; Henry, A.; Lee, E.; Luo, T. A Deep neural network interatomic potential for studying thermal conductivity of β-Ga2O3. Appl. Phys. Lett. 2020, 117, 152102. [Google Scholar] [CrossRef]
- Verdi, C.; Kasai, F.; Liu, P.; Jinnouchi, R.; Kresse, G. Thermal transport and phase transitions of zirconia by on-the-fly machine-learned interatomic potentials. NPJ Comput. Mater. 2021, 7, 156. [Google Scholar] [CrossRef]
- Korotaev, P.; Novoselov, I.; Yanilkin, A.; Shapeev, A. Accessing thermal conductivity of complex compounds by machine learning interatomic potentials. Phys. Rev. B 2019, 100, 144308. [Google Scholar] [CrossRef]
- Fan, Z.; Wang, H.; Wu, Y.; Liu, X.; Lu, Z. Thermoelectric performance of PbSnTeSe high-entropy alloys. Mater. Res. Lett. 2017, 5, 187–194. [Google Scholar] [CrossRef]
- Raphel, A.; Singh, A.K.; Vivekanandhan, P.; Kumaran, S. Thermoelectric performance of nanostructured PbSnTeSe high entropy thermoelectric alloy synthesized via spark plasma sintering. Phys. B Condens. Matter 2021, 622, 413319. [Google Scholar] [CrossRef]
- Raphel, A.; Vivekanandhan, P.; Rajasekaran, A.K.; Kumaran, S. Tuning figure of merit in Na doped nanocrystalline PbSnTeSe high entropy alloy via band engineering. Mater. Sci. Semicond. Process. 2022, 138, 106270. [Google Scholar] [CrossRef]
- Baroni, S.; Bertossa, R.; Ercole, L.; Grasselli, F.; Marcolongo, A. Heat Transport in Insulators from Ab Initio Green-Kubo Theory. In Handbook of Materials Modeling: Applications: Current and Emerging Materials; Andreoni, W., Yip, S., Eds.; Springer: Berlin/Heidelberg, Germany, 2020; pp. 809–844. [Google Scholar]
- Podryabinkin, E.V.; Shapeev, A.V. Active learning of linearly parametrized interatomic potentials. Comput. Mater. Sci. 2017, 140, 171–180. [Google Scholar] [CrossRef] [Green Version]
- Jinnouchi, R.; Karsai, F.; Verdi, C.; Asahi, R.; Kresse, G. Descriptors representing two- and three-body atomic distributions and their effects on the accuracy of machine-learned inter-atomic potentials. J. Chem. Phys. 2020, 152, 234102. [Google Scholar] [CrossRef]
- Blöchl, P.E. Projector augmented-wave method. Phys. Rev. B 1994, 50, 17953–17979. [Google Scholar] [CrossRef] [Green Version]
- Kresse, G.; Hafner, J. Ab initio molecular dynamics for liquid metals. Phys. Rev. B 1993, 47, 558. [Google Scholar] [CrossRef] [PubMed]
- Kresse, G.; Furthmüller, J. Efficient iterative schemes for ab initio total-energy calculations using a plane-wave basis set. Phys. Rev. B 1996, 54, 11169–11186. [Google Scholar] [CrossRef]
- Kresse, G.; Furthmüller, J. Efficiency of ab-initio total energy calculations for metals and semiconductors using a plane-wave basis set. Comput. Mater. Sci. 1996, 6, 15–50. [Google Scholar] [CrossRef]
- Perdew, J.P.; Burke, K.; Ernzerhof, M. Generalized gradient approximation made simple. Phys. Rev. Lett. 1996, 77, 3865. [Google Scholar] [CrossRef] [Green Version]
- Ziesche, P.; Kurth, S.; Perdew, J.P. Density functionals from LDA to GGA. Comput. Mater. Sci. 1998, 11, 122–127. [Google Scholar] [CrossRef]
- Arrigoni, M.; Madsen, G.K.H. Comparing the performance of LDA and GGA functionals in predicting the T lattice thermal conductivity of III-V semiconductor materials in the zincblende structure: The cases of AlAs and BAs. Comput. Mater. Sci. 2019, 156, 354–360. [Google Scholar] [CrossRef] [Green Version]
- van de Walle, A.; Tiwary, P.; de Jong, M.; Olmsted, D.; Asta, M.; Dick, A.; Shin, D.; Wang, Y.; Chen, L.-Q.; Liu, Z.-K. Efficient stochastic generation of special quasirandom structures. Calphad 2013, 42, 13–18. [Google Scholar] [CrossRef]
- Madsen, G.K.; Carrete, J.; Verstraete, M.J. BoltzTraP2, a program for interpolating band structures and calculating semi-classical transport coefficients. Comput. Phys. Commun. 2018, 231, 140–145. [Google Scholar] [CrossRef] [Green Version]
- Bardeen, J.; Shockley, W. Deformation Potentials and Mobilities in Non-Polar Crystals. Phys. Rev. 1950, 80, 72–80. [Google Scholar] [CrossRef]
- Cutler, M.; Mott, N.F. Observation of Anderson Localization in an Electron Gas. Phys. Rev. 1969, 181, 1336–1340. [Google Scholar] [CrossRef]
- Dresselhaus, M.S.; Heremans, J.P. Recent Developments in Low-Dimensional Thermoelectric Materials, In Thermoelectrics Handbook Macro to Nano; Rowe, D.M., Ed.; CRC Taylor & Francis: Boca Raton, FL, USA, 2006; pp. 39–42. [Google Scholar]
- Drude, P. Zur Elektronentheorie der Metalle. Ann. Phys. 1900, 306, 566–613. [Google Scholar] [CrossRef] [Green Version]
- Drude, P. Zur elektronentheorie der metalle; II. Teil. galvanomagnetische und thermomagnetische effecte. Ann. Phys. 1900, 308, 369–402. [Google Scholar] [CrossRef] [Green Version]
- Sommerfeld, A. Zur Elektronentheorie der Metalle auf Grund der Fermischen Statistik. Z. Phys. 1928, 47, 1928. [Google Scholar] [CrossRef]
- Stojanovic, N.; Maithripala, D.H.S.; Berg, J.M.; Holtz, M. Thermal conductivity in metallic nanostructures at high temperature: Electrons, phonons, and the Wiedemann-Franz law. Phys. Rev. B 2010, 82, 075418. [Google Scholar] [CrossRef]
- Jonson, M.; Mahan, G.D. Mott’s formula for the thermopower and the Wiedemann-Franz law. Phys. Rev. B 1980, 21, 4223–4229. [Google Scholar] [CrossRef]
- Bürkle, M.; Asai, Y.; Buerkle, M. How To Probe the Limits of the Wiedemann–Franz Law at Nanoscale. Nano Lett. 2018, 18, 7358–7361. [Google Scholar] [CrossRef] [PubMed]
- Bafekry, A.; Shahrokhi, M.; Shafique, A.; Jappor, H.R.; Fadlallah, M.M.; Stampfl, C.; Ghergherehchi, M.; Mushtaq, M.; Feghhi, S.A.H.; Gogova, D. Semiconducting Chalcogenide Alloys Based on the (Ge, Sn, Pb) (S, Se, Te) Formula with Outstanding Properties: A First-Principles Calculation Study. ACS Omega 2021, 6, 9433–9441. [Google Scholar] [CrossRef] [PubMed]
- Deng, Z.; Olvera, A.; Casamento, J.; Lopez, J.S.; Williams, L.; Lu, R.; Shi, G.; Poudeu, P.F.P.; Kioupakis, E. Semiconducting High-Entropy Chalcogenide Alloys with Ambi-ionic Entropy Stabilization and Ambipolar Doping. Chem. Mater. 2020, 32, 6070–6077. [Google Scholar] [CrossRef]
- Wang, X.; Yao, H.; Zhang, Z.; Li, X.; Chen, C.; Yin, L.; Hu, K.; Yan, Y.; Li, Z.; Yu, B.; et al. Enhanced Thermoelectric Performance in High Entropy Alloys Sn0.25Pb0.25Mn0.25Ge0.25Te. ACS Appl. Mater. Interfaces 2021, 13, 18638–18647. [Google Scholar] [CrossRef] [PubMed]
Figure 1.
(a) Schematic view of the crystal structure of PbSnTeSe. (b) SQS generated by ATAT.

Figure 2.
Calculated band structures of PbSnTeSe without spin–orbit coupling (SOC) (a) and with SOC (b).
Figure 2.
Calculated band structures of PbSnTeSe without spin–orbit coupling (SOC) (a) and with SOC (b).

Figure 3.
Seebeck coefficient (S) for n-type (a) and p-type (b) PbSnTeSe at 300 K, 500 K and 700 K as a function of carrier concentration.
Figure 3.
Seebeck coefficient (S) for n-type (a) and p-type (b) PbSnTeSe at 300 K, 500 K and 700 K as a function of carrier concentration.

Figure 4.
Electrical conductivity (σ) for n-type (a) and p-type (b) PbSnTeSe at 300 K, 500 K and 700 K as a function of carrier concentration.
Figure 4.
Electrical conductivity (σ) for n-type (a) and p-type (b) PbSnTeSe at 300 K, 500 K and 700 K as a function of carrier concentration.

Figure 5.
Power factor (PF) for n-type (a) and p-type (b) PbSnTeSe at 300 K, 500 K and 700 K as a function of carrier concentration.
Figure 5.
Power factor (PF) for n-type (a) and p-type (b) PbSnTeSe at 300 K, 500 K and 700 K as a function of carrier concentration.

Figure 6.
Electronic part of the thermal conductivity (κe) for n-type (a) and p-type (b) PbSnTeSe at 300 K, 500 K, and 700 K as a function of carrier concentration.
Figure 6.
Electronic part of the thermal conductivity (κe) for n-type (a) and p-type (b) PbSnTeSe at 300 K, 500 K, and 700 K as a function of carrier concentration.

Figure 7.
Estimated Bayesian error in the forces (a), energies (b), and stress tensors (c) predicted by the MLFF for the training dataset.
Figure 7.
Estimated Bayesian error in the forces (a), energies (b), and stress tensors (c) predicted by the MLFF for the training dataset.

Figure 8.
Lattice thermal properties at 300 K from GK theory. (a) Heat-flux autocorrelation function (HFACF) normalized by its zero-time value and (b) lattice thermal conductivity as a function of correlation time at T = 300 K.
Figure 8.
Lattice thermal properties at 300 K from GK theory. (a) Heat-flux autocorrelation function (HFACF) normalized by its zero-time value and (b) lattice thermal conductivity as a function of correlation time at T = 300 K.

Figure 9.
Lattice thermal conductivity of PbSnTeSe as a function of temperature.

Figure 10.
Figure of merit (ZT) for n-type (a) and p-type (b) PbSnTeSe at 300 K, 500 K, and 700 K as a function of carrier concentration.
Figure 10.
Figure of merit (ZT) for n-type (a) and p-type (b) PbSnTeSe at 300 K, 500 K, and 700 K as a function of carrier concentration.


Table 1.
Elastic constant C, deformation potential E1, effective mass m* and relaxation times τ at 300 K, 500 K and 700 K of PbSnTeSe.
Table 1.
Elastic constant C, deformation potential E1, effective mass m* and relaxation times τ at 300 K, 500 K and 700 K of PbSnTeSe.
| Carrier Type | C | E1 | m* | τ (fs) | τ (fs) | τ (fs) |
|---|---|---|---|---|---|---|
| eV/Å3 | (eV) | (me) | 300 K | 500 K | 700 K | |
| Hole | 0.195 | 12.945 | 0.520 | 17.3 | 8.06 | 4.87 |
| Electron | 0.195 | 6.434 | 0.303 | 158 | 73.4 | 44.3 |
Table 2.
Root-means-square errors in the energies, forces, and stress tensors predicted by the MLFF for the training dataset.
Table 2.
Root-means-square errors in the energies, forces, and stress tensors predicted by the MLFF for the training dataset.
| Energy (meV/Atom) | Force (eV/Å) | Stress (kB) |
|---|---|---|
| 1.045 | 0.057 | 0.244 |
Table 3.
Experimental thermoelectric properties of PbSnTeSe (from Refs. [61,62]). The data from Fan et al. [61] are at 700 K and for n = 6 × 10¹⁹ e/cm−3, and those from Raphel et al. [62] are at 625 K.
| Property | Fan et al. [61] | Raphel et al. [62] |
|---|---|---|
| Seebeck coefficient (μV/K) | 160 | 160 |
| Electrical conductivity (S/m) | 2.86 × 10⁴ | 2.65 × 10⁴ |
| Power factor (W/(mK2)) | 8 × 10⁻⁴ | 6.7 × 10⁻⁴ |
| Lattice thermal conductivity (W/(mK)) | 0.87 | 0.45 |
| Total thermal conductivity (W/(mK)) | 1.2 | 0.9 |
| Figure of merit | 0.45 | 0.47 |
Disclaimer/Publisher’s Note: The statements, opinions and data contained in all publications are solely those of the individual author(s) and contributor(s) and not of MDPI and/or the editor(s). MDPI and/or the editor(s) disclaim responsibility for any injury to people or property resulting from any ideas, methods, instructions or products referred to in the content. |
© 2022 by the authors. Licensee MDPI, Basel, Switzerland. This article is an open access article distributed under the terms and conditions of the Creative Commons Attribution (CC BY) license (https://creativecommons.org/licenses/by/4.0/).
Share and Cite
MDPI and ACS Style
Xia, M.; Record, M.-C.; Boulet, P. Investigation of PbSnTeSe High-Entropy Thermoelectric Alloy: A DFT Approach. Materials 2023, 16, 235. https://doi.org/10.3390/ma16010235
AMA Style
Xia M, Record M-C, Boulet P. Investigation of PbSnTeSe High-Entropy Thermoelectric Alloy: A DFT Approach. Materials. 2023; 16(1):235. https://doi.org/10.3390/ma16010235
Chicago/Turabian StyleXia, Ming, Marie-Christine Record, and Pascal Boulet. 2023. "Investigation of PbSnTeSe High-Entropy Thermoelectric Alloy: A DFT Approach" Materials 16, no. 1: 235. https://doi.org/10.3390/ma16010235
Note that from the first issue of 2016, this journal uses article numbers instead of page numbers. See further details here.