
Measurements of Density of Liquid Oxides with an Aero-Acoustic Levitator
by
 , and
, and
Sergey V. Ushakov
1,* ,
,
Jonas Niessen
2,*, 
Dante G. Quirinale
3,*, 
Robert Prieler
2,
Alexandra Navrotsky
1 and
Rainer Telle
2 1
School of Molecular Sciences and Center for Materials of the Universe, Arizona State University, Tempe, AZ 85287, USA
2
Institut fuer Gesteinshuettenkunde/Mineral Engineering, RWTH Aachen University, 52062 Aachen, Germany
3
Neutron Scattering Division, Oak Ridge National Laboratory, Oak Ridge, TN 37830, USA
*
Authors to whom correspondence should be addressed.
Materials 2021, 14(4), 822; https://doi.org/10.3390/ma14040822
Submission received: 30 December 2020
/
Revised: 25 January 2021
/
Accepted: 27 January 2021
/
Published: 9 February 2021
(This article belongs to the Special Issue Thermal Analysis of Materials)
Abstract
:Densities of liquid oxide melts with melting temperatures above 2000 °C are required to establish mixing models in the liquid state for thermodynamic modeling and advanced additive manufacturing and laser welding of ceramics. Accurate measurements of molten rare earth oxide density were recently reported from experiments with an electrostatic levitator on board the International Space Station. In this work, we present an approach to terrestrial measurements of density and thermal expansion of liquid oxides from high-speed videography using an aero-acoustic levitator with laser heating and machine vision algorithms. The following density values for liquid oxides at melting temperature were obtained: Y2O3 4.6 ± 0.15; Yb2O3 8.4 ± 0.2; Zr0.9Y0.1O1.95 4.7 ± 0.2; Zr0.95Y0.05O1.975 4.9 ± 0.2; HfO2 8.2 ± 0.3 g/cm3. The accuracy of density and thermal expansion measurements can be improved by employing backlight illumination, spectropyrometry and a multi-emitter acoustic levitator.
1. Introduction
Most metal alloys are produced by melt processing, and thermodynamic and thermophysical properties of metallic melts have been systematically investigated for over a century. The developed ab initio and Calphad-based computational tools show spectacular results for the prediction of crystallization pathways and equilibrium phases for metal alloys [1]. Refractory oxide ceramics are usually produced by sintering, and application-driven incentives to study high temperature oxide melts have been largely limited to metallurgical slugs and glasses. The situation has changed with the application of additive manufacturing techniques to ceramic materials [2,3,4,5,6,7]. These techniques often involve laser melting, and their advance is hampered by a lack of data on oxide melts.
A plethora of techniques is available for high temperature study of metal alloys. The “exploding wire” technique [8,9] has been in development for more than 300 years and has also been adapted for electrically conductive carbides and nitrides [10,11,12,13]. In this method, pulse discharge through a metallic wire or conducting ceramic coating provides instantaneous heating and excludes any contamination from the container.
Electromagnetic [14] and electrostatic [15] levitation have been successfully used for contactless high temperature studies on metal alloys for decades [16,17,18,19,20,21,22]. Electromagnetic levitation was also applied to semiconductors after preheating; liquid silicon was studied extensively with this technique [20,23]. Image-based density measurements using levitation have been reported since the 1960s [24], and have been further refined using modern machine vision algorithms and applying Legendre polynomial fitting to the results of edge detection routines for volume calculation [23,25,26,27,28]. Modulated laser calorimetry on electromagnetically levitated melts was developed by Fukuyama et al. in 2007 [29]. Data on excess volume from image processing combined with data on excess heat capacities of mixing [30] provide a thermodynamic foundation for constructing realistic solution models for metallic alloys.
However, many refractory oxides are dielectrics and cannot be studied using exploding wire or electromagnetic levitation. Electrostatic levitation can be applied to dielectric materials, but it relies on surface charges and is challenging in terrestrial conditions. Most of the work on the application of electrostatic levitation to oxides was accomplished by the group at Tsukuba Space Center in Japan [31,32,33,34]. It culminated in the design of an electrostatic levitation furnace (ELF), which is currently in operation at the International Space Station [35]. The first results on the density of liquid Er2O3 and Gd2O3 were published in 2020 [36,37].
Aerodynamic levitation in a conical nozzle (CNL) [38,39,40,41] has been used extensively for oxide melts; however, it has limitations of limited sample visibility and large thermal gradient. The development of an aero-acoustic levitator (AAL) was funded by NSF and NASA and built by Intersonics Inc. in 1990 [42]. In this method, the sample is stabilized above the gas jet by acoustic forces that allow unimpeded access for multi-beam laser heating, pyrometer aiming and video recording.
Only two AAL instruments were commercially produced [43]: the first one with analog controls [44], which was operated in Japan [45,46,47]. The second one, used in this work, was built for RWTH Aachen University [48]. It enabled the first direct observation of liquid immiscibility between zirconia and silica-rich melts in the ZrO2-SiO2 system [49]. To the authors’ knowledge, this is the only instrument of its kind in operation to date. However, it will not be for long. Marzo et al. [50] made openly accessible a new acoustic levitator design using mass-produced acoustic transducers. This drastically reduces the cost of the development of new generation AAL. We anticipate that this innovation will result in a wider application of this technique to study oxide melts. In this work, we present measurements of the density of Y2O3, Yb2O3, YSZ, and HfO2 melts with an aero-acoustic levitator using machine vision algorithms developed for metal alloys.
2. Materials and Methods
2.1. Sample Synthesis
HfO2, Y2O3, and Yb2O3 oxide spheroids 2–3 mm in diameter were prepared by the melting of oxide powders obtained from Alfa Aesar (Ward Hill, MA, USA) with metals purity 99.98% or higher. The powders were sintered at 1500 °C in air for 5 h, then placed into a copper hearth and melted with a 400 W CO2 laser beam into irregularly shaped pieces surrounded by an unmelted powder bed. The resulting solid pieces were remelted in a conical nozzle aerodynamic levitator in Ar flow. Experiments were also performed on laser melted Y0.05Zr0.95O1.975 and Y0.1Zr0.9O1.95 samples prepared and characterized earlier for neutron diffraction experiments [51].
2.2. Measurement Procedure
The design of the aero-acoustic levitator used in this work (Figure 1) was described in detail by Nordine et al. [48]. The sample for levitation was positioned above the alumina tube heated to 550 °C, which serves as a gas jet. The levitation of the sample above the jet is stabilized by six acoustic transducers controlled with levitator software using a positioning system with three low power 808 nm solid state lasers. Experiments with Y2O3 were performed using N2 or Ar gas jets; due to high density of HfO2 and Yb2O3 samples their levitation was only possible using an Ar gas jet.
After levitation was established, the sample was heated to its melting temperature with two antiparallel 240 W CO2 laser beams (Synrad, WA, USA). The video was recorded using a Phantom V9.1 camera from Vision Resarch, Inc. (Wayne, NJ, USA) with an acquisition interval of 0.5–1 ms and exposure time of 20–200 µs. The temperature was recorded with a narrow band 650 nm Exactus pyrometer from BASF Corporation (Florham Park, NJ, USA). The pyrometer was operated with a 1-ms acquisition interval; the measurement spot size was set to 0.8 mm, and emissivity was set to 1. It was possible to record videos and cooling traces for the crystallization of Y2O3, Zr0.95Y0.05O1.975, and Zr0.9Y0.1O1.95 samples. This allowed correlation of the spike in density trace with recalescence peaks on crystallization, obtaining density values at melting temperature, and evaluating volume thermal expansion of the liquids. Levitated HfO2 and Yb2O3 melts became unstable after turning off the lasers and fell out of the field of view before recalescence peaks were captured with a pyrometer. This is attributed to their higher density. Levitation stability in AAL is discussed in detail by Nordine et al. [48].
2.3. Video Processing
Volume was calculated using a modification of the algorithm developed by Bradshaw et al. [25] as implemented by Bendert et al. [52]. As the videos were not filtered, the large temperature range and surface features of the molten samples made shape determination using edge detection routines difficult, so the video contrast was post-processed using open source software [53] to provide better definition. The numerical routines were used to calculate volume assumed symmetry about the vertical axis. This is not necessarily the case with aero-acoustically levitated droplets, which may be slightly asymmetric and experience a slight precession, introducing some additional uncertainty into the measurement. The implementation of multi-emitter acoustic levitator design [50] may reduce this uncertainty.
Camera calibration was performed by imaging commercially obtained machined Al2O3 spheres 3.27 mm in diameter levitated without laser heating. The video was processed using the same procedure as for the laser-heated molten oxides. The variation in calculated volume from the machine vision algorithm did not exceed 1%. The main contribution to calibration uncertainty comes from measurements of diameter and sphericity of the Al2O3 sphere (taken as ±0.025 mm). The total uncertainty in volume from camera calibration was estimated as ±3%, from ±2.3% uncertainty in volume of the calibration standard and ±0.3% variation in volume from video edge detection procedure.
Correlation of the pyrometer trace with the video recording and density curve obtained from video analysis was performed manually. The moment of turning off the lasers is clearly observed from the disappearance of the bright spot on the molten sample. The onset of crystallization was evident from the video from a sudden increase in sample brightness—sample “flash” or recalescence, caused by reheating the sample on crystallization by released heat of fusion.
3. Results and Discussion
In experiments performed on Y2O3, Zr0.95Y0.05O1.975, and Zr0.9Y0.1O1.95, it was possible to record recalescence on cooling traces and videos. This allowed accurate temperature correlation of density values and evaluation of thermal expansion of the liquid. Stable levitation of HfO2 and Yb2O3 through recalescence was challenging, and we did not succeed in recording videos of recalescence. However, considering 3% uncertainty from calibration, we attribute the measured values for HfO2 and Yb2O3 to the melting temperatures. Matched temperature–density profiles are shown in Figure 2 and Figure 3. The obtained density and thermal expansion data are summarized in Table 1, together with relevant reference values.
3.1. Measurements on Y2O3
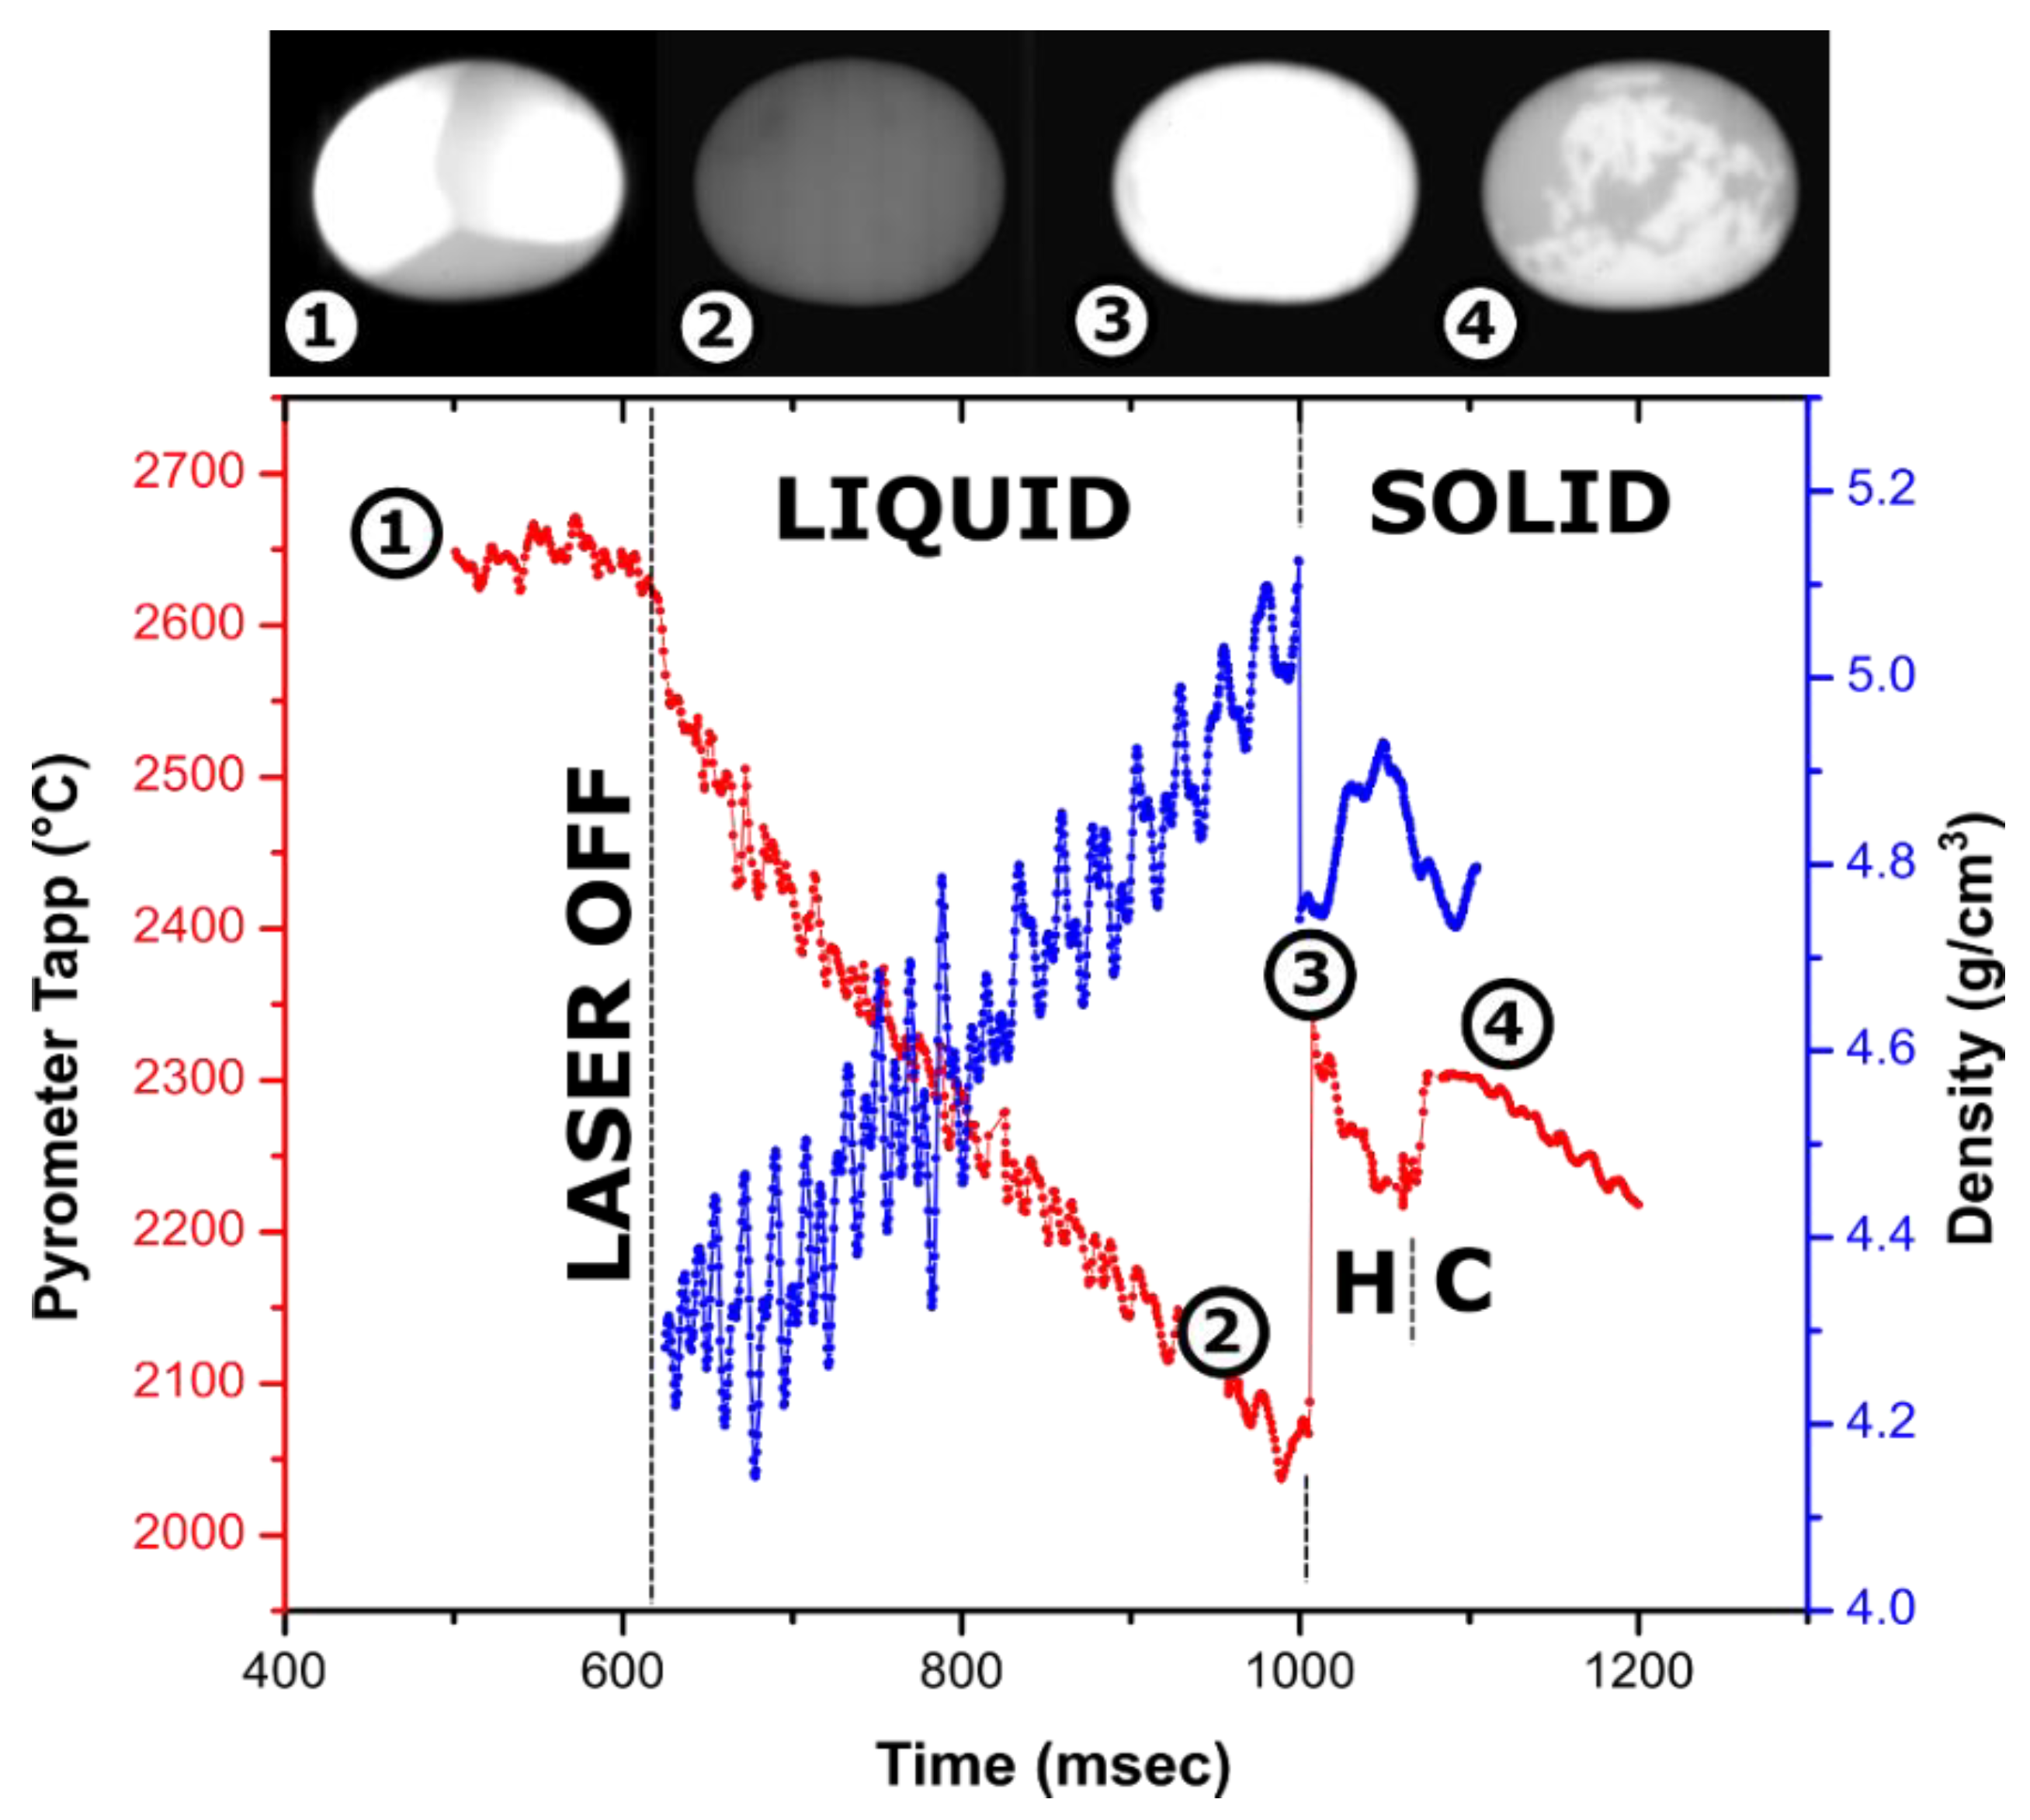
The density profile overlayed with the cooling trace of the Y2O3 droplet is shown in Figure 2. The ~300 °C temperature rise on recalescence gives the magnitude of the observed undercooling of liquid Y2O3. Recalescence can be pinpointed as a flash on the video, and the density profile shows a sharp decrease due to reheating of the sample. After crystallization onset, the density calculations from the bead dimension are not meaningful since the surface of the droplets crystallizes first, and cavities are formed on further crystallization of core parts of the sample.
The first phase to crystallize from Y2O3 melt is known to be a hexagonal phase, common to lanthanide oxides [54,55,56,57]. It is stable in a narrow ~100 °C temperature range and undergoes a transition to cubic bixbyite, which is stable at room temperature. This transition is clearly seen on the cooling trace as a second peak with a smaller ~100 °C rise corresponding to undercooling on hexagonal (H-type) to cubic phase transformation and a plateau at a temperature ~100 °C lower than the recalescence peak. Apart from the “flash” of the bead due to temperature increase, crystallization of the H phase is not clearly distinguished in videos, indicating its emissivity is similar to that of the liquid.
On turning off the laser, the density of liquid Y2O3 increases from 4.3 g/cm3 at 2650 °C to 5.1 g/cm3 at 2100 °C. The density of the liquid at the melting temperature is estimated at 4.6 ± 0.15 g/cm3. For the experiment shown in Figure 2, observed fluctuation in refined density is likely due to the non-symmetrical oscillation of the molten sample in the acoustic field, which ceases after crystallization. In addition to the experiment shown in Figure 2, density was refined from experiments on three more Y2O3 samples, 56–80 mg in weight, using Ar and N2 for levitation. The refined values varied from 4.3 to 4.7 g/cm3. In several experiments, the scatter in volume from video processing was as low as ±0.01 g/cm3. We were not able to correlate other measurements with the temperature trace on cooling; however, the observed variation is consistent with the density value from Figure 2. Volume thermal expansion of liquid Y2O3 at melting temperature was estimated as (3 ± 1) × 10−4 K−1.
3.2. Measurements on Zr0.9Y0.1O1.95 and Zr0.95Y0.05O1.975
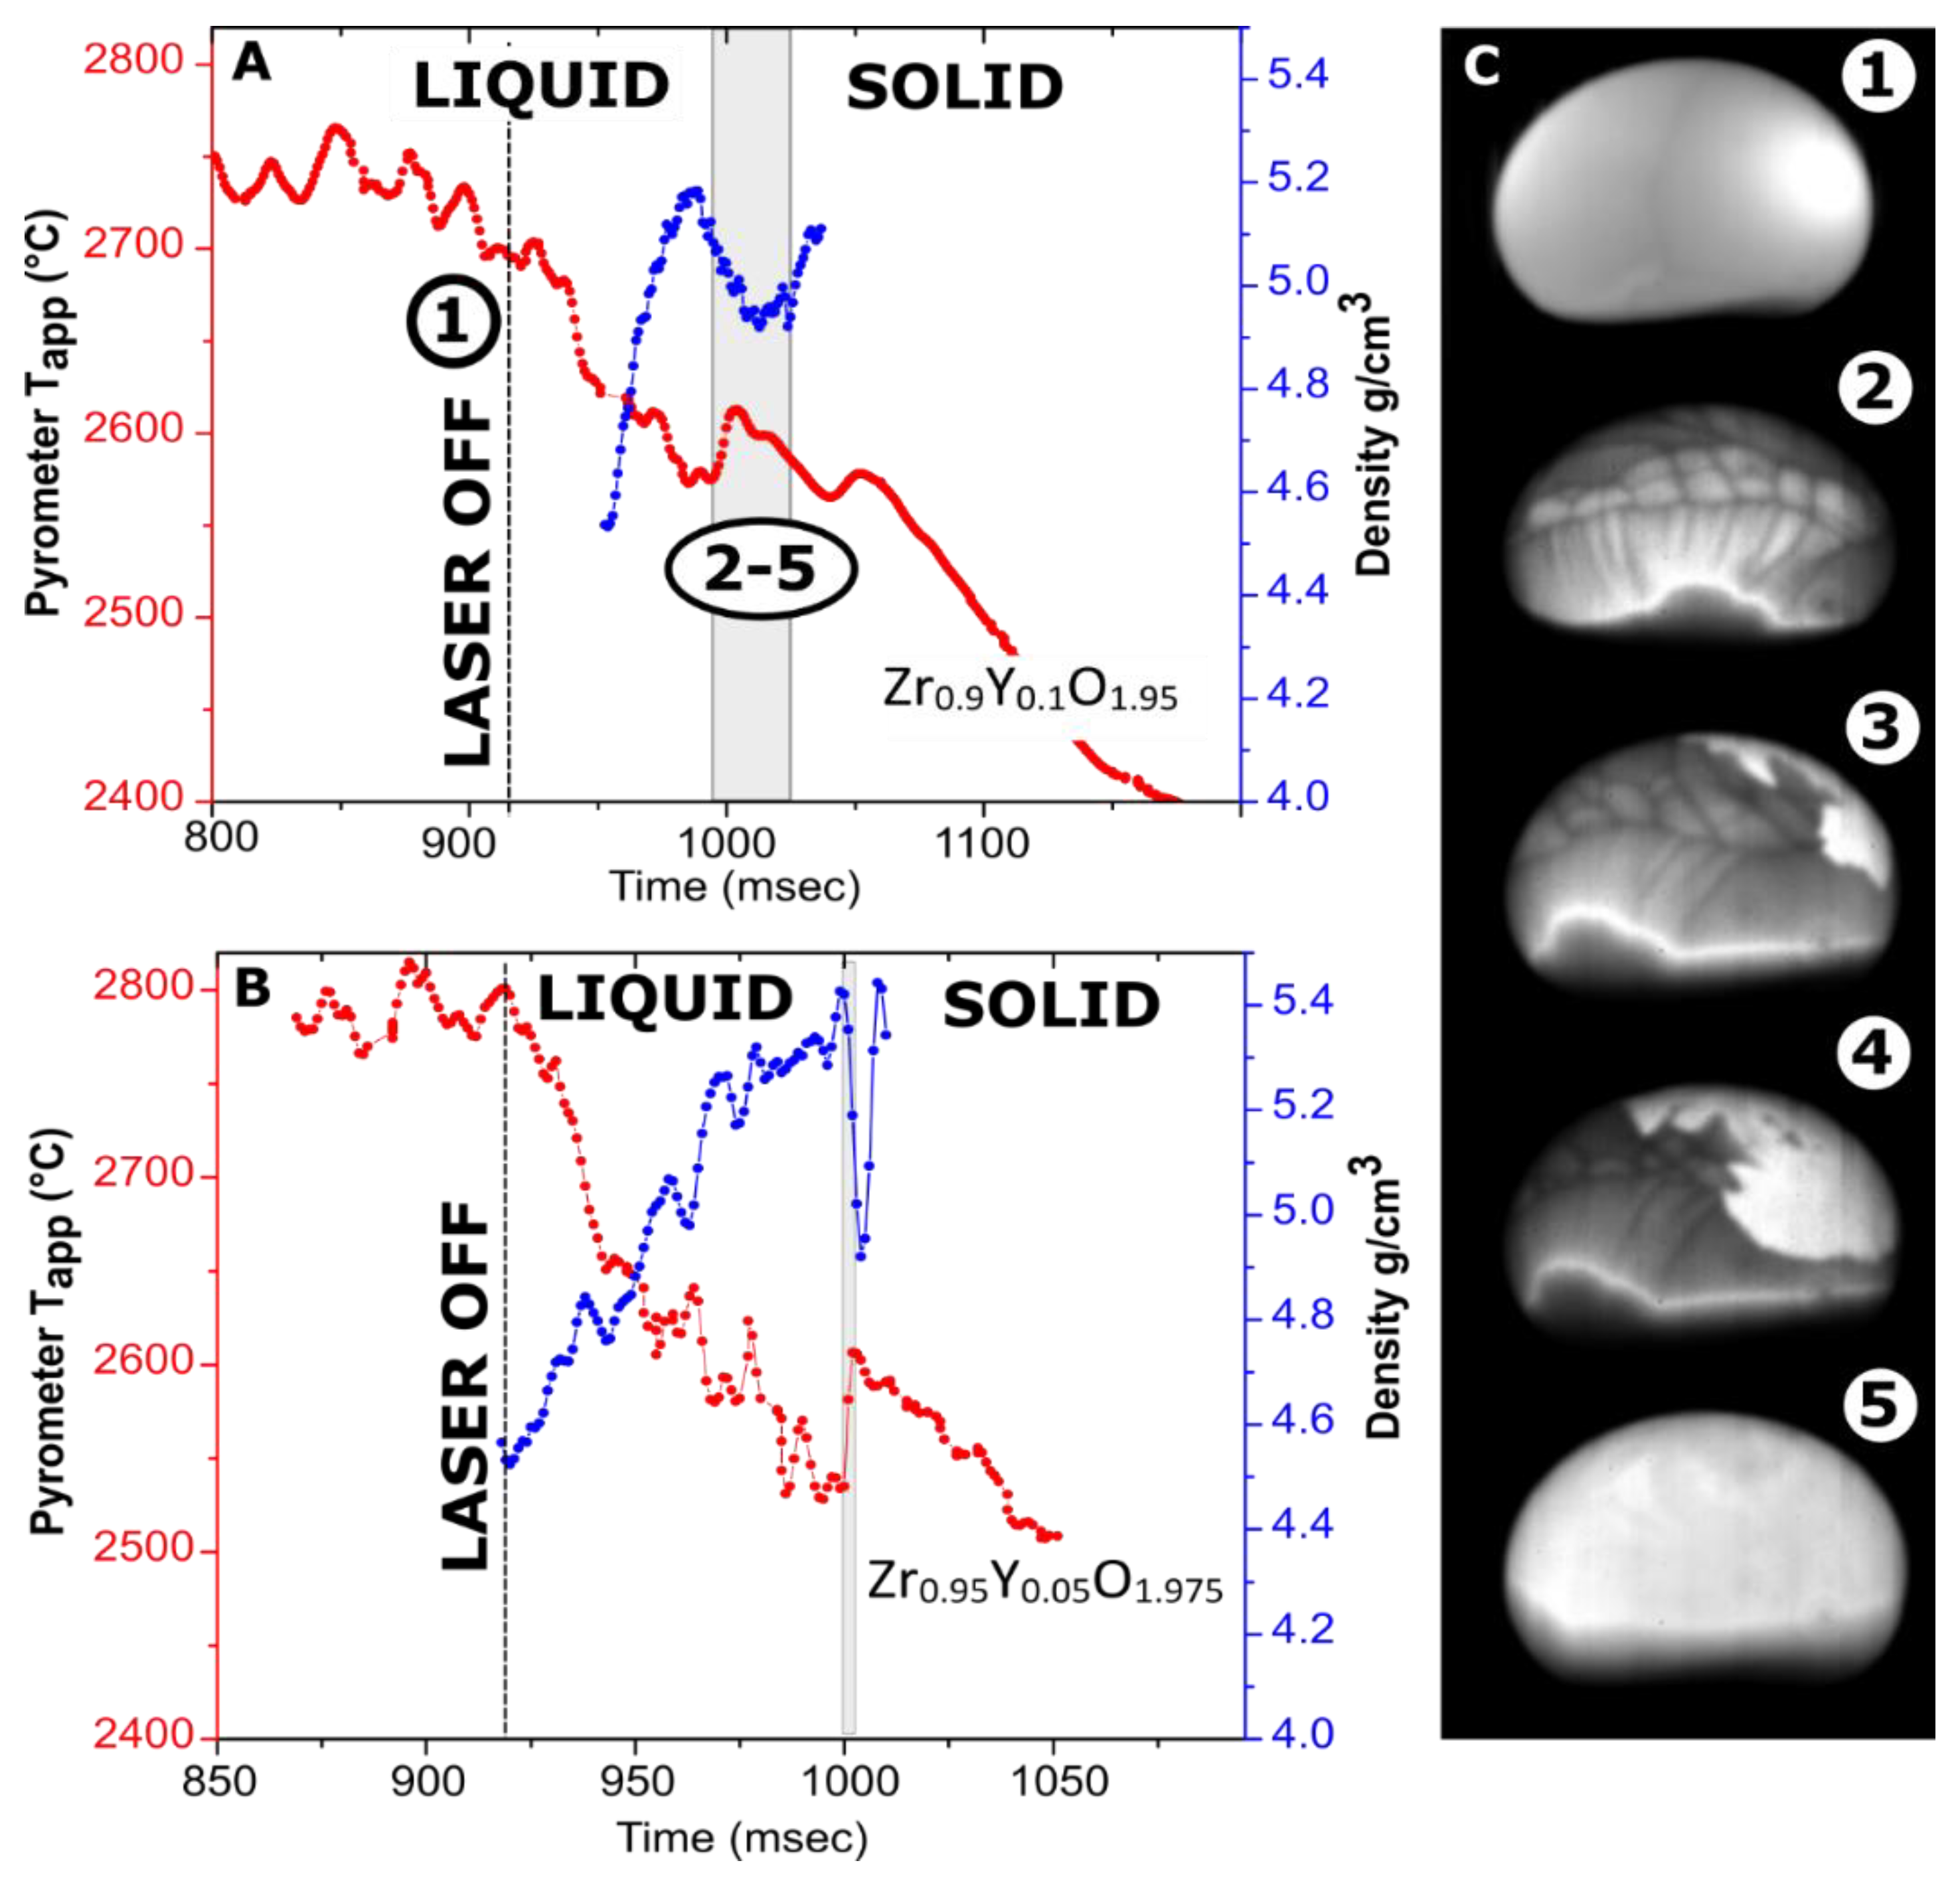
The density profiles overlayed with cooling traces from Y-doped zirconia samples are shown in Figure 3. Undercooling on the crystallization of Zr0.9Y0.1O1.95 and Zr0.95Y0.05O1.975 does not exceed 50 °C and 80 °C, respectively. The recalescence step is much more pronounced for a smaller sample. In previous experiments on these compositions in an aerodynamic levitator, no recalescence peaks were detected [51], likely due to the larger sample gradient.
The video stills from the crystallization of Zr0.9Y0.1O1.95 (Figure 3C) have interesting features. The Marangoni flows on the cooling of Zr0.9Y0.1O1.95 are more pronounced than for Y2O3 but are not observed at the bottom of the sample. The Marangoni flows are caused by temperature or composition-related gradients in surface tension. Calorimetry experiments indicated the possibility of oxygen dissolution in liquid ZrO2 and HfO2 [63]. In our experiments, the melting of Zr0.9Y0.1O1.95 was accomplished in an air–argon mixture, with argon flow provided by an auxiliary gas jet. The lower oxygen fugacity at the bottom of the sample impinged upon by the argon jet could be a plausible reason for this behavior.
In the case of congruent crystallization, one would expect that a solid phase would first appear at the bottom surface of the sample due to additional cooling by the argon jet. This is the case for the C–H transformation in Y2O3 (Figure 2). However, this is not what happens in Zr0.9Y0.1O1.95, in which the bottom of the bead seems to crystallize last. This supports the hypothesis of variable oxygen content in the melt. The densities of Zr0.95Y0.05O1.975 and Zr0.9Y0.1O1.95 at melting temperatures were estimated at 4.9 and 4.7 g/cm3, respectively. The difference between compositions is within the assigned experimental uncertainty of ±0.2 g/cm3.
3.3. Comparison with Previously Reported Density Values
In Table 1 the density and thermal expansion coefficient values for liquid oxides measured in this work are listed together with four types of previously published density data: (i) measurements in aerodynamic levitator by Granier and Heurnault’s [59], Kohara et al. [65], and Kondo et al. [66]; (ii) measurements with the electrostatic levitator on board of International Space Station [36,37]; (iii) refinement from pair distribution function analysis (PDF) of synchrotron X-ray scattering [62]; (iv) ab initio molecular dynamic computations [60,63].
Granier and Heurnault reported the density of liquid alumina, yttria, and several lanthanide sesquioxides [59,69]. They performed the measurements on photographs of laser-heated droplets levitated in a conical nozzle aerodynamic levitator (CNL). Their value for Al2O3 density at melting temperature is about 10% lower than most of the previous measurements [69]. Granier’s values for Y2O3 and for Yb2O3 are 4–5% lower than those measured in this work.
Density measurements for Gd2O3 and Er2O3 were recently performed by a Japanese group with an electrostatic levitator furnace (ELF) at the International Space Station (ISS) [35,36,37]. The electrostatic levitation in microgravity conditions ensures the absence of disturbances by acoustic waves or by gas flow, resulting in a perfectly spherical shape of the levitating droplet. Notably, Granier’s values for Gd2O3 and Er2O3 from CNL are also 4–7% lower than measured in ELF at ISS (Table 1).
There is a simple explanation for this discrepancy if one considers how measurements were performed in Granier’s and Heurnault’s study [59]. In the early version of the aerodynamic levitator they used, the sample was completely surrounded by the nozzle. The photographs were taken from the top, and density values were calculated assuming spherical shape of the sample. However, the shape of the levitated droplet is not an ideal sphere but an oblate spheroid. This can be clearly seen from the lateral view of molten samples in an aero-acoustic levitator (Figure 2). Using top view and assumption of spherical shape would overestimate the volume and underestimate the density. In terrestrial measurements, the degree of oblateness of the spheroid depends on the surface tension of the melt. Melting temperatures of Y2O3, Yb2O3, Gd2O3, and Er2O3 are ~400 °C higher than Al2O3, and they are expected to have higher surface tension. For these oxides, the bead of the same dimension will be closer to spherical shape than in the case of Al2O3. This is consistent with better agreement of measurements for these oxides with Granier’s values.
Kohara et al. [65] also used CNL for measurements of density for liquid ZrO2, however they employed a very shallow nozzle which allowed the side view of the sample. Their value for density and thermal expansion of ZrO2 (5.05 g/cm3 and 1.8 × 10⁻⁴ K−1) is the same within uncertainty as our results for Zr0.95Y0.05O1.975 (4.9 ± 0.2 g/cm3 and (2 ± 1) × 10−4 K−1). The value measured for liquid HfO2 density in this work (8.2 ± 0.3 g/cm3) is in excellent agreement with the density reported by Gallington et al. [62] (8.16 g/cm3) from refinement of total synchrotron X-ray scattering on liquid HfO2.
Liquid ZrO2 density from ab initio molecular dynamic (AI MD) calculations [63] coincides with our value; however, the Y2O3 value from computations is 10% lower than measured, and for HfO2 and Yb2O3, it is 4–6% higher. The comparison of absolute density values from computations with experiment is compromised by uncertainty in absolute temperature in AI MD simulations and underlying assumptions such as choices of exchange-correlation functionals and size of the simulation system.
3.4. Temperature Measurements
In this work, we correlated high-speed video recording with recalescence peak to provide density and thermal expansion values in the proximity of melting temperature. This approach assumes that peak temperature on recalescence is close to the melting point and does not require knowledge of absolute values of the sample temperature. Thus, our measurements did not require knowledge of emissivity, but relied on known melting temperatures of measured oxides. The only assumption made about emissivity is that it does not change substantially for measured liquid oxides around the melting temperature. However, temperature calibration is a paramount issue for measurement of thermal expansion above the melting temperature and for determination of unknown temperatures of melting and phase transformations. Below we discuss methods of estimation of emissivity values and effective emissivities calculated for measured samples.
Temperature measurements with a single-color pyrometer require knowledge of spectral emissivity and its temperature dependence. These data for refractory oxides above 2000 °C are fragmentary [70]. For opaque materials, the sum of emissivity and reflectivity at given wavelength must be equal to one. From careful measurements of reflectivities at 650 nm in a solar furnace, Yamada and Noguchi [71] obtained emissivities for Y2O3 and ZrO2 at melting temperatures as 0.92 ± 0.005, and 0.89 ± 0.005. In an earlier study [72], the same group reported 650 nm emissivity values for HfO2 and Al2O3 at freezing points as 0.91 and 0.96, but without estimation of the uncertainties.
Nordine et al. [48] suggested that reflectivity of opaque melts can be estimated from the refraction index of the solid and emissivity can be calculated using the following relationship:
where r is the reflectivity and n is the refractive index at the given wavelength This approach neglects temperature dependence of emissivity and changes in emissivities between solid and liquid phases. However, in the case of Al2O3 for which high temperature data are available [73] these changes are small.
The videos indicate that the melt is opaque at visible wavelengths, and therefore the transmittance can be neglected. Emissivity for different materials is calculated in Table 2 based on Equation (1). The differences from the available values reported by Noguchi [71] from direct measurements for liquid oxides do not exceed 3%. Thus, this approach can be used for future measurements.
When the melting temperatures are known or independently measured, the common approach is to estimate effective emissivity ελ at melting temperature using Wien’s approximation:
where T is the melting temperature, TA is the apparent melting temperature (measured by pyrometer), and C2 is Planck’s second radiation constant. The temperature dependence of emissivity is usually neglected, and the obtained value for effective emissivity can be used to correct the apparent temperature of the melt in the range of the measurements.
In dynamic measurements of phase transformations, metastability is common on cooling but not on heating. Thermal arrests on melting cannot be unambiguously distinguished on heating with a continuous wave (CW) laser. On cooling of oxide melts, crystallization onset is usually below equilibrium melting temperature. This undercooling is more pronounced in levitated samples in the absence of any solid–liquid interfaces. The crystallization of undercooled melt results in a peak in temperature-recalescence which can be visually observed as a “flash”. If on recalescence the sample is reheated to the equilibrium melting temperature, the true thermal arrest can be observed. Ideally, its temperature should be used for emissivity calculation at the melting point.
In our experiments, we do not observe thermal arrest on recalescence. It is not surprising for 2–3 mm beads with melting temperatures above 2400 °C. Due to the relatively large surface to volume ratio and high temperatures, heat transfer by radiation does not allow sample reheating to melting temperature by released heat of fusion.
Table 3 lists emissivity values calculated from Equation (2), taking the maximum temperature of recalescence peak as the apparent melting temperature. The values calculated based on this method will always underestimate emissivity when the melting point is not reached; therefore, they should be seen as a lower boundary. Measurements on a curved surface will also underestimate emissivity; thus, these differences are expected. While single-color pyrometry remains the fastest and most sensitive technique, it must be noted that approaches which do not require knowledge of emissivity for temperature measurements are well established, such as direct measurements of reflectivity [78] and spectropyrometry [79,80,81].
4. Conclusions and Future Directions
This work demonstrates that reasonable values for density of liquid oxides can be obtained from high-speed videography measurements with an aero-acoustic levitator. Volume change on melting cannot be directly obtained from these experiments. While videography can be used on solids, samples in this work were prepared by laser melting and contained cavities formed on solidification. However, volume change on melting can be derived by combining density data for liquids with thermal expansion data on solids from X-ray diffraction [51,57,82].
The accuracy of the measurements can be significantly improved by back illumination of the levitated samples, combined with appropriate filters on the camera [27,34], which is known to aid edge detection in image processing. The multi-emitter single-axis acoustic levitator introduced by Marzo et al. [50] allows levitation of non-spherical samples with density up to 6.5 g/cm3. The adaptation of a new multi-emitter design for laser heating and density measurements can simplify levitation, decrease the deformation of the liquid sample by acoustic waves, and eliminate or drastically reduce the need for auxiliary aerodynamic support of the sample.
The measurements of change in density with melt composition can be used to obtain the excess volume of mixing in the liquid state for multicomponent systems and derive realistic thermodynamic mixing models, as demonstrated by Fukuyama et al. [30] for metal alloy systems. Such measurements for key refractory oxide systems will be the subject of future studies.
Supplementary Materials
The following are available online at https://www.mdpi.com/1996-1944/14/4/822/s1, Video S1: Crystallization of 58.79 mg Y2O3 sample (500 µs acquisition interval, 200 µs exposure, exported to AVI format at 50 frames per second), Video S2: Crystallization of 119.50 mg Y2O3 sample (1000 µs acquisition interval, 40 µs exposure, exported to AVI at 50 frames per second)
Author Contributions
Conceptualization, S.V.U., A.N. and R.T.; experiments, J.N., R.P., S.V.U., R.T.; video processing, D.G.Q.; emissivity analysis, J.N.; writing—original draft preparation, S.V.U., D.G.Q. and J.N.; writing—review and editing, A.N., R.P. and R.T. All authors have read and agreed to the published version of the manuscript.
Funding
This research was funded by the U.S. National Science Foundation under the award NSF-DMR 1835848 (changed to NSF-DMR 2015852 on funding moved from UC Davis to ASU). Operation of aero-acoustic levitator at RWTH Aachen is funded by German Research Foundation Grants No Te146/37-2 and No GZ/Inst 222/779-1 FUGG AOBJ:544260.
Institutional Review Board Statement
Not applicable.
Informed Consent Statement
Not applicable.
Data Availability Statement
The data presented in this study are available on request from the corresponding authors.
Acknowledgments
The authors gratefully acknowledge Robert W. Hyers for discussion of experiments and initial evaluation of video data quality, Paul C. Nordine and Richard J. K. Weber for discussion of aero-acoustic levitator operation. Part of this work was presented by S.V.U at the 12th International Workshop on Subsecond Thermophysics (IWSSTP 2019), at DLR Cologne, Germany.
Conflicts of Interest
The authors declare no conflict of interest.
References
- Luo, A.A. Material design and development: From classical thermodynamics to CALPHAD and ICME approaches. Calphad 2015, 50, 6–22. [Google Scholar] [CrossRef] [Green Version]
- Penilla, E.H.; Devia-Cruz, L.F.; Wieg, A.T.; Martinez-Torres, P.; Cuando-Espitia, N.; Sellappan, P.; Kodera, Y.; Aguilar, G.; Garay, J.E. Ultrafast laser welding of ceramics. Science 2019, 365, 803–808. [Google Scholar] [CrossRef]
- Chen, Z.; Li, Z.; Li, J.; Liu, C.; Lao, C.; Fu, Y.; Liu, C.; Li, Y.; Wang, P.; He, Y. 3D printing of ceramics: A review. J. Eur. Ceram. Soc. 2019, 39, 661–687. [Google Scholar] [CrossRef]
- Simpson, T.W.; Williams, C.B.; Hripko, M. Preparing industry for additive manufacturing and its applications: Summary & recommendations from a National Science Foundation workshop. Addit. Manuf. 2017, 13, 166–178. [Google Scholar]
- Ferrage, L.; Bertrand, G.; Lenormand, P.; Grossin, D.; Ben-Nissan, B. A review of the additive manufacturing (3DP) of bioceramics: Alumina, zirconia (PSZ) and hydroxyapatite. J. Aust. Ceram. Soc. 2017, 53, 11–20. [Google Scholar] [CrossRef] [Green Version]
- Council, N.R. 3D Printing in Space; The National Academies Press: Washington, DC, USA, 2014; p. 106. [Google Scholar]
- Ferrage, L.; Bertrand, G.; Lenormand, P. Dense yttria-stabilized zirconia obtained by direct selective laser sintering. Addit. Manuf. 2018, 21, 472–478. [Google Scholar] [CrossRef] [Green Version]
- McGrath, J.R. Exploding Wire Research 1774–1963; NRL Memorandum Report 1698; U.S. Naval Research Laboratory: Washington, DC, USA, 1966. [Google Scholar]
- Gallob, R.; Jaeger, H.; Pottlacher, G. A submicrosecond pulse heating system for the investigation of thermophysical properties of metals at high temperatures. Int. J. Thermophys. 1986, 7, 139–147. [Google Scholar] [CrossRef]
- Savvatimskiy, A.I.; Onufriev, S.V.; Valyano, G.E.; Muboyadzhyan, S.A. Thermophysical properties for hafnium carbide (HfC) versus temperature from 2000 to 5000 K (experiment). J. Mater. Sci. 2020, 55, 13559–13568. [Google Scholar] [CrossRef]
- Savvatimskiy, A.I.; Onufriev, S.V.; Muboyajan, S.A.; Tsygankov, P.A. Pulsed Heating of Carbides. Bull. Russ. Acad. Sci. Phys. 2018, 82, 363–368. [Google Scholar] [CrossRef]
- Savvatimskiy, A.I.; Onufriev, S.V.; Muboyadzhyan, S.A. Measurement of ZrC properties up to 5000 K by fast electrical pulse heating method. J. Mater. Res. 2017, 32, 1287–1294. [Google Scholar] [CrossRef]
- Knyazkov, A.M.; Kurbakov, S.D.; Savvatimskiy, A.I.; Sheindlin, M.A.; Yanchuk, V.I. Melting of carbides by electrical pulse heating. High Temp. High Press. 2011, 40, 349–358. [Google Scholar]
- Wroughton, D.M.; Okress, C.E. Magnetic Levitation and Heating of Conductive Materials. U.S. Patent 2,686,864, 17 August 1954. [Google Scholar]
- Rhim, W.K.; Chung, S.K.; Barber, D.; Man, K.F.; Gutt, G.; Rulison, A.; Spjut, R.E. An Electrostatic Levitator for High-Temperature Containerless Materials Processing in 1-G. Rev. Sci. Instrum. 1993, 64, 2961–2970. [Google Scholar] [CrossRef] [Green Version]
- Szekely, J.; Schwartz, E.; Hyers, R. Electromagnetic levitation-A useful tool in microgravity research. JOM 1995, 47, 50–53. [Google Scholar] [CrossRef] [Green Version]
- Matson, D.M.; Fair, D.J.; Hyers, R.W.; Rogers, J.R. Contrasting Electrostatic and Electromagnetic Levitation Experimental Results for Transformation Kinetics of Steel Alloys. Ann. N. Y. Acad. Sci. 2004, 1027, 435–446. [Google Scholar] [CrossRef] [PubMed]
- Hyers Robert, W.; Rogers Jan, R. A Review of Electrostatic Levitation for Materials Research. High Temp. Mater. Process. 2008, 27, 461. [Google Scholar]
- Assael, M.J.; Armyra, I.J.; Brillo, J.; Stankus, S.V.; Wu, J.T.; Wakeham, W.A. Reference Data for the Density and Viscosity of Liquid Cadmium, Cobalt, Gallium, Indium, Mercury, Silicon, Thallium, and Zinc. J. Phys. Chem. Ref. Data 2012, 41, 285. [Google Scholar] [CrossRef] [Green Version]
- Kuribayashi, K. Containerless Crystallization of Semiconductors. In Solidification of Containerless Undercooled Melts; Herlach, D.M., Matson, D.M., Eds.; Wiley: Weinheim, Germany, 2012. [Google Scholar]
- Brillo, J.; Lohoefer, G.; Schmidt-Hohagen, F.; Schneider, S.; Egry, I. Thermophysical property measurements of liquid metals by electromagnetic levitation. Int. J. Mater. Prod. Technol. 2006, 26, 247–273. [Google Scholar] [CrossRef]
- Brillo, J. Thermophysical Properties of Multicomponent Liquid Alloys; De Gruyter: Berlin, Germany, 2016. [Google Scholar]
- Higuchi, K.; Kimura, K.; Mizuno, A.; Watanabe, M.; Katayama, Y.; Kuribayashi, K. Precise measurement of density and structure of undercooled molten silicon by using synchrotron radiation combined with electromagnetic levitation technique. Meas. Sci. Technol. 2005, 16, 381–385. [Google Scholar] [CrossRef]
- Shiraishi, S.Y.; Ward, R.G. The density of nickel in the superheated and supercooled liquid states. Can. Metall. Q. 1964, 3, 117–122. [Google Scholar] [CrossRef]
- Bradshaw, R.C.; Schmidt, D.P.; Rogers, J.R.; Kelton, K.F.; Hyers, R.W. Machine vision for high-precision volume measurement applied to levitated containerless material processing. Rev. Sci. Instrum. 2005, 76, 125108. [Google Scholar] [CrossRef]
- Adachi, M.; Aoyagi, T.; Mizuno, A.; Watanabe, M.; Kobatake, H.; Fukuyama, H. Precise Density Measurements for Electromagnetically Levitated Liquid Combined with Surface Oscillation Analysis. Int. J. Thermophys. 2008, 29, 2006–2014. [Google Scholar] [CrossRef]
- Watanabe, M.; Adachi, M.; Fukuyama, H. Densities of Fe-Ni melts and thermodynamic correlations. J. Mater. Sci. 2016, 51, 3303–3310. [Google Scholar] [CrossRef]
- Egry, I.; Langen, M.; Lohofer, G.; Earnshaw, J.C. Measurements of thermophysical properties of liquid metals relevant to Marangoni effects. Philos. Trans. R. Soc. Lond. Ser. A 1998, 356, 845–856. [Google Scholar] [CrossRef]
- Fukuyama, H.; Kobatake, H.; Takahashi, K.; Minato, I.; Tsukada, T.; Awaji, S. Development of modulated laser calorimetry using a solid platinum sphere as a reference. Meas. Sci. Technol. 2007, 18, 2059–2066. [Google Scholar] [CrossRef]
- Fukuyama, H.; Watanabe, M.; Adachi, M. Recent studies on thermophysical properties of metallic alloys with PROSPECT: Excess properties to construct a solution model. High Temp. High Press. 2020, 49, 851. [Google Scholar] [CrossRef]
- Ishikawa, T.; Paradis, P.F.; Yoda, S. New sample levitation initiation and imaging techniques for the processing of refractory metals with an electrostatic levitator furnace. Rev. Sci. Instrum. 2001, 72, 2490–2495. [Google Scholar] [CrossRef]
- Paradis, P.F.; Ishikawa, T.; Yu, J.; Yoda, S. Hybrid electrostatic-aerodynamic levitation furnace for the high-temperature processing of oxide materials on the ground. Rev. Sci. Instrum. 2001, 72, 2811–2815. [Google Scholar] [CrossRef]
- Paradis, P.F.; Yu, J.; Ishikawa, T.; Aoyama, T.; Yoda, S.; Weber, J.K.R. Contactless density measurement of superheated and undercooled liquid Y3Al5O12. J. Cryst. Growth 2003, 249, 523–530. [Google Scholar] [CrossRef]
- Paradis, P.-F.; Yu, J.; Ishikawa, T.; Yoda, S. Contactless Density Measurement of Liquid Nd-Doped 50%CaO–50%Al2O3. J. Am. Ceram. Soc. 2003, 86, 2234–2236. [Google Scholar] [CrossRef]
- Tamaru, H.; Koyama, C.; Saruwatari, H.; Nakamura, Y.; Ishikawa, T.; Takada, T. Status of the Electrostatic Levitation Furnace (ELF) in the ISS-KIBO. Microgravity Sci. Technol. 2018, 30, 643–651. [Google Scholar] [CrossRef]
- Ishikawa, T.; Koyama, C.; Saruwatari, H.; Tamaru, H.; Oda, H.; Ohshio, M.; Nakamura, Y.; Watanabe, Y.; Nakata, Y. Density of molten gadolinium oxide measured with the electrostatic levitation furnace in the International Space Station. High Temp. High Press. 2020, 49, 5–15. [Google Scholar] [CrossRef]
- Koyama, C.; Tahara, S.; Kohara, S.; Onodera, Y.; Småbråten, D.R.; Selbach, S.M.; Akola, J.; Ishikawa, T.; Masuno, A.; Mizuno, A.; et al. Very sharp diffraction peak in nonglass-forming liquid with the formation of distorted tetraclusters. NPG Asia Mater. 2020, 12, 43. [Google Scholar] [CrossRef]
- Winborne, D.A.; Nordine, P.C.; Rosner, D.E.; Marley, N.F. Aerodynamic Levitation Technique for Containerless High Temperature Studies on Liquid and Solid Samples. Metall. Mater. Trans. B 1976, 7, 711–713. [Google Scholar] [CrossRef]
- Nordine, P.C.; Atkins, R.M. Aerodynamic levitation of laser-heated solids in gas jets. Rev. Sci. Instrum. 1982, 53, 1456–1464. [Google Scholar] [CrossRef]
- Nordine, P.C.; Weber, J.K.R.; Abadie, J.G. Properties of high-temperature melts using levitation. Pure Appl. Chem. 2000, 72, 2127–2136. [Google Scholar] [CrossRef] [Green Version]
- Benmore, C.J.; Weber, J.K.R. Aerodynamic levitation, supercooled liquids and glass formation. Adv. Phys. X 2017, 2, 717–736. [Google Scholar] [CrossRef]
- Rey, C.A.; Merkley, D. Aero-Acoustic Levitation Device and Method. U.S. Patent 5,096,017, 17 March 1992. [Google Scholar]
- Nordine, P.C. Personal communication, 2020.
- Weber, R.J.K.; Hampton, S.; Merkley, D.S.; Rey, C.A.; Zatarski, M.M.; Nordine, P.C. Aero-acoustic levitation: A method for containerless liquid-phase processing at high temperatures. Rev. Sci. Instrum. 1994, 65, 456–465. [Google Scholar] [CrossRef]
- Sato, H.; Tsukamoto, K.; Kuribayashi, K. Growth of Olivine by Aero-Acoustic Levitation: Reproduction of Meteorite Texture. J. Jap. Assoc. Cryst. Growth 1998, 25, A155. [Google Scholar]
- Nagashio, K.; Hofmeister, W.H.; Gustafson, D.E.; Altgilbers, A.; Bayuzick, R.J.; Kuribayashi, K. Formation of NdBa2Cu3O7-δ amorphous phase by combining aero-acoustic levitation and splat quenching. J. Mater. Res. 2001, 16, 138–145. [Google Scholar] [CrossRef]
- Nagashio, K.; Takamura, Y.; Kuribayashi, K.; Shiohara, Y. Microstructural control of NdBa2Cu3O7-δ superconducting oxide from highly undercooled melt by containerless processing. J. Cryst. Growth 1999, 200, 118–125. [Google Scholar] [CrossRef]
- Nordine, P.C.; Merkley, D.; Sickel, J.; Finkelman, S.; Telle, R.; Kaiser, A.; Prieler, R. A levitation instrument for containerless study of molten materials. Rev. Sci. Instrum. 2012, 83, 125107/1–125107/14. [Google Scholar] [CrossRef] [Green Version]
- Telle, R.; Greffrath, F.; Prieler, R. Direct observation of the liquid miscibility gap in the zirconia-silica system. J. Eur. Ceram. Soc. 2015, 35, 3995–4004. [Google Scholar] [CrossRef]
- Marzo, A.; Barnes, A.; Drinkwater, B. TinyLev: A multi-emitter single-axis acoustic levitator. Rev. Sci. Instrum. 2017, 88, 085105. [Google Scholar] [CrossRef]
- Ushakov, S.V.; Navrotsky, A.; Weber, R.J.K.; Neuefeind, J.C. Structure and Thermal Expansion of YSZ and La2Zr2O7 Above 1500 °C from Neutron Diffraction on Levitated Samples. J. Am. Ceram. Soc. 2015, 98, 3381–3388. [Google Scholar] [CrossRef]
- Bendert, J.C.; Gangopadhyay, A.K.; Mauro, N.A.; Kelton, K.F. Volume Expansion Measurements in Metallic Liquids and Their Relation to Fragility and Glass Forming Ability: An Energy Landscape Interpretation. Phys. Rev. Lett. 2012, 109, 185901. [Google Scholar] [CrossRef] [Green Version]
- Community, B.O. Blender-a 3D Modelling and Rendering Package. Available online: http://www.blender.org (accessed on 30 December 2020).
- Foex, M.; Traverse, P.J. Polymorphism of rare earth sesquioxides at high temperatures. Bull. Soc. Fr. Mineral. Cristallogr. 1966, 89, 184–205. [Google Scholar]
- Foex, M.; Traverse, J.P. Investigations about crystalline transformation in rare earths sesquioxides at high temperatures. Rev. Int. Hautes Temp. Refract. 1966, 3, 429–453. [Google Scholar]
- Zinkevich, M. Thermodynamics of rare earth sesquioxides. Prog. Mater. Sci. 2007, 52, 597–647. [Google Scholar] [CrossRef]
- Ushakov, S.V.; Navrotsky, A. Experimental approaches to the thermodynamics of ceramics above 1500 °C. J. Am. Ceram. Soc. 2012, 95, 1463–1482. [Google Scholar] [CrossRef]
- Cabannes, F.; Vu, T.L.; Coutures, J.P.; Foex, M. Melting point of yttria as a secondary temperature standard. High Temp. High Press. 1976, 8, 391–396. [Google Scholar]
- Granier, B.; Heurtault, S. Density of liquid rare earth sesquioxides. J. Am. Ceram. Soc. 1988, 71, C466–C468. [Google Scholar] [CrossRef]
- Kapush, D.; Ushakov, S.; Navrotsky, A.; Hong, Q.-J.; Liu, H.; van de Walle, A. A combined experimental and theoretical study of enthalpy of phase transition and fusion of yttria above 2000 °C using “drop-n-catch” calorimetry and first-principles calculation. Acta Mater. 2017, 124, 204–209. [Google Scholar] [CrossRef] [Green Version]
- Wang, C.; Zinkevich, M.; Aldinger, F. The zirconia-hafnia system: DTA measurements and thermodynamic calculations. J. Am. Ceram. Soc. 2006, 89, 3751–3758. [Google Scholar] [CrossRef]
- Gallington, L.; Ghadar, Y.; Skinner, L.; Weber, J.; Ushakov, S.; Navrotsky, A.; Vazquez-Mayagoitia, A.; Neuefeind, J.; Stan, M.; Low, J.; et al. The Structure of Liquid and Amorphous Hafnia. Materials 2017, 10, 1290. [Google Scholar] [CrossRef] [PubMed] [Green Version]
- Hong, Q.-J.; Ushakov, S.V.; Kapush, D.; Benmore, C.J.; Weber, R.J.K.; van de Walle, A.; Navrotsky, A. Combined computational and experimental investigation of high temperature thermodynamics and structure of cubic ZrO2 and HfO2. Sci. Rep. 2018, 8, 14962. [Google Scholar] [CrossRef] [PubMed] [Green Version]
- Sibieude, F.; Rouanet, A. Effect of cationic substitutions of the type A4+-Ln3+ on the polymorphism of lanthanide sesquioxides. Application to the interpretation of the equilibrium diagrams of the zirconium dioxide-lanthanide sesquioxide and thorium dioxide-lanthanide sesquioxide systems. Colloq. Int. Cent. Nat. Rech. Sci. 1972, 205, 459–468. [Google Scholar]
- Kohara, S.; Akola, J.; Patrikeev, L.; Ropo, M.; Ohara, K.; Itou, M.; Fujiwara, A.; Yahiro, J.; Okada, J.T.; Ishikawa, T.; et al. Atomic and electronic structures of an extremely fragile liquid. Nat. Commun. 2014, 5, 5892. [Google Scholar] [CrossRef] [PubMed] [Green Version]
- Kondo, T.; Muta, H.; Kurosaki, K.; Kargl, F.; Yamaji, A.; Furuya, M.; Ohishi, Y. Density and viscosity of liquid ZrO2 measured by aerodynamic levitation technique. Heliyon 2019, 5, e02049. [Google Scholar] [CrossRef] [Green Version]
- Konings, R.J.M.; Beneš, O.; Kovács, A.; Manara, D.; Sedmidubský, D.; Gorokhov, L.; Iorish, V.S.; Yungman, V.; Shenyavskaya, E.; Osina, E. The Thermodynamic Properties of the f-Elements and their Compounds. Part 2. The Lanthanide and Actinide Oxides. J. Phys. Chem. Ref. Data 2014, 43, 013101. [Google Scholar] [CrossRef] [Green Version]
- Fyhrie, M.; Hong, Q.-J.; Kapush, D.; Ushakov, S.V.; Liu, H.; van de Walle, A.; Navrotsky, A. Energetics of melting of Yb2O3 and Lu2O3 from drop and catch calorimetry and first principles computations. J. Chem. Thermodyn. 2019, 132, 405–410. [Google Scholar] [CrossRef]
- Granier, B.; Heurtault, S. Method for measurement of the density of liquid refractories. Application to alumina and yttrium oxide. Rev. Int. Hautes Temp. Refract. 1983, 20, 61–67. [Google Scholar]
- Watanabe, H.; Ishii, J.; Wakabayashi, H.; Kumano, T.; Hanssen, L. Spectral Emissivity Measurements. In Experimental Methods in the Physical Sciences; Germer, T.A., Zwinkels, J.C., Tsai, B.K., Eds.; Academic Press: Cambridge, MA, USA, 2014; Volume 46, pp. 333–366. [Google Scholar]
- Yamada, T.; Noguchi, T. Digital pyrometry in a solar furnace. Sol. Energy 1976, 18, 533–539. [Google Scholar] [CrossRef]
- Noguchi, T.; Kozuka, T. Temperature and emissivity measurement at 0.65 μ with a solar furnace. Sol. Energy 1966, 10, 125–131. [Google Scholar] [CrossRef]
- Krishnan, S.; Weber, J.K.R.; Schiffman, R.A.; Nordine, P.C.; Reed, R.A. Refractive index of liquid aluminum oxide at 0.6328 μm. J. Am. Ceram. Soc. 1991, 74, 881–883. [Google Scholar] [CrossRef]
- Nigara, Y. Measurement of the Optical Constants of Yttrium Oxide. Jpn. J. Appl. Phys. 1968, 7, 404–408. [Google Scholar] [CrossRef]
- Hu, H.; Zhu, C.; Lu, Y.F.; Wu, Y.H.; Liew, T.; Li, M.F.; Cho, B.J.; Choi, W.K.; Yakovlev, N. Physical and electrical characterization of HfO2 metal-insulator-metal capacitors for Si analog circuit applications. J. Appl. Phys. 2003, 94, 551–557. [Google Scholar] [CrossRef]
- Medenbach, O.; Dettmar, D.; Shannon, R.D.; Fischer, R.X.; Yen, W.M. Refractive index and optical dispersion of rare earth oxides using a small-prism technique. J. Opt. A Pure Appl. Opt. 2001, 3, 174–177. [Google Scholar] [CrossRef]
- Wood, D.L.; Nassau, K. Refractive index of cubic zirconia stabilized with yttria. Appl. Opt. 1982, 21, 2978–2981. [Google Scholar] [CrossRef]
- Stein, A.; Rabinowitz, P.; Kaldor, A. Laser Radiometer. U.S. Patent 4,417,822, 29 January 1983. [Google Scholar]
- Felice, R.A. Temperature Determining Device and Process. U.S. Patent 5,772,323, 30 June 2002. [Google Scholar]
- Felice, R.A. The spectropyrometer—a practical multi-wavelength pyrometer. AIP Conf. Proc. 2003, 684, 711–716. [Google Scholar]
- Earl, D.D.; Kisner, R.A. Emissivity Independent Optical Pyrometer. U.S. Patent 2,015,124,244, 15 March 2017. [Google Scholar]
- Pavlik, A.; Ushakov, S.V.; Navrotsky, A.; Benmore, C.J.; Weber, R.J.K. Structure and thermal expansion of Lu2O3 and Yb2O3 up to the melting points. J. Nucl. Mater. 2017, 495, 385–391. [Google Scholar] [CrossRef]
Figure 1.
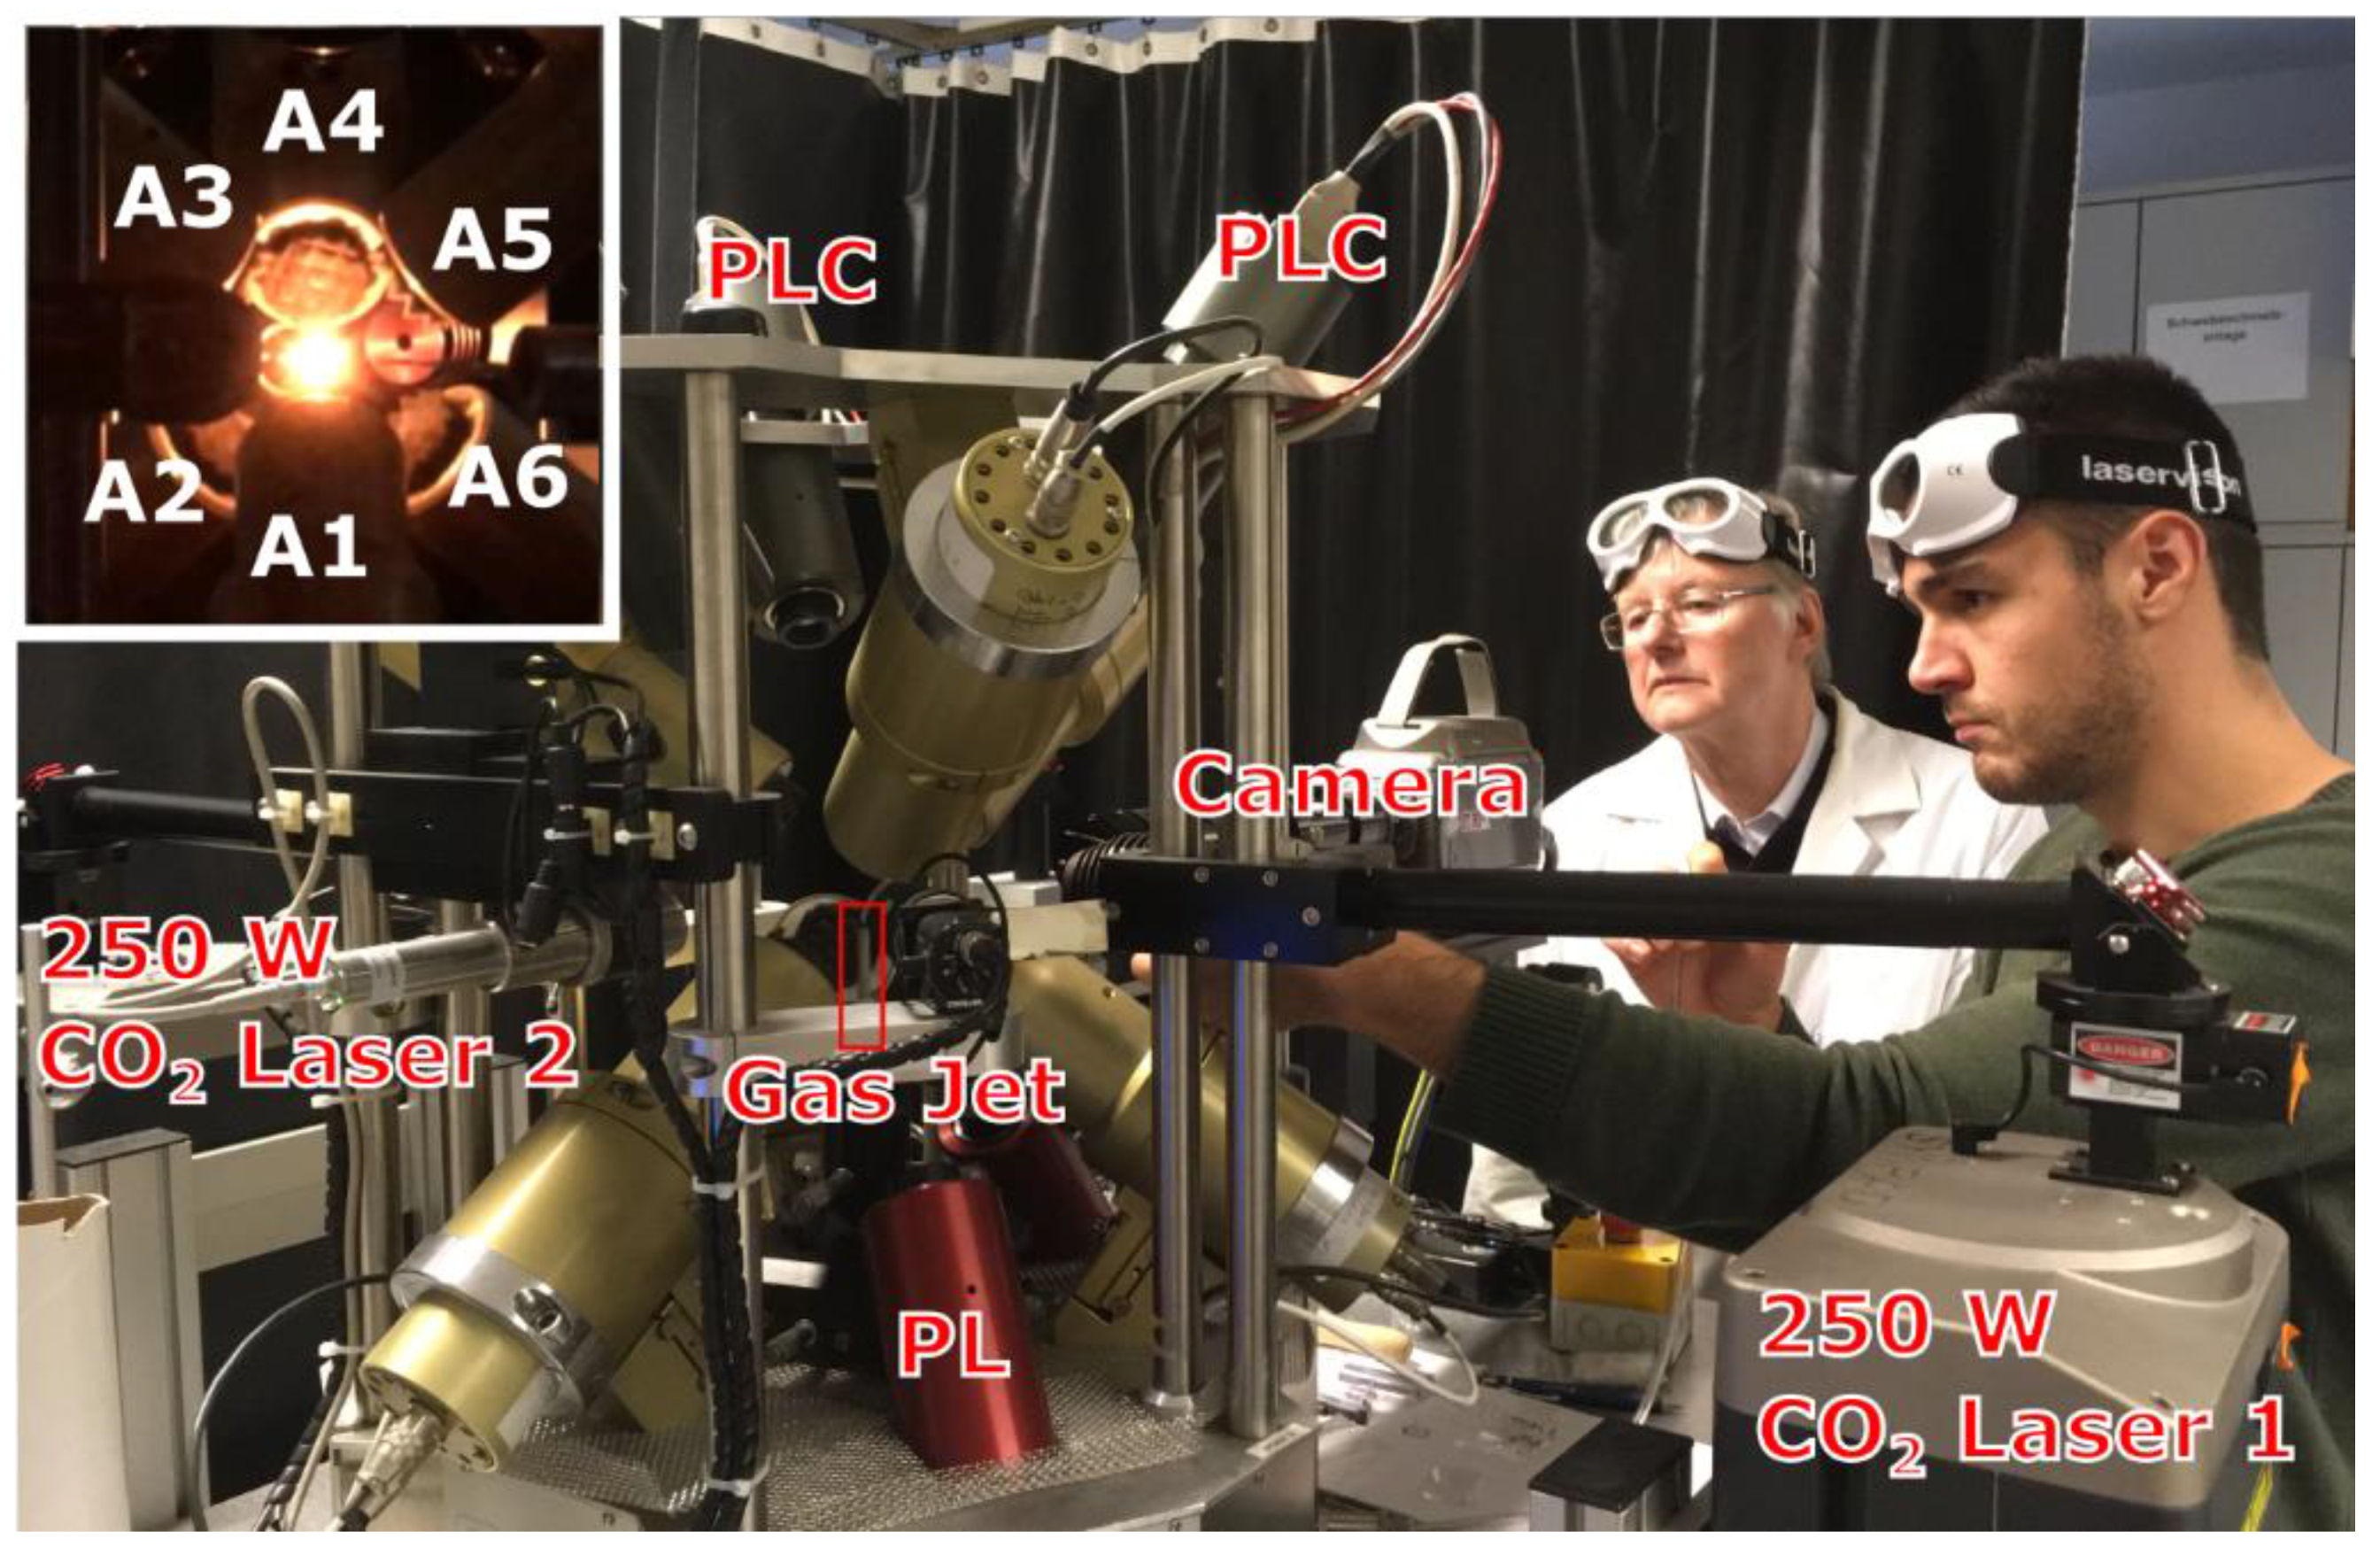
Operation of the aero-acoustic levitator at RWTH Aachen. J.N. is positioning the bead using an air pick above the gas jet for levitation. Inset: the sample bead heated with the dual laser beam, A1–A6 are frequency matched 22.2 kHz acoustic transducers controlled with input from positioning lasers and cameras (labeled PL and PLC, respectively).
Figure 1.
Operation of the aero-acoustic levitator at RWTH Aachen. J.N. is positioning the bead using an air pick above the gas jet for levitation. Inset: the sample bead heated with the dual laser beam, A1–A6 are frequency matched 22.2 kHz acoustic transducers controlled with input from positioning lasers and cameras (labeled PL and PLC, respectively).

Figure 2.
Cooling trace of a 59-mg Y2O3 sample (~2.5 mm in diameter) melted in an Ar jet in an aero-acoustic levitator with overlayed density measurements and video frames (lateral view): (1)—molten droplet heated laterally with two laser beams which are visible as bright spots; (2)—undercooled liquid before crystallization; (3)—recalescence or “flash” on crystallization; (4)—phase transformation from high temperature hexagonal to cubic bixbyite phase. The brightness of images (2–4) was adjusted by the same degree for visibility. A video fragment is provided in Supplementary Materials (Video S1).

Figure 3.
Cooling traces with overlayed density measurements. (A) 119.5-mg Zr0.9Y0.1O1.95 sample levitated in Ar; (B) a 32-mg Zr0.95Y0.05O1.975 sample levitated in nitrogen; (C) video frames for the Zr0.9Y0.1O1.95 sample (~3.5 mm in diameter): (1)—before turning off the lasers (visible as bright spot); (2–5)—113, 132, 135 and 151 ms after turning off the laser. The brightness was adjusted individually for every frame. A video fragment is provided in Supplementary Materials (Video S2).


Table 1.
Density and volumetric thermal expansion coefficient (TEC) for liquid oxides at melting temperatures (Tm) measured in this work compared with previously published data.
Table 1.
Density and volumetric thermal expansion coefficient (TEC) for liquid oxides at melting temperatures (Tm) measured in this work compared with previously published data.
| Composition | Tm, °C [Ref.] | Density g/cm3 | TEC 10−4 K−1 | Method † | Ref. |
|---|---|---|---|---|---|
| Y2O3 | 2431 [58] | 4.6 ± 0.15 | 3 ± 1 | AAL | This work |
| 4.42 | 1.9 | CNL↓ | Granier 1988 [59] | ||
| 4.15 ‡ | 4.5 | AI MD | Kapush 2017 [60] | ||
| HfO2 | 2800 [61] | 8.2 ± 0.3 | - | AAL | This work |
| 8.16 | Gallington 2017 [62] | ||||
| 8.7 * | AI MD | Hong 2018 [63] | |||
| Zr0.95Y0.05O1.975 | 2730 [64] | 4.9 ± 0.2 | 2 ± 1 | AAL | This work |
| Zr0.9Y0.1O1.95 | 2750 [64] | 4.7 ± 0.2 | 3 ± 1 | AAL | This work |
| ZrO2 | 2710 [61] | 4.9 | 0.9 | AI MD | Hong 2018 [63] |
| 5.05 | 1.8 | CNL→ | Kohara 2014 [65] | ||
| 4.69 ± 0.23 | 0.9 | CNL→ | Kondo 2019 [66] | ||
| Yb2O3 | 2434 [67] | 8.4 ± 0.2 | - | AAL | This work |
| 7.94 | 0.9 | CNL↓ | Granier 1988 [59] | ||
| 8.75 | 4.5 | AI MD | Fyhrie 2019 [68] | ||
| Er2O3 | 2417 [67] | 8.17 ± 0.16 | 1.0 | ESL(ISS) | Koyama 2020 [37] |
| 7.60 | 0.4 | CNL↓ | Granier 1988 [59] | ||
| Gd2O3 | 2420 [67] | 7.24 ± 0.14 | 0.7 ± 0.2 | ESL(ISS) | Ishikawa 2020 [36] |
| 6.93 | 1.5 | CNL↓ | Granier 1988 [59] |
† Methods abbreviation: AAL—aero-acoustic levitation; CNL ↓—conical nozzle aerodynamic levitation top view; CNL →—idem., side view; PDF—refined from experimental pair distribution function; ESL(ISS)—electrostatic levitation at international space station; AI MD—ab initio molecular dynamic computations. ‡ The density value from calculations at 2377 °C. * The density value from calculations at 2827 °C.
Table 2.
Calculated emissivity based on the reported values for the refractive index (n).
| Composition | T, °C | n | λ, nm | εcalc | Reference for (n) Value |
|---|---|---|---|---|---|
| Al2O3 | 25 | 1.78 | 632.8 | 0.92 | Krishnan 1991 [73] |
| Y2O3 | 25 | 1.92 | 650 | 0.90 | Nigara 1968 [74] |
| HfO2 | 25 | 2.08 | 600 | 0.88 | Hu 2003 [75] |
| Yb2O3 | 25 | 1.94 | 643.8 | 0.90 | Medenbach 2001 [76] |
| ZrO2 12 mol% Y2O3 | 25 | 2.15 | 650 | 0.87 | Wood 1982 [77] |
Table 3.
Emissivity values calculated from assumption that the recalescence peak reaches the melting temperature (Tm).
Publisher’s Note: MDPI stays neutral with regard to jurisdictional claims in published maps and institutional affiliations. |
© 2021 by the authors. Licensee MDPI, Basel, Switzerland. This article is an open access article distributed under the terms and conditions of the Creative Commons Attribution (CC BY) license (http://creativecommons.org/licenses/by/4.0/).
Share and Cite
MDPI and ACS Style
Ushakov, S.V.; Niessen, J.; Quirinale, D.G.; Prieler, R.; Navrotsky, A.; Telle, R. Measurements of Density of Liquid Oxides with an Aero-Acoustic Levitator. Materials 2021, 14, 822. https://doi.org/10.3390/ma14040822
AMA Style
Ushakov SV, Niessen J, Quirinale DG, Prieler R, Navrotsky A, Telle R. Measurements of Density of Liquid Oxides with an Aero-Acoustic Levitator. Materials. 2021; 14(4):822. https://doi.org/10.3390/ma14040822
Chicago/Turabian StyleUshakov, Sergey V., Jonas Niessen, Dante G. Quirinale, Robert Prieler, Alexandra Navrotsky, and Rainer Telle. 2021. "Measurements of Density of Liquid Oxides with an Aero-Acoustic Levitator" Materials 14, no. 4: 822. https://doi.org/10.3390/ma14040822
Note that from the first issue of 2016, this journal uses article numbers instead of page numbers. See further details here.