Article

Energy Transfer from Pr3+ to Gd3+ and Upconversion Photoluminescence Properties of Y7O6F9:Pr3+, Gd3+

School of Materials Science and Engineering, Liaocheng University, Liaocheng 252059, China
*
Authors to whom correspondence should be addressed.
Materials 2022, 15(21), 7680; https://doi.org/10.3390/ma15217680
Submission received: 21 September 2022 / Revised: 21 October 2022 / Accepted: 27 October 2022 / Published: 1 November 2022
(This article belongs to the Collection Luminescent Materials)

Abstract

:
Upconversion materials have numerous potential applications in light energy utilization due to their unique optical properties. The use of visible light excitation to obtain ultraviolet emission is a promising technology with broad application prospects, while relevant research is absent. A series of Pr3+, Gd3+ doped Y7O6F9 phosphors were synthesized by traditional solid–state reaction. X-ray diffraction, scanning electronic microscopy, steady-state photoluminescence spectra, a decay dynamic, and upconversion emission spectra of the samples were studied. Under the excitation of 238 nm, the energy transfer from Pr3+ to Gd3+ was realized and a strong ultraviolet B emission due to the 6P7/28S7/2 transition of the Gd3+ ions was achieved. Under the excitation of a 450 nm blue laser, Pr3+ absorbed two blue photons to realize the upconversion process and then transferred the energy to Gd3+ to obtain the ultraviolet B emission.

1. Introduction

Upconversion (UC) luminescence refers to the nonlinear process of emitting a high-energy photon when two or more low-energy photons are absorbed. Because of its unique physical and chemical properties, UC luminescence has attracted extensive attention over the past few years. Most of the research on UC is based on the excitation in the infrared region to obtain the emission in the visible region and has made enormous progress, which is widely applied in solar cells, biological imaging, oxygenic photosynthesis, solid–state lasers, fluorescent probes, and photodynamic therapy [1,2,3,4,5]. Taking into account factors, such as conversion efficiency, research on the use of abundant visible energy to realize visible-to-ultraviolet (UV) conversion is relatively lacking. UV radiation refers to electromagnetic waves with wavelengths ranging from 100 nm to 400 nm, which is very significant in physics, medicine, the environment, and other aspects. UV light can be divided into ultraviolet A (UVA), ultraviolet B (UVB), and ultraviolet C (UVC), and their wavelength ranges are 400–315 nm, 315–280 nm, and 280–100 nm, respectively. It is necessary and meaningful to seek a method and mechanism to obtain UV emission. Many researchers have made great efforts to explore UV lasers, using UC luminescent materials and nonlinear crystal technology to obtain deep UV lasers [6,7,8]. At present, using UVB fluorescent lamps is a common method to treat skin diseases, such as psoriasis, vitiligo, and skin burn. Various studies have shown that the most effective range is in the long wave part of the UVB spectrum, that is, between 305 nm and 315 nm. In addition to phototherapy, UVB also has potential advantages in other areas. Because UVB has the visible–blind feature, UV cameras can detect UVB radiation in indoor-lighting environments and can effectively control the interference of solar light sources. Therefore, it has potential application in the field of optical tagging [9,10,11,12]. The use of low-energy light as the excitation light source to obtain high-energy UV emission and broaden the application range of the UV region has important research significance.
For some rare earth ions (RE3+), such as Pr3+, Gd3+, Tb3+, and Ce3+, the emission corresponding to the transition between some energy levels is located in the UV band so it can be used as the UV luminous activator. The emission of Pr3+ extends from UV to infrared radiation due to its interaction between abundant 4f energy levels and the 4f5d state. In various phosphors doped with Pr3+ ions, the transition of 3H4 to 3PJ or 1D2 and then to the 4f5d state has been realized under visible excitation, and the UV region emission of the 4f5d state has been obtained [6,13,14,15,16,17]. The luminescence properties of Pr3+ ions largely depend on the host lattice. An important criterion for realizing the visible-to-UV mechanism is that the 4f5d energy level of Pr3+ ions is lower than the 1S0 energy level, and if the host lattice crystal field causes a band energy that is too high, the second excitation step cannot be achieved [14,16,17]. The Gd3+ ion shows an ff transition and a characteristic emission at about 313 nm. Furthermore, it has no absorption in visible light due to its unique energy-level structure. Therefore, reports on Gd3+ ions’ luminescence are mainly ordinary photoluminescence (PL) under high-energy UV excitation. The 4f5d interconfigurational transition of Pr3+ overlaps with the 8S7/26DJ transition of Gd3+, which can result in an efficient energy transfer. Thus, the UVB emission of the Gd3+ ions excited by visible light can be realized [12,18,19,20]. The quantum efficiency is determined by the nonradiative process of the host lattice. High phonon vibration will increase the nonradiative relaxation rate and, thus, reduce the quantum efficiency [21]. In contrast, fluoride generally has the advantages of low phonon energy (less than 350 cm−1) and a wide transparent region, but it is less chemically stable, easily oxidized, susceptible to moisture, and difficult to prepare and handle. Oxide has good stability, but its phonon energy is relatively high. Oxyfluorides combine the advantages of fluoride and oxide, have moderate phonon cutoff energy and good chemical stability, and are generally considered an ideal host [22,23,24,25]. The Y7O6F9 crystal has high photochemical stability and a suitable crystal environment, which has great potential to be used as UV UC laser materials.
In this work, we have synthesized Y7O6F9:Pr3+, Gd3+ phosphors via the solid–state synthesis method and investigated their optical properties. The energy transfer from Pr3+ to Gd3+ was analyzed. The UC emission from Gd3+ in the UV region upon the excitation of blue light was investigated.

2. Experimental

2.1. Synthesis

Y7O6F9:Pr3+ and Y7O6F9:Pr3+, Gd3+ phosphors were synthesized by a traditional solid–state reaction. Stoichiometric amounts of Y2O3, Pr6O11, and Gd2O3 and excessive NH4F were mixed and ground (the ratio of the rare earth elements to fluorine was 1:2). For the Pr3+ and Gd3+ doping, a stoichiometric amount of Y3+ was omitted. The mixtures were then sintered at 1120 ℃ for 30 min in a tube furnace. The samples were cooled down naturally and crushed for further characterization.

2.2. Characterization

The crystal structure of the synthesized samples was identified using powder X-ray diffraction (XRD) analysis by using a Bruker D8 Advance diffractometer and Cu Kα radiation as the incident radiation. The patterns were collected within a 2θ range of 5°~90°. The morphology of the powder was characterized on a Zeiss Merlin Field Emission Scanning Electron Microscope (FE-SEM). Energy-dispersive X-ray spectroscopy (EDS) was performed on the accessories to the FE-SEM. Steady-state emission and excitation spectra were measured on a Hitachi F-7000 fluorescence spectrophotometer using a 150 W xenon lamp as the excitation source. Fluorescence decays were collected on an Edinburgh Instruments FS5 fluorescence spectrometer with a μs flash lamp as the excitation source. UC emission spectra were obtained by exciting the sample with a 450 nm continuous wave (CW) laser with a maximum output power of 2 W (Changchun New Industries Optoelectronics Technology, Changchun, China).

3. Results and Discussion

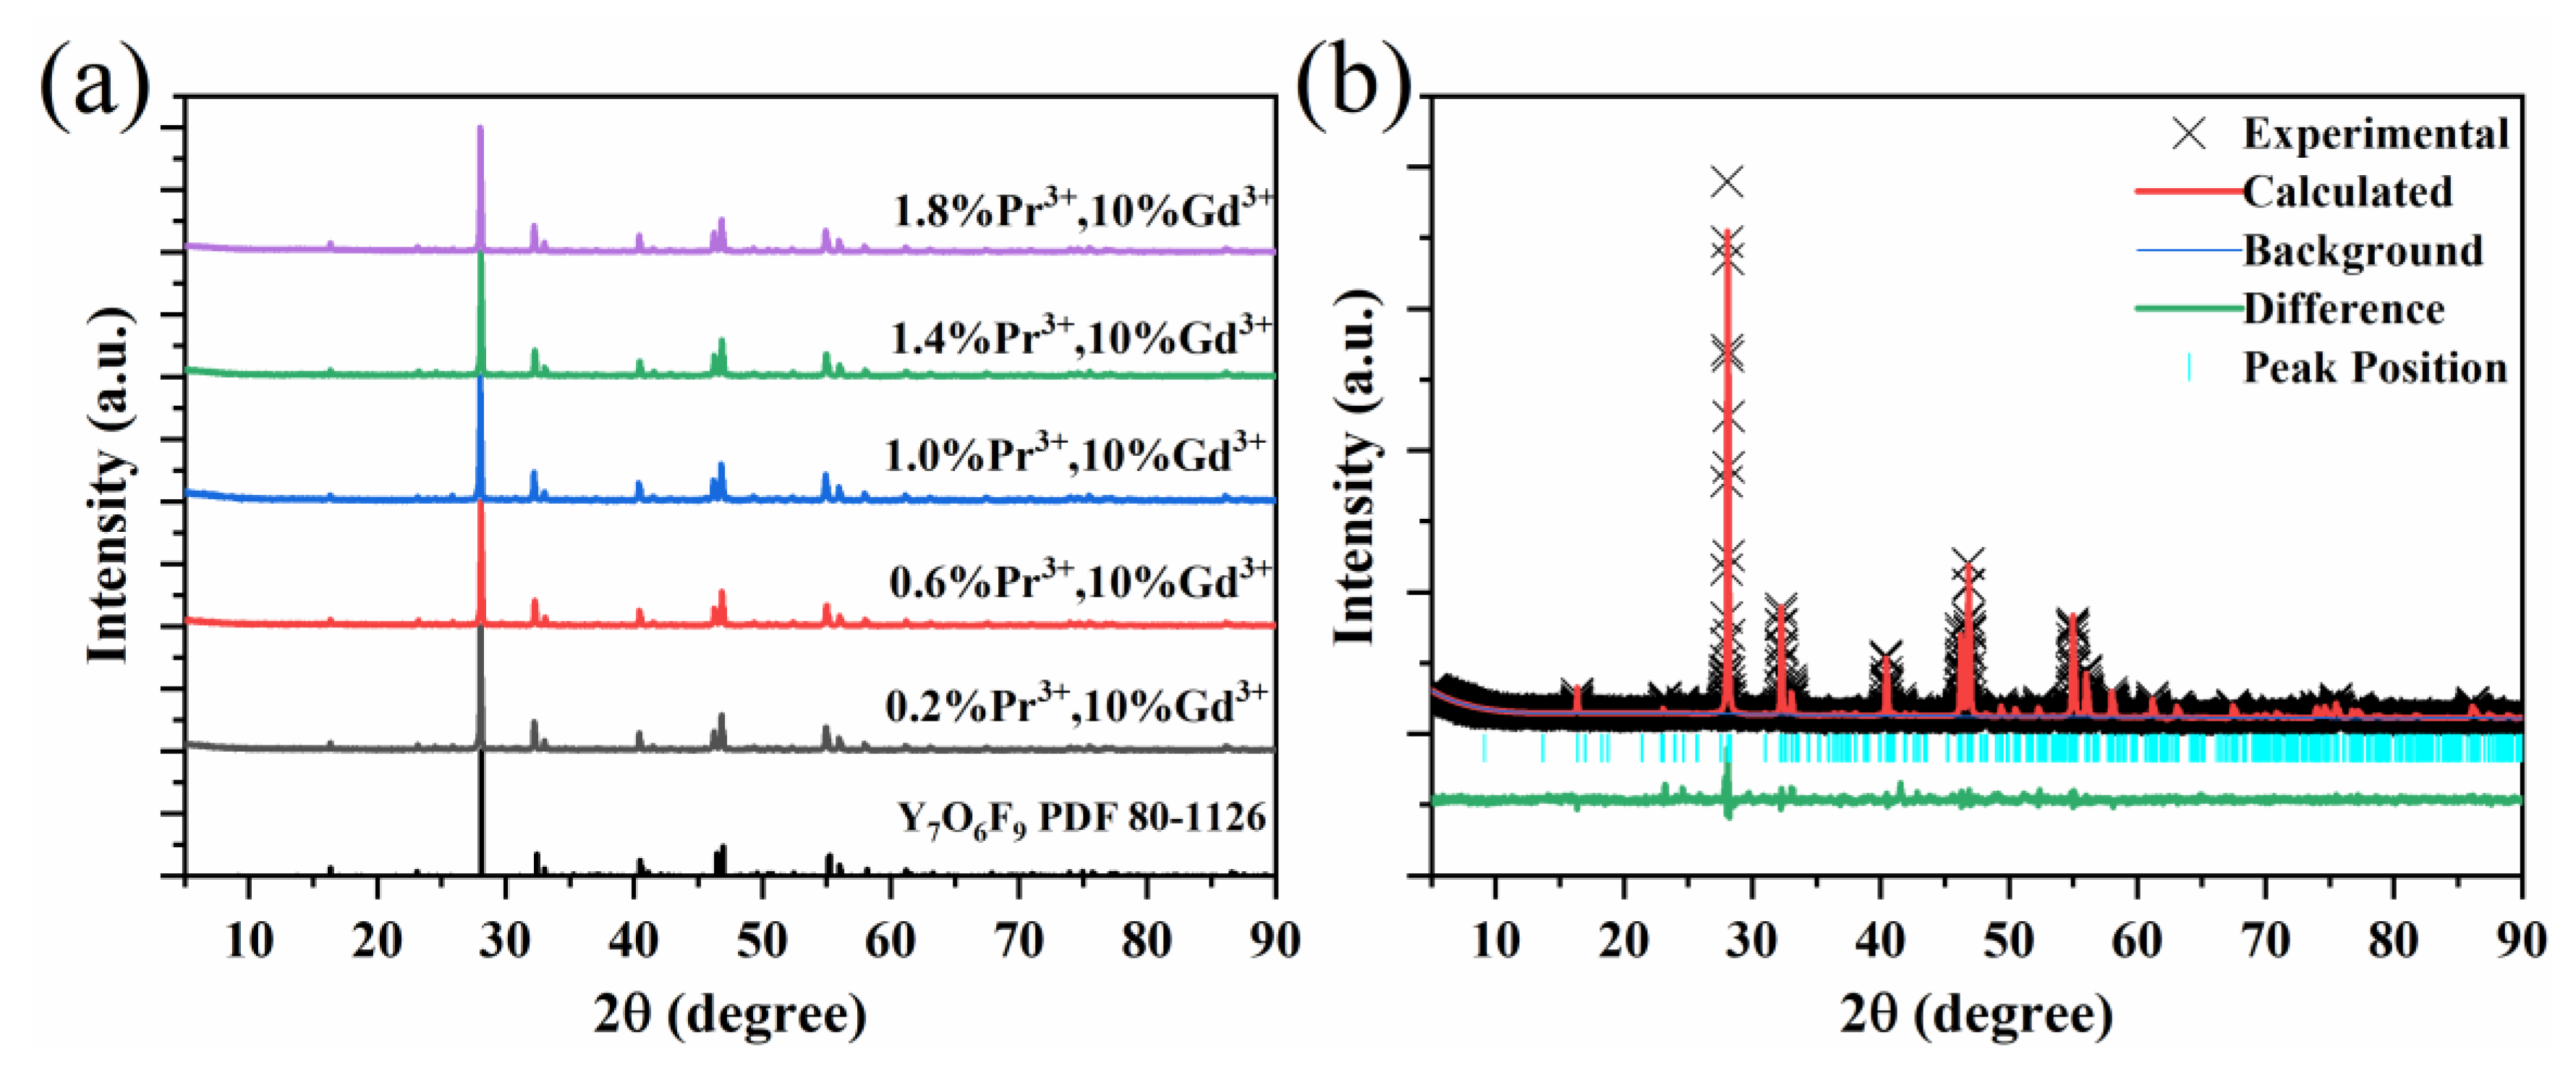
3.1. Phase and Structure Analysis

The XRD patterns of the Y7O6F9:Pr3+, Gd3+ powders are presented in Figure 1a. The diffraction patterns of all the samples agree with the standard card of Y7O6F9 (JCPDS No. 801126), and no detectable impurity peaks corresponding to the second phase are observed. The Y7O6F9 crystal structure is highly tolerable, and a solid solution is formed, despite the great difference in the ionic radius of Y3+ and Gd3+. A Rietveld analysis was performed on Y7O6F9:1.4%Pr3+, 10%Gd3+ by using the GSAS program with the structure parameters as the initial input. The calculated and experimental results, as well as their differences of the Y7O6F9:1.4%Pr3+, 10%Gd3+ sample, are shown in Figure 1b. The obtained cell parameters of Y7O6F9:1.4%Pr3+, 10%Gd3+, as well as the reliability, are listed in Table 1. The reliability parameters are Rwp = 8.42%, Rp = 6.39%, χ2 = 2.276, which supports the conclusion that the prepared samples are pure phase.
The crystal structure of Y7O6F9 was visualized by using Vesta software and is shown in Figure 2. There are four different kinds of Y3+ sites, five F sites, and four O2− sites in the lattice. The coordination environments of Y3+ are also shown in Figure 2. The Y(1) atom is surrounded by six O2− and two F atoms in an 8d position, Y(2) by four O2– and three F in an 8d position, Y(3) by two O2− and five F in an 8d position, and Y(4) is surrounded by eight F atoms in a 4c Wyckoff position.

3.2. SEM Image of the Y7O6F9:Pr3+, Gd3+ Phosphor

In order to examine the surface morphology and average crystal size, an SEM image of Y7O6F9:1.4%Pr3+, 10%Gd3+ was checked and is shown in Figure 3a. The powder is composed of irregular particles, with an average diameter of about 6.3 µm. The EDS analysis in Figure 3b confirms the existence of Y, O, F, Pr, and Gd elements in the material.

3.3. PL Properties of the Y7O6F9:Pr3+ Phosphor

To investigate the interaction between the Pr3+ ions in the Y7O6F9 matrix, the excitation and emission spectra of Pr3+ in the UV and visible regions were studied. Figure 4a shows the excitation and emission spectra of Pr3+ in the UV region. The excitation spectrum was obtained by monitoring the emission at 300 nm. There is an excitation band within the range of 200–250 nm with a maximum of 238 nm, which can be assigned to the 4f2→4f5d transition of Pr3+. The emission spectra consist of two emission bands with the maxima at 262 nm and 300 nm upon excitation of UV light at 238 nm, which can be attributed to the 4f5d→4f2 interconfigurational transition of Pr3+. It can also be observed that the intensity enhanced with the Pr3+ concentration, increasing from 0.2 mol% to 1.0 mol%. The excitation spectra shown in Figure 4b are of the emission at 496 nm, which contain two different types of transitions. The narrow line excitation peaks in the visible region are attributed to the 3H43P0, 1, 2, 1I6 transitions of Pr3+. The broad excitation bands centered at 238 nm are due to the transition of 4f2→4f5d. The presence of this band suggests the nonradiative relaxation from the 4f5d state to the 4f2 state. The 4f states stoke the emission generated by the 446 nm excitation is measured, as shown in Figure 4c. The strongest peak at 496 nm originated from the transition of 3P03H4, indicating that the 3P0 level is 20,161 cm−1 higher than the 3H4 level. Upon the excitation of blue light, 3PJ (J = 0, 1, 2), or the 1I6 states, could be populated, while a rapid relaxation generally happens to the 3P0 state. One can notice that the spectra are dominated by the emission due to 3P03HJ (J = 4, 5, 6) transition whether the Pr3+ doping concentration is 0.2 mol% or 1.0 mol%, and the emission from the 1D23H4 transition is extremely weak. Figure 4d shows the emission spectra at 450~750 nm upon excitation at 238 nm. The emission is similar to those shown in Figure 4c. It comes from the relaxation of Pr3+ to the lower energy level when it is excited by the 4f5d state and is then followed by the transition within the 4f2 configuration. Through 580 nm of light used to excite the electrons from the ground state 3H4 to the 1D2 level, the spectra show an emission band from 600 nm to 640 nm, as shown in Figure 4e. However, the intensity changes in a manner opposite to Figure 4c; the emission intensity decreases with the increase of the Pr3+ ion concentration, indicating that the quenching of the 1D2 state is very severe, which may be caused by two reasons. The 1D2 level can be populated through the 3P01D2 multi-phonon relaxation and [3P0, 3H4]→[3H6,1D2] cross-relaxation. It is known that the energy range between 3P0 and 1D2 is about 3866cm−1, and the phonon energy of Y7O6F9 is lower (about 450 cm−1) so that 8.5 phonons are required to achieve relaxation from 3P0 to 1D2. In order for the equivalent phonon number for the multi-phonon relaxation process to occur, it must be less than 4~5 phonons; so, the probability of occurrence is lower. The quenching of the 1D2 energy level may also occur. The [1D2, 3H4]→[1G4, 3F3,4] transitions yield a population of 1G4 and 3F3,4 levels [26,27,28]. The transition and relaxation between the relevant energy levels mentioned above under 238 nm and 446 nm blue excitations can be explained by the electron populating processes (see Figure 4f).

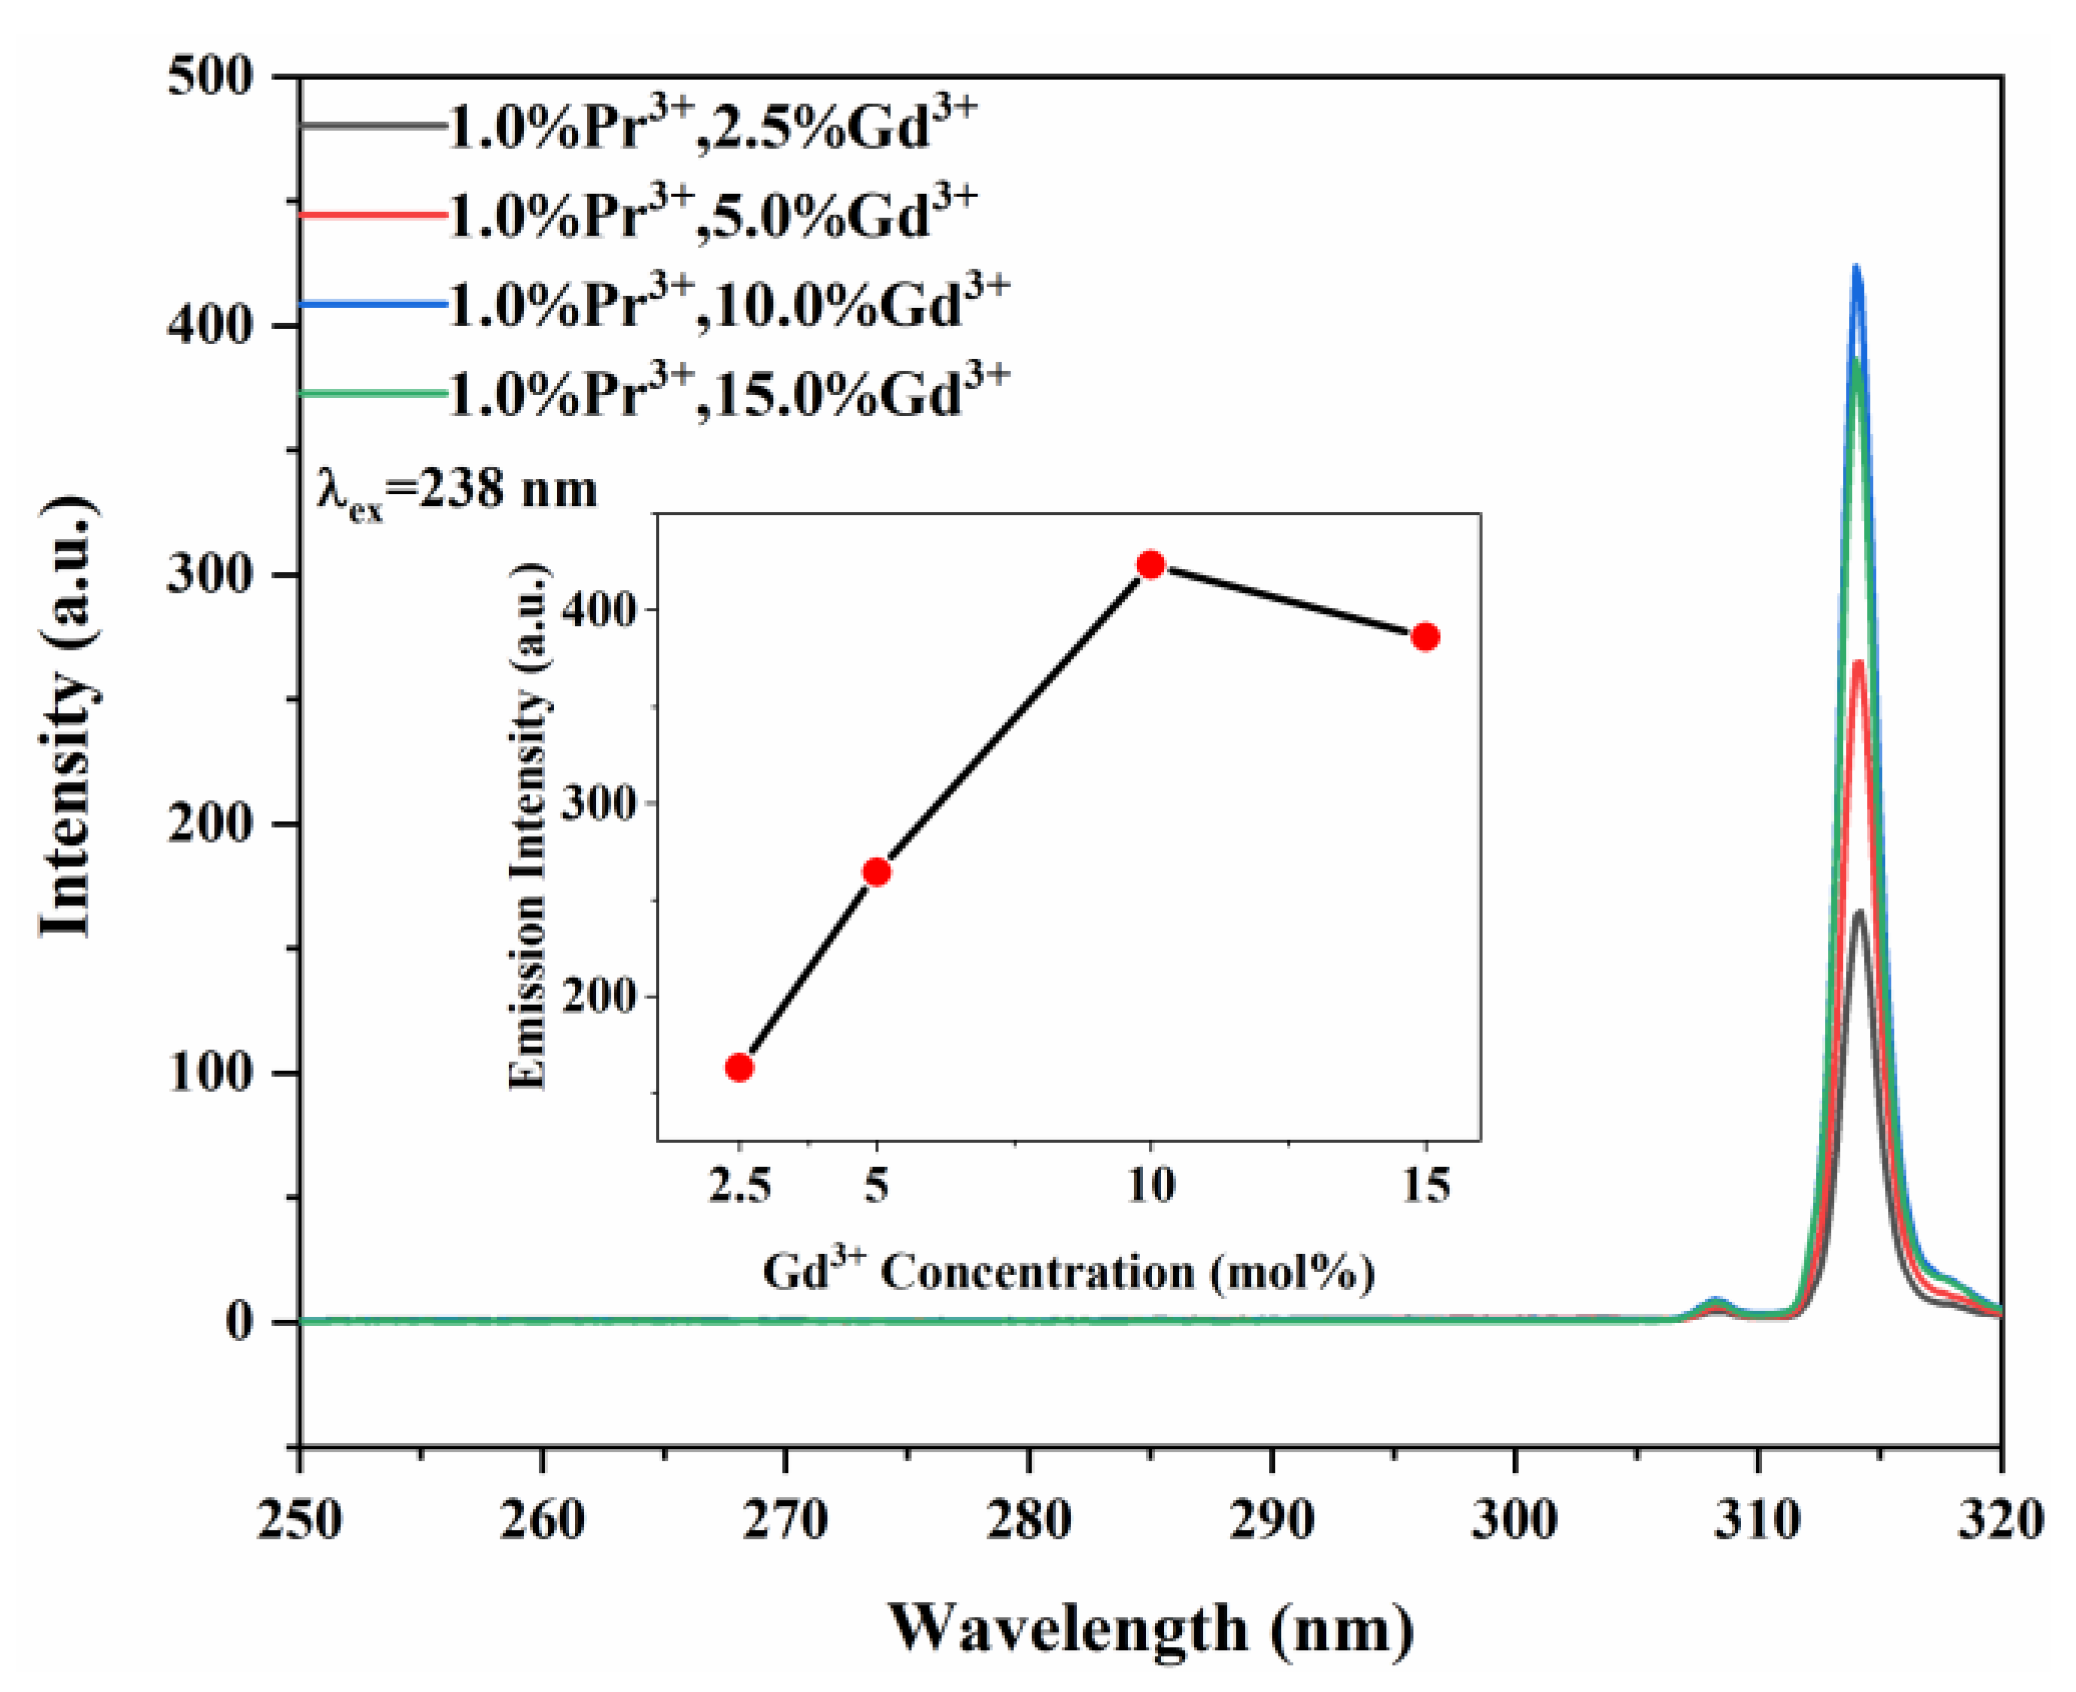
3.4. PL Properties of the Y7O6F9:Pr3+, Gd3+ Phosphor

Figure 5 shows the emission spectra of Y7O6F9: 1.0%Pr3+, xGd3+ as a function of the Gd3+ concentration. It shows that the intensity of the Gd3+ emission increases with the Gd3+ content till 10 mol%, and then it drops.
Figure 6 illustrates the excitation spectra-monitored emission wavelength at 314 nm. The excitation spectra consist of several excitation peaks of 253 nm, 274 nm, and 276 nm, corresponding to the electronic transition of Gd3+ and a broad absorption band from 220 to 250 nm. The broad excitation band can be attributed to the 4f2→4f5d transition of electrons in the Pr3+ ions. The excitation peaks at 253 nm, 274 nm, and 276 nm correspond to the 8S7/26D9/2, 8S7/26I11/2, 8S7/26I9/2 transitions of the Gd3+ ions, respectively. Through monitoring the emission of Gd3+, the broad and intense absorption peaks of Pr3+ were obtained, and it can be concluded that most of the excitation energy is absorbed by the Pr3+ ions.
The emission spectra of the Y7O6F9:xPr3+, 10%Gd3+ phosphors in the UV region upon excitation at 238 nm are also shown in Figure 6. The luminescence intensity increases with the increasing Pr3+ doping concentration, reaching a maximum at 1.4 mol%, and then it no longer increases, indicating the onset of concentration quenching effects, which can be clearly seen from the inset. From these emission spectra, one can clearly observe the sharp and intense emission peak at 314 nm and a lower intensity peak at 309 nm, which are designated as the 6P7/28S7/2 and 6P5/28S7/2 transition of Gd3+, respectively. The process is that when the electrons in the Pr3+ ions transition to the 4f5d level by absorbing the excitation energy, their energy is transferred to the excitation level of the Gd3+ ions. Gd3+ relaxes to the ground state and produces UVB emission. It shows that the strategy of energy transfer from Pr3+ to Gd3+ is effective. Gd3+ ions possess an interconfiguration 4f-4f transition and have a wide band gap greater than 30,000 cm−1, which reduces the multi-phonon transition [29]. The absence of a broadband emission from the 4f5d→4f2 transition for Pr3+ also indicates that the energy transfer from Pr3+ to Gd3+ is efficient.
The fluorescence decay curve of the 3P03H4 transition of Y7O6F9:xPr3+, 10%Gd3+ was monitored under the excitation of a 446 nm pulsed xenon lamp, as shown in Figure 7a. It is observed that all the samples show quite similar decay behavior and the decay curves can be well-fitted as a double exponential function. The double exponential model is given below:
I t = A 1 exp ( t / τ 1 ) + A 2 exp ( t / τ 2 )
where It is the emission intensity at time t, A1 and A2 are constants, and τ1 and τ2 are the partial decay lifetimes of the exponential components. The average lifetime, τ, of the 3P0 level is calculated from the following equation:
τ = ( A 1 τ 1 2 + A 2 τ 2 2 ) / ( A 1 τ 1 + A 2 τ 2 )
The fluorescence lifetime values are given in Table 2 and decreased from 18.8 μs to 13.8 μs with an increasing Pr3+ concentration, indicating that the nonradiative relaxation of the Pr3+ ions increases. As mentioned above, the multi-phonon relaxation rate is related to the phonon energy of the matrix, so the cross-relaxation between adjacent Pr3+ ions may be the main reason for the fast decay of the 3P0 state. In addition, the lifetime of the 1D2 level was measured under 580 nm of pulse excitation, as shown in Figure 7b, and the curve was fitted by a more complicated triple exponential equation. The triple exponential model is:
I t = A 1 exp ( t / τ 1 ) + A 2 exp ( t / τ 2 ) + A 3 exp ( t / τ 3 )
The average lifetime, τ, of the 1D2 fluorescence was obtained applying the following expression:
τ = ( A 1 τ 1 2 + A 2 τ 2 2 + A 3 τ 3 2 ) / ( A 1 τ 1 + A 2 τ 2 + A 3 τ 3 )
The lifetime values are also given in Table 2. It can be seen that the lifetime value of 1D2 is much longer than that of the 3P0 state, which is due to its own singlet spin multiplicity and spin-forbidden transition [27]. With the increase of the Pr3+ ion concentration, the lifetime value also shows a sharp decrease trend. It may be that the [1D2, 3H4]→[1G4, 3F3,4] cross-relaxation process between the Pr3+ ions leads to an increase in the 1D2 nonradiative relaxation rate, which leads to a decrease in the lifetime value.
The UC properties of the Y7O6F9:1.4%Pr3+, 10%Gd3+ phosphor were investigated under excitation with a CW blue laser at 450 nm, as shown in Figure 8a. It can be clearly seen that the spectra were dominated by the emission peak of Gd3+. Considering that there is no intermediate state between the 8S7/2 and 6P7/2 states of Gd3+, the excitation at 450 nm could not directly excite Gd3+, indicating that the energy absorbed by Gd3+ comes from the 4f5d energy level of Pr3+. Effective UVB emission of Gd3+ was obtained by exciting the Pr3+ ions, clearly demonstrating that the energy transfer from Pr3+ to Gd3+ must be very successful. The energy level diagrams of Pr3+ and Gd3+ and the UC process of the material system are plotted in Figure 8b. Under blue light excitation, the two-step excitation dominates the UC process. The first excitation brings Pr3+ from the ground state, 3H4, to the excited state, 3PJ. A rapid relaxation happens to the 3P0 state and then Pr3+ is excited from the intermediate state to the higher energy 4f5d state. The Gd3+ ions can extract the excitation energy of Pr3+ to transition to the ground state.

4. Conclusions

In conclusion, Y7O6F9 doped with Pr3+ and Gd3+ phosphors were successfully synthesized by the traditional solid–state reaction method. XRD data of the Y7O6F9 phosphor are in good agreement with the standard JCPDS data. SEM images showed the agglomeration of irregular particles, and EDS confirmed the presence of all the elements in the phosphor. Through an efficient energy transfer from Pr3+ to Gd3+, a strong narrow-band UVB emission from the Gd3+ ion could be obtained under 238 nm of excitation. Under blue laser excitation at 450 nm, the UVB emitting of the Gd3+ ions was obtained, which originated from Pr3+ absorbing two blue photons to the 4f5d configuration, followed by an energy transfer to Gd3+. Our findings suggest that Y7O6F9:Pr3+, Gd3+ is a promising candidate for visible-to-UV phosphors and opens up new options for applications requiring UV radiation, such as phototherapy treatments and optical tagging.

Author Contributions

Conceptualization, Y.S., Y.W., X.Z. and H.L.; investigation, Y.S., Y.W., H.L. and J.H.; resources, Y.S., Y.W., C.H., H.L. and W.L.; writing—original draft, Y.S.; writing—review and editing, Y.S., Y.W. and X.Z.; supervision, J.H., W.L. and H.L.; funding acquisition, Y.W., C.H. and H.L. All authors have read and agreed to the published version of the manuscript.

Funding

This research was financially supported by the National Natural Science Foundation of China (Grant Nos. NSFC, 12004148, 51701091) and the Natural Science Foundation of Shandong Province (Grant Nos. ZR2021QA057). Innovation Team of Higher Educational Science and Technology Program in Shandong Province (No. 2019KJA025).

Institutional Review Board Statement

Not applicable.

Informed Consent Statement

Not applicable.

Data Availability Statement

Not applicable.

Conflicts of Interest

The authors declare no conflict of interest.

References

  1. Wang, H.Q.; Batentschuk, M.; Osvet, A.; Pinna, L.; Brabec, C.J. Rare-earth ion doped up-conversion materials for photovoltaic applications. Adv. Mater. 2011, 23, 2675–2680. [Google Scholar] [CrossRef]
  2. Kang, D.; Jeon, E.; Kim, S.; Lee, J. Lanthanide-Doped Upconversion Nanomaterials: Recent Advances and Applications. BioChip. J. 2020, 14, 124–135. [Google Scholar] [CrossRef] [Green Version]
  3. Guo, L.; Wang, Y.; Wang, Y.; Zhang, J.; Dong, P.; Zeng, W. Structure, enhancement and white luminescence of multifunctional Lu6O5F8:20%Yb3+,1%Er3+(Tm3+) nanoparticles via further doping with Li+ under different excitation sources. Nanoscale 2013, 5, 2491–2504. [Google Scholar] [CrossRef] [PubMed]
  4. Duan, C.; Liang, L.; Li, L.; Zhang, R.; Xu, Z.P. Recent progress in upconversion luminescence nanomaterials for biomedical applications. J. Mater. Chem. B 2018, 6, 192–209. [Google Scholar] [CrossRef] [PubMed]
  5. do Nascimento, J.P.C.; do Carmo, F.F.; Façanha, M.X.; Sales, J.C.; Gouveia, D.X.; de Andrade, H.D.; Queiroz Júnior, I.S.; Sombra, A.S.B. Up-Conversion Luminescence of Er3+/Pr3+/Yb3+ Co-doped LaNbO4 Phosphors. J. Electron. Mater. 2020, 49, 6009–6015. [Google Scholar] [CrossRef]
  6. Wu, J.; Zheng, H.; Liu, X.; Han, B.; Wei, J.; Yang, Y. UVC upconversion material under sunlight excitation: LiYF4: Pr3+. Opt. Lett. 2016, 41, 792–795. [Google Scholar] [CrossRef]
  7. Espinoza, S.; Volhard, M.F.; Kätker, H.; Jenneboer, H.; Uckelmann, A.; Haase, M.; Müller, M.; Purschke, M.; Jüstel, T. Deep Ultraviolet Emitting Scintillators for Biomedical Applications: The Hard Way of Downsizing LuPO4:Pr3+. Part. Part. Syst. Char. 2018, 35, 1800282. [Google Scholar] [CrossRef]
  8. Reichert, F.; Moglia, F.; Metz, P.W.; Arcangeli, A.; Marzahl, D.T.; Veronesi, S.; Parisi, D.; Fechner, M.; Tonelli, M.; Huber, G. Prospects of Holmium-doped fluorides as gain media for visible solid state lasers. Opt. Mater. Express. 2014, 5, 88–101. [Google Scholar] [CrossRef]
  9. Berneburg, M.; Rocken, M.; Benedix, F. Phototherapy with narrowband vs. broadband UVB. Acta. Derm. Venereol. 2005, 85, 98–108. [Google Scholar]
  10. Parrish, J.A.; Jaenicke, K.F. Action spectrum for phototherapy of psoriasis. J. Investig. Dermatol. 1981, 76, 359–362. [Google Scholar] [CrossRef] [Green Version]
  11. Tamboli, S.; Nair, G.B.; Dhoble, S.J.; Burghate, D.K. Energy transfer from Pr3+ to Gd3+ ions in BaB8 O13 phosphor for phototherapy lamps. Phys. B Condens. Matter 2018, 535, 232–236. [Google Scholar] [CrossRef]
  12. Yan, S.; Liu, F.; Zhang, J.; Wang, X.-J.; Liu, Y. Persistent Emission of Narrowband Ultraviolet-B Light upon Blue-Light Illumination. Phys. Rev. Appl. 2020, 13, 044051. [Google Scholar] [CrossRef]
  13. Cates, E.L.; Kim, J.-H. Upconversion under polychromatic excitation: Y2SiO5:Pr3+, Li+ converts violet, cyan, green, and yellow light into UVC. Opt. Mater. 2013, 35, 2347–2351. [Google Scholar] [CrossRef]
  14. Yan, S.; Liang, Y.; Chen, Y.; Liu, J.; Chen, D.; Pan, Z. Ultraviolet-C persistent luminescence from the Lu2SiO5:Pr3+ persistent phosphor for solar-blind optical tagging. Dalton. Trans. 2021, 50, 8457–8466. [Google Scholar] [CrossRef]
  15. Cates, E.L.; Kim, J.H. Bench-scale evaluation of water disinfection by visible-to-UVC upconversion under high-intensity irradiation. J. Photochem. Photobiol. B 2015, 153, 405–411. [Google Scholar] [CrossRef] [PubMed]
  16. Cates, E.L.; Li, F. Balancing intermediate state decay rates for efficient Pr3+ visible-to-UVC upconversion: The case of β-Y2Si2O7:Pr3+. RSC. Adv. 2016, 6, 22791–22796. [Google Scholar] [CrossRef]
  17. Cates, E.L.; Wilkinson, A.P.; Kim, J.-H. Visible-to-UVC upconversion efficiency and mechanisms of Lu7O6F9:Pr3+ and Y2SiO5:Pr3+ ceramics. J. Lumin. 2015, 160, 202–209. [Google Scholar] [CrossRef]
  18. Shimizu, Y.; Takano, Y.; Ueda, K. UV emissions in Gd3+ doped or Gd3+–Pr3+ Co-doped III–III perovskite-type RMO3 (R = Y, La; M = Al, Ga). Thin. Solid. Films. 2014, 559, 23–26. [Google Scholar] [CrossRef]
  19. Singh, V.; Srinivas Prasad, M.V.V.K.; Rao, A.S.; Rao, J.L.; Irfan, M. On the ultraviolet B emissions of CaLaB7O13:Gd3+ phosphor. Optik 2020, 217, 164880. [Google Scholar] [CrossRef]
  20. Mokoena, P.P.; Nagpure, I.M.; Kumar, V.; Kroon, R.E.; Olivier, E.J.; Neethling, J.H.; Swart, H.C.; Ntwaeaborwa, O.M. Enhanced UVB emission and analysis of chemical states of Ca5(PO4)3OH:Gd3+,Pr3+ phosphor prepared by co-precipitation. J. Phys. Chem. Solids 2014, 75, 998–1003. [Google Scholar] [CrossRef]
  21. Ma, M.; Xu, C.; Yang, L.; Ren, G.; Lin, J.; Yang, Q. Intense ultraviolet and blue upconversion emissions in Yb3+–Tm3+ codoped stoichiometric Y7O6F9 powder. Phys. B Condens. Matter 2011, 406, 3256–3260. [Google Scholar] [CrossRef]
  22. Zaldo, C.; Cascales, C. High thermal sensitivity and the selectable upconversion color of Ln, Yb:Y6O5F8 nanotubes. Phys. Chem. Chem. Phys. 2014, 16, 23274–23285. [Google Scholar] [CrossRef] [PubMed]
  23. Dong, J.; Xiong, H.; Wang, X.; Song, L.; Liu, Y.; Yang, J.; Wu, H.; Yang, C.; Gan, S. Size and morphology-controlled synthesis of vernier yttrium oxyfluoride towards enhanced photoluminescence and white light emission. New. J. Chem. 2018, 42, 11351–11357. [Google Scholar] [CrossRef]
  24. Xiang, G.-X.; Wang, G.-J.; Zhang, Z.-J.; Feng, H.; Zhao, J.-T.; Wang, J.; Sun, X.-Y.; Mao, R.-H.; Wang, Y. Multicolor luminescence properties of Ln7O6F9: RE3+ (Ln = Y, Lu; RE = Pr, Sm and Eu) nano-rods with bifurcation. J. Alloys Compd. 2017, 692, 471–477. [Google Scholar] [CrossRef]
  25. Park, S.; Yang, W.; Park, C.-Y.; Noh, M.; Choi, S.; Park, D.; Jang, H.S.; Cho, S.-H. Up-conversion routines of Er3+–Yb3+ doped Y6O5F8 and YOF phosphors. Mater. Res. Bull. 2015, 71, 25–29. [Google Scholar] [CrossRef]
  26. Saeed, N.A.M.; Coetsee, E.; Swart, H.C. Photoluminescence studies of a YOF phosphor synthesized by the pyrolysis method. Opt. Mater. 2019, 96, 109331. [Google Scholar] [CrossRef]
  27. Mahlik, S.; Malinowski, M.; Grinberg, M. High pressure luminescence and time resolved spectra of La2Be2O5:Pr3+. Opt. Mater. 2011, 34, 164–168. [Google Scholar] [CrossRef]
  28. Zhang, L.; Xia, Y.; Shen, X.; Wei, W. Concentration dependence of visible luminescence from Pr3+-doped phosphate glasses. Spectrochim. Acta A. Mol. Biomol. Spectrosc. 2019, 206, 454–459. [Google Scholar] [CrossRef]
  29. Binnemans, K.; Görller-Walrand, C.; Adam, J.L. Spectroscopic properties of Gd3+-doped fluorozirconate glass. Chem. Phys. Lett. 1997, 280, 333–338. [Google Scholar] [CrossRef]
Figure 1. (a) XRD patterns of Y7O6F9:Pr3+, Gd3+ phosphors. (b) Results of the Rietveld refinement on Y7O6F9:1.4%Pr3+, 10%Gd3+.
Materials 15 07680 g001
Figure 2. Crystal structure of Y7O6F9 (above) and four kinds of coordination for Y3+ (below).
Materials 15 07680 g002
Figure 3. (a) SEM and (b) EDS images of Y7O6F9:1.4%Pr3+, 10%Gd3+ phosphor.
Materials 15 07680 g003
Figure 4. Basic PL properties of Y7O6F9:xPr3+ (x = 0.2%, 1.0%) phosphors. (a) Excitation (λem = 300 nm) and emission (λex = 238 nm) spectra. (b) Excitation spectra (λem = 496 nm). (c) Emission spectra (λex = 446 nm). (d) Emission spectra (λex = 238 nm). (e) Emission spectra (λex = 580 nm). (f) Energy level diagram of Pr3+. Solid lines represent absorption and emission, and dashed black lines represent nonradiative relaxation.
Materials 15 07680 g004
Figure 5. Emission spectra (λex = 238 nm) of Y7O6F9:1.0%Pr3+, xGd3+ (x = 2.5%, 5%, 10%, 15%) phosphors.
Materials 15 07680 g005
Figure 6. Excitation (λem = 314 nm) and emission spectra (λex = 238 nm) of Y7O6F9:xPr3+, 10%Gd3+ (x = 0.2%, 0.6%, 1.0%, 1.4%, 1.8%) phosphors.
Materials 15 07680 g006
Figure 7. (a) 3P0 decay curves (λex = 446 nm, λem = 496 nm). (b) 1D2 decay curves (λex = 580 nm, λem = 602 nm) of the Y7O6F9:xPr3+, 10%Gd3+ (x = 0.2%, 0.6%, 1.0%, 1.4%, 1.8%) phosphors.
Materials 15 07680 g007
Figure 8. (a) UC Emission spectra (λex = 450 nm) of the Y7O6F9:1.4%Pr3+, 10%Gd3+. The output power was 0.38 W. (b) UC energy transfer mechanism of Pr3+ to Gd3+.
Materials 15 07680 g008
Table 1. Cell parameters of Y7O6F9:1.4%Pr3+, 10%Gd3+ obtained from the Rietveld refinement.
FormulaY7O6F9
Crystal systemorthorhombic
Space groupAbm2(39)
Cell parametersa = 5.4191(1) Å
b = 38.8414(8) Å
c = 5.5477(1) Å
α = β = γ = 90°
V = 1167.702 Å3
2θ Range5° ≤ 2θ ≤ 90°
Reliability factorsRwp = 8.42%
Rp = 6.39%
χ2 = 2.276
Table 2. The calculated lifetimes for 3P0 decay and 1D2 decay.
Samples3P0 lifetimes in µs1D2 lifetimes in µs
0.2%Pr3+, 10%Gd3+18.84(2)132.40(1)
0.6%Pr3+, 10%Gd3+17.21(9)58.11(2)
1.0%Pr3+, 10%Gd3+15.89(1)54.71(1)
1.4%Pr3+, 10%Gd3+14.40(6)41.10(7)
1.8%Pr3+, 10%Gd3+13.78(2)28.45(2)
Publisher’s Note: MDPI stays neutral with regard to jurisdictional claims in published maps and institutional affiliations.

