
Nd3+, Yb3+:YF3 Optical Temperature Nanosensors Operating in the Biological Windows

Institute of Physics, Kazan Federal University, 18th Kremlyovskaya Street, Kazan 420008, Russia
*
Authors to whom correspondence should be addressed.
Materials 2023, 16(1), 39; https://doi.org/10.3390/ma16010039
Submission received: 29 October 2022
/
Revised: 16 December 2022
/
Accepted: 16 December 2022
/
Published: 21 December 2022
(This article belongs to the Collection Luminescent Materials)
Abstract
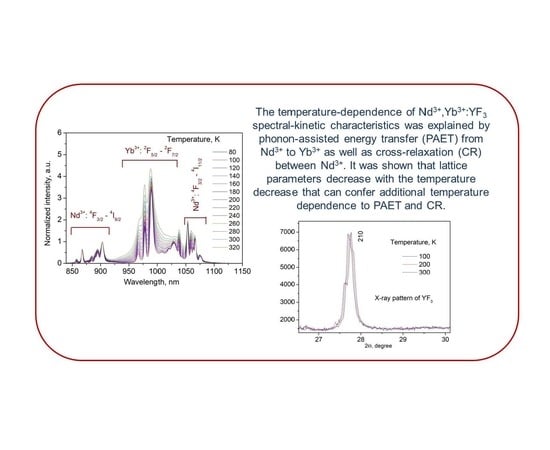
:This work is devoted to the study of thermometric performances of Nd3+ (0.1 or 0.5 mol.%), Yb3+ (X%):YF3 nanoparticles. Temperature sensitivity of spectral shape is related to the phonon-assisted nature of energy transfer (PAET) between Nd3+ and Yb3+). However, in the case of single-doped Nd3+ (0.1 or 0.5 mol.%):YF3 nanoparticles, luminescence decay time (LDT) of 4F3/2 level of Nd3+ in Nd3+ (0.5 mol.%):YF3 decreases with the temperature decrease. In turn, luminescence decay time in Nd3+ (0.1 mol.%):YF3 sample remains constant. It was proposed, that at 0.5 mol.% the cross-relaxation (CR) between Nd3+ ions takes place in contradistinction from 0.1 mol.% Nd3+ concentration. The decrease of LDT with temperature is explained by the decrease of distances between Nd3+ with temperature that leads to the increase of cross-relaxation efficiency. It was suggested, that the presence of both CR and PAET processes in the studied system (Nd3+ (0.5 mol.%), Yb3+ (X%):YF3) nanoparticles provides higher temperature sensitivity compared to the systems having one process (Nd3+ (0.1 mol.%), Yb3+ (X%):YF3). The experimental results confirmed this suggestion. The maximum relative temperature sensitivity was 0.9%·K−1 at 80 K.
1. Introduction
In our time, technological needs in various fields have reached such a development that conventional contact temperature sensors can no longer perform accurate measurements with submicrometer spatial resolution [1,2,3]. Traditional methods of temperature measuring are thermocouples, thermistors, and infrared cameras. They are not able to provide high spatial resolutions (rough estimation ~λ/2) and/or the required contactlessness. So, the development of new non-contact temperature sensors is mandatory in modern science and industry. In this case, the luminescence temperature sensing and/or mapping satisfies the above-mentioned requirements. In this method, the temperature determination can be performed by analyzing a temperature-dependent luminescence signal (in the majority of cases, these parameters are luminescence intensity, lifetime, and band shape) of the nano- or micro-sized phosphors which are in contact with the studied object. In its turn, working in the UV, visible and/or NIR spectral ranges allows obtaining submicrometer spatial resolution. Luminescent thermometry is highly required in medicine and biology [4,5] for thermography, for the clinical diagnosis of cancerous tumors [6], as well as for measuring the temperature of integrated circuits and micro devices in order to check their stability and proper functioning [1,2]. In this work, phosphors based on fluoride host doped with rare-earth ions are used. This class of materials has a high chemical stability, mechanical strength, sufficiently high melting point, relatively low probability of non-radiative processes [7], high quantum yield of luminescence [8], and low toxicity [9]. It should also be noted, that the modern methods of synthesis allows obtaining fluoride phosphors with desirable morphology and structure [10]. YF3 host was chosen because of the low energy of phonons (500 cm−1), and, consequently, the low probability of multi-phonon non-radiative relaxation. Nd3+ and Yb3+ doping ions were chosen because of the possibility of complex temperature-dependent energy exchange probabilities between the ions, which can provide high temperature sensitivity. Also, the excitation and emission wavelengths are situated in the near IR range (tissue transparency window), which is very important for biomedical applications [11]. Down-conversion optical temperature sensors based on Nd3+/Yb3+ ion pair were recently studied in works [12,13,14]. In these phosphors, the emission of Yb3+ is observed under the Nd3+ excitation revealing the energy transfer between Nd3+ and Yb3+. The luminescence intensity ratio (LIR) between Nd3+ emission (4F3/2–4I9/2 transition at ~866 nm) and Yb3+ emission (2F5/2–2F7/2 transition at ~980 nm) can be taken as a temperature-dependent parameter. The main mechanism of temperature sensitivity is related to the phonon-assisted nature of energy transfer between Nd3+ and Yb3+. In the literature, there are three main energy transfer processes between the above-mentioned ions that can be characterized by their probabilities: WET—probability of energy transfer from Nd3+ to Yb3+, WBET—probability of back energy transfer from Yb3+ to Nd3+, WDIFF—probability of energy diffusion between Yb3+ ions [15]. In the case of a low concentration of Nd3+ energy transfer from Nd3+ to Nd3+ is considered to be negligible. The probabilities of above-mentioned energy transfer processes are competitive and they are dependent on doping ion concentrations. In particular, WBET decreases with the increase of Yb3+ concentration. This phenomenon paves the way toward the manipulation of temperature sensitivity via Yb3+ concentration. Indeed, it was experimentally demonstrated in the works [12,14,16]. However, it seems, that the Nd3+/Yb3+ doped phosphors are studied for relatively high Yb3+ concentrations (>1 mol.%). Specifically, in our previous work it was shown, that the emission of the sample Nd3+ (0.5%), Yb3+ (0.5%):YF3 is negligible under Nd3+ excitation (355 nm, 4I9/2–4D3/2 absorption band of Nd3+) and this sample was not studied. On the other hand, it can be suggested, that the excitation conditions (mostly excitation wavelength) could affect the relative emission intensities of both Nd3+ and Yb3+ and the intense Yb3+ emission can be observed for the samples, containing 1.0 mol.% of Yb3+ and even less. Indeed, the Nd3+/Yb3+-based optical sensor with lower Yb3+ concentrations (<1.0 mol.%) can demonstrate higher Sr and Sa. One of the highest Sr values obtained for Nd3+ (0.5%), Yb3+ (8.0%):YF3 (~0.6%/K at 144 K) [12], Nd3+ (0.5%), Yb3+ (5.0%):LiLaP4O12 (~0.3%/K at 300 K) [15]. The double-doped inorganic nano- or microparticles are capable of demonstrating higher performances compared to their single-doped counterparts in the relatively broad temperature range of 10–400 K. Specifically, Pr3+, Yb3+:LaF3 down-conversion nanoparticles demonstrate one of the highest sensitivities (Sr ~ 6.0%·K−1 at 10 K) in the cryogenic temperature range [17]. The high temperature sensitivity is attributed to the convenient phonon-assisted energy transfer as well as quantum cutting phenomenon. In its turn, Nd3+, Yb3+:YPO3 and Nd3+, Yb3+:LaPO3 phosphors are capable of reaching 1.2 and 1.0%·K−1, respectively at 300 K [18]. Here, the high temperature sensitivity is explained by the fact, that the efficiency of Yb3+ back energy transfer to Nd3+ increases with the increase of temperature that leads to the faster change of spectral-kinetic characteristics with temperature. In the case of Tm3+, Yb3+:LiYF4 down-conversion phosphors, they demonstrate maximum temperature sensitivities around 1.2%·K−1 at 300 K. The high performance is explained by phonon-assisted energy transfer from 3H4 (Tm3+) to 2F5/2 (Yb3+). Note, that Tm3+, Yb3+ system has one of the biggest energy gap between interacting 3H4 (Tm3+) and 2F5/2 (Yb3+) levels around 2000 cm−1.
The objective of this work was to study physical background of functioning of the Nd3+, Yb3+:YF3 luminescent temperature sensors having different concentrations of doping ions. The tasks of the work were to investigate of the spectral-kinetic characteristics of Nd3+ and to calculate of the main characteristics of temperature sensors. In particular, the temperature evolution of luminescence spectra will be studied. The luminescence intensity ratio (LIR) of Nd3+ and Yb3+ emissions at different temperatures will allow concluding about energy exchange processes between Nd3+ and Yb3+ ions. The temperature evolution of luminescence decay curves of single-doped Nd3+:YF3 and double-doped Nd3+, Yb3+:YF3 will also allow concluding about energy exchange processes between the ions as well as concluding about the contribution of other temperature-dependent processes related, for example, to the thermal expansion of crystal lattice.
We guess that the main novelty of the work is that the work deals with physical background of temperature sensitivity of spectral-kinetic characteristics of the studied Nd3+, Yb3+:YF3 phosphors. However, most recent articles do not take into consideration the thermal expansion phenomenon. In the present paper, we make a hypothesis of temperature sensitivity based on conventional knowledge about phonon-assisted nature of energy transfer between Nd3+ and Yb3+ as well as on thermal expansion by demonstrating the lattice parameters change with the temperature.
2. Materials and Methods
Nd3+ (0.1 or 0.5 mol.%), Yb3+ (X%):YF3 (X = 0.5 and 1.0, 2.0, and 3.0 mol.%) nanoparticles were synthesized via a co-precipitation method with subsequent hydrothermal treatment (180 °C for 30 h) and annealing in vacuum at 500 °C for 5 h. The hydrothermal treatment is used to exclude different ammonium salts and form a pure single-phase YF3 doped sample. The annealing procedure improves crystallinity. For Nd3+ (0.5%), Yb3+ (8.0%):YF3 3.5045 g of Y(NO3)3·6H2O, 0.0219 g of Nd(NO3)3·6H2O, 0.3737 g of Yb(NO3)3·6H2O, were dissolved in 80 mL of distilled water. Then the solution pH was adjusted to 2 with nitric acid. Thereafter, a water solution of NH4F (1.4815 g of NH4F was dissolved in 10 mL of distilled water) was added dropwise to the mixture while stirring on a magnetic stirrer (400 rpm). In the next step, the solution was treated by hydrothermal synthesis at 180 °C for 30 h. The precipitate was purified with distillated water by centrifugation. The resulting nanoparticles were dried in air at room temperature in a dustproof box. Then the phosphors were annealed in a vacuum at 500 °C for 5 h. The doping ion concentrations are represented in molar percentage (mol.%).
Morphology and size of the samples were studied via transmission electron microscope Hitachi HT7700 Exalens. Sample preparation: 10 microliters of the suspension were placed on a formvar/carbon lacey 3 mm copper grid; drying was performed at room temperature. After drying, the grid was placed on a transmission electron microscope using a special holder for microanalysis. The analysis was held at an accelerating voltage of 100 kV in TEM mode. We built a particle size distribution histogram via commonly used “Image J” software. Since the shape of the particles is not perfectly regular, we calculated the area (squire nanometers) of each particle via 2D TEM image taking into consideration the scale bar. Then we equaled the value of the area to π·D2/4 (the area of a circle) and extracted the D values. The statistics are based on the analysis of 100 particles. This method is useful in order to estimate the average size of non-spherical particles. The size distribution histogram was plotted in OriginPro 9.0 software. The size distribution histogram was fitted by LogNormal peak function from OriginPro 9.0 database that is commonly used for particle size analysis.
The phase composition of the particles was studied by means of X-ray diffraction method (XRD) using Bruker D8 ADVANCE X-ray diffractometer (Cu Kα radiation, λ = 0.154 nm) having Anton-Paar TTK 450 cooling chamber. We used liquid nitrogen as a cooling agent. The lattice parameter values were calculated in MAUD software (Material Analysis Using Diffraction). The luminescence spectra were recorded via a CCD spectrometer (StellarNet) (0.5 nm spectral resolution). The optical excitation of was performed via IR LD (λex = 790 nm, to 4I9/2–4F5/2, Nd3+ absorption band). The radiation was modulated by rectangular pulses with a period T = 30 ms and pulse duration τ = 5 ms. The experiments were performed in the 80–320 K temperature range via so-called “cold finger” method. The temperature control was carried out via thermostatic cooler “CRYO industries” having LakeShore Model 325 (Westerville, OH, USA) temperature controller. The luminescence decay time curves were recorded via BORDO 211A digital oscillograph (10 bit and 200 MHz bandwidth), MDR-3 monochromator, and photomultiplier PEM-62 (working spectral range ~600–1200 nm). The power density of excitation irradiation was measured with PULSAR-2 powermeter using StarLab software. All the calculations were carried out via Origin.Pro.9.0 software.
In the optical experiments, it is important to avoid the heating of the sample. For this aims, the optimized power density of the excitation irradiation should be chosen. Here, this choice was based on the fact that the shape of the Nd3+ peak (850–910 nm, 4F3/2–4I9/2 transition) in fluoride hosts (YF3 [13], LaF3 [19], NaYF4 [20]) is temperature-dependent. Hence, before each experiment, we recorded the Nd3+ peak (~845–925 nm) for several values of the laser irradiation power density. The luminescence spectra recorded at different values of power density are represented in (Supplementary Information Figure S1). The chosen power density was ~1300 W/m2. It should be noted, that due to the use of pulse laser irradiation, the values of the power density are averaged.
3. Results and Discussion
3.1. Characterization of Nd3+, Yb3+:YF3 Phosphors
A transmission electron microscopy (TEM) image of the Nd3+ (0.1%):YF3 particles and a size distribution histogram are represented in Figure 1a,b, respectively.
According to the TEM image, the particles have relatively irregular shape reminding of the rhombus. The size distribution histogram is not perfectly fitted by any peak function, probably, due to the non-spherical shape of the particles. The LogNormal fitting determined 231 ± 8 nm average diameter. The width of the size distribution histogram is around 130 nm. We also calculated the common average diameter of the particles (sum of sizes divided by the number of particles) that was equal to 201 nm. Anyway, the size of the particle is larger than 30 nm, hence, the influence of surface can be neglected [21]. Indeed, according to this work, the main unique difference between nanosized crystals and bulk ones is than the number of ions (here Re3+ and F−) located on the surface of the nanoparticles and the number of ions located in the nanoparticle volume are comparable. The rare-earth ions located on the nanoparticle’s surface have different ligand surrounding compared to rare-earth ion inside the volume. The different surrounding leads to different spectral-kinetic properties. However, according to this work, for rare-earth trifluorides, for nanoparticles larger than 15 nm, the surface ions do not make a serious contribution in the spectral-kinetic properties in opposite to volume ions and nanoparticles are more similar to bulk crystals in term of spectral-kinetic properties. The phase composition of the YF3 doped particles was confirmed via XRD. In particular, XRD pattern of Nd3+ (0.1%):YF3 sample detected for 100, 200, and 300 K and YF3 simulation are represented in Figure 2a,b, respectively. The XRD patterns agree with both the simulation and the reference pattern from the Inorganic Crystal Diffractions Database of orthorhombic YF3 (Pnma space group (no. 074–0911)).
It can also be seen, that some XRD peaks shift toward higher angels with the temperature decrease that can be related to the lattice parameters decrease. Indeed, the calculated a constant values were 6.1300(2), 6.2109(3), and 6.3412(1) for 100, 200, and 300 K, respectively. The common shift of the nanoparticle XRD and the simulation of YF3 XRD can be related to the presence of doping ions and captured water during the water-based synthesis procedure. It can be seen, that the lattice parameter change is in 0.1 nm/100K range. It can be suggested, that the distance between doping ions changes in the same range. Since, the nature of interaction between the doping ions is dipole-dipole, its efficiency is inversely proportional to r6, where r is the distance between interacting ions. It can be suggested, that such relatively small change in distances between the ions can affect the efficiency of interaction between them. For further development of this hypothesis we carried out spectral-kinetic characterization of both single-doped and double-doped samples.
An energy level diagram of the Nd3+/Yb3+ ion pair is represented in Figure 3. The excitation wavelength λex = 790 nm corresponds to 4I9/2–4F5/2 absorption band of Nd3+.
As it was mentioned above, there are three main energy transfer processes between the doping ions that can be characterized by their probabilities: WET—probability of energy transfer from Nd3+ to Yb3+, WBET—probability of back energy transfer from Yb3+ to Nd3+, WDIFF—probability of energy diffusion between Yb3+ ions [15,18]. The energy transfer processes for Nd3+→Yb3+ and for Yb3+→Nd3+ are accompanied by emission or absorption of phonons, respectively. It provides the temperature sensitivity of the spectral-kinetic properties of the studied samples. In turn, the Nd3+ ions interact between each other via cross-relaxation mechanism (4F3/2–4I15/2 and 4I9/2–4I15/2) that can also affect the temperature sensitivity.
3.2. Temperature Dependent Spectral-Kinetic Characterization of Single-Doped Nd3+:YF3 Nanoparticles and Microparticles
As we mentioned above, the cross-relaxation can also affect the temperature sensitivity. In order to exclude the cross-relaxation process, we synthesized a series of single-doped Nd3+:YF3 samples having 0.1, 0.5, and 1.0 mol.% concentrations. As we mentioned above, the interplanar distances decrease with the decrease of temperature according to the XRD. Since, the cross-relaxation process is not phonon-assisted, it can be suggested, that the efficiency of cross-relaxation increases with the temperature decrease due to the fact that the distance between Nd3+ ions also decreases. The luminescence decay time curves detected at 100, 200, and 300 K for single-doped Nd3+ (0.1 (a), 0.5 (b), and 1.0 (c) mol.%):YF3 nanoparticles are represented in Figure 4.
In can be seen, that for both Nd3+ (0.5 and 1.0 mol.%):YF3 samples, decay time decreases with the temperature decrease. The curves can be well described by a single-exponential function. In particular, for Nd3+ (1.0 mol.%):YF3 sample the decay times were 277, 328, and 358 μs at 100, 200, and 300 K, respectively. In its turn, for Nd3+ (0.5 mol.%):YF3 sample, the decay times were 370, 389, and 412 μs at 100, 200, and 300 K, respectively. The Nd3+ (0.1 mol.%):YF3 sample demonstrates ~472 μs decay time. The decrease of decay time with the increase of Nd3+ concentration can be explained by concentration quenching phenomenon.
It can be proposed, that at 0.5 mol.% the cross-relaxation between Nd3+ ions takes place in contradistinction from 0.1 mol.% Nd3+ concentration. The decrease of decay times with temperature can be explained by the decrease of distances between Nd3+ with temperature (thermal expansion phenomenon) that leads to the increase of cross-relaxation efficiency. It can be concluded, that for Nd3+ (0.1%):YF3 nanoparticles the excitation energy does not scatter between Nd3+ ions. Since, the (1.0 mol.%):YF3 showed the lowest signal-to-noise ratio, we chose 0.1 and 0.5% Nd3+ concentration in order to synthesize double doped Nd3+, Yb3+:YF3 and compare their performances.
3.3. Temperature Dependent Spectral-Kinetic Characterization of Double-Doped Nd3+, Yb3+:YF3 Nanoparticles
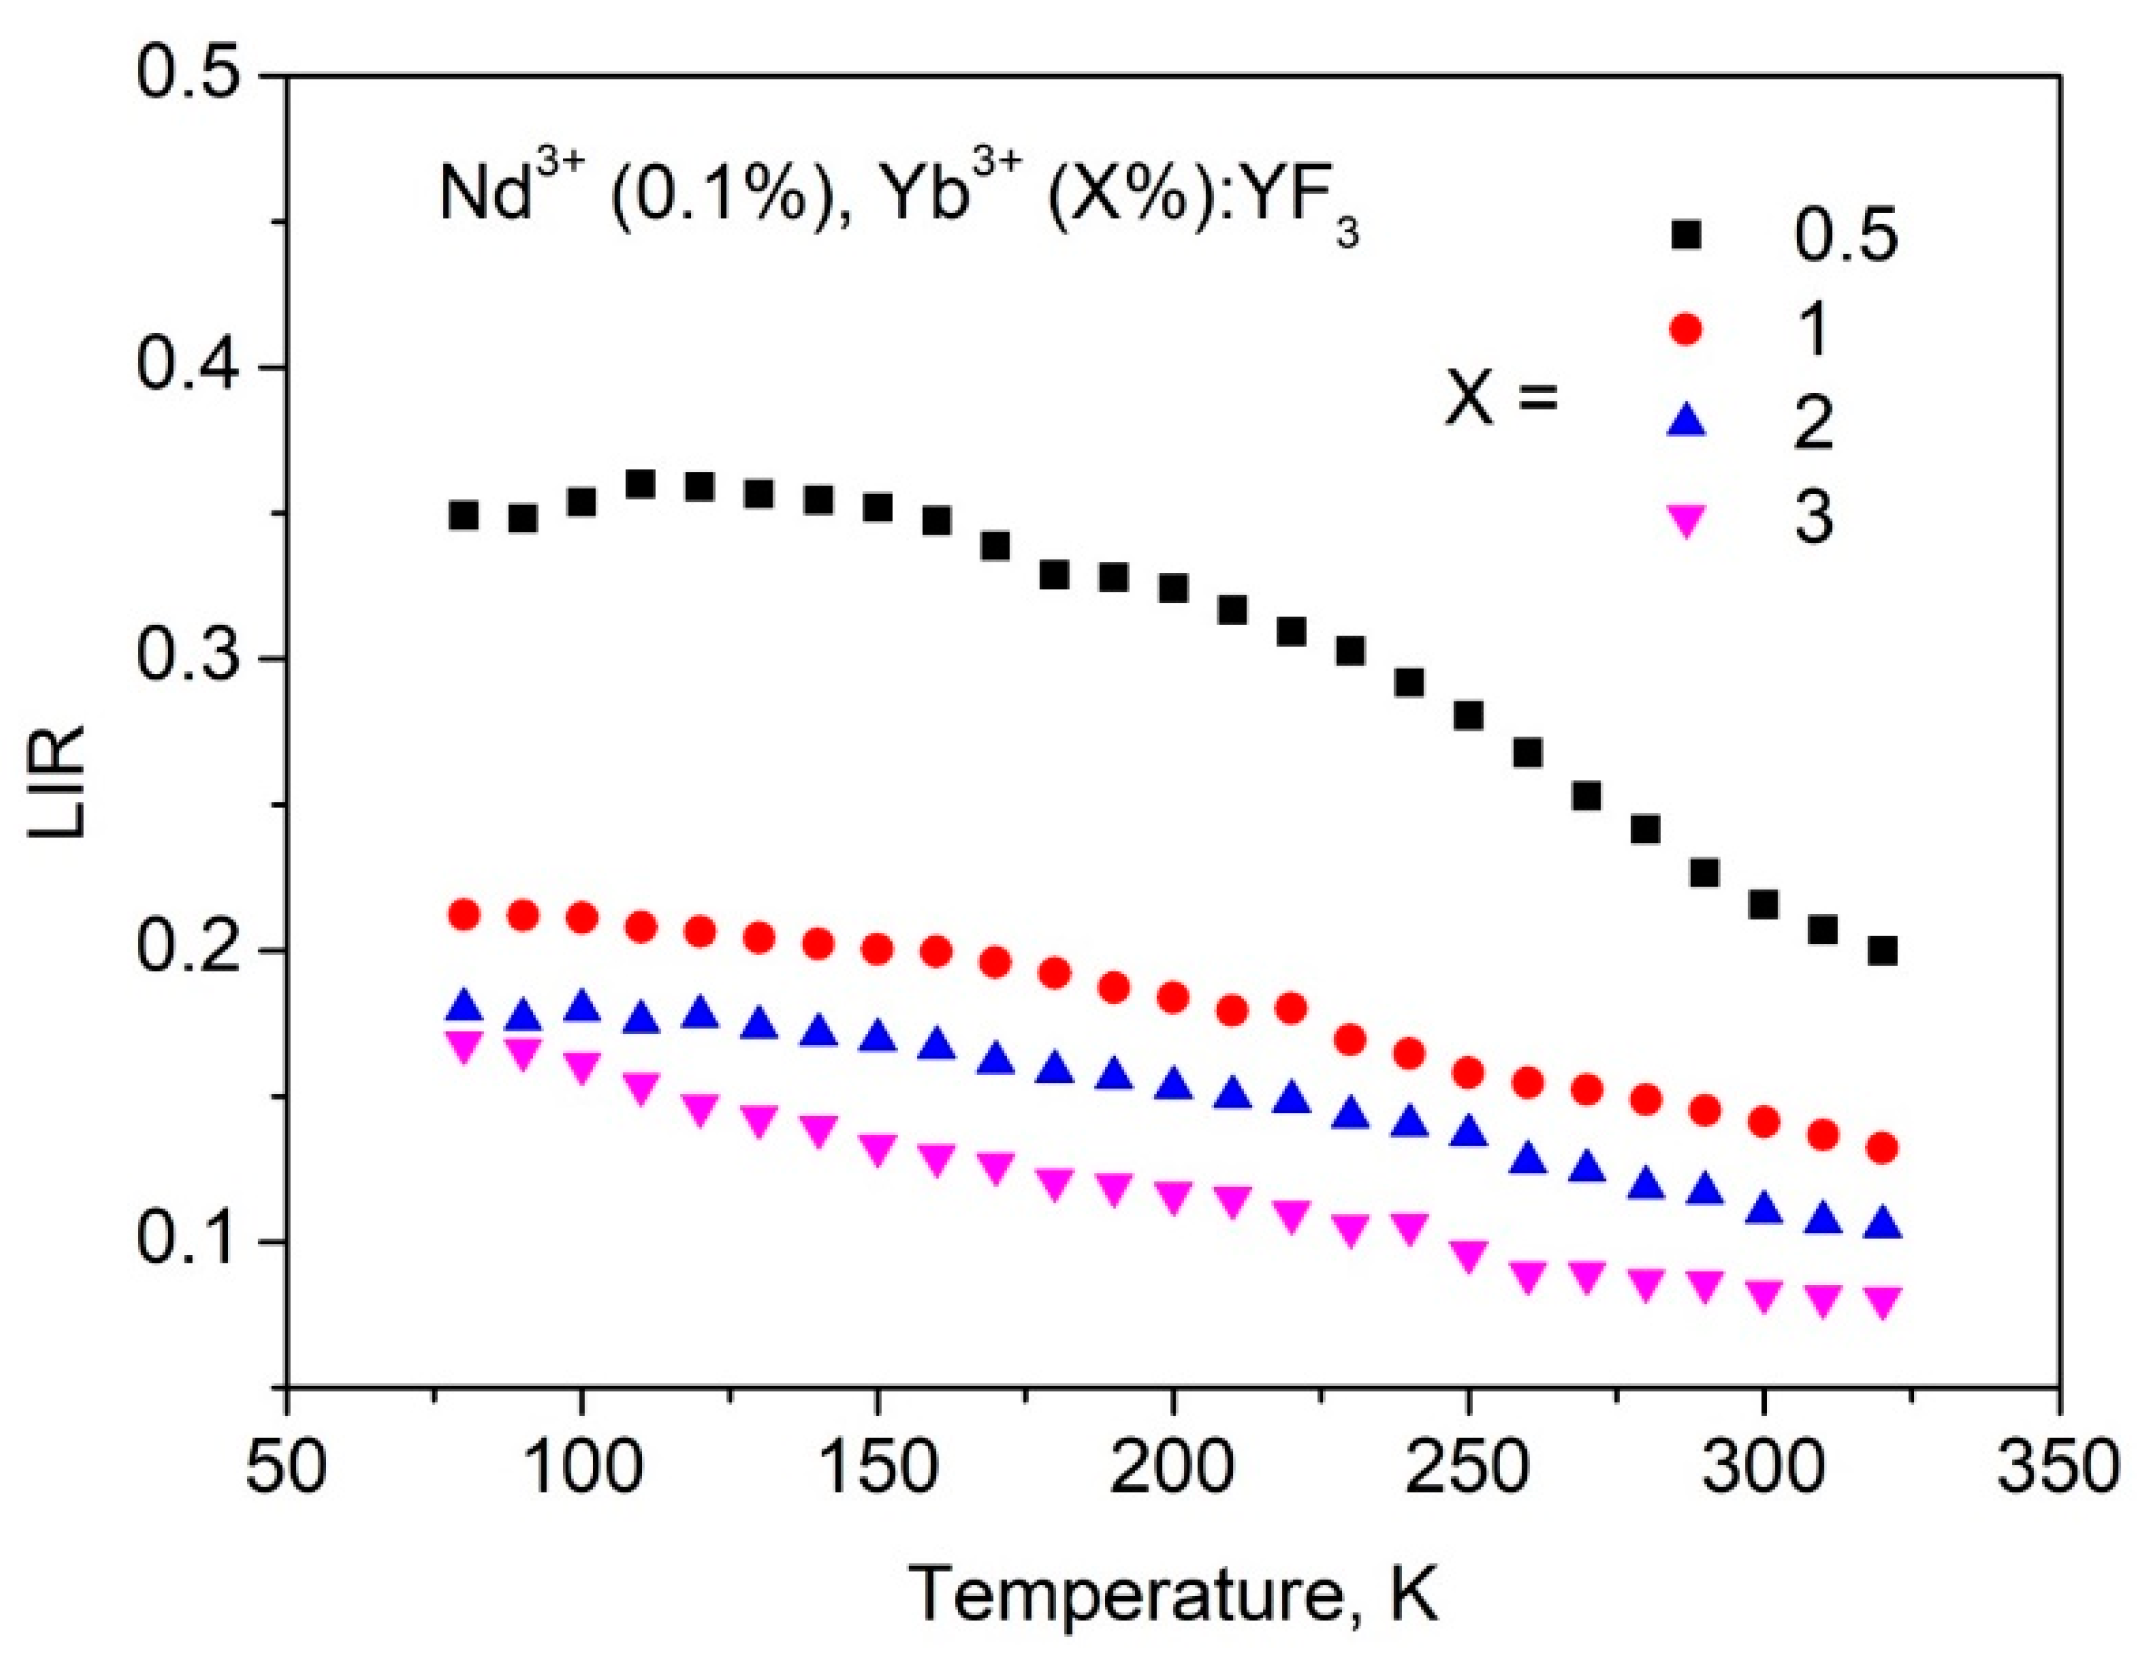
To obtain high temperature sensor performances including relative (Sr) temperature sensitivity, we synthesized a series of Nd3+ (0.1 mol.%), Yb3+ (0.5, 1.0, 2.0, and 3.0 mol.%):YF3 samples. The choice of Nd3+ concentration is based on above-mentioned conclusions, that the excitation energy is not scattered between Nd3+ ions at 0.1 mol.% concentration. In turn, in order to provide comparable intensities of both Nd3+ and Yb3+ emissions the Yb3+ concentration was varied in the 0.5–3.0 mol.% range. At higher Yb3+ concentrations, its emission intensity was much higher than Nd3+ emission that led to deterioration of the performances. Indeed, Nd3+ (0.1 mol.%), Yb3+ (4.0 mol.%):YF3 sample demonstrates almost negligible Nd3+ emission compared to Yb3+ one (Figure S2 of the Supplementary File). Normalized at 903 nm (Nd3+ emission peak) spectra of Nd3+ (0.1 mol.%), Yb3+ (1.0 mol.%):YF3 sample recorded in the 80–320 K temperature range are represented in Figure 5.
It can be seen, that the spectral shape is notably dependent on temperature. In particular, the Yb3+ intensity increases with temperature increase compared to Nd3+ emission. It can be explained by the fact that the efficiency of phonon-assisted energy transfer from Nd3+ (4F3/2) to Yb3+ (2F5/2) increases with the temperature increase. Luminescence intensity ratio (LIR) between 4F3/2–4I9/2 (Nd3+) and 2F5/2–2F7/2 (Yb3+) was taken as a temperature-dependent parameter. The LIR curves as functions of temperature are represented in Figure 6.
It can be seen, that all the luminescence intensity ratio (LIR) curves demonstrate decreasing behavior. It means, that Yb3+ intensity increases faster than Nd3+ one with the temperature increase. Such behavior of both intensities reflects the phonon-assisted nature of the energy transfer. Indeed, the efficiency of population of 2F5/2 (Yb3+) increases with the temperature increase as well as depopulation of 4F3/2 (Nd3+). The slight difference in LIR functions requires addition study, however, it can be suggested, that this difference related to back energy transfer from Yb3+ to Nd3+ that is different for different Yb3+ concentrations. Indeed, as we mentioned above, under Nd3+ excitation, the Yb3+ ions can obtain excitation energy. Further, there are at least three processes: Yb3+ emits the energy, it can transmit it back to Nd3+, and Yb3+ can transmit it to Yb3+ (energy diffusion). These processes are competitive. In particular, the energy diffusion probability between Yb3+ ions increases with the increase of Yb3+ concentration. It also decreases the probability of back energy transfer to Nd3+. For samples, having different concentrations of doping ions, the ratio between these probabilities is different that leads to difference in the shape of LIR curves. The estimation of contribution of the above-mentioned processes is one of the next steps of the present work. In order to calculate Sr, we used the equation:
The obtained Sr values are quite competitive compared to our previous work [12]. As we mentioned above, for 0.5 and 1.0 mol.% single-doped Nd3+:YF3 the luminescence decay time of 4F3/2 (Nd3+) deceases with the temperature decrease in contrast to Nd3+ (0.1%):YF3 sample. It was suggested, that depopulation of 4F3/2 level occurs via cross-relaxation. At lower temperatures the distance between Nd3+ ions decreases due to thermal expansion and the efficiency of quenching by cross-relaxation increases. In the case of 0.1 mol.% Nd3+ concentration, the distance between neighboring Nd3+ ions seems to be larger and the interaction between Nd3+ ions does not occur. In terms of luminescence thermometry, the higher concentration (0.5 and 1.0 mol.%) of Nd3+ for Nd3+/Yb3+ ion pair seems to be more attractive. Indeed, the depopulation of 4F3/2 level happens via both cross-relaxation between Nd3+ ions and phonon-assisted energy transfer between Nd3+ and Yb3+. It provides faster change of Nd3+ emission intensity or decay time with temperature compared to Nd3+/Yb3+ doped samples, having 0.1 mol.% concentration of Nd3+. This faster change of Nd3+ luminescence parameters can increase temperature sensitivity of Nd3+, Yb3+:YF3 samples. To verify this suggestion, we synthesized Nd3+ (0.5 mol.%), Yb3+ (0.5 and 1.0, mol.%):YF3 nanoparticles via the same chemical method. However, in this system, further increase of Yb3+ content (higher than 1.0 mol.%) led to a significant increase of Yb3+ emission intensity and simultaneous decrease of Nd3+ one. This feature led to notable errors in LIR calculation. In turn, Nd3+ (1.0 mol.%):YF3 showed notably low luminescence intensity due to concentration quenching (it also can be seen from luminescence decay time curves). Thus, we calculated Sr for two Nd3+ (0.5 mol.%), Yb3+ (0.5 and 1.0, mol.%):YF3 samples (Figure 8).
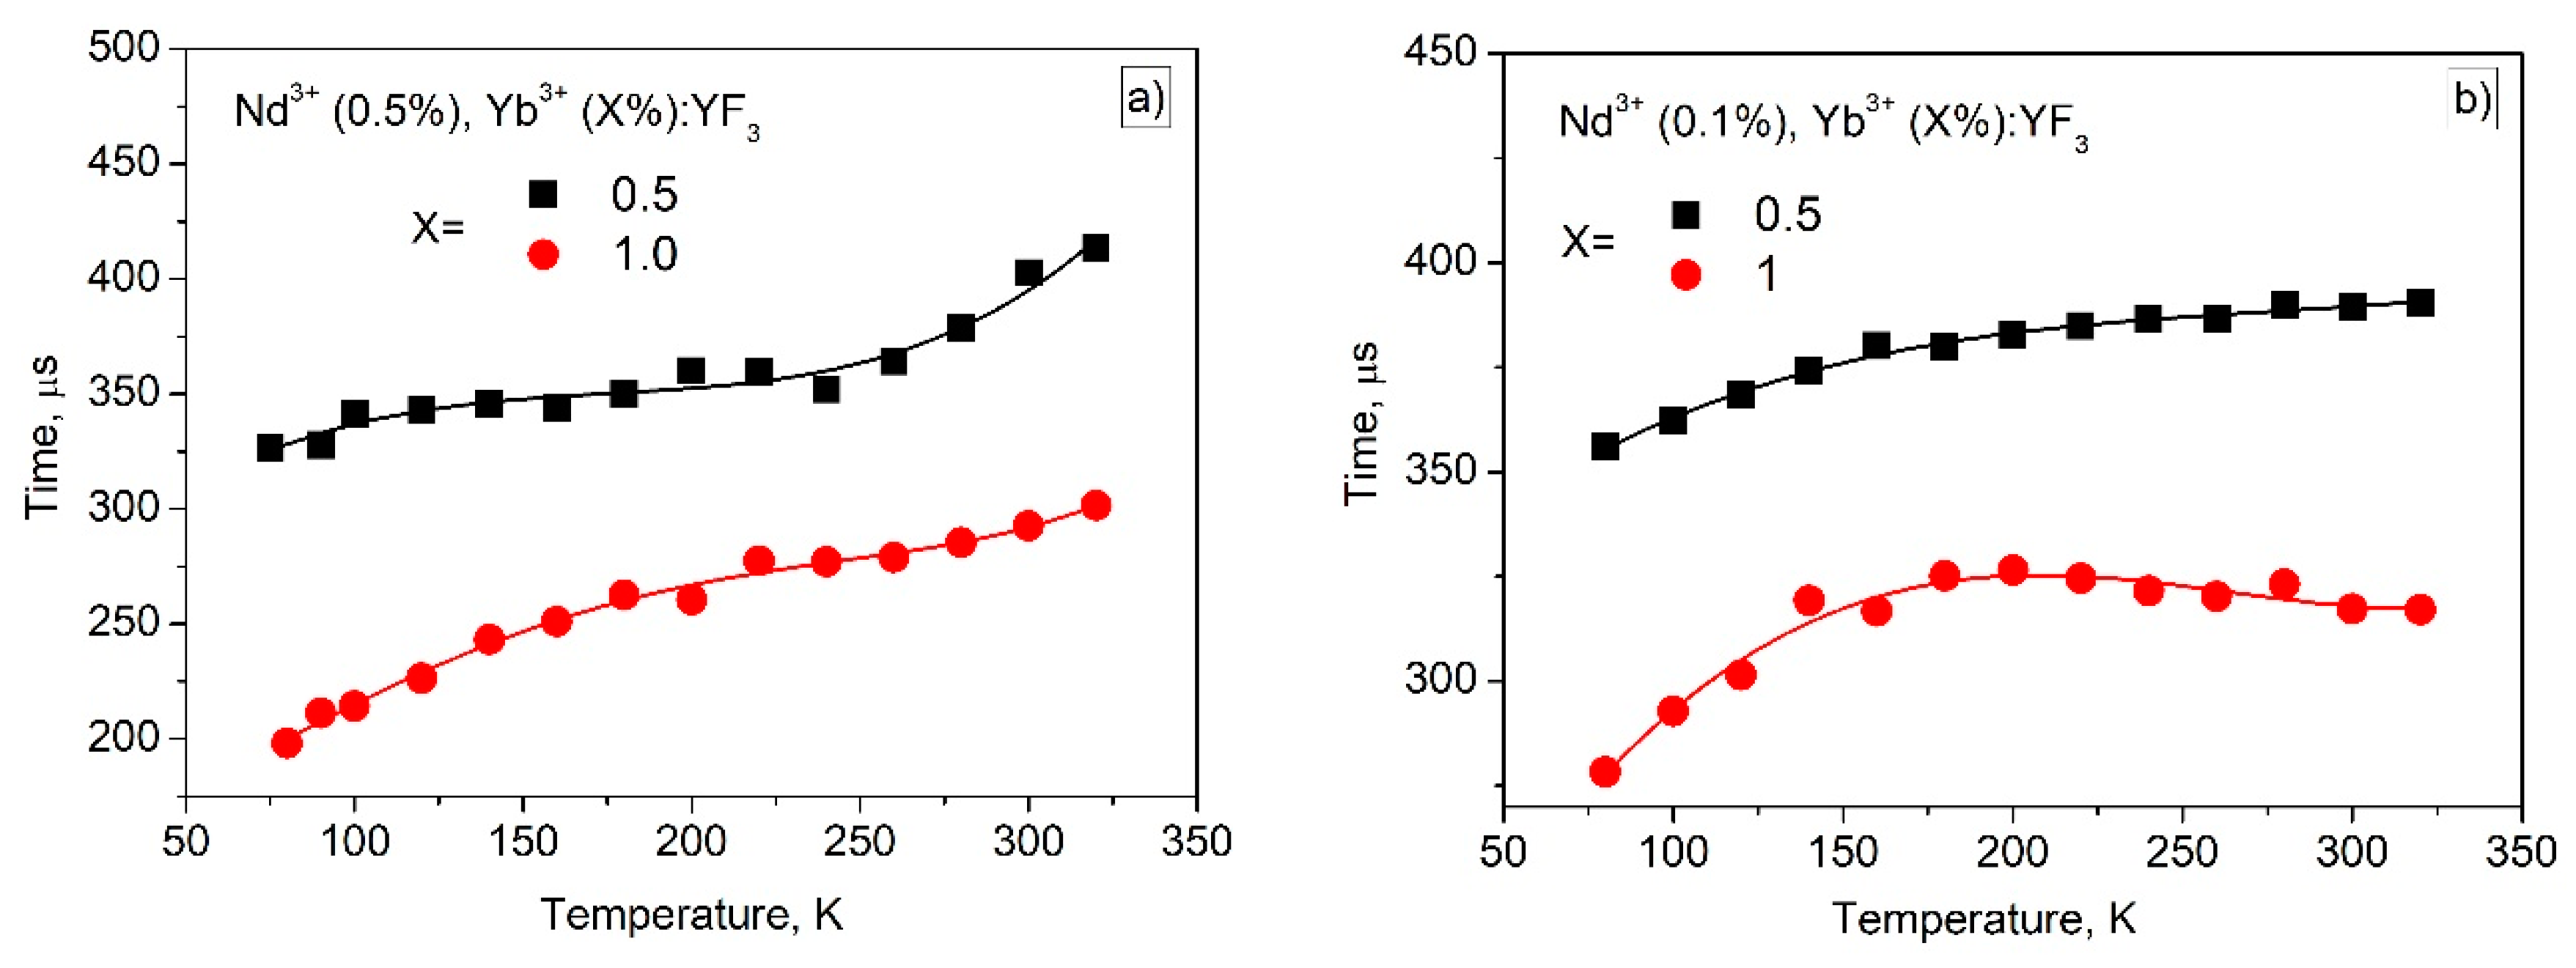
It can be seen, that the obtained Sr values are higher compared to the Sr values calculated for Nd3+ (0.1 mol.%), Yb3+ (X mol.%):YF3 samples at lower temperatures. Probably, the additional temperature-dependent depopulation of 4F3/2 level via cross-relaxation plays a crucial role in its temperature sensitivity in 80–150 K range. As it was mentioned above, the shape of the LIR curves is affected by the difficult competitive energy exchange processes between the doping ions. Since, the sensitivity curves are obtained from the LIR curves, their shapes differ between each other as well. Note, that the presence of the singular points is related to the fact, that we use absolute values (modulus) of the sensitivity curves (Equation (1)). Hence in the area of the singular point without modulus, the Sr curve “goes” from positive part of XY plot to negative one or inversely. It can be seen, that the obtained Sr values are in the 0.1–0.4%·K−1 in the physiological temperature range. These results are comparable to one of the main competitor Nd3+, Yb3+:LiLaP4O12 (0.1–0.3%·K−1) [15]. In the case of Tm3+/Yb3+ down-conversion system operating in the biological window, the obtained Sr values also exceed the results obtained in [22]. It also should be noted, that the maximum Sr values are observed in the 80–150 K range. It can be concluded, that the synthesized phosphors are useful in cryogenic technique as well as in the space industry. The characterization of the present nanoparticles at lower temperatures is one of the next steps of the present study. Effective luminescence decay times τeff (4F3/2–4I9/2 transition, 866 nm emission) as functions of temperature for Nd3+ (0.5 mol.%), Yb3+ (X mol.%):YF3 and Nd3+ (0.1 mol.%), Yb3+ (X mol.%):YF3 are represented in Figure 9a,b, respectively.
It can be seen, that the temperature dependence of τeff of Nd3+ (0.5 mol.%), Yb3+ (X mol.%):YF3 is more pronounced compared to Nd3+ (0.1 mol.%), Yb3+ (X mol.%):YF3 sample. Indeed, for 0.5% Nd3+ sample τeff changes in the ~100 μs time frame in opposite to 0.1% Nd3+ (~50 μs). It, also, can be related to the fact, that for 0.5 mol.% Nd3+ depopulation of 4F3/2 level occurs via cross-relaxation and phonon-assisted energy transfer in contrast to 0.1 mol.% Nd3+. Finally, it can be concluded, that the Nd3+ (0.5 mol.%), Yb3+ (X mol.%):YF3 samples are more effective for both ratiometric and lifetime temperature sensing especially in the 80–150 K range.
4. Conclusions
This work was devoted to the study of thermometric performances of Nd3+ (0.1 or 0.5 mol.%), Yb3+ (X%):YF3 nanoparticles. Firstly, the nanoparticles were characterized via well-known physical methods. Particularly, according to the TEM image, the nanoparticles demonstrate 231 ± 8 nm average diameter. The obtained XRD patterns agree with both the simulation and the reference pattern from the Inorganic Crystal Diffraction Database of orthorhombic YF3 (Pnma space group (no. 074–0911)). Temperature sensitivity of spectral shape is related to the phonon-assisted nature of energy transfer (PAET) between Nd3+ and Yb3+. However, in the case of single-doped Nd3+ (0.1 or 0.5 mol.%):YF3 nanoparticles, luminescence decay time (LDT) of 4F3/2 level of Nd3+ in Nd3+ (0.5 mol.%):YF3 decreases with the temperature decrease. In turn, luminescence decay time in Nd3+ (0.1 mol.%):YF3 sample remains constant. It was proposed, that at 0.5 mol.% the cross-relaxation (CR) between Nd3+ ions takes place in contradistinction from 0.1 mol.% Nd3+ concentration. The decrease of LDT with temperature is explained by the decrease of distances between Nd3+ with temperature (thermal expansion phenomenon) that leads to the increase of cross-relaxation efficiency. It was suggested, that the presence of both CR and PAET processes in the studied (Nd3+ (0.5 mol.%), Yb3+ (X%):YF3) nanoparticles provides higher temperature sensitivity compared to the systems having one temperature-dependent process (Nd3+ (0.1, 0.5 mol.%), Yb3+ (X%):YF3). The experimental results confirmed this suggestion. The maximal relative temperature sensitivity was 0.9%·K−1 at 80 K.
Supplementary Materials
The following supporting information can be downloaded at: https://www.mdpi.com/article/10.3390/ma16010039/s1, Figure S1: The luminescence spectra recorded at different values of power density of the laser irradiation; Figure S2: Room temperature luminescence spectrum of Nd3+ (0.1%), Yb3+ (3.0%):YF3.
Author Contributions
Conceptualization, M.P.; methodology, M.P., E.O., A.K. and M.C.; formal analysis, M.G.; investigation, M.P., E.O., A.K., M.C. and M.G.; resources, M.P. and M.G.; data curation, M.P. and E.O.; writing—original draft preparation, M.P.; project administration, M.P. and M.G.; funding acquisition, M.P. All authors have read and agreed to the published version of the manuscript.
Funding
This research was funded by the subsidy allocated to Kazan Federal University for the state assignment in the sphere of scientific activities (project number FZSM-2022-0021).
Institutional Review Board Statement
Not applicable.
Informed Consent Statement
Not applicable.
Data Availability Statement
Not applicable.
Conflicts of Interest
The authors declare no conflict of interest.
References
- Jaque, D.; Vetrone, F. Luminescence nanothermometry. Nanoscale 2012, 4, 4301–4326. [Google Scholar] [CrossRef] [PubMed]
- Brites, C.D.; Lima, P.P.; Silva, N.J.; Millán, A.; Amaral, V.S.; Palacio, F.; Carlos, L.D. Thermometry at the nanoscale. Nanoscale 2012, 4, 4799–4829. [Google Scholar] [CrossRef] [PubMed] [Green Version]
- Wang, X.D.; Wolfbeis, O.S.; Meier, R.J. Luminescent probes and sensors for temperature. Chem. Soc. Rev. 2013, 42, 7834–7869. [Google Scholar] [CrossRef] [PubMed]
- Hossain, M.K.; Ahmed, M.H.; Khan, M.I.; Miah, M.S.; Hossain, S. Recent Progress of Rare Earth Oxides for Sensor, Detector, and Electronic Device Applications: A Review. ACS Appl. Electron. Mater. 2021, 3, 4255–4283. [Google Scholar] [CrossRef]
- Hossain, M.K.; Hossain, S.; Ahmed, M.H.; Khan, M.I.; Haque, N.; Raihan, G.A. A Review on Optical Applications, Prospects, and Challenges of Rare-Earth Oxides. ACS Appl. Electron. Mater. 2021, 3, 3715–3746. [Google Scholar] [CrossRef]
- Piñol, R.; Brites, C.D.; Silva, N.J.; Carlos, L.D.; Millán, A. Nanoscale thermometry for hyperthermia applications. In Nanomaterials for Magnetic and Optical Hyperthermia Applications; Elsevier: Amsterdam, The Netherlands, 2019; pp. 139–172. [Google Scholar]
- Bazhukova, I.N.; Pustovarov, V.A.; Myshkina, A.V.; Ulitko, M.V. Luminescent Nanomaterials Doped with Rare Earth Ions and Prospects for Their Biomedical Applications (A Review). Opt. Spectrosc. 2020, 128, 2050–2068. [Google Scholar] [CrossRef]
- Fedorov, P.P.; Luginina, A.A.; Kuznetsov, S.V.; Osiko, V.V. Nanofluorides. J. Fluor. Chem. 2011, 132, 1012–1039. [Google Scholar] [CrossRef]
- Pudovkin, M.S.; Zelenikhin, P.V.; Shtyreva, V.V.; Evtugyn, V.G.; Salnikov, V.V.; Nizamutdinov, A.S.; Semashko, V.V. Cellular uptake and cytotoxicity of unmodified Pr3+: LaF3 nanoparticles. J. Nanopart. Res. 2019, 21, 184. [Google Scholar] [CrossRef]
- Wang, X.; Li, Y. Rare-earth-compound nanowires, nanotubes, and fullerene-like nanoparticles: Synthesis, characterization, and properties. Chem.-A Eur. J. 2003, 9, 5627–5635. [Google Scholar] [CrossRef]
- Ximendes, E.C.; Rocha, U.; Kumar, K.U.; Jacinto, C.; Jaque, D. LaF3 core/shell nanoparticles for subcutaneous heating and thermal sensing in the second biological-window. Appl. Phys. Lett. 2016, 108, 253103. [Google Scholar] [CrossRef]
- Pudovkin, M.S.; Ginkel, A.K.; Lukinova, E.V. Temperature sensitivity of Nd3+, Yb3+: YF3 ratiometric luminescent thermometers at different Yb3+ concentration. Opt. Mater. 2021, 119, 111328. [Google Scholar] [CrossRef]
- Aarts, L.; Ende, B.V.D.; Reid, M.F.; Meijerink, A. Downconversion for solar cells in YF3: Pr3+, Yb3+. Spectrosc. Lett. 2010, 43, 373–381. [Google Scholar] [CrossRef]
- Marciniak, L.; Bednarkiewicz, A.; Trejgis, K.; Maciejewska, K.; Elzbieciak, K.; Ledwa, K. Enhancing the sensitivity of a Nd3+, Yb3+: YVO4 nanocrystalline luminescent thermometer by host sensitization. Phys. Chem. Chem. Phys. 2019, 21, 10532–10539. [Google Scholar] [CrossRef] [PubMed]
- Bednarkiewicz, A.; Stefanski, M.; Tomala, R.; Hreniak, D.; Strek, W. Near infrared absorbing near infrared emitting highly-sensitive luminescent nanothermometer based on Nd3+ to Yb3+ energy transfer. Phys. Chem. Chem. Phys. 2015, 17, 24315–24321. [Google Scholar]
- Pudovkin, M.S.; Ginkel, A.K.; Morozov, O.A.; Kiiamov, A.G.; Kuznetsov, M.D. Highly-sensitive lifetime optical thermometers based on Nd3+, Yb3+: YF3 phosphors. J. Lumin. 2022, 249, 119037. [Google Scholar] [CrossRef]
- Kaczmarek, A.M.; Kaczmarek, M.K.; Van Deun, R. Er3+-to-Yb3+ and Pr3+-to-Yb3+ energy transfer for highly efficient near-infrared cryogenic optical temperature sensing. Nanoscale 2019, 11, 833–837. [Google Scholar] [CrossRef]
- Maciejewska, K.; Bednarkiewicz, A.; Marciniak, L. NIR luminescence lifetime nanothermometry based on phonon assisted Yb 3+–Nd 3+ energy transfer. Nanoscale Adv. 2021, 3, 4918–4925. [Google Scholar] [CrossRef]
- Rocha, U.; Upendra Kumar, K.; Jacinto, C.; Ramiro, J.; Caamano, A.J.; Garcia Sole, J.; Jaque, D. Nd3+ doped LaF3 nanoparticles as self-monitored photo-thermal agents. Appl. Phys. Lett. 2014, 104, 053703. [Google Scholar] [CrossRef] [Green Version]
- Wang, X.; Xu, T.; Cai, P.; Vu, T.; Seo, H.J. Controlled synthesis, multicolor luminescence, and optical thermometer of bifunctional NaYbF4: Nd3+@ NaYF4: Yb3+ active-core/active-shell colloidal nanoparticles. J. Alloys Compound. 2017, 691, 530–536. [Google Scholar] [CrossRef]
- Vanetsev, A.; Kaldvee, K.; Puust, L.; Keevend, K.; Nefedova, A.; Fedorenko, S.; Orlovskii, Y. Relation of Crystallinity and Fluorescent Properties of LaF3: Nd3+ Nanoparticles Synthesized with Different Water-Based Techniques. Chem. Select 2017, 2, 4874–4881. [Google Scholar] [CrossRef]
- Khadiev, A.R.; Korableva, S.L.; Ginkel, A.K.; Morozov, O.A.; Nizamutdinov, A.S.; Semashko, V.V.; Pudovkin, M.S. Down-conversion based Tm3+: LiY1-XYbXF4 temperature sensors. Opt. Mater. 2022, 134, 113118. [Google Scholar] [CrossRef]
Figure 1.
TEM image of Nd3+:YF3 particles (a). Size distribution histogram of Nd3+:YF3 particles (b) (fitting function is LogNormal from OriginPro.9.0. database).
Figure 1.
TEM image of Nd3+:YF3 particles (a). Size distribution histogram of Nd3+:YF3 particles (b) (fitting function is LogNormal from OriginPro.9.0. database).
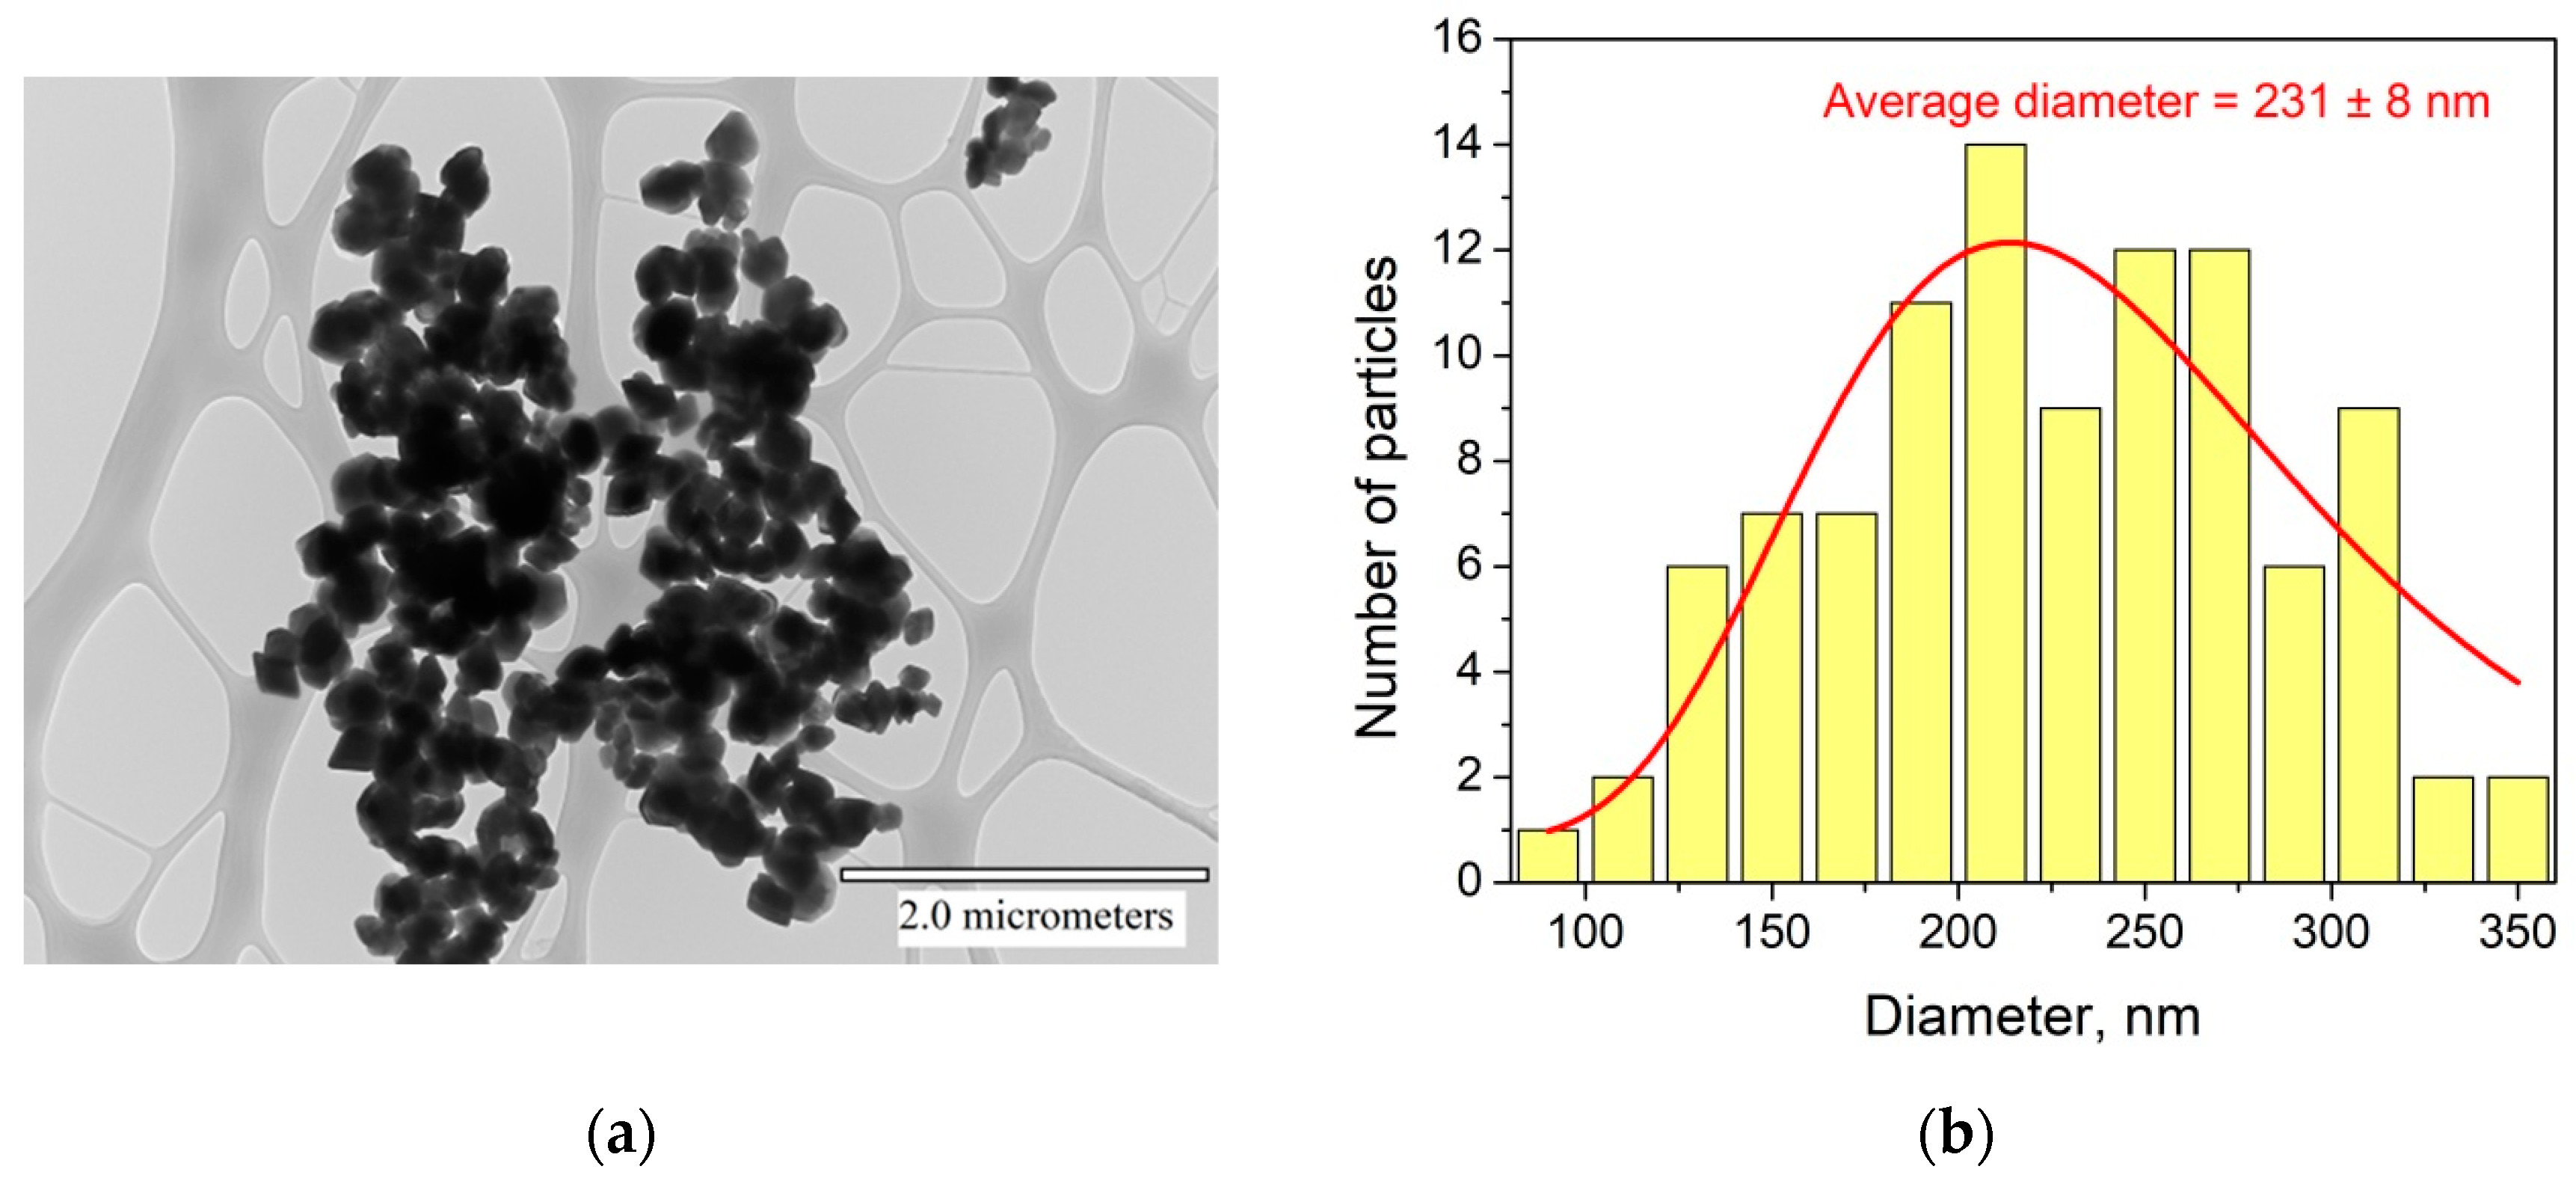
Figure 2.
Experimental XRD patterns (a) of Nd3+ (0.5%), Yb3+ (1.0%):YF3 sample and XRD simulation of YF3 (b).
Figure 2.
Experimental XRD patterns (a) of Nd3+ (0.5%), Yb3+ (1.0%):YF3 sample and XRD simulation of YF3 (b).

Figure 3.
An energy level diagram of the Nd3+/Yb3+ ion pair. Here WET—probability of energy transfer from Nd3+ to Yb3+, WBET—probability of back energy transfer from Yb3+ to Nd3+, WDIFF—probability of energy diffusion between Yb3+ ions.
Figure 3.
An energy level diagram of the Nd3+/Yb3+ ion pair. Here WET—probability of energy transfer from Nd3+ to Yb3+, WBET—probability of back energy transfer from Yb3+ to Nd3+, WDIFF—probability of energy diffusion between Yb3+ ions.
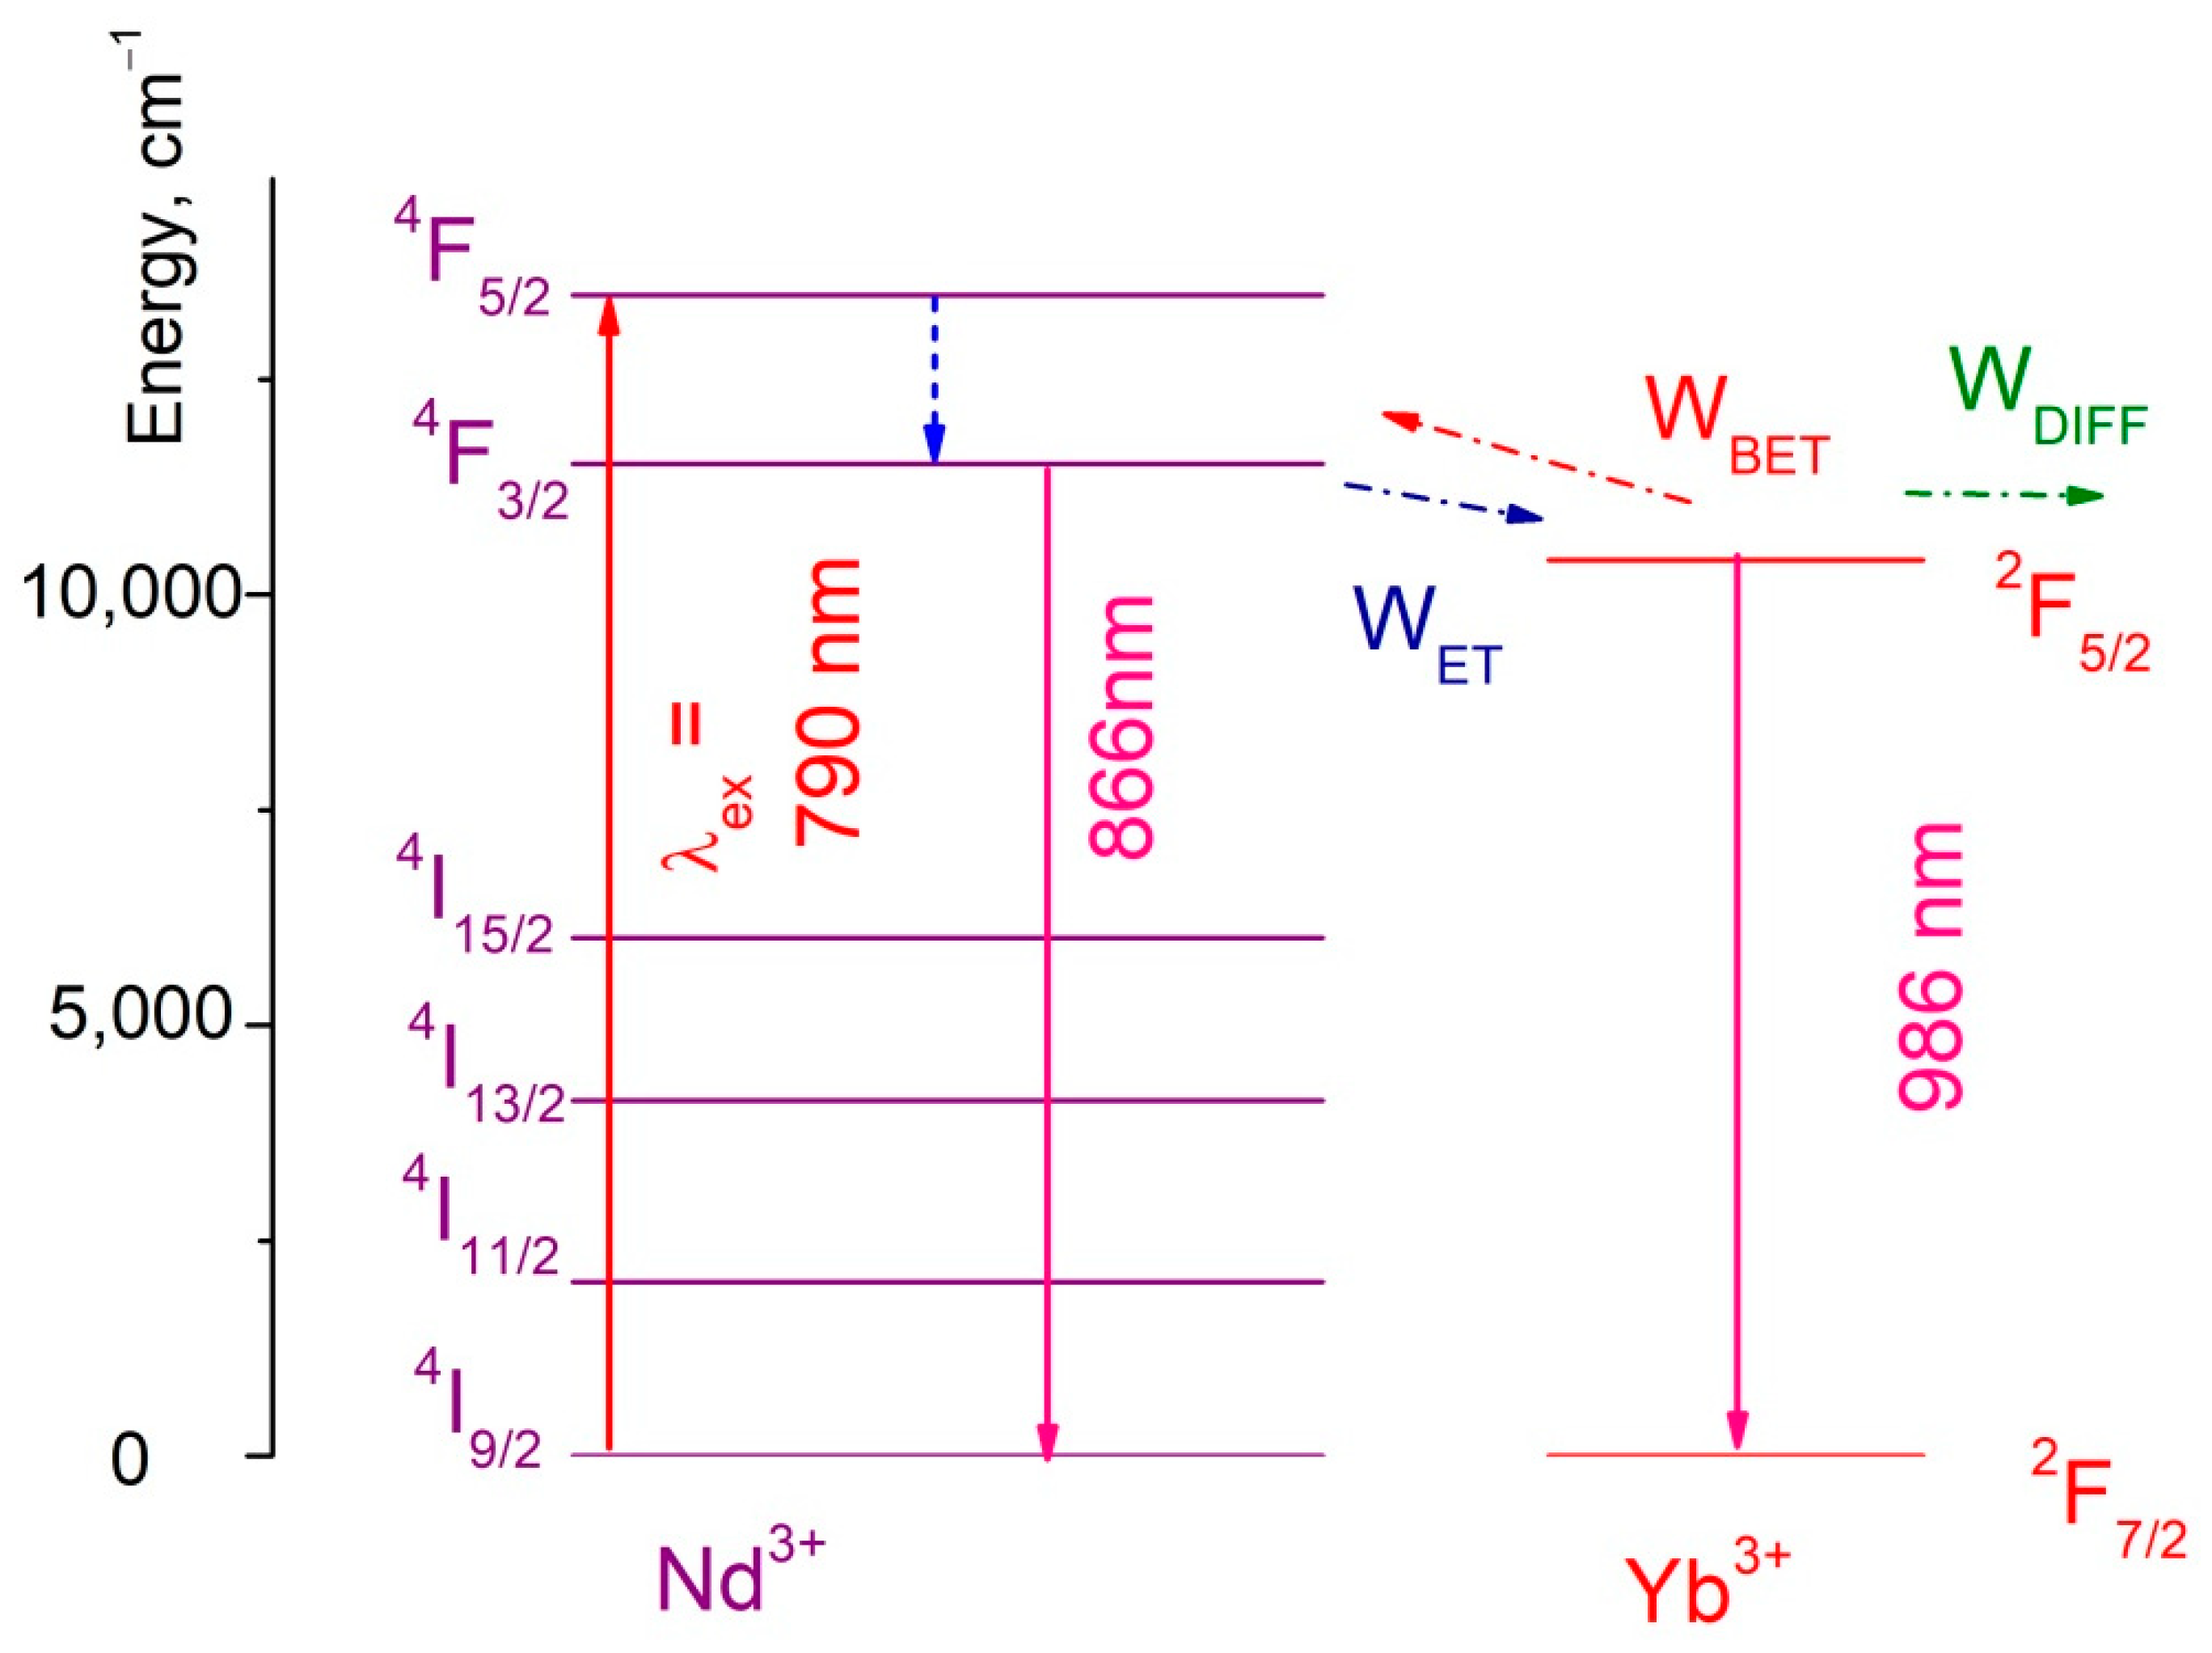
Figure 4.
The luminescence decay time curves detected at 100, 200, and 300 K for single-doped Nd3+ (0.1 (a), 0.5 (b), and 1.0 (c) mol.%):YF3 nanoparticles. λex = 790 nm (4I9/2–4F5/2 absorption band of Nd3+), λem = 863 nm (4F3/2–4I9/2 emission band of Nd3+).
Figure 4.
The luminescence decay time curves detected at 100, 200, and 300 K for single-doped Nd3+ (0.1 (a), 0.5 (b), and 1.0 (c) mol.%):YF3 nanoparticles. λex = 790 nm (4I9/2–4F5/2 absorption band of Nd3+), λem = 863 nm (4F3/2–4I9/2 emission band of Nd3+).
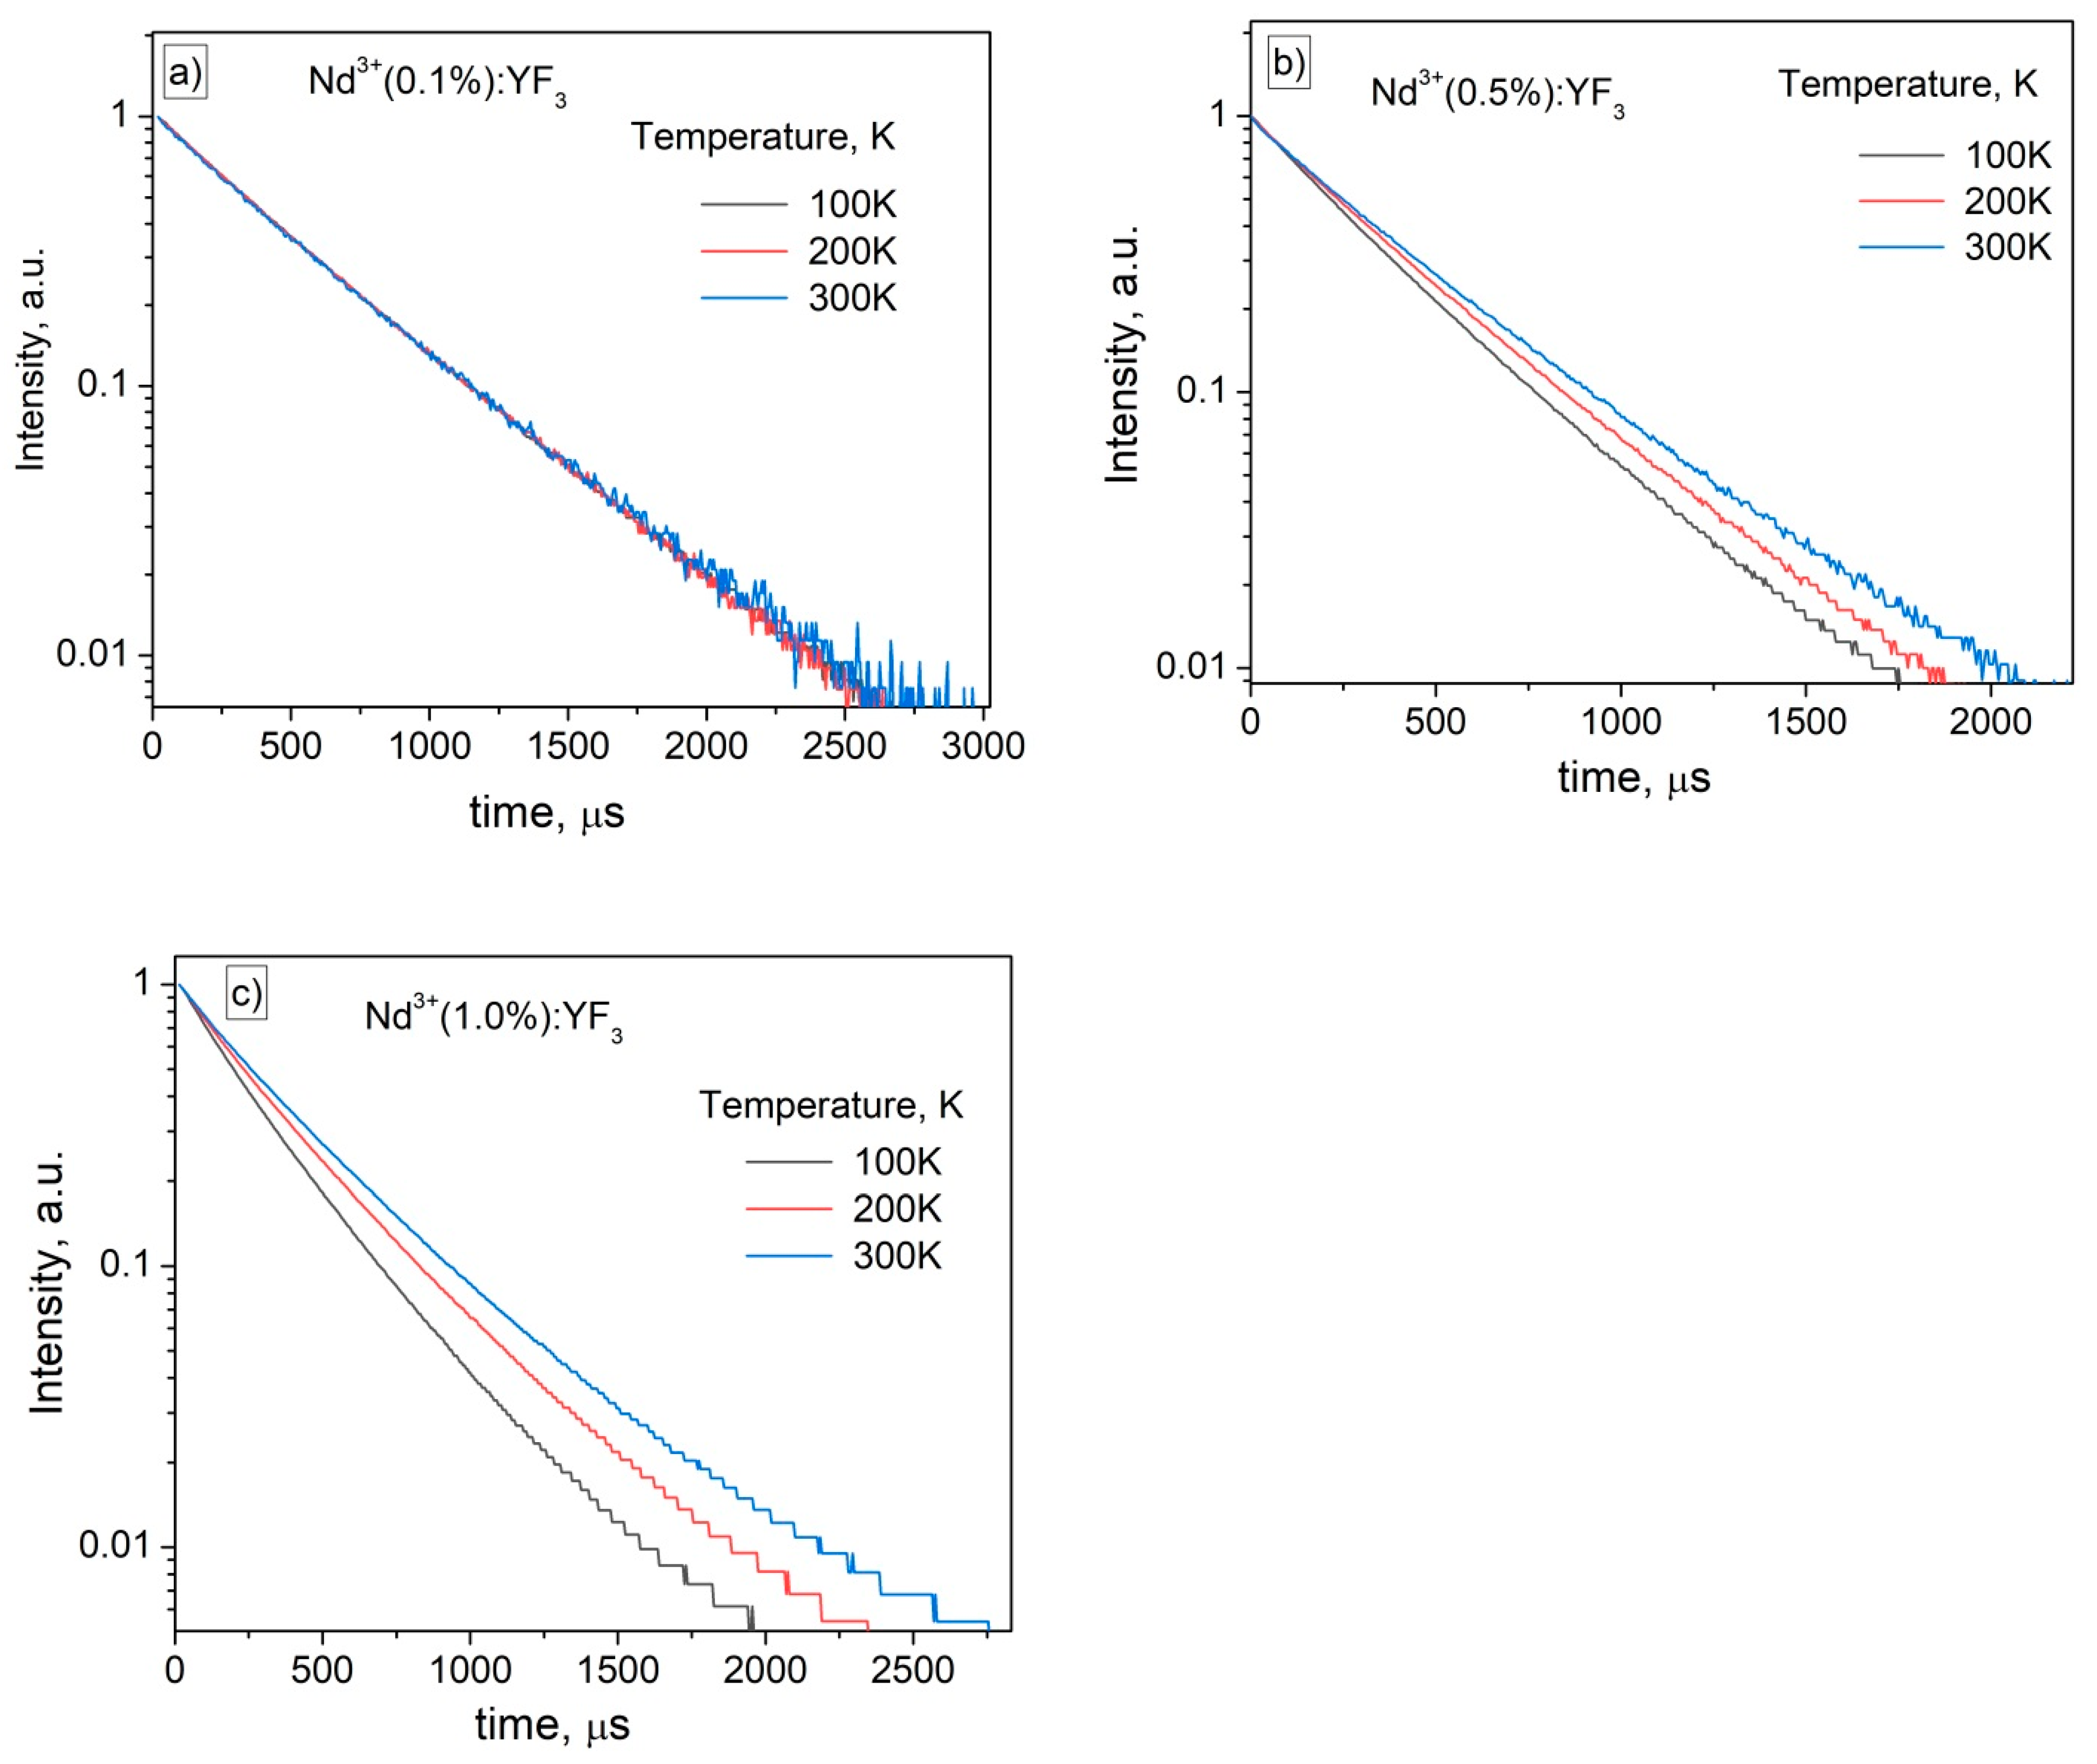
Figure 5.
Normalized at 903 nm (Nd3+ emission peak) spectra of Nd3+ (0.1 mol.%), Yb3+ (1.0 mol.%):YF3 sample recorded in the 80–320 K temperature range. 790 nm excitation wavelength corresponds to 4I9/2–4F5/2 absorption band of Nd3+ ions.
Figure 5.
Normalized at 903 nm (Nd3+ emission peak) spectra of Nd3+ (0.1 mol.%), Yb3+ (1.0 mol.%):YF3 sample recorded in the 80–320 K temperature range. 790 nm excitation wavelength corresponds to 4I9/2–4F5/2 absorption band of Nd3+ ions.
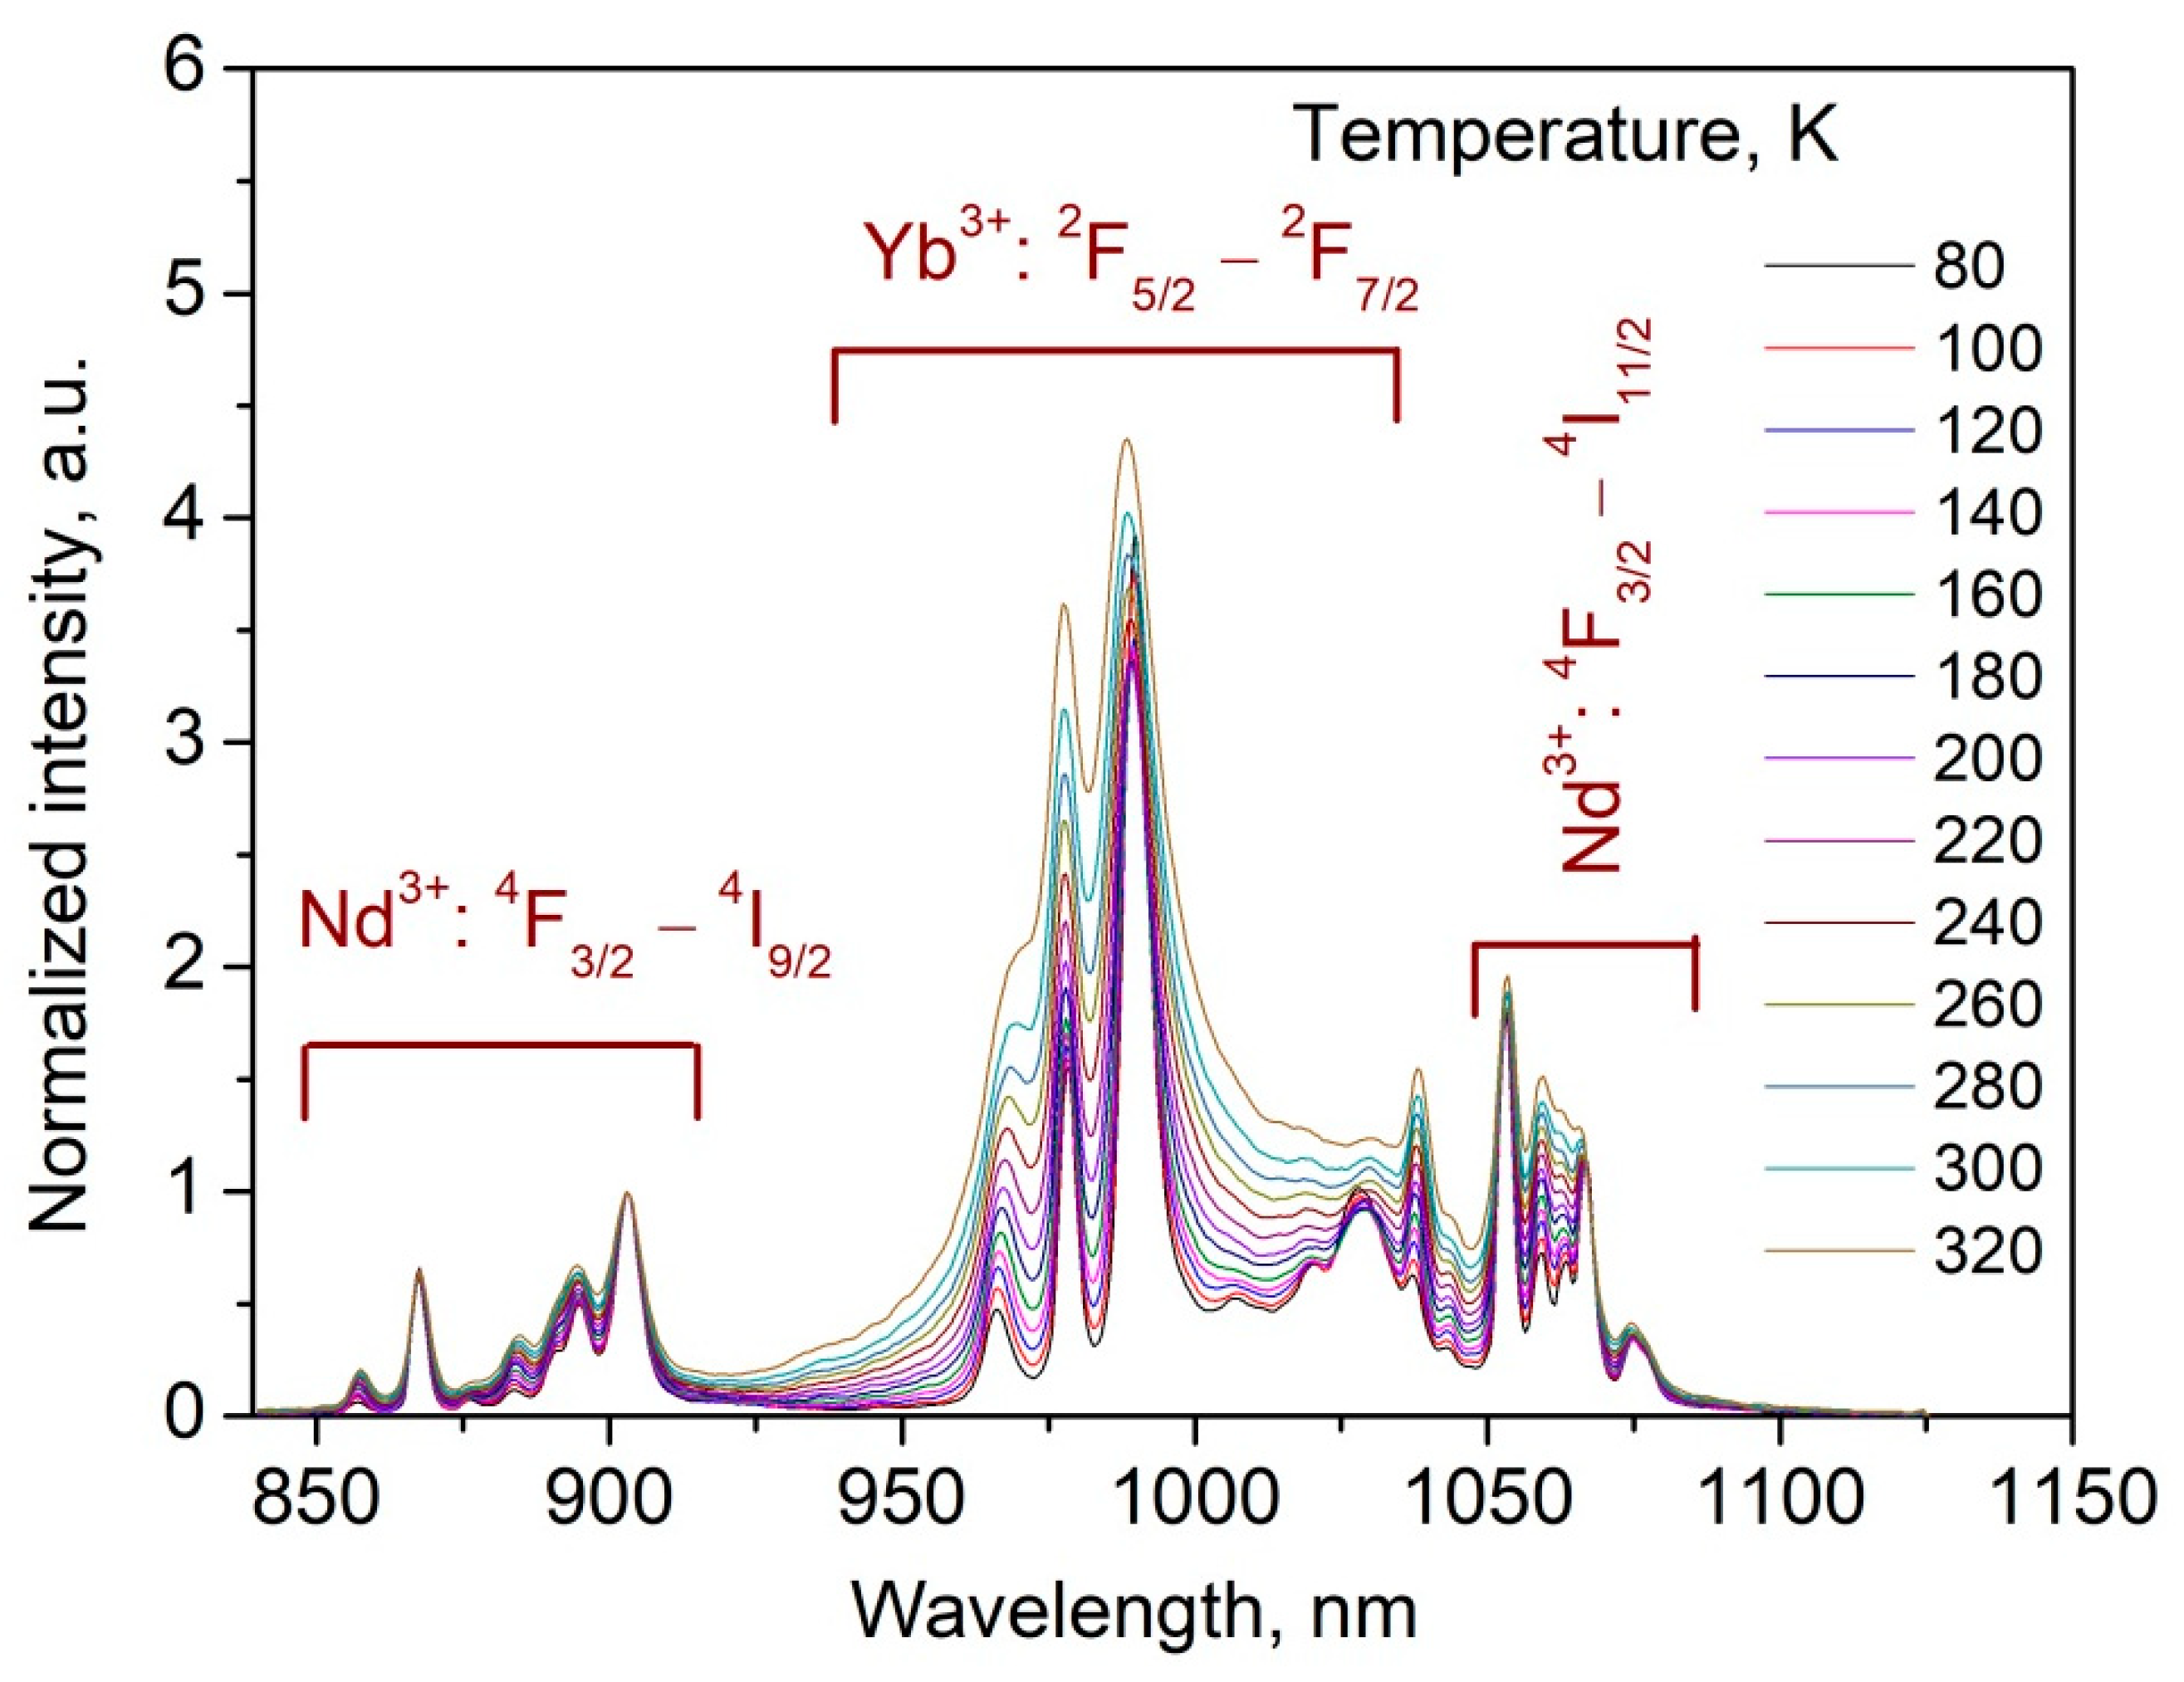
Figure 6.
LIR as a function of temperature.

Figure 7.
Sr as functions of temperature obtained from LIR curves for Nd3+ (0.1 mol.%), Yb3+ (X mol.%):YF3 samples.
Figure 7.
Sr as functions of temperature obtained from LIR curves for Nd3+ (0.1 mol.%), Yb3+ (X mol.%):YF3 samples.
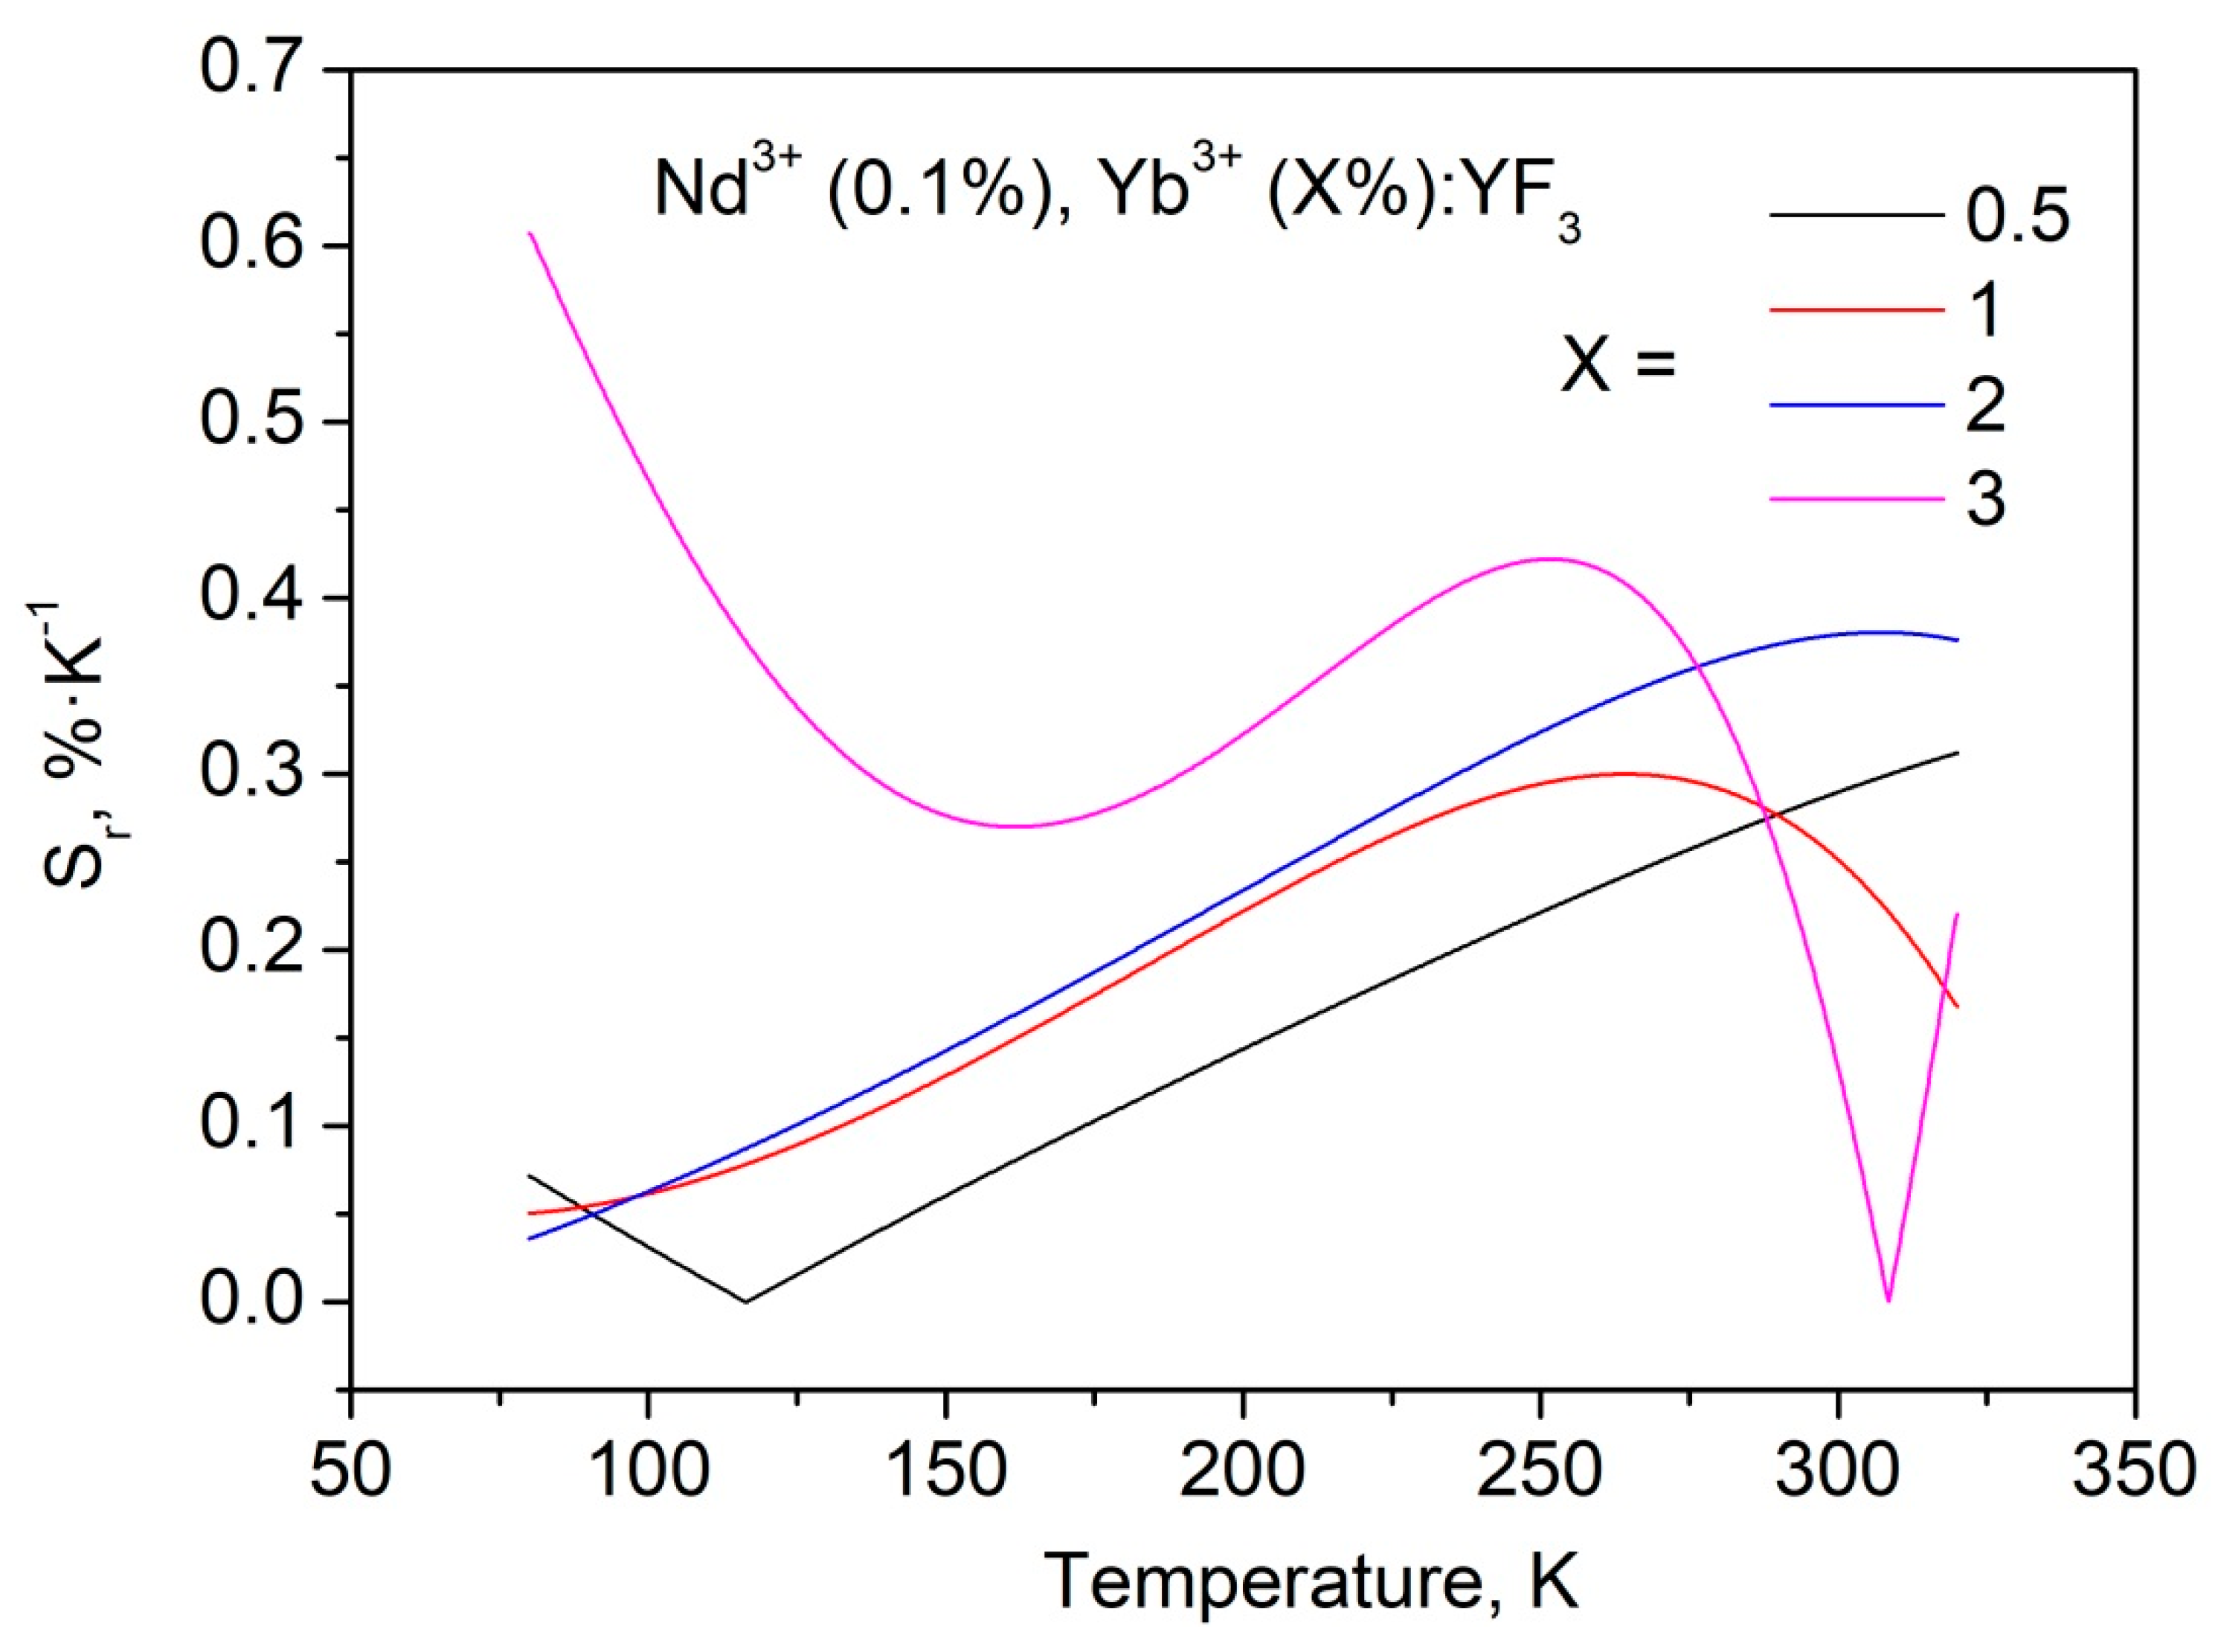
Figure 8.
Sr a functions of temperature obtained from LIR curves for Nd3+ (0.1 mol.%), Yb3+ (X mol.%):YF3 sample.
Figure 8.
Sr a functions of temperature obtained from LIR curves for Nd3+ (0.1 mol.%), Yb3+ (X mol.%):YF3 sample.
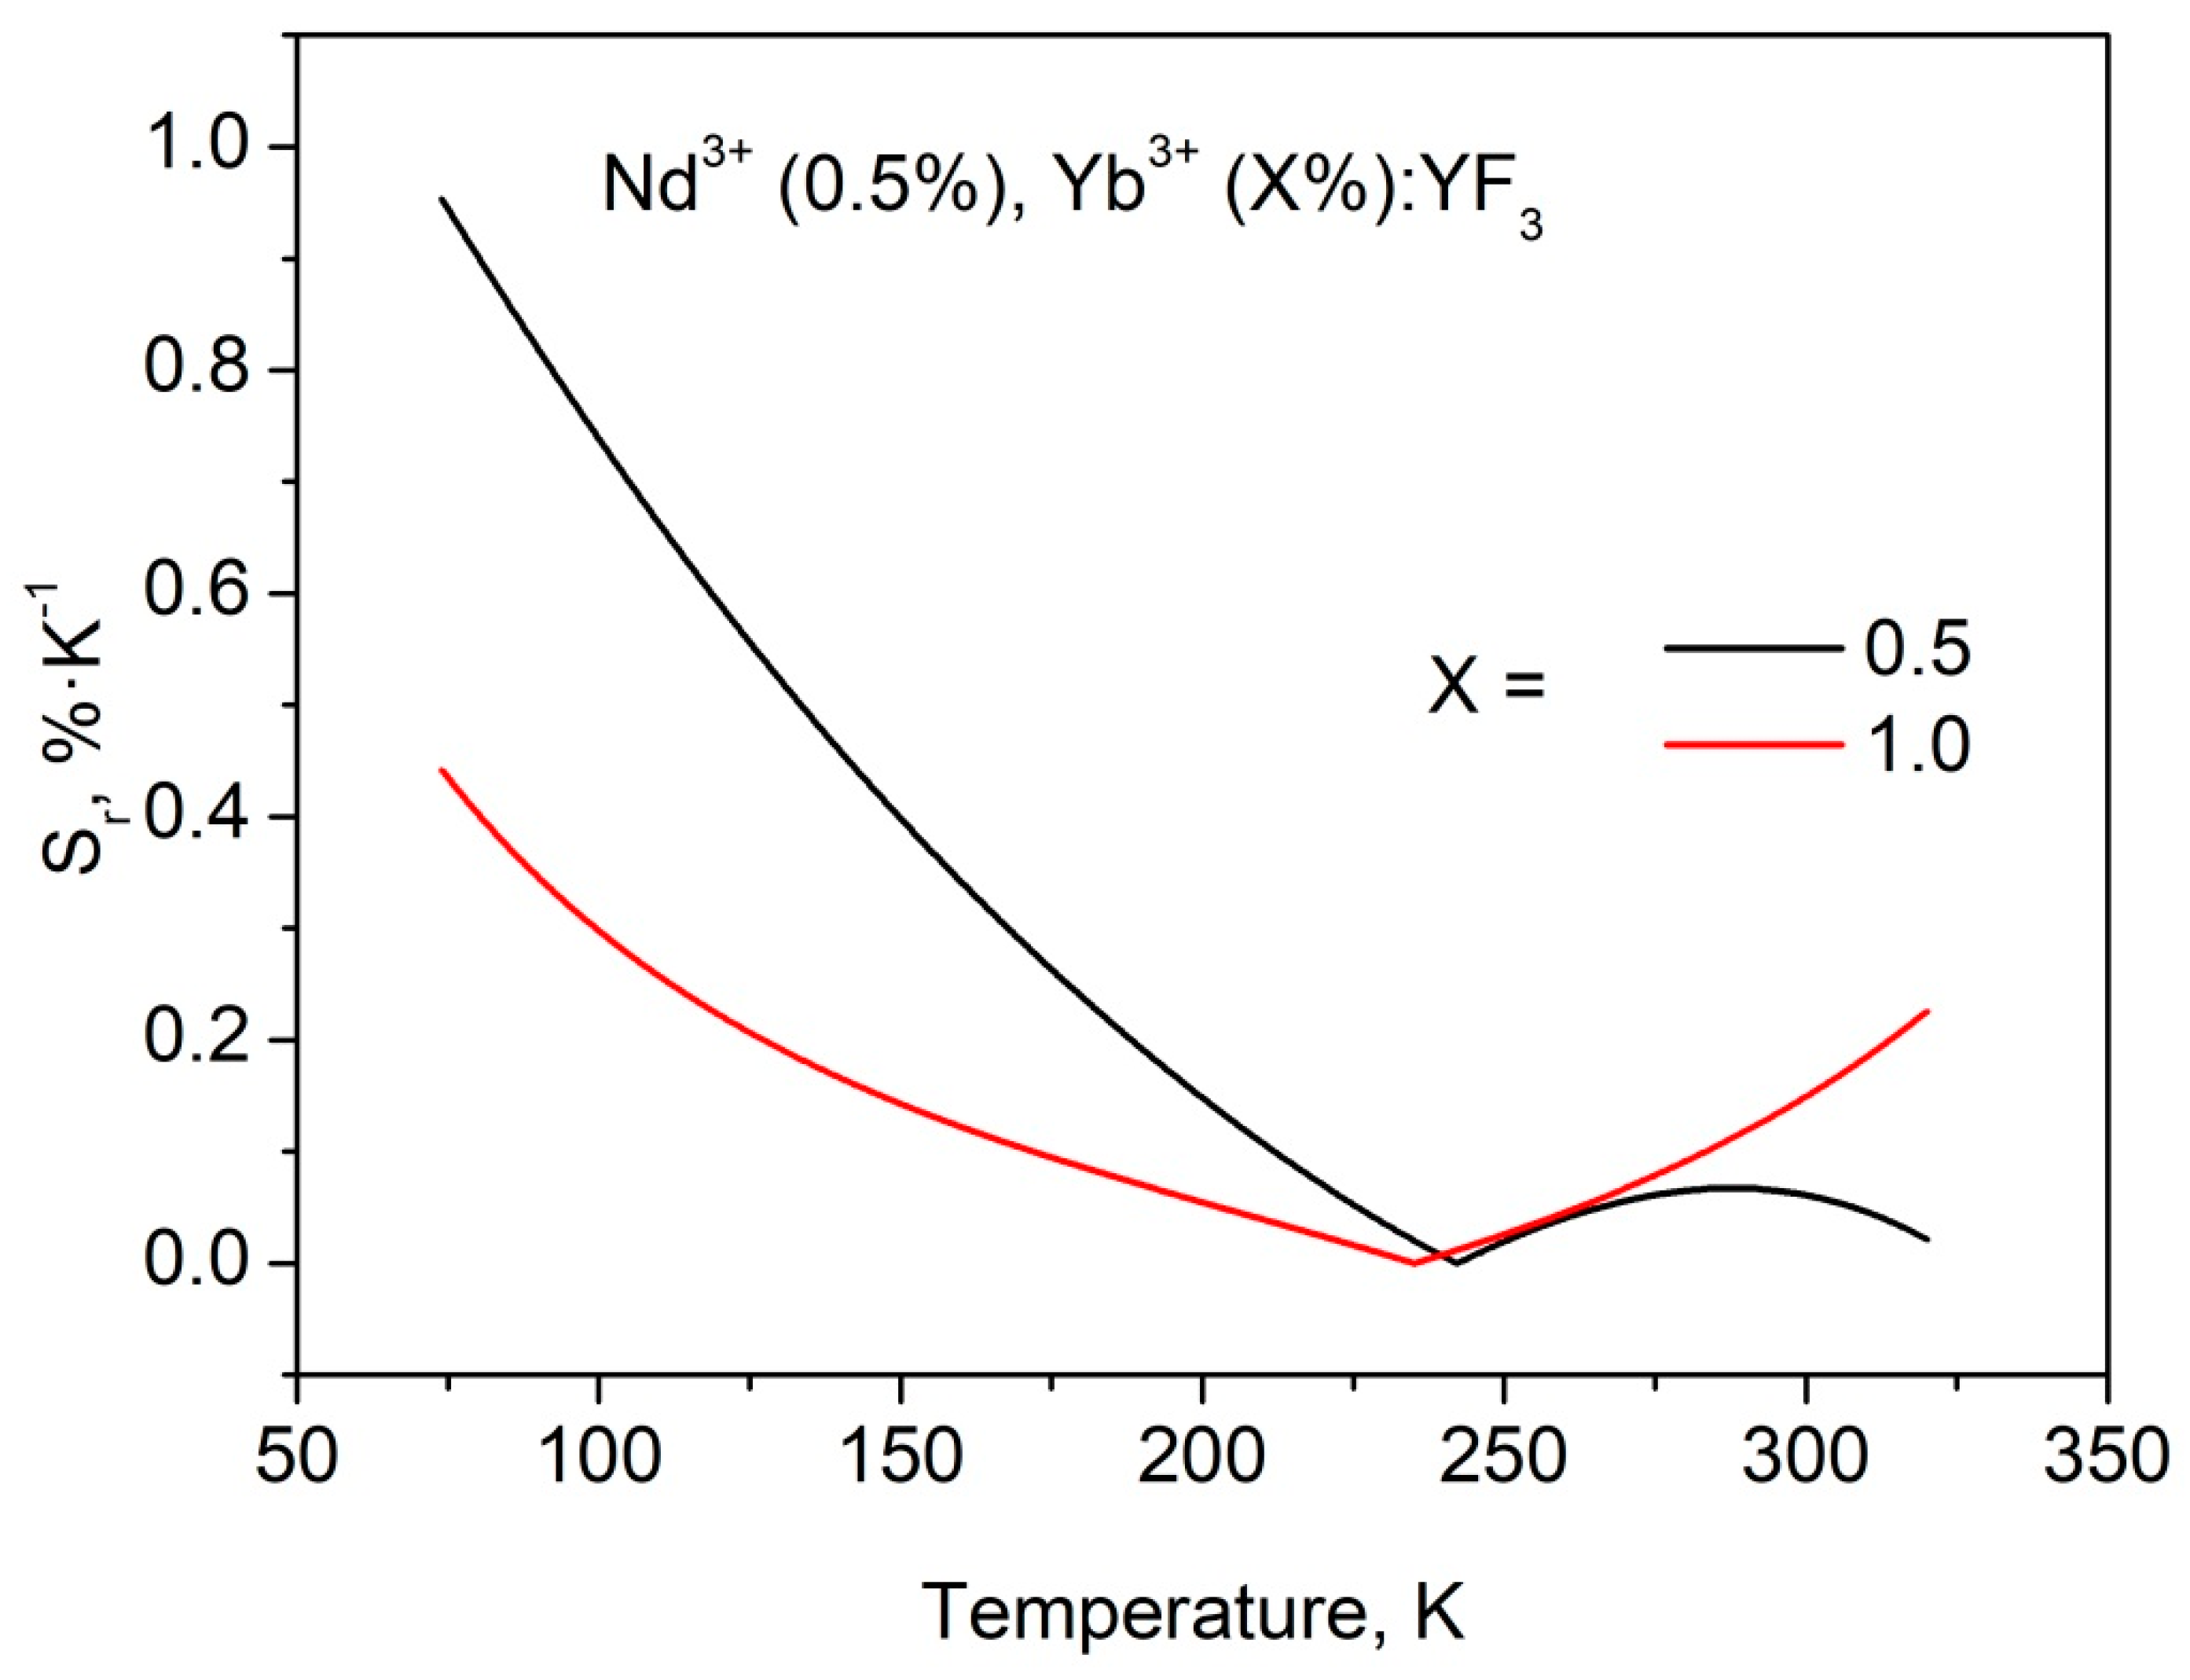
Figure 9.
Effective luminescence decay times as functions of temperature for Nd3+ (0.5 mol.%), Yb3+ (X mol.%):YF3 and Nd3+ (0.1 mol.%) (a), Yb3+ (X mol.%):YF3 (b).
Figure 9.
Effective luminescence decay times as functions of temperature for Nd3+ (0.5 mol.%), Yb3+ (X mol.%):YF3 and Nd3+ (0.1 mol.%) (a), Yb3+ (X mol.%):YF3 (b).
Disclaimer/Publisher’s Note: The statements, opinions and data contained in all publications are solely those of the individual author(s) and contributor(s) and not of MDPI and/or the editor(s). MDPI and/or the editor(s) disclaim responsibility for any injury to people or property resulting from any ideas, methods, instructions or products referred to in the content. |
© 2022 by the authors. Licensee MDPI, Basel, Switzerland. This article is an open access article distributed under the terms and conditions of the Creative Commons Attribution (CC BY) license (https://creativecommons.org/licenses/by/4.0/).
Share and Cite
MDPI and ACS Style
Pudovkin, M.; Oleynikova, E.; Kiiamov, A.; Cherosov, M.; Gafurov, M. Nd3+, Yb3+:YF3 Optical Temperature Nanosensors Operating in the Biological Windows. Materials 2023, 16, 39. https://doi.org/10.3390/ma16010039
AMA Style
Pudovkin M, Oleynikova E, Kiiamov A, Cherosov M, Gafurov M. Nd3+, Yb3+:YF3 Optical Temperature Nanosensors Operating in the Biological Windows. Materials. 2023; 16(1):39. https://doi.org/10.3390/ma16010039
Chicago/Turabian StylePudovkin, Maksim, Ekaterina Oleynikova, Airat Kiiamov, Mikhail Cherosov, and Marat Gafurov. 2023. "Nd3+, Yb3+:YF3 Optical Temperature Nanosensors Operating in the Biological Windows" Materials 16, no. 1: 39. https://doi.org/10.3390/ma16010039
Note that from the first issue of 2016, this journal uses article numbers instead of page numbers. See further details here.