Article

Tailoring the Structure and Properties of Epitaxial Europium Tellurides on Si(100) through Substrate Temperature Control

1
National Laboratory of Solid State Microstructure, School of Physics, Nanjing University, Nanjing 210093, China
2
Department of Physics, and Shenzhen Institute for Quantum Science and Engineering, Southern University of Science and Technology, Shenzhen 518055, China
3
Collaborative Innovation Center of Advanced Microstructures, Nanjing University, Nanjing 210093, China
4
Guangdong Provincial Key Laboratory of Quantum Science and Engineering, Shenzhen 518055, China
5
Hefei National Laboratory, Hefei 230088, China
*
Author to whom correspondence should be addressed.
Materials 2023, 16(22), 7093; https://doi.org/10.3390/ma16227093
Submission received: 30 September 2023 / Revised: 31 October 2023 / Accepted: 6 November 2023 / Published: 9 November 2023

Abstract

:
In this study, we improved the growth procedure of EuTe and realized the epitaxial growth of EuTe4. Our research demonstrated a selective growth of both EuTe and EuTe4 on Si(100) substrates using the molecular beam epitaxy (MBE) technique and reveals that the substrate temperature plays a crucial role in determining the structural phase of the grown films: EuTe can be obtained at a substrate temperature of 220 °C while lowering down the temperature to 205 °C leads to the formation of EuTe4. A comparative analysis of the transmittance spectra of these two films manifested that EuTe is a semiconductor, whereas EuTe4 exhibits charge density wave (CDW) behavior at room temperature. The magnetic measurements displayed the antiferromagnetic nature in EuTe and EuTe4, with Néel temperatures of 10.5 and 7.1 K, respectively. Our findings highlight the potential for controllable growth of EuTe and EuTe4 thin films, providing a platform for further exploration of magnetism and CDW phenomena in rare earth tellurides.

1. Introduction

Rare earth tellurides (ReTex) exhibit a diverse range of intriguing properties including charge density waves (CDW) [1,2,3,4], two-dimensional (2D) magnetism [5,6], as well as thermal hysteresis effects on resistivity and CDW gap [7,8], making them promising candidates for studying electron correlation phenomena and various applications in spintronics. Among these materials, europium tellurides are particularly unique due to the half-filled 4f orbital of the Eu atom ([Xe] 4f7 6s2). According to Hund’s rule, the Eu atom possesses the maximum spin angular momentum with zero orbital angular momentum (L = 0, J = S = 7 2 ). As a result, the magnetism in europium tellurides arises solely from the spin of the Eu atom.
Europium chalcogenides were among the earliest discovered magnetic semiconductors. In particular, EuTe, a renowned antiferromagnetic semiconductor, has been extensively studied for over half a century [9,10,11,12]. As shown in Figure 1a, it exhibits a face-centered cubic rock salt structure with a bulk lattice constant of a = b = c = 6.598 Å [13]. The valence state of Eu and Te in EuTe are +2 and −2, respectively [14]. In EuTe, the magnetic moments are carried by Eu, and the magnetic properties of EuTe can be depicted by an isotropic Hamiltonian, accounting only for the nearest and next-nearest neighbor exchange interactions [15,16,17]. At low temperatures, EuTe transitions into a type II antiferromagnet with a Néel temperature of 9.8 K [18].
In contrast, EuTe4 is a newly discovered van der Waals layered material that has received significant attraction in recent years [7,8,19,20,21]. As illustrated in Figure 1b, EuTe4 adopts an orthorhombic lattice structure with a space group of Pmmn (No. 59) at room temperature. The lattice constant of EuTe4 in its normal state are as follows: a = 4.5119(2) Å, b = 4.6347(2) Å, c = 15.6747(10) Å [20]. The unit cell of EuTe4 comprises a Te-EuTe-Te-EuTe-Te quintuple layer. The valence states of the Eu and Te ions in the Eu-Te slab are +2 and −2, respectively, while the valence state of the isolated Te layers remains nominally neutral [7]. The nearly square Te layers are unstable and tend to be distorted, resulting in CDW transition above 400 K [7]. Remarkably, EuTe4 exhibits a unique type of metastability, characterized by a thermal hysteresis that spans over 400 K in temperature. More specifically, the CDW gap and electrical resistivity of EuTe4 manifest different behaviors even at an identical temperature, depending upon the preceding temperature variation path (for instance, whether it was heated up to 300 K or cooled down to 300 K) [7]. The origin of this thermal hysteresis deviates from conventional mechanisms and can be elucidated by the switching of CDW phases in distinct Te layers, a phenomenon not present in 2D or strongly correlated 3D systems [7].
Despite extensive research on EuTe, the high-quality synthesis of EuTe thin films remains a challenge. Previous studies used BaF2(111) as the growth substrate, but the large lattice mismatch between EuTe film and BaF2 substrate necessitated the incorporation of PbTe(111) film as a buffer layer [22,23,24,25,26]. Moreover, the film quality was highly sensitive to the substrate temperature and required a rigorous flux ratio control. Furthermore, the thickness of EuTe film grown on BaF2 was also limited to 45 layers due to the formation of a strain-induced three-dimensional island [22]. Therefore, it is necessary to improve the growth procedure of EuTe in order to attain a deeper comprehension of the rich magnetic properties within this system. On the other hand, the current research on EuTe4 primarily focuses on its bulk properties, lacking a systematical investigation on EuTe4 thin film in a 2D limit. The synthesis of 2D epitaxial EuTe4 thin film serves as a platform to facilitate our understanding of the mechanisms behind its CDW behavior in subsequent studies. Also, it offers an opportunity to delve into the competitive interactions between different Te atomic layers, unraveling the underlying mechanisms that drive the thermal hysteresis phenomena.
Substrate temperature is a key factor in the molecular beam epitaxial (MBE) growth of thin films. Typically, substrate temperature only affects the morphology and quality of the films [27,28,29]. In specific instances, such as MoS2 [30], WSe2 [31], and TaTe2 [32], precise temperature control enables the selective growth of films with different crystalline structures. By carefully tuning the substrate temperature, one can manipulate the microstructure of the material at the atomic level. Such control paves new paths to precisely tailor the optical, magnetic, and electronic properties of the films.
In this research, we improved the growth procedure for EuTe and realized the epitaxial growth of EuTe4 utilizing MBE. The selective growth of EuTe and EuTe4 was also achieved by precisely adjusting the substrate temperature. In combination with reflection high energy electron diffraction (RHEED), X-ray diffraction (XRD), and scanning transmittance electron microscopy (STEM) techniques, we examined the difference of lattice structures and crystalline orientations between EuTe and EuTe4 films. In addition, we compared the relative stoichiometry ratio and valence state between EuTe and EuTe4 films via X-ray photoelectron spectroscopy (XPS). The experimental data demonstrated that a substrate temperature of 220 °C results in the growth of EuTe, and conversely, EuTe4 film forms at a lower temperature of 205 °C. Additionally, we further investigated the physical properties of the two materials. The XPS spectra near the Fermi level indicated that EuTe is a semiconductor, with its valence band top located about 0.6 eV below the Fermi level. For EuTe4, the density of states stretches to the vicinity of the Fermi level. The transmittance spectra verified the semiconductive property of EuTe and discovered the existence of a CDW gap in EuTe4 at room temperature. In addition, superconducting quantum interference device (SQUID) measurements denoted that EuTe and EuTe4 are both antiferromagnetic materials, with Néel temperatures of 10.5 and 7.1 K, respectively. Our results developed the fabrication and physical property investigation of epitaxial 2D materials based on rare earth elements.

2. Methods

The growth of EuTe and EuTe4 films was conducted in an MBE system (GC inno, Changzhou, Jiangsu, China) with a base pressure of 1 × 10⁻¹⁰ mbar. The conductive Si(100) wafers (n-type boron doped, 0.01~0.05 Ω·cm, HF-Kejing, Hefei, Anhui, China) were selected as substrates. Prior to the growth, the substrates underwent a degassing process at 600 °C for 3 h, followed by a standard flash procedure at 1200 °C to achieve an atomic flat surface [33]. The films were grown by co-deposited high-purity Eu (99.9%) and Te (99.999%) shots (PrMat, Shanghai, China) via standard Knudsen Cells on the Si(100) substrate. The temperatures of the evaporation sources for Eu and Te were maintained at 460 °C and 320 °C, respectively, with flux ratio of Eu:Te keeping ~1:20. The growth of the film was monitored by an in situ RHEED and the growth rate of EuTe and EuTe4 was about 0.3 and 0.2 nm per minute (nm/min), respectively. The thickness of the grown film, defined as the length in the z-direction of Figure 1a,b, was roughly estimated by the growth time.
The crystal structure of the grown films was determined by an ex situ XRD (D8 ADVANCE, Bruker, Billerica, MA, USA) with Cu Kα source (wavelength λ = 1.5406 Å). A spherical aberration-corrected scanning transmission electron microscopy (STEM, Titan Themis G2, FEI, Hillsboro, OR, USA) was employed for further examining the structure of the grown films. To protect the films from possible oxidation in atmosphere and ensure the sample was grounded during the STEM measurements, a ~20 nm thick amorphous Eu metal film was deposited on the sample surface at room temperature before moving the sample from the MBE chamber. The samples were fabricated by the focused ion beam (FIB, Helios Nanolab 600i, FEI, Hillsboro, OR, USA) technique before STEM characterizations. The stoichiometric information of EuTe and EuTe4 were compared by an in situ XPS with a resolution of ~0.2 eV, where the monochromatic X-ray (Al Kα, 1486.7 eV) was used as the excitation light source (Scienta Omicron MECS, Taunusstein, Hesse, Germany). The ex situ transmittance spectra of EuTe and EuTe4 were measured at room temperature, with light incident perpendicular to the sample surface and data collected by a Fourier transform spectrometer (Vertex 80 V, Bruker, Billerica, MA, USA). The magnetic properties were characterized by an ex situ superconducting quantum interference device vibrating sample magnetometer (SQUID-VSM, Quantum Design, San Diego, CA, USA). During the magnetic measurement, a magnetic field of 5000 Oe was applied parallel to the film surface.

3. Results and Discussions

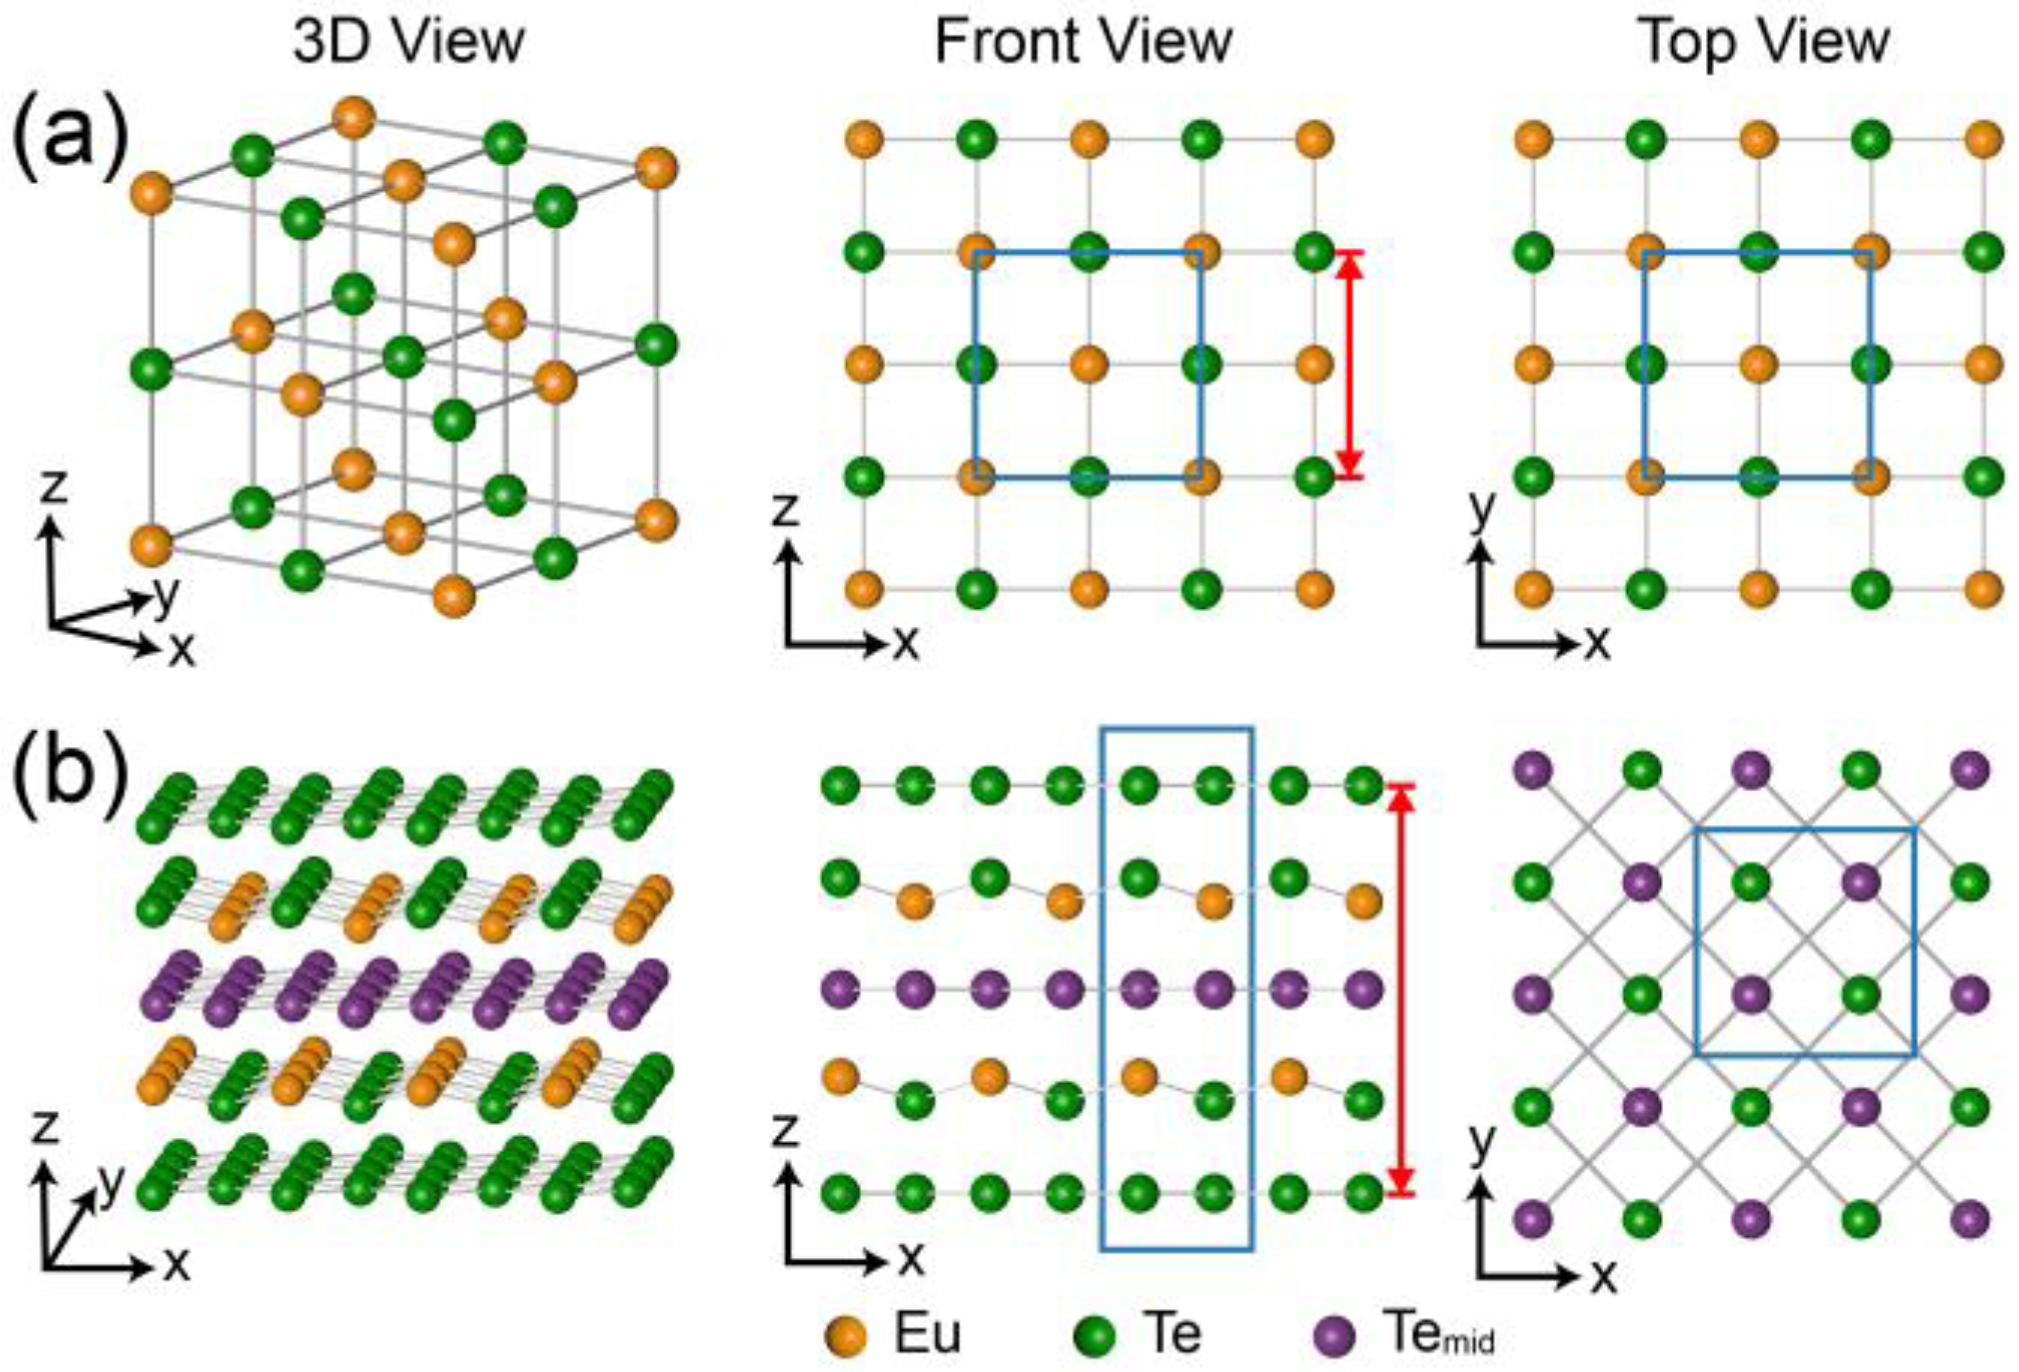
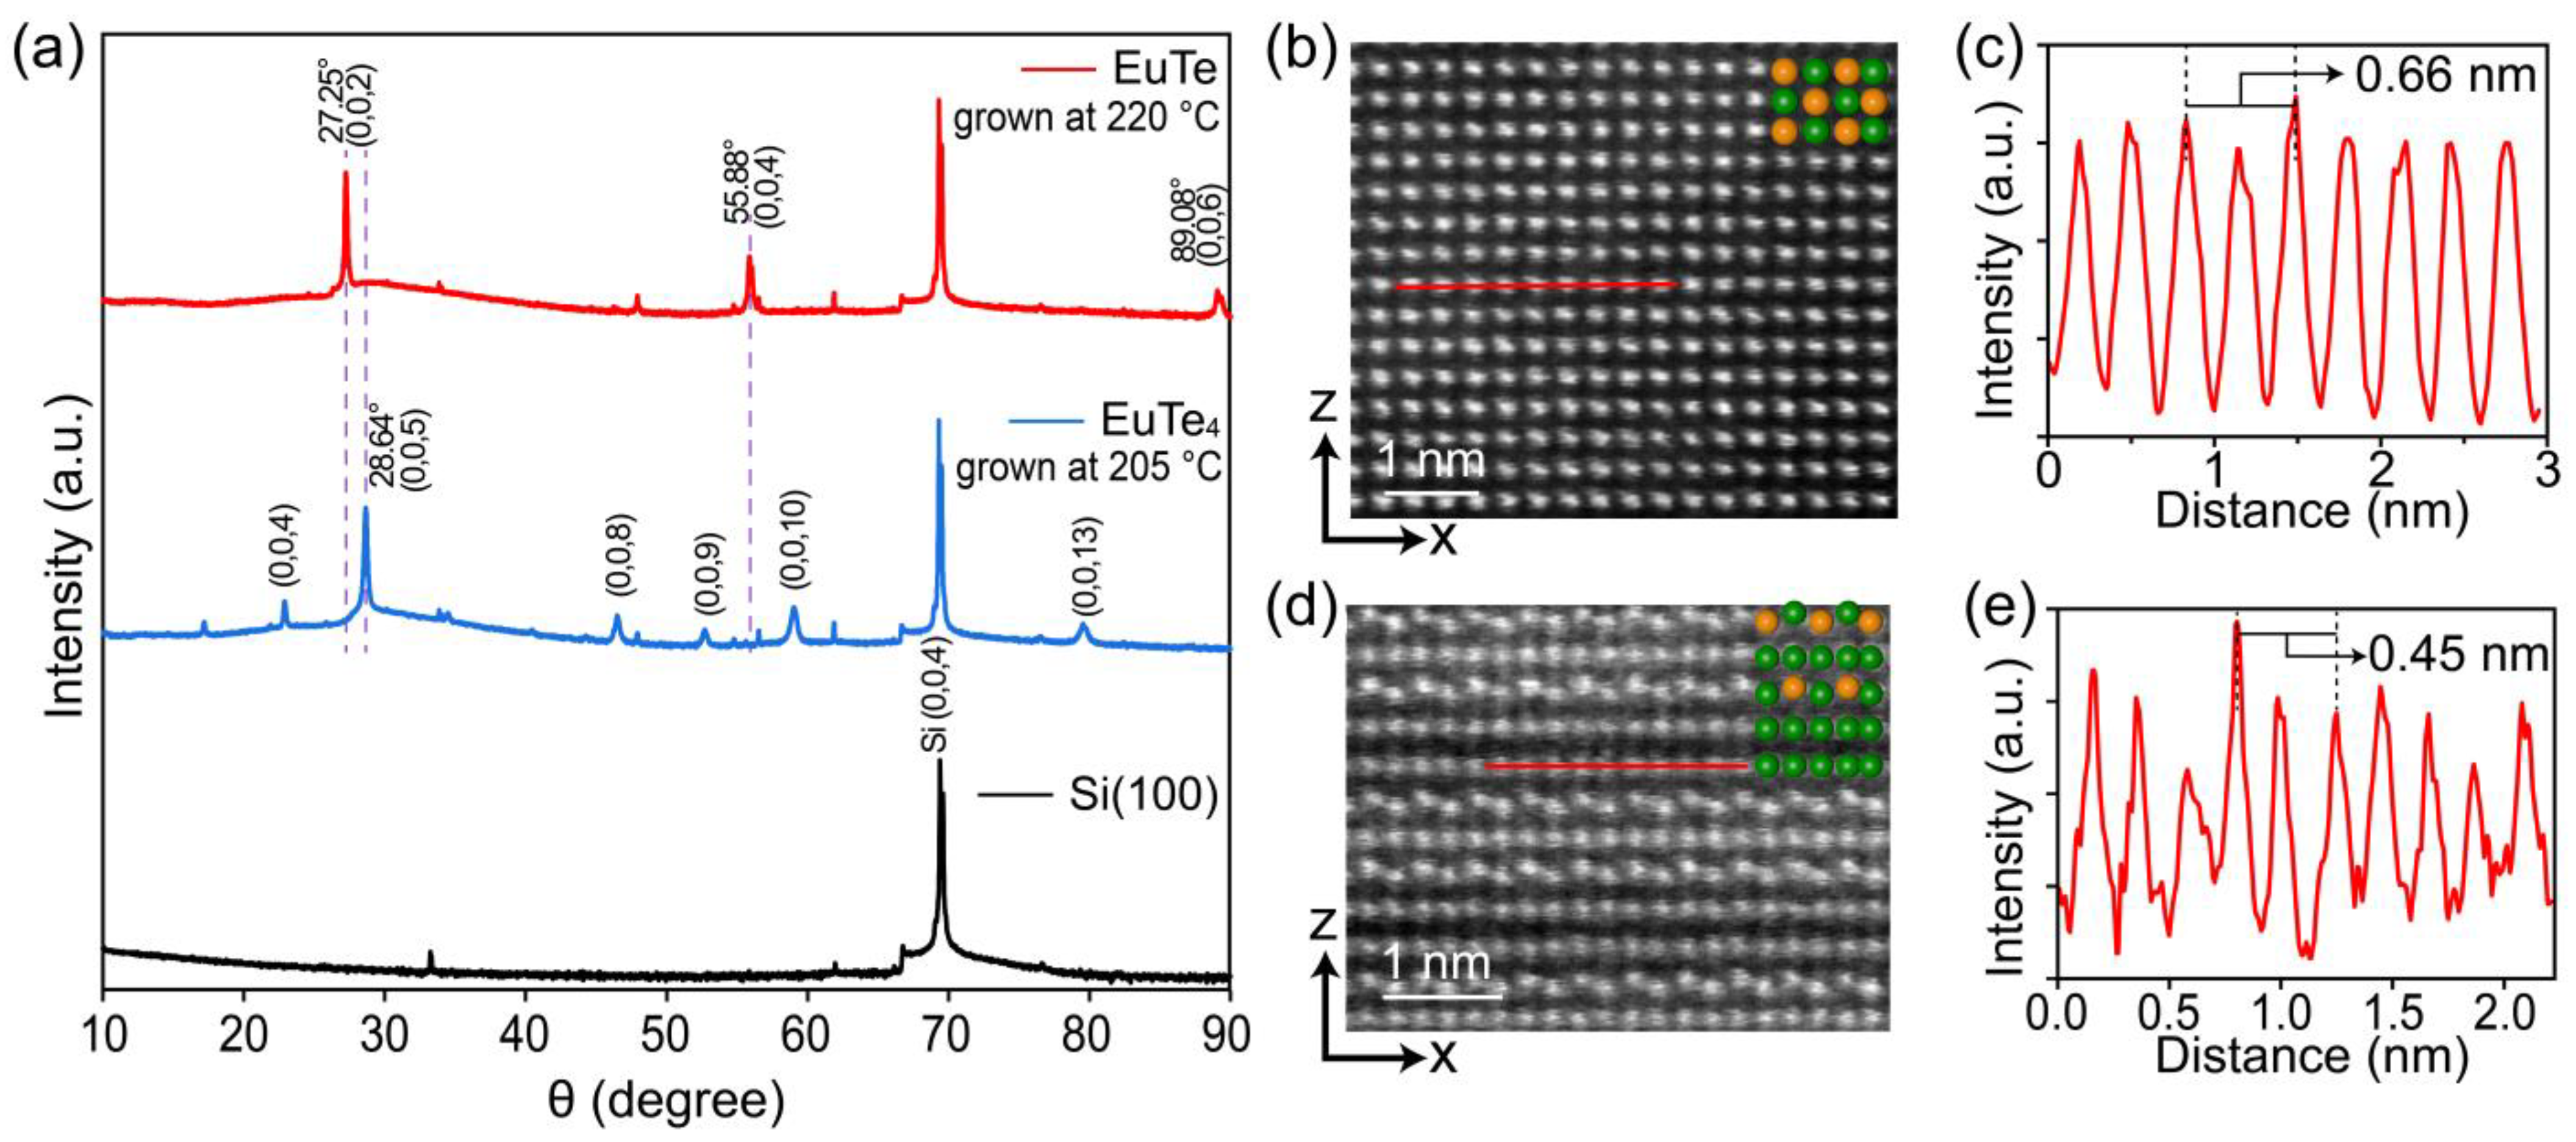
3.1. Growth and Structural Characteristics of EuTe and EuTe4 Films

Figure 2a displays the RHEED pattern of a 2 × 1 surface-reconstructed Si(100) substrate after the standard flash procedure, with the electron beam incident along the Si<100> direction. To clarify the lattice orientations of the substrate and grown films, we present the 45°-rotated RHEED diffraction pattern of Figure 2a in Figure 2b, where the electron beam incident is along the Si<110> direction. Figure 2c provides a schematic diagram of the atomic arrangement on the Si(100) surface. The black arrows indicate the incident directions (0° and 45°) of the RHEED electron beam, while the red and blue double-headed arrows correspond to the space between the diffraction stripes indicated in Figure 2a,b, respectively.
The substrate temperature played an essential role in determining the structural phase of the grown film. Figure 2d,e present the RHEED diffraction patterns of a ~10 nm thick film grown at 220 °C with the incident electron beam along the Si<100> (0°) and Si<110> (45°) directions, respectively. This film is further identified as EuTe by the subsequent XRD and STEM characterizations. The symmetry of the EuTe RHEED patterns matches that of the silicon substrate, demonstrating a four-fold rotational invariance. This rotational symmetry indicates the grown film possesses a tetragonal structure with the EuTe(001) as the surface orientation, which is notably different from the scenario of EuTe grown on a BaF2(111) substrate with PbTe as a buffer layer, where the surface orientation of the EuTe/PbTe/BaF2 film is the (111) plane, displaying a six-fold rotational symmetry [13]. Moreover, as the thickness of the film increases, no evidence of 3D island growth was observed, contrasting with the behavior of the EuTe film on BaF2(111) substrates, where 3D roughness rapidly increases when reaching the critical layer thickness of 45 layers [24]. This result suggests greater stability and lower binding energy for the EuTe(001) plane [34].
In Figure 2f, the atomic arrangement of the EuTe(001) surface is illustrated, with Eu and Te atoms represented by yellow and green balls, respectively. The RHEED diffraction stripes in Figure 2d (indicated by the red double arrow) correspond to the spacing between adjacent Eu and Te atoms as indicated by the red double arrow in Figure 2f. Similarly, the diffraction stripes in Figure 2e (indicated by the blue double arrow) correspond to the spacing between adjacent Eu(110) and Te(110) planes of EuTe in Figure 2f.
Lowering the substrate temperature to 205 °C results in the growth of EuTe4. Figure 2g,h display the RHEED pattern of a ~10 nm thick EuTe4 film along the Si<100> and <110> directions, respectively. The RHEED diffraction patterns of EuTe4 exhibit a four-fold rotational symmetry, indicating that the thin film’s surface orientation is the (001) plane, which is consistent with the cleavage plane of bulk EuTe4 observed in previous angle-resolved photoemission spectroscopic (ARPES) experiments [7,19]. In Figure 2i, a top view of the EuTe4(001) surface is presented, with the green and purple balls representing the topmost and middle Te atomic layers indicated in Figure 1b, respectively. The red and blue double-headed arrows in Figure 2g,h correspond to half of the basis vector along the x-axis and the nearest Te atom spacing within a single Te layer, as indicated in Figure 2i, respectively.
A substrate temperature significantly higher or lower than the optimal growth conditions for EuTe and EuTe4 will result in the degeneration of the film quality. More detailed results of the films grown at various temperatures can be seen in Supplementary Material Part A.
We carried out ex situ XRD and STEM characterizations to further identify the crystal structure of the grown films. Figure 3a presents the XRD curves for the Si substrate (black curve), and the films grown at 205 °C (blue curve) and 220 °C (red curve), shown from bottom to top. To display the diffraction peaks with varying intensities on a unified scale, we applied a fourth-root adjustment to the XRD curve intensities. The principal diffraction peaks in each of the three spectra are annotated with their corresponding diffraction indices.
Aside from the dominant peak at 69.40°, which is attributed to the silicon substrate, the XRD diffraction curves of the films grown at 205 °C and 220 °C display notable differences. For the film grown at 220 °C, the peaks at 27.25°, 55.88°, and 89.08° correspond to the EuTe(002), (004), and (006) planes, respectively. This diffraction pattern is distinct from the XRD curve of EuTe(111) grown on the PbTe buffer layer on the BaF2(111) substrate, where the (222) peak is predominant [13,35]. From the XRD curve, we derived a lattice constant of c = 0.654 nm for EuTe by applying Bragg’s law. This value is very close to the lattice constant of 0.650 nm derived from the EuTe film grown on the PbTe layer on the BaF2(111) substrate [13], confirming that they are the same material but with different crystal orientations.
In contrast to the diffraction pattern of EuTe, EuTe4 exhibits the strongest peak at 28.64°, which is associated with the EuTe4 (005) plane and gives a lattice constant of c = 1.557 nm. This value is consistent with the lattice constant of 1.567 nm obtained from the XRD measurement of the bulk EuTe4 sample [20]. Based on the above XRD curves, we can conclude that the films grown at ~205 °C and ~220 °C belong to different structural phases of EuTe4 and EuTe, respectively.
Figure 3b displays the side-view STEM image of the EuTe film (grown at ~220 °C), where atoms form a tetragonal lattice. A schematic atomic arrangement of EuTe is depicted in the top-right corner of the STEM image. The intensity distribution curve, shown in Figure 3c, derived along the red solid line in Figure 3b, reveals an in-plane lattice constant of a = 0.66 nm for EuTe. This is in line with the value of 0.65 nm for EuTe grown on the PbTe buffer layer on BaF2(111) [13]. According to the lattice configurations depicted in Figure 2c,f and the derived in-plane lattice constant, we obtained a lattice mismatch of 21.55% between EuTe and the silicon substrate, which significantly surpasses the value of 2.10% between EuTe(111) and the buffer layer of PbTe on BaF2(111) [13]. The large lattice mismatch indicates a weak interfacial interaction between the substrate and the thin film, ensuring the high-quality growth of EuTe.
Figure 3d is a side-view STEM image of the EuTe4 film (grown at ~205 °C), which displays a layered atomic structure comprised of EuTe-Te-EuTe-Te-Te. The corresponding intensity distribution curve in Figure 3e yields an in-plane lattice constant of a = 0.45 nm for EuTe4, consistent with the value of 0.451 nm derived from bulk EuTe4 XRD characterization [20]. This result gives a lattice mismatch of 17.13% between the Si substrate and EuTe4 film.

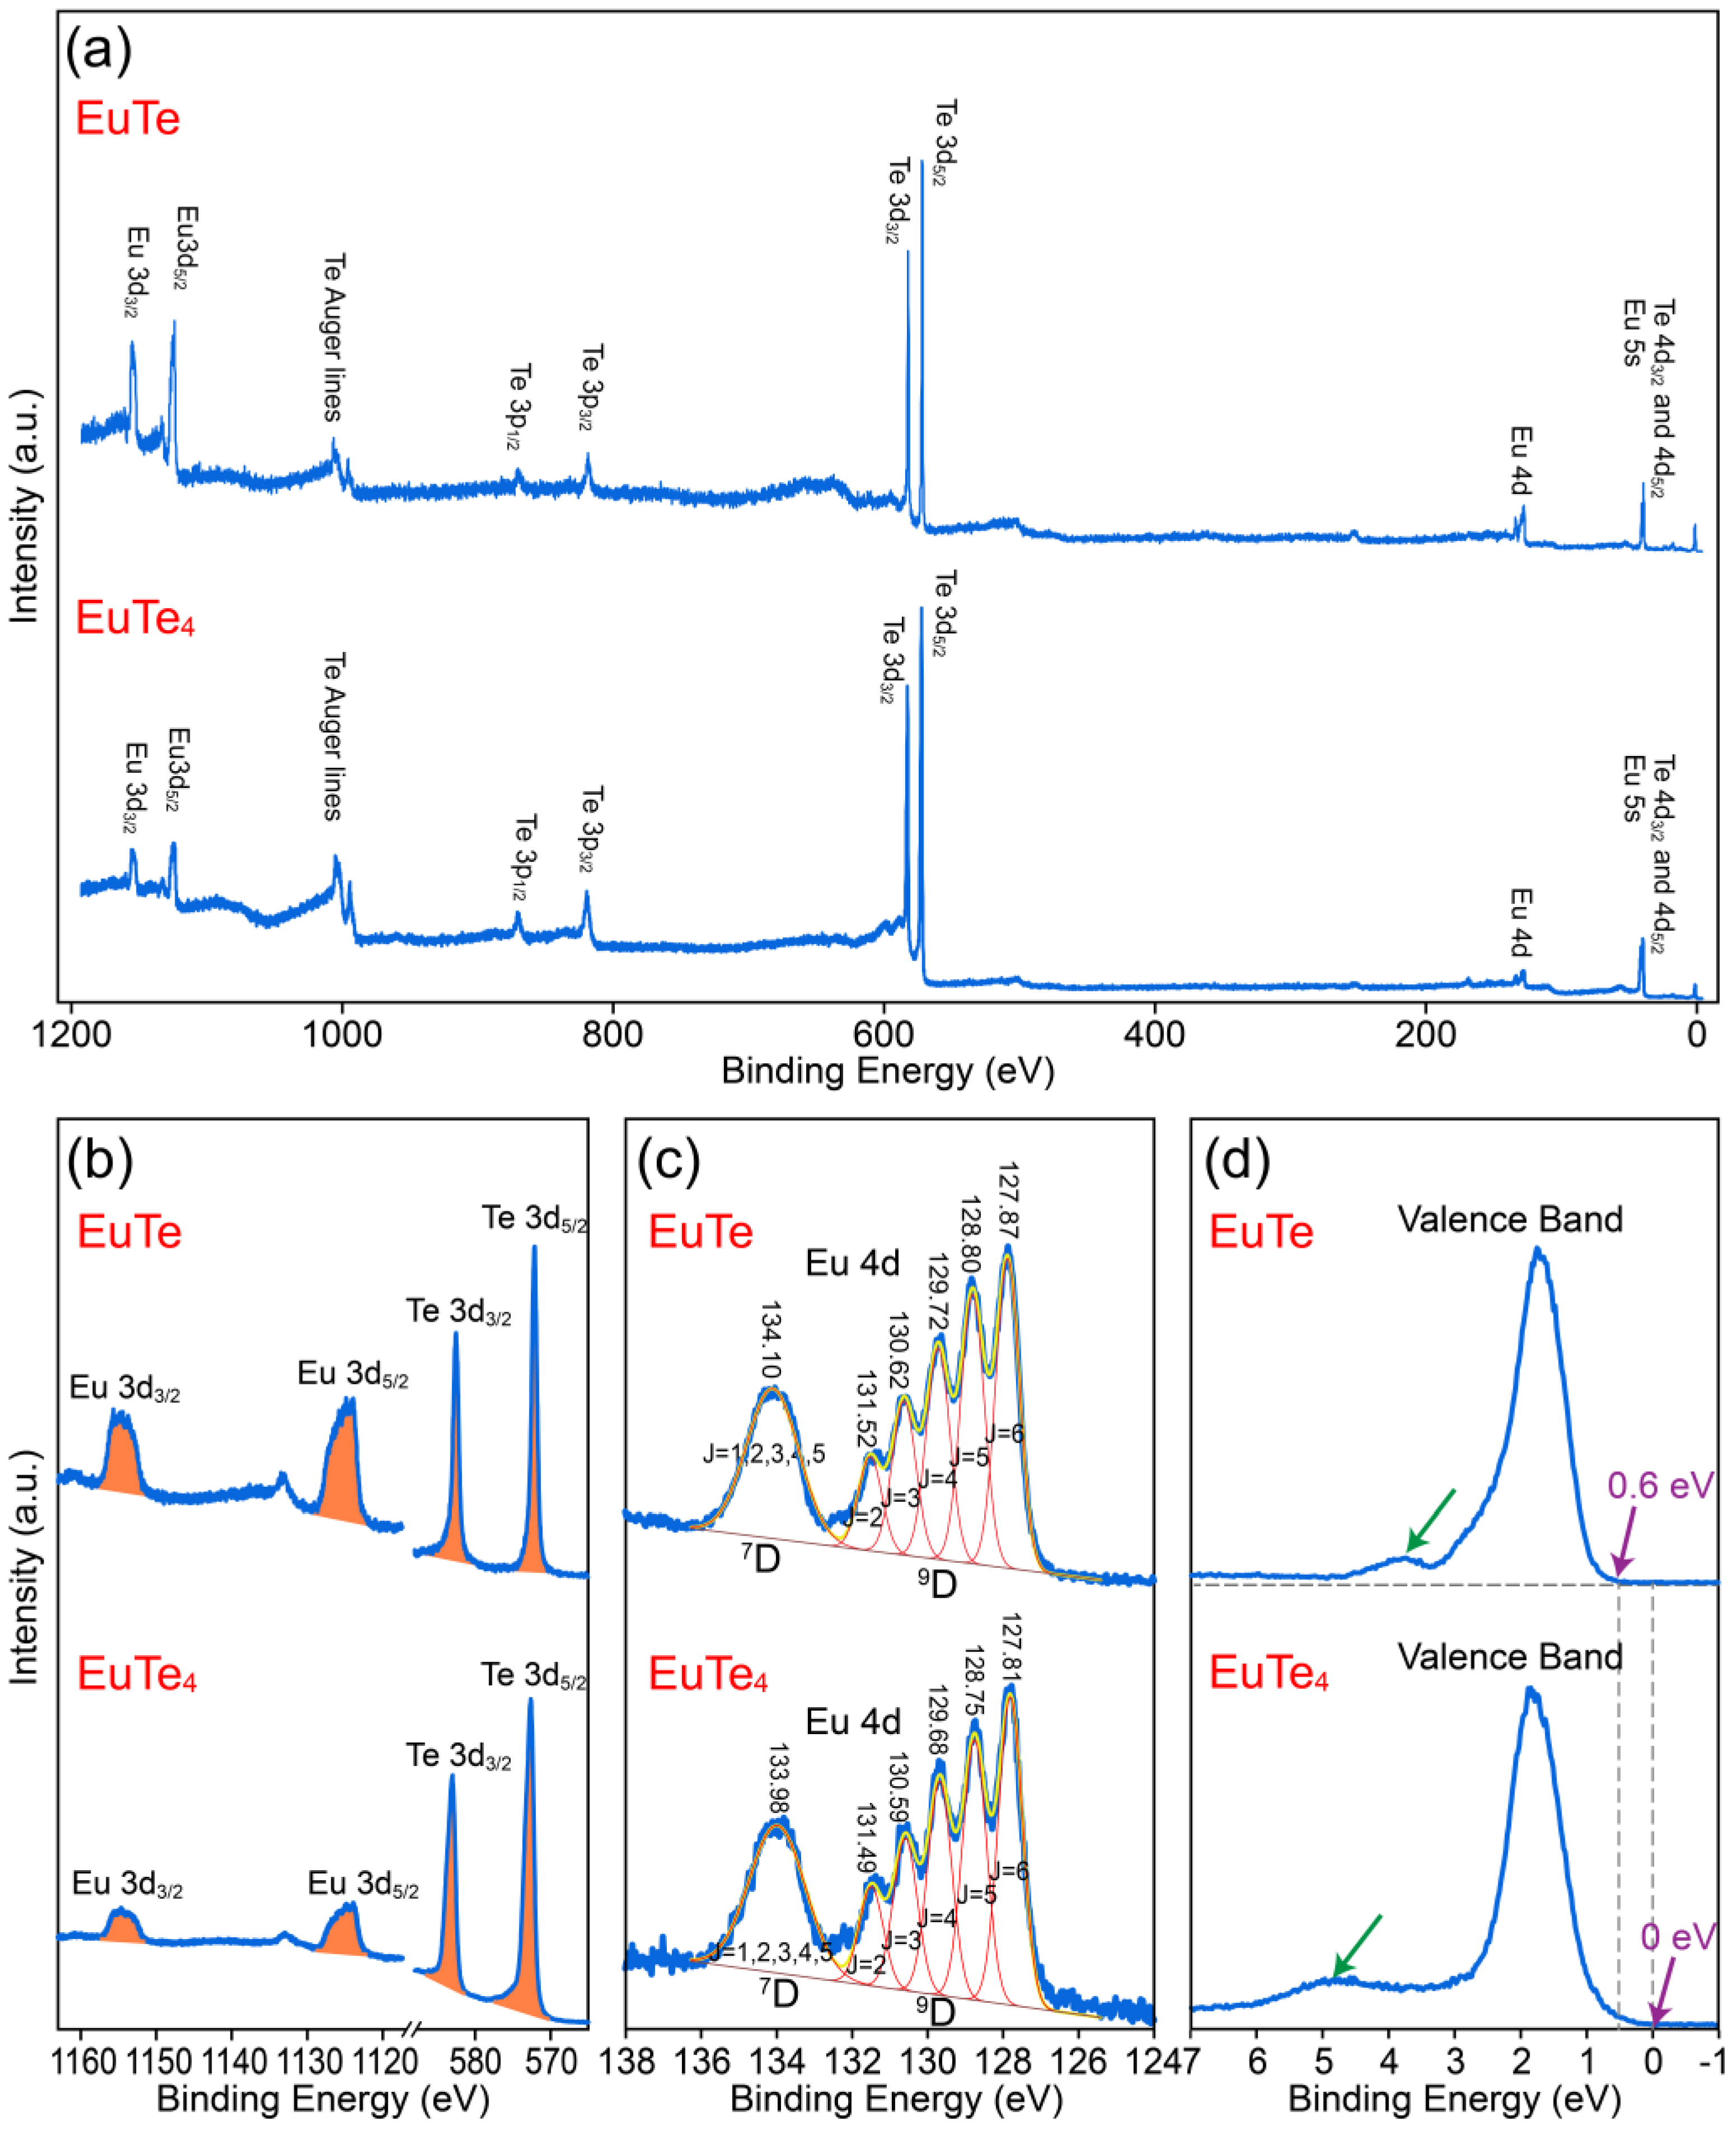
3.2. XPS Differences in EuTe and EuTe4

The elemental stoichiometry and valence states of EuTe and EuTe4 films were investigated by in situ XPS, with all measurements performed at 300 K. Figure 4a illustrates the full-range XPS spectra for EuTe (upper section) and EuTe4 (lower section). The two spectra exhibit significant differences, with the signal intensity of Eu 3d3/2 and Eu 3d5/2 orbitals in EuTe being notably higher than that in EuTe4, indicating a higher concentration of Eu in EuTe. To study the ratio of Te to Eu in EuTe and EuTe4, we present a detailed scan of Eu 3d3/2, Eu 3d5/2, Te 3d3/2, and Te 3d5/2 orbitals in Figure 4b. The relative peak areas of each peak after background subtraction are listed in the left half of Table 1, where the peak area of the Te 3d5/2 orbital was normalized as unit one. It shows that the peak area ratios of the 3d3/2 to 3d5/2 orbitals for each element in both the EuTe and EuTe4 closely match a 2:3 distribution, which is in line with the characteristics of p-orbital electrons in XPS spectra, indicating our treatment of peak areas is accurate. The right half of Table 1 lists the comparative area ratios of Eu’s individual 3d orbital to those of Te 3d orbitals. We further calculated the quotient of this ratio in EuTe relative to that in EuTe4, as shown in Table 2. This result provides a representation of the relative Te content in EuTe4 compared to EuTe. The resultant value ranges from approximately 3.79 to 3.93, closely approximating 4, which implies the Te content in the EuTe4 is about four times compared to that in EuTe. The error primarily stems from the different photon–electron cross-sections of the different Te elements in EuTe and EuTe4.
Figure 4c displays the detailed scanning spectra along with the fitting curves of Eu 4d orbitals in EuTe and EuTe4, respectively, where the position of each peak is listed above the corresponding curve The leftmost peak of each Eu 4d orbital comprises five orbitals 7D1, 7D2, 7D3, 7D4, and 7D5, and the five peaks on the right represent the five orbitals 9D2, 9D3, 9D4, 9D5, and 9D6 [36]. The 4d orbital spectra in EuTe and EuTe4 show similar peak shapes and positions within the experimental error range, further confirming that the valence state of Eu remains unchanged (+2 state) in EuTe and EuTe4.
Meanwhile, we present the XPS spectra near the Fermi level in Figure 4d. The peak width and position of their respective leftmost peaks (highlighted by the green arrows) exhibit distinct differences. Specifically, this peak in EuTe4 exhibits a broader width compared to that in EuTe, and its peak position shifts to a deeper binding energy. Moreover, the spectrum of EuTe cuts off at ~0.6 eV, indicating that EuTe is a semiconductor with its valence band maximum located ~0.6 eV below the Fermi level. This is consistent with the 2.26 eV band gap observed in EuTe on the BaF2(111) substrate [37]. In contrast, the spectrum for EuTe4 stretches close to the Fermi level. From an energy band theory perspective, we can infer from the XPS spectrum that EuTe4 exhibits a density of states in the vicinity of the Fermi level (from –0.2 to 0 eV). Considering that our XPS resolution is ~0.2 eV, this result suggests that EuTe4 is either a small gap semiconductor or a metallic material. Previous ARPES results reported that EuTe4 has a CDW gap of ~0.2 eV at the Fermi level [7,8,19]. This value aligns well with our XPS measurements, especially considering the XPS resolution of ~0.2 eV.

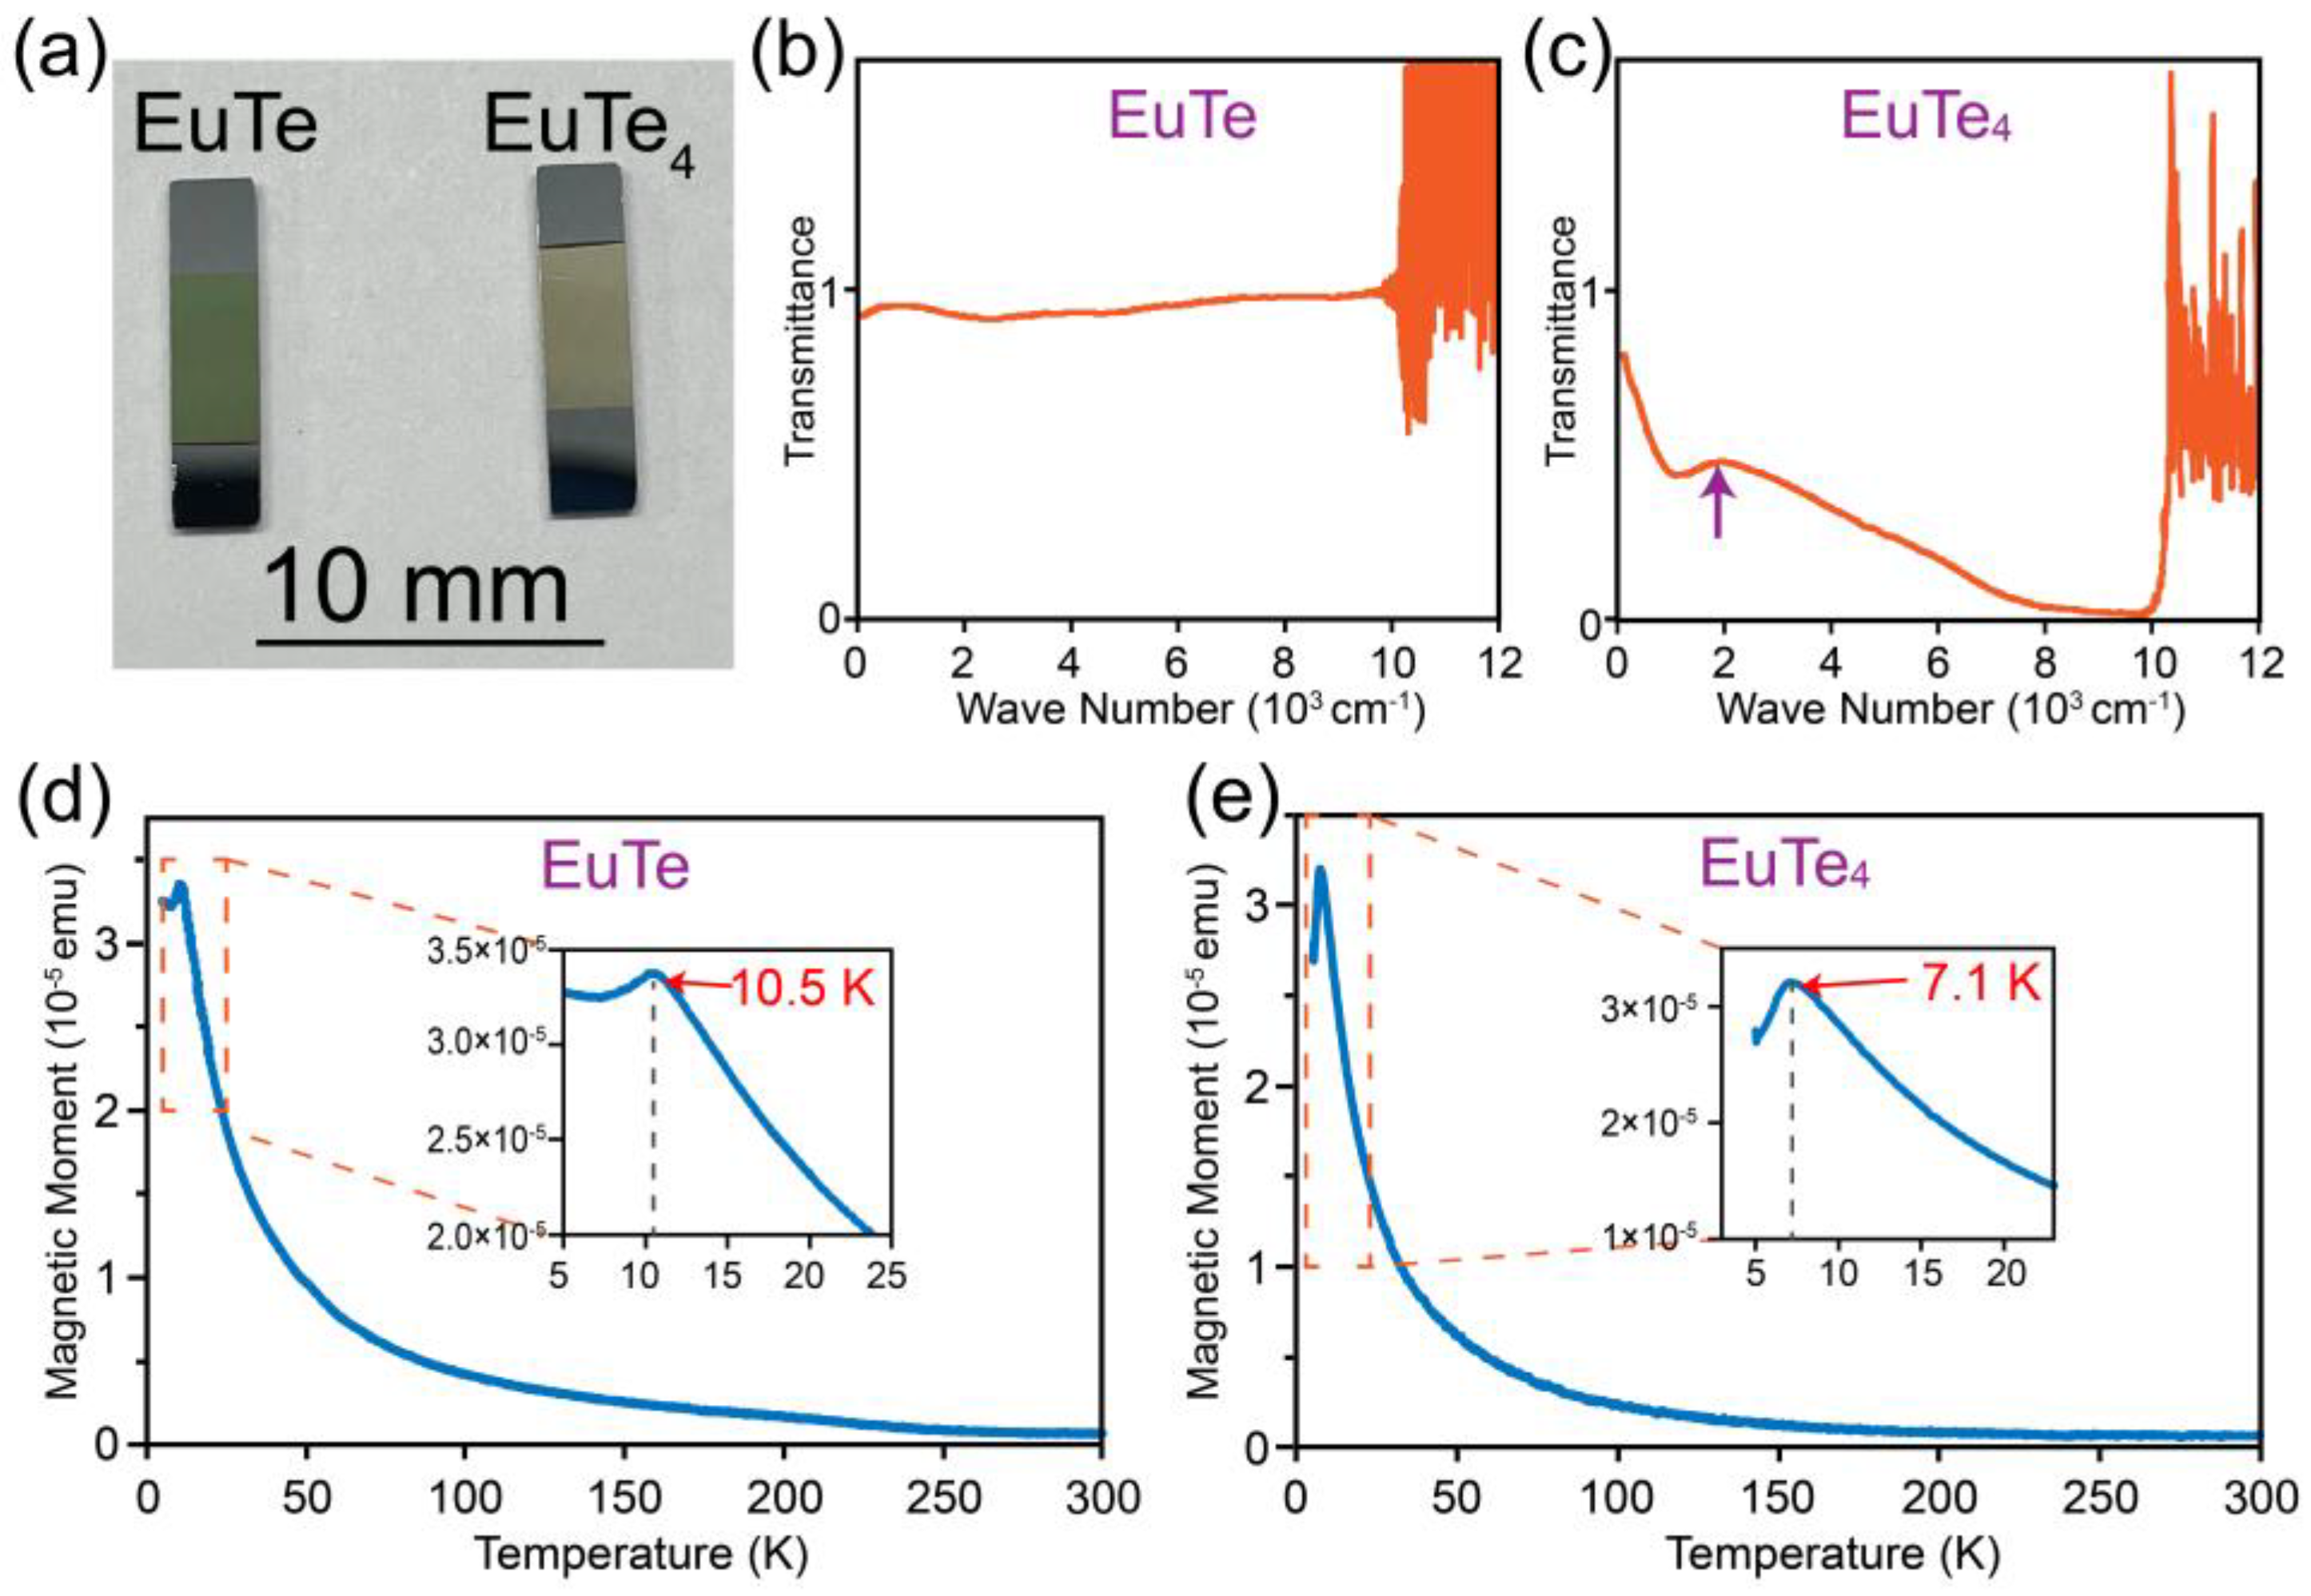
3.3. Physical Property Characterizations of EuTe and EuTe4

We conducted ex situ transmittance spectroscopy on the two films, which is a widely used technique in probing the band gap of a material [37]. Figure 5a displays a photograph of EuTe and EuTe4 films before transmittance spectroscopy characterization. Notably, the films exhibit distinctly different colors, where EuTe appears green and EuTe4 is golden yellow, indicating the transmittance spectra of the two films are different.
Figure 5b,c present the transmittance spectra of EuTe and EuTe4, respectively. The process of transmittance spectroscopy characterization involves two steps. We first measured the transmittance spectrum of the apparatus and silicon substrate, represented as T1 = Tappa × Tsub, which serves as a reference value. The result of T1 is shown in Supplementary Material Part B. Then we measured the transmittance spectrum of the apparatus, silicon substrate, and film: T2 = Tappa × Tsub × Tfilm. Dividing the two values yields the transmittance spectrum of the film: Tfilm. The band gap of our silicon substrate is approximately 1.1 eV, which corresponds to a wavenumber close to 10,000 cm−1. As a result, the transmittance spectrum of silicon substrate drops sharply to zero beyond this value. This leads to an indeterminate form in the Tfilm expression, resembling 0/0. Consequently, the transmittance spectrum for our film diverges above ~10,000 cm−1, making the data valid only for a wavenumber below this threshold.
In Figure 5b, the transmittance spectrum for EuTe is flat and remains close to 1 within the experimentally accessible range, indicating that EuTe is a semiconductor with a band gap exceeding 1.1 eV. This is consistent with the earlier optical transmittance measurement on EuTe grown on the BaF2 substrate, which identified a band gap of 2.26 eV [37].
In contrast, the transmittance curve for EuTe4 in Figure 5c presents a distinct absorption edge around 1900 cm−1 (highlighted by the purple arrow), corresponding to an energy of approximately 0.23 eV. Previous ARPES experiments have demonstrated the presence of a gap in EuTe4 induced by CDW at room temperature, with a size of ~0.2 eV [7,8,19]. This matches the energy of the absorption edge observed in our transmittance spectrum. Thus, this absorption edge is a manifestation of the CDW gap, specifically attributed to optical electron excitations across the CDW gap of ~0.23 eV.
Figure 5d,e are the magnetic moment versus temperature (M−T) curves of EuTe and EuTe4. The shapes of the two curves are very similar, both exhibiting sharp peaks at low temperatures, which is a typical feature of antiferromagnetic material. Here, we magnified and plotted the details of these curves at low temperatures in the inset. Consequently, we can derive the Néel temperatures of EuTe and EuTe4 to be 10.5 and 7.1 K, respectively, which are consistent with the 9.8 and 7.1 K reported in previous magnetic susceptibility measurements [18,20].

4. Conclusions

In conclusion, we have successfully synthesized high-quality EuTe and EuTe4 thin films on Si(100) substrates. Our study improves the growth procedure of epitaxial EuTe films and fills the research gap in the synthesis of two-dimensional EuTe4 films. We conducted a comprehensive study on the structural and energy spectra characterization of the two materials, confirming their antiferromagnetic nature. We also verified the semiconductive property of EuTe and found the CDW signature of EuTe4 at room temperature. By tailoring the substrate temperature, we have achieved selective growth of these two materials, opening new possibilities for their physical property control. Our research on rare earth tellurides has enriched the library of 2D materials. The high-quality growth of the film paves the way for subsequent related research such as 2D magnetism and charge density waves, and also facilitates the exploration of potential applications in electronics.

Supplementary Materials

The following supporting information can be downloaded at: https://www.mdpi.com/article/10.3390/ma16227093/s1, Supplementary Material: A. Optimization of substrate temperature; B. More details on the transmittance spectroscopy.

Author Contributions

Conceptualization, F.Y. and Y.Z.; Methodology, F.Y., J.L., D.W. and Y.Z.; Validation, F.Y., J.L., D.W., G.W. and Y.Z.; Formal Analysis, F.Y. and Y.Z.; Investigation, F.Y., X.Q., J.Z., L.H. and B.Y.; Data Curation F.Y. and Y.Z.; Visualization F.Y. and Y.Z.; Writing—Original Draft Preparation, F.Y.; Writing—Review and Editing, G.W. and Y.Z.; Supervision, J.L., D.W., G.W. and Y.Z.; Project Administration, Y.Z.; Funding Acquisition, Y.Z. All authors have read and agreed to the published version of the manuscript.

Funding

This work is supported by the National Natural Science Foundation of China (No. 92165205), the Innovation Program for Quantum Science and Technology of China (No. 2021ZD0302803), the National Key Research and Development Program of China (No. 2018YFA0306800), and the Program of High-Level Entrepreneurial and Innovative Talents Introduction of Jiangsu Province, China.

Institutional Review Board Statement

Not applicable.

Informed Consent Statement

Not applicable.

Data Availability Statement

The data presented in this study are available on request from the corresponding author.

Acknowledgments

We are deeply grateful to Junhu Zhang from Nanjing University for their helpful discussions on XRD data. We thank Zhe Liu, Xiaoxiang Zhou and Yaomin Dai from Nanjing University for their assistance on the transmittance characterizations. We thank Qinghao Meng, Qichao Tian and Kaili Wang from Nanjing University for their assistance on the MBE growth of samples and transmittance characterizations.

Conflicts of Interest

The authors declare no competing interest.

References

  1. Kogar, A.; Zong, A.; Dolgirev, P.E.; Shen, X.; Straquadine, J.; Bie, Y.-Q.; Wang, X.; Rohwer, T.; Tung, I.C.; Yang, Y.; et al. Light-induced charge density wave in LaTe3. Nat. Phys. 2020, 16, 159–163. [Google Scholar] [CrossRef]
  2. Brouet, V.; Yang, W.L.; Zhou, X.J.; Hussain, Z.; Ru, N.; Shin, K.Y.; Fisher, I.R.; Shen, Z.X. Fermi surface reconstruction in the CDW state of CeTe3 observed by photoemission. Phys. Rev. Lett. 2004, 93, 126405. [Google Scholar] [CrossRef] [PubMed]
  3. Lee, E.; Kim, D.H.; Kim, H.W.; Denlinger, J.D.; Kim, H.; Kim, J.; Kim, K.; Min, B.I.; Min, B.H.; Kwon, Y.S.; et al. The 7 × 1 Fermi surface reconstruction in a two-dimensional f -electron charge density wave system: PrTe3. Sci. Rep. 2016, 6, 30318. [Google Scholar] [CrossRef] [PubMed]
  4. Yumigeta, K.; Qin, Y.; Li, H.; Blei, M.; Attarde, Y.; Kopas, C.; Tongay, S. Advances in rare-earth tritelluride quantum materials: Structure, properties, and synthesis. Adv. Sci. 2021, 8, 2004762. [Google Scholar] [CrossRef] [PubMed]
  5. Liu, J.S.; Huan, S.C.; Liu, Z.H.; Liu, W.L.; Liu, Z.T.; Lu, X.L.; Huang, Z.; Jiang, Z.C.; Wang, X.; Yu, N.; et al. Electronic structure of the high-mobility two-dimensional antiferromagnetic metal GdTe3. Phys. Rev. Mater. 2020, 4, 114005. [Google Scholar] [CrossRef]
  6. Lei, S.; Lin, J.; Jia, Y.; Gray, M.; Topp, A.; Farahi, G.; Klemenz, S.; Gao, T.; Rodolakis, F.; McChesney, J.L.; et al. High mobility in a van der Waals layered antiferromagnetic metal. Sci. Adv. 2020, 6, eaay6407. [Google Scholar] [CrossRef] [PubMed]
  7. Lv, B.Q.; Zong, A.; Wu, D.; Rozhkov, A.V.; Fine, B.V.; Chen, S.-D.; Hashimoto, M.; Lu, D.-H.; Li, M.; Huang, Y.B.; et al. Unconventional hysteretic transition in a charge density wave. Phys. Rev. Lett. 2022, 128, 036401. [Google Scholar] [CrossRef]
  8. Zhang, Q.Q.; Shi, Y.; Zhai, K.Y.; Zhao, W.X.; Du, X.; Zhou, J.S.; Gu, X.; Xu, R.Z.; Li, Y.D.; Guo, Y.F.; et al. Thermal hysteretic behavior and negative magnetoresistance in the charge density wave material EuTe4. Phys. Rev. B 2023, 107, 115141. [Google Scholar] [CrossRef]
  9. Van Houten, S. Magnetic interaction in EuS, EuSe, and EuTe. Phys. Lett. 1962, 2, 215–216. [Google Scholar] [CrossRef]
  10. Oliveira, N.F.; Foner, S.; Shapira, Y.; Reed, T.B. EuTe. I. Magnetic behavior of insulating and conducting single crystals. Phys. Rev. B 1972, 5, 2634–2646. [Google Scholar] [CrossRef]
  11. Silberstein, R.P.; Schmutz, L.E.; Tekippe, V.J.; Dresselhaus, M.S.; Aggarwal, R.L. Magnetic phase-dependent Raman scattering in EuSe and EuTe. Solid State Commun. 1976, 18, 1173–1177. [Google Scholar] [CrossRef]
  12. Will, G.; Pickart, S.J.; Nathans, R. Antiferromagnetic structure of EuTe. J. Phys. Chem. Solids 1963, 24, 1679–1681. [Google Scholar] [CrossRef]
  13. Springholz, G.; Bauer, G. Strain relaxation by coherent three-dimensional islanding in molecular-beam epitaxy of EuTe on PbTe(111). Phys. Rev. B 1993, 48, 10998–11009. [Google Scholar] [CrossRef] [PubMed]
  14. Kępa, H.; Springholz, G.; Giebultowicz, T.M.; Goldman, K.I.; Majkrzak, C.F.; Kacman, P.; Blinowski, J.; Holl, S.; Krenn, H.; Bauer, G. Magnetic interactions in EuTe epitaxial layers and EuTe/PbTe superlattices. Phys. Rev. B 2003, 68, 024419. [Google Scholar] [CrossRef]
  15. Bergomi, L.; Chen, J.J. Magnetic susceptibility of EuTe/PbTe Heisenberg antiferromagnetic superlattices: Experimental and theoretical studies. Phys. Rev. B 1997, 56, 3281–3289. [Google Scholar] [CrossRef]
  16. Zinn, W. Microscopic studies of magnetic properties and interactions recent results on europium-monochalcogenides. J. Magn. Magn. Mater. 1976, 3, 23–36. [Google Scholar] [CrossRef]
  17. Wachter, P. Chapter 19 Europium chalcogenides: EuO, EuS, EuSe and EuTe. In Handbook on the Physics and Chemistry of Rare Earths; Elsevier: Amsterdam, The Netherlands, 1979; Volume 2, pp. 507–574. [Google Scholar]
  18. Scheer, E.; Wosnitza, J.; v. Löhneysen, H.; Kürsch, R.; Lang, M.; Steglich, F. Critical exponents of EuTe from specific-heat and thermal-expansion measurements. J. Magn. Magn. Mater. 1992, 104–107, 175–176. [Google Scholar] [CrossRef]
  19. Zhang, C.; Wu, Q.-Y.; Yuan, Y.-H.; Zhang, X.; Liu, H.; Liu, Z.-T.; Zhang, H.-Y.; Song, J.-J.; Zhao, Y.-Z.; Wu, F.-Y.; et al. Angle-resolved photoemission spectroscopy study of charge density wave order in the layered semiconductor EuTe4. Phys. Rev. B 2022, 106, L201108. [Google Scholar] [CrossRef]
  20. Wu, D.; Liu, Q.M.; Chen, S.L.; Zhong, G.Y.; Su, J.; Shi, L.Y.; Tong, L.; Xu, G.; Gao, P.; Wang, N.L. Layered semiconductor EuTe4 with charge density wave order in square tellurium sheets. Phys. Rev. Mater. 2019, 3, 024002. [Google Scholar] [CrossRef]
  21. Rathore, R.; Pathak, A.; Gupta, M.K.; Mittal, R.; Kulkarni, R.; Thamizhavel, A.; Singhal, H.; Said, A.H.; Bansal, D. Evolution of static charge density wave order, amplitude mode dynamics, and suppression of Kohn anomalies at the hysteretic transition in EuTe4. Phys. Rev. B 2023, 107, 024101. [Google Scholar] [CrossRef]
  22. Springholz, G.; Bauer, G.; Schilcher, K. Epitaxial growth of EuTe on PbTe (111) influenced by strain-induced coherent 3D islanding. MRS Online Proc. Libr. 1993, 317, 137. [Google Scholar] [CrossRef]
  23. Springholz, G.; Yuan, S.; Bauer, G.; Kriechbaum, M.; Krenn, H. EuTe/PbTe superlattices: MBE growth and optical characterization. MRS Online Proc. Libr. 1993, 301, 353. [Google Scholar] [CrossRef]
  24. Frank, N.; Springholz, G.; Bauer, G.H. Strain induced islanding of EuTe epitaxial films observed by in-situ RHEED and STM investigations. Mater. Sci. Forum 1993, 143–147, 1623–1628. [Google Scholar] [CrossRef]
  25. Chen, J.J.; Dresselhaus, G.; Dresselhaus, M.S.; Springholz, G.; Pichler, C.; Bauer, G. Magnetization studies of type-II antiferromagnetic EuTe/PbTe superlattices. Phys. Rev. B 1996, 54, 402–410. [Google Scholar] [CrossRef] [PubMed]
  26. Heiss, W.; Prechtl, G.; Springholz, G. Giant tunability of exciton photoluminescence emission in antiferromagnetic EuTe. Phys. Rev. B 2001, 63, 165323. [Google Scholar] [CrossRef]
  27. Ramachandran, V.; Smith, A.R.; Feenstra, R.M.; Greve, D.W. Temperature dependence of molecular beam epitaxy of GaN on SiC (0001). J. Vac. Sci. Technol. A 1999, 17, 1289–1293. [Google Scholar] [CrossRef]
  28. Saito, Y.; Harima, H.; Kurimoto, E.; Yamaguchi, T.; Teraguchi, N.; Suzuki, A.; Araki, T.; Nanishi, Y. Growth temperature dependence of indium nitride crystalline quality grown by RF-MBE. Phys. Status Solidi 2002, 234, 796–800. [Google Scholar] [CrossRef]
  29. Zhang, L.; Yang, T.; Feng, Y.P.; Wee, A.T.S.; Wang, Z. MBE-grown ultrathin PtTe2 films and their layer-dependent electronic structures. Nanoscale 2022, 14, 7650–7658. [Google Scholar] [CrossRef] [PubMed]
  30. Xu, H.; Han, D.; Bao, Y.; Cheng, F.; Ding, Z.; Tan, S.J.R.; Loh, K.P. Observation of gap opening in 1T′ phase MoS2 nanocrystals. Nano Lett. 2018, 18, 5085–5090. [Google Scholar] [CrossRef] [PubMed]
  31. Chen, P.; Pai, W.W.; Chan, Y.H.; Sun, W.L.; Xu, C.Z.; Lin, D.S.; Chou, M.Y.; Fedorov, A.V.; Chiang, T.C. Large quantum-spin-Hall gap in single-layer 1T’ WSe2. Nat. Commun. 2018, 9, 2003. [Google Scholar] [CrossRef] [PubMed]
  32. Feng, R.; Wang, W.; Bao, C.; Zhang, Z.; Wang, F.; Zhang, H.; Yao, J.; Xu, Y.; Yu, P.; Ji, S.-H.; et al. Selective control of phases and electronic structures of monolayer TaTe2. Adv. Mater. 2023, 2302297. [Google Scholar] [CrossRef]
  33. Knall, J.; Sundgren, J.E.; Hansson, G.V.; Greene, J.E. Indium overlayers on clean Si (100) 2 × 1: Surface structure, nucleation, and growth. Surf. Sci. 1986, 166, 512–538. [Google Scholar] [CrossRef]
  34. Cai, X.; Lu, Z.; Xu, Z.; Meng, F.; Zhang, Q.; Gu, L.; Feng, J.; Ji, S.-H.; Li, N.; Chen, X. Growth of (111)-orientated GdTe and TmTe thin films by van der Waals molecular beam epitaxy. J. Phys. Chem. C 2021, 125, 15465–15471. [Google Scholar] [CrossRef]
  35. Koppensteiner, E.; Springholz, G.; Hamberger, P.; Bauer, G. Molecular beam epitaxy of PbTe/EuTe superlattices and their structural investigation by x-ray diffraction using reciprocal space mapping. J. Appl. Phys. 1993, 74, 6062–6071. [Google Scholar] [CrossRef]
  36. Hüfner, S. Core levels and final states. Photoelectron. Spectrosc. Princ. Appl. 2003, 61–107. [Google Scholar] [CrossRef]
  37. Heiss, W.; Kirchschlager, R.; Springholz, G.; Chen, Z.; Debnath, M.; Oka, Y. Magnetic polaron induced near-band-gap luminescence in epitaxial EuTe. Phys. Rev. B 2004, 70, 035209. [Google Scholar] [CrossRef]
Figure 1. Three-dimensional (left panels), front (middle panels), and top views (right panels) of the (a) EuTe and (b) EuTe4 lattice. The yellow balls represent the Eu atoms, the purple balls represent the Te atoms in the middle layer (Temid) of EuTe4, and the green balls represent the Te atoms in other positions. The blue solid rectangles indicate the respective unit cells, while the red double-headed arrows denote the single-layer thickness of both films.
Materials 16 07093 g001
Figure 2. (a,b) RHEED patterns of a Si(100) substrate with incident beam angles of 0° and 45°, respectively. (c) Corresponding top view lattice arrangement for Si(100). The black arrows in (c) represent the incident direction of electron beams, while the blue and red arrows between atoms denote the RHEED diffraction stripe spacings as indicated in (a,b). The in-plane lattice constants, derived from the subsequent STEM analyses, are also annotated in the lattice arrangement diagram of (c). (di) Analogous to (ac) for (df) a ~10 nm EuTe film and (gi) a ~10 nm EuTe4 film.
Materials 16 07093 g002
Figure 3. (a) XRD patterns of a Si(100) substrate (black curve), a ~20 nm EuTe4 film (blue curve), and a ~20 nm EuTe film (red curve). The vertical purple dashed lines serve as guides to highlight the spectral differences between EuTe and EuTe4. (b) STEM image (side-view) for a ~10 nm EuTe film, corresponding to the (010) plane of EuTe. (c) Intensity profile corresponding to the red solid line in (b). (d,e) Analogous to (b,c) for a ~10 nm EuTe4 film.
Materials 16 07093 g003
Figure 4. XPS spectra for ~10 nm EuTe (top of each panel) and EuTe4 (bottom of each panel) films, including (a) the full range spectra, (b) the spectra for Eu 3d and Te 3d orbitals, (c) the spectra for Eu 4d orbital, and (d) the spectra near Fermi level. The horizontal gray dashed line in (d) denotes the baseline of EuTe spectra, while the vertical gray dashed lines indicate the cutoff energy of EuTe and EuTe4, respectively.
Materials 16 07093 g004
Figure 5. (a) Photograph of the epitaxial EuTe and EuTe4 films. (b,c) Transmittance curves of ~20 nm thick EuTe and EuTe4 film, respectively. (d,e) M−T curves of ~40 nm thick EuTe and EuTe4 film, respectively. Insets in (d,e) are the corresponding magnified curves at low temperatures.
Materials 16 07093 g005
Table 1. Normalized peak areas of Eu and Te 3d orbits and their comparative ratios.
EuTeEuTe4 EuTeEuTe4
Eu 3d3/20.9340.238Te 3d3/2:Eu 3d3/20.7182.719
Eu 3d5/21.4230.362Te 3d5/2:Eu 3d3/21.0714.211
Te 3d3/20.6710.646Te 3d3/2:Eu 3d5/20.4711.782
Te 3d5/211Te 3d5/2:Eu 3d5/20.7032.760
Table 2. Ratio of Te content in EuTe4 to EuTe, based on the data in Table 1.
Te 3d3/2:Eu 3d3/2Te 3d5/2:Eu 3d3/2Te 3d3/2:Eu 3d5/2Te 3d5/2:Eu 3d5/2
EuTe4:EuTe3.7873.9333.7833.928
Disclaimer/Publisher’s Note: The statements, opinions and data contained in all publications are solely those of the individual author(s) and contributor(s) and not of MDPI and/or the editor(s). MDPI and/or the editor(s) disclaim responsibility for any injury to people or property resulting from any ideas, methods, instructions or products referred to in the content.

