Article

Nitrogen- and Sulfur-Codoped Strong Green Fluorescent Carbon Dots for the Highly Specific Quantification of Quercetin in Food Samples

Department of Physics, Gachon University, Seongnam-si 13120, Gyeonggi-do, Republic of Korea
*
Author to whom correspondence should be addressed.
Materials 2023, 16(24), 7686; https://doi.org/10.3390/ma16247686
Submission received: 25 November 2023 / Revised: 14 December 2023 / Accepted: 15 December 2023 / Published: 17 December 2023

Abstract

:
Carbon dots (CDs) doped with heteroatoms have garnered significant interest due to their chemically modifiable luminescence properties. Herein, nitrogen- and sulfur-codoped carbon dots (NS-CDs) were successfully prepared using p-phenylenediamine and thioacetamide via a facile process. The as-developed NS-CDs had high photostability against photobleaching, good water dispersibility, and excitation-independent spectral emission properties due to the abundant amino and sulfur functional groups on their surface. The wine-red-colored NS-CDs exhibited strong green emission with a large Stokes shift of up to 125 nm upon the excitation wavelength of 375 nm, with a high quantum yield (QY) of 28%. The novel NS-CDs revealed excellent sensitivity for quercetin (QT) detection via the fluorescence quenching effect, with a low detection limit of 17.3 nM within the linear range of 0–29.7 μM. The fluorescence was quenched only when QT was brought near the NS-CDs. This QT-induced quenching occurred through the strong inner filter effect (IFE) and the complex bound state formed between the ground-state QT and excited-state NS-CDs. The quenching-based detection strategies also demonstrated good specificity for QT over various interferents (phenols, biomolecules, amino acids, metal ions, and flavonoids). Moreover, this approach could be effectively applied to the quantitative detection of QT (with good sensing recovery) in real food samples such as red wine and onion samples. The present work, consequently, suggests that NS-CDs may open the door to the sensitive and specific detection of QT in food samples in a cost-effective and straightforward manner.

1. Introduction

Flavonoids are secondary metabolites that belong to the polyphenolic compounds. Quercetin (3,3′,4′,5,7-pentahydroxyflavone; QT) is a member of the flavonol subclass in the flavonoid family and is naturally found in a wide range of vegetables, fruits, and beverages. It abundantly exists in capers, onions, broccoli, apples, cherries, and berries, as well as in red wine, cocoa, and tea [1]. QT has been the subject of interest owing to its in vitro antioxidant properties for scavenging free radicals, which are favorable for human health and disease prevention [2,3]. Moreover, the catechol ring and OH groups in its chemical structure qualify QT to partake in potent biological activities, including antiviral, antiallergic, anti-inflammatory, antimutagenic, anticarcinogenic, and cardioprotective activities [4,5]. However, high dietary consumption of QT may lead to headaches, renal failure, and poor glutathione S-transferase activity [6,7]. Therefore, the detection of QT is highly crucial for pharmaceutical chemistry, biochemistry, and clinical medicine.
Traditional methods available for the detection of QT, including spectrophotometry, electrochemical detection, capillary electrophoresis, and high-performance liquid chromatography (HPLC), are restricted in their application due to the limitations resulting from sophisticated instrumentation, operational difficulty, sluggish real-time responsivity, and poor sensitivity [8,9,10,11]. On the other hand, the fluorescence-based analytical technique has generated much attention for the quantitative detection of various organic and inorganic analytes because of its benefits over other approaches, including its rapid responsivity, superior sensitivity, high specificity, inherent simplicity, and low operating costs [12,13,14]. Fluorophores usually include metal nanoclusters, semiconductor quantum dots (QDs), and organic dyes [15,16,17]. Despite their high quantum yield and chemical stability, these materials are usually very toxic and complex to synthesize [18].
Zero-dimensional (0D) carbon-based nanomaterials, known as carbon quantum dots or carbon dots (CDs), have been gaining popularity as a novel class of sensing probes in fluorescence-based analytical techniques [19]. CDs, quasi-spherical nanomaterials with size confinement below 10 nm, were accidentally discovered in 2004 during the purification process of single-walled carbon nanotubes (CNTs) [20]. They have many advantages, such as tunable spectral luminescence, reduced overlap between excitation and emission spectra, good biocompatibility, low toxicity, high chemical stability, excellent photostability, good water-dispersibility, and the availability of abundant sources [21]. These special qualities lead them to be exploited in biomedicine, catalysis, optoelectronics, and sensing [22]. Still, most of the fabricated CDs have a lower quantum yield (QY) than conventional QDs, which limits their practical use [23,24].
The fluorescence characteristics of CDs arise from the quantum size effects, carbon-core states, conjugated π-domains, molecule states, and surface states [25,26]. It is highly expected that surface states are the main source of fluorescence—so-called fluorescence centers, created by the synergistic hybridization of carbon-core and associated chemical groups [27]. Very recently, heteroatom doping has become a more convenient strategy for engineering the surface states and electron distribution in CDs to greatly enhance their fluorescence properties [28]. The introduction of heteroatoms would create more surface states for electron trapping, which facilitates improved radiative recombination that results in a high QY, excitation-independent emission, and emission redshift [27,29]. Among the various heteroatoms for doping, nitrogen is a popular dopant because its atomic radius (0.075 nm) is comparable to that of carbon (0.077 nm). Similarly, the electronegativity of sulfur (2.58) is nearly equivalent to that of carbon (2.55), which enables easier electron transition [30,31]. Sulfur also significantly increases the density of graphitic nitrogen, which results in a redshift in the emission spectrum [32]. Hence, the codoping of nitrogen (N) and sulfur (S) atoms into CDs allows us to expect the synergistic effect of the two individual dopants.
We fabricated N- and S-codoped CDs (NS-CDs) using two simple precursors, i.e., p-phenylenediamine (p-PD) and thioacetamide, through a one-step solvothermal route with ethanol as a solvent. The p-PD has two –NH2 groups, while thioacetamide has C–NH2 and C=S groups. In contrast to previously reported CDs for QT sensing, the current NS-CDs were prepared under mild reaction conditions without any acids, complex molecules, or metal salts. The as-synthesized NS-CDs exhibited a large Stokes shift (~125 nm) with green emission for the excitation at 375 nm. However, the fluorescence was effectively quenched by QT through the inner filter effect (IFE), with a noticeable color change from green to a colorless solution. The quenching-based sensing strategy offered the lowest detection limit of 17.3 nM within the linear range of 0–29.7 μM, with good specificity against various interfering elements. The present work enabled the quantification of QT in food samples, which would be beneficial for maintaining good health and preventing chronic diseases. A diagram of the NS-CDs’ synthesis and QT detection is given in Scheme 1.

2. Materials and Methods

2.1. Chemicals

The p-PD, thioacetamide, hydroquinone (HQ), bovine serum albumin (BSA), resorcinol (Res), catechol (Cat), serotonin (Ser), dopamine (Dop), cysteine (Cys), and methionine (Met) were procured from Sigma Aldrich, St. Louis, MO, USA. Lysine (Lys), rutin trihydrate (Rut), and ethanol were supplied by Daejung Chemicals, Siheung, Republic of Korea. All of the reagents were used directly, without any purification. For all of the analyses, ultrapure water (18.2 MΩ-cm) collected from the Milli-Q system (Millipore, Burlington, VT, USA) was used.

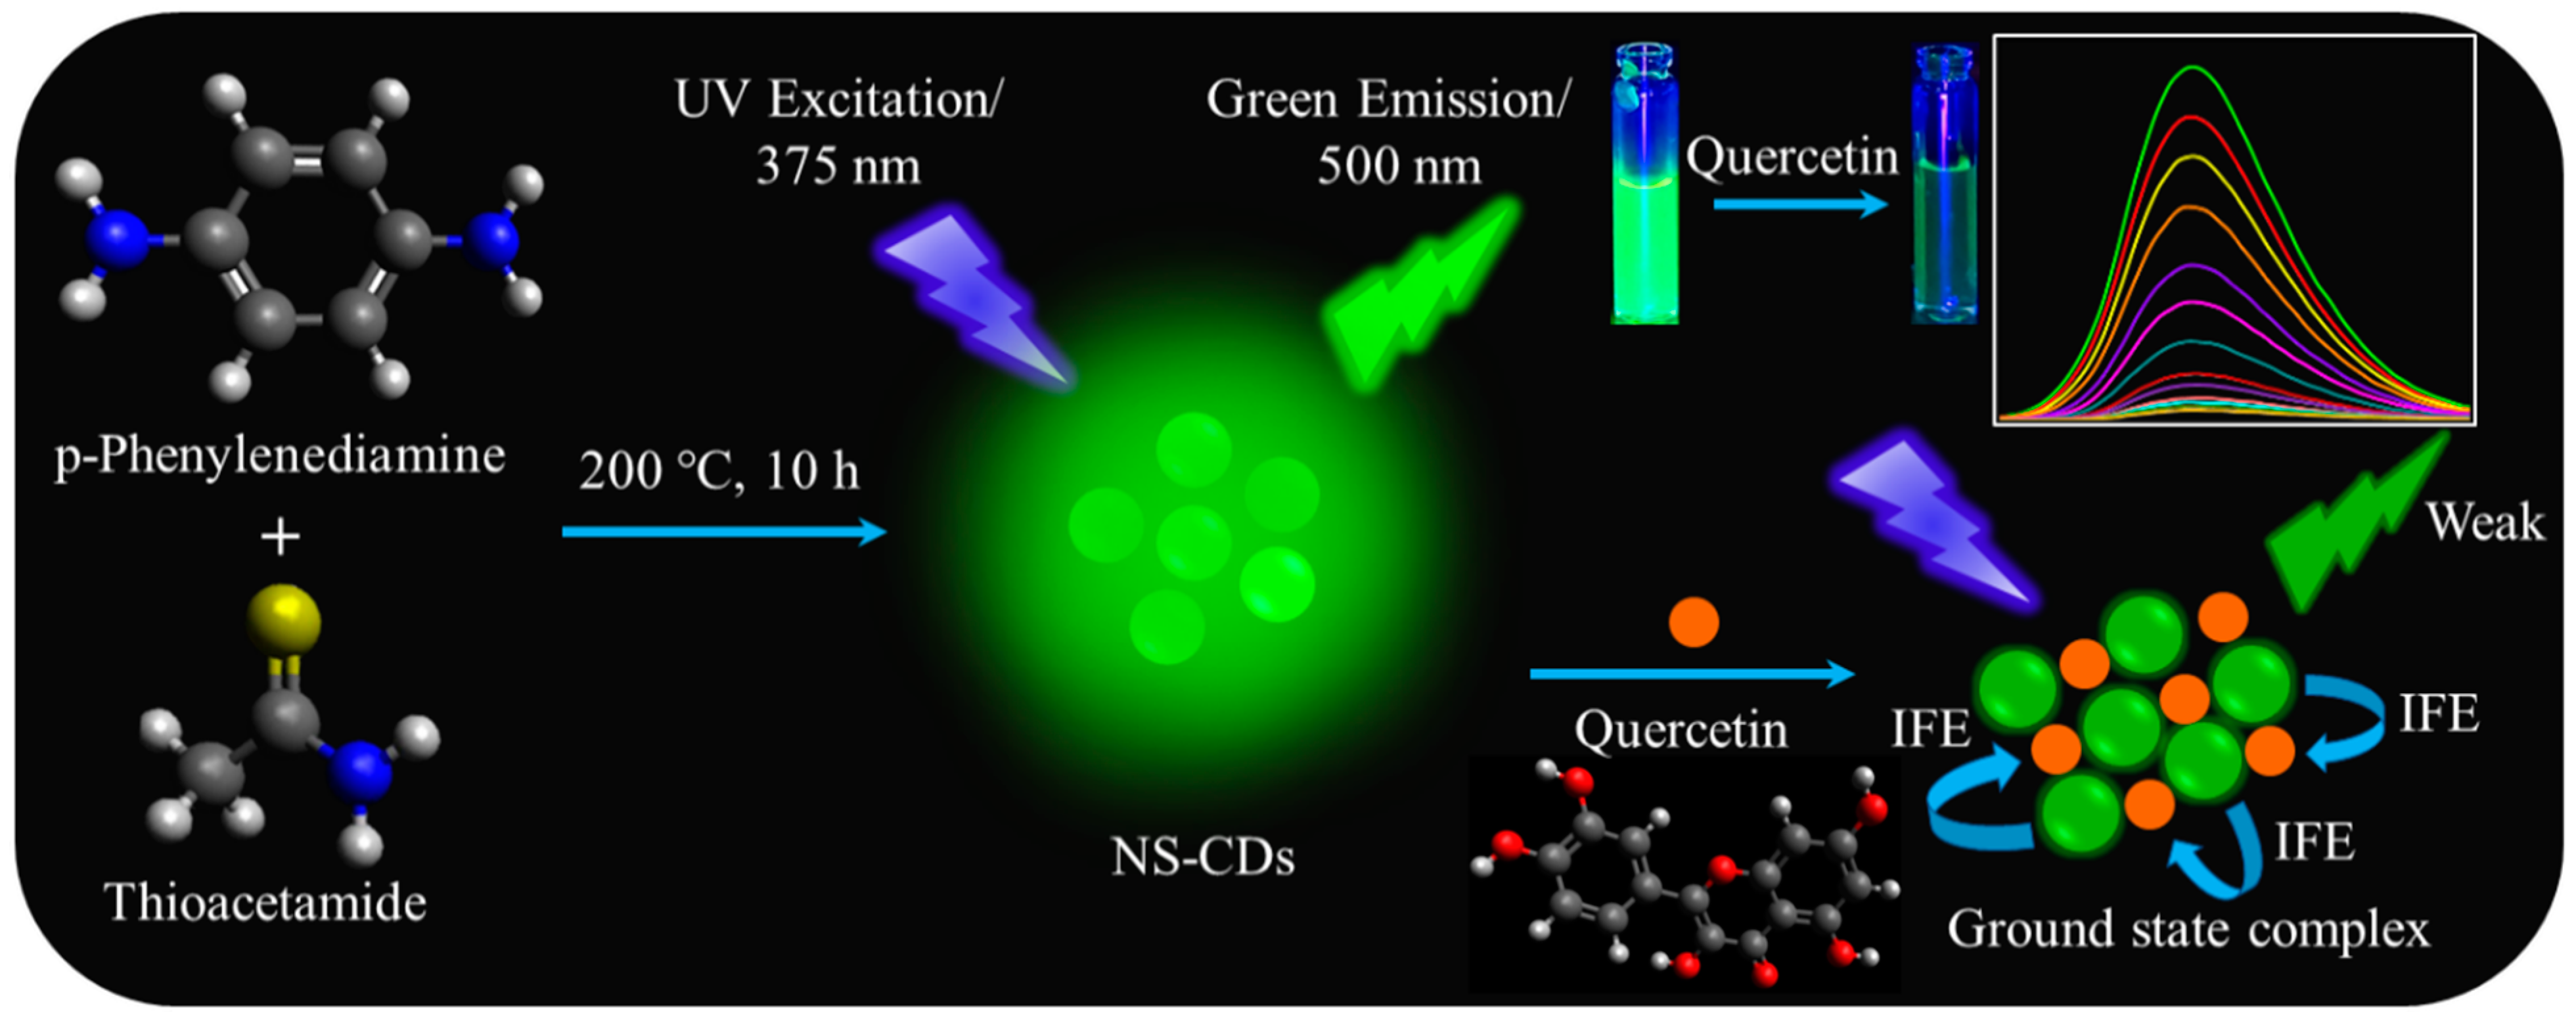
2.2. Preparation of NS-CDs

Typically, 0.108 g of p-PD was weighed and dissolved in 5 mL of ethanol to prepare a 0.1 M solution of p-PD. With this solution, 0.15 M thioacetamide (0.112 g) dissolved in 5 mL of ethanol was gently mixed on a magnetic stirrer. The solution (net volume of 10 mL) was ultrasonicated for 5 min and then shifted to a 50 mL Teflon liner covered by a stainless steel vessel. The reactor was permitted to undergo a solvothermal reaction for 10 h inside an oven (Daihan Scientific, Wonju, Republic of Korea) at 180 °C temperature. After the reaction time was completed, the solution was spontaneously cooled to room temperature and centrifuged using a centrifuge (Combi-514R, Hanil Co., Ltd., Seoul, Republic of Korea) at 10,000 rpm for 10 min. Subsequently, the supernatant was lyophilized at a temperature of −80 °C using a freeze-dryer (FD8508, IlShinBioBase, Seoul, Republic of Korea) and stored at 4 °C for further use. The amount of NS-CDs recovered at the end of the preparation was 0.084 g.

2.3. Characterization of NS-CDs

Transmission electron microscopy (TEM) images were collected using a transmission electron microscope (Tecnai G2 F30, FEI, Hillsboro, Oregon, USA) at an operating voltage of 300 kV. The chemical compositions were examined using an X-ray photoelectron spectroscope with a monochromatic Al Kα source (VG MultiLab/2000, Thermo Scientific, Waltham, MA, USA). Fourier-transform infrared (FT-IR) spectra were measured using an FT-IR spectrometer (FT-IR/4600, JASCO, Tokyo, Japan). UV–vis absorption was studied on a spectrophotometer (V/770, JASCO, Tokyo, Japan). Photoluminescence spectra were recorded on a fluorescence spectrophotometer (FS/2, SCINCO, Seoul, Republic of Korea) at room temperature using a 1 cm path-length quartz cell. The slit width was set to 5 nm for both excitation and emission. The relative QY (Ф) was determined by measuring the emission intensity with a spectrofluorometer (Fluorolog3, Horiba, Tokyo, Japan). Fluorescence lifetime measurements were conducted by Fluorolog3 (Horiba, Tokyo, Japan) with a time-correlated single-photon counting instrument equipped with a 390 nm laser.

2.4. Quantum Yield (Ф) Measurement

The relative QY of NS-CDs, i.e., ФCD, was determined by a standard method using rhodamine B as a reference (ФR = 31% in water), with the equation given by [33]:
Ф C D = Ф R I C D A R I R A C D n C D n R 2
where I is the integrated emission intensity. The subscripts “CD” and “R” represent the NS-CDs and rhodamine B, respectively. A is the absorbance and n is the refractive index of the solvent. Both NS-CDs and rhodamine B were dissolved in water. Hence, the values of nCD and nR were taken as 1.33. The absorbance of fluorophore solutions was maintained below 0.05 to minimize the reabsorption of emitted light.

2.5. Fluorescence Sensing of QT

To determine the fluorescence response of NS-CDs towards QT, the NS-CDs solution (500 μL) was dispersed in phosphate buffer (10 mM, pH = 7). Then, the final volume of the solution was adjusted to 3 mL by adding water and used as a fluorescence probe. After 2 min of incubation time, the solution was excited at 375 nm, and the fluorescence intensity (F0) of the emission at 500 nm was recorded in the wavelength range of 470–700 nm. Successively, various quantities of quercetin (3.3–39.6 μL) were introduced into the NS-CDs solution, and the fluorescence intensities were recorded. F0 and F are the fluorescence intensities of the NS-CDs in the absence and presence of QT, respectively. To study the specificity of the NS-CDs towards QT, common potential interferents (e.g., phenols, biomolecules, amino acids, metal ions, and flavonoids) were introduced into the NS-CDs solution under the same experimental conditions. The measurements were repeated five times (n = 5).

2.6. Recovery Test in Food Samples

Commercial red wine and onion were bought from a local supermarket (Emart, Seongnam, South Korea) for the purpose of real sample analysis of the NS-CDs fluorescence probe. The red wine sample was used directly as purchased. To prepare the onion sample, onion paste was made, centrifuged at 10,000 rpm for 10 min, filtered through a 0.45 μm filter membrane to remove the impurities, and then stored at 4 °C for analysis. The recovery study was performed by adding different concentrations of standard QT (0, 5.0, 10.0, 15.0, and 30.0 μM) to the red wine and onion samples in an aqueous medium. The pH value of all sample solutions was regulated to 7. The recovery (%) was estimated from the following equation [34]:
R e c o v e r y % = A m o u n t   o f   Q T   d e t e c t e d A m o u n t   o f   Q T   s p i k e d × 100

3. Results and Discussion

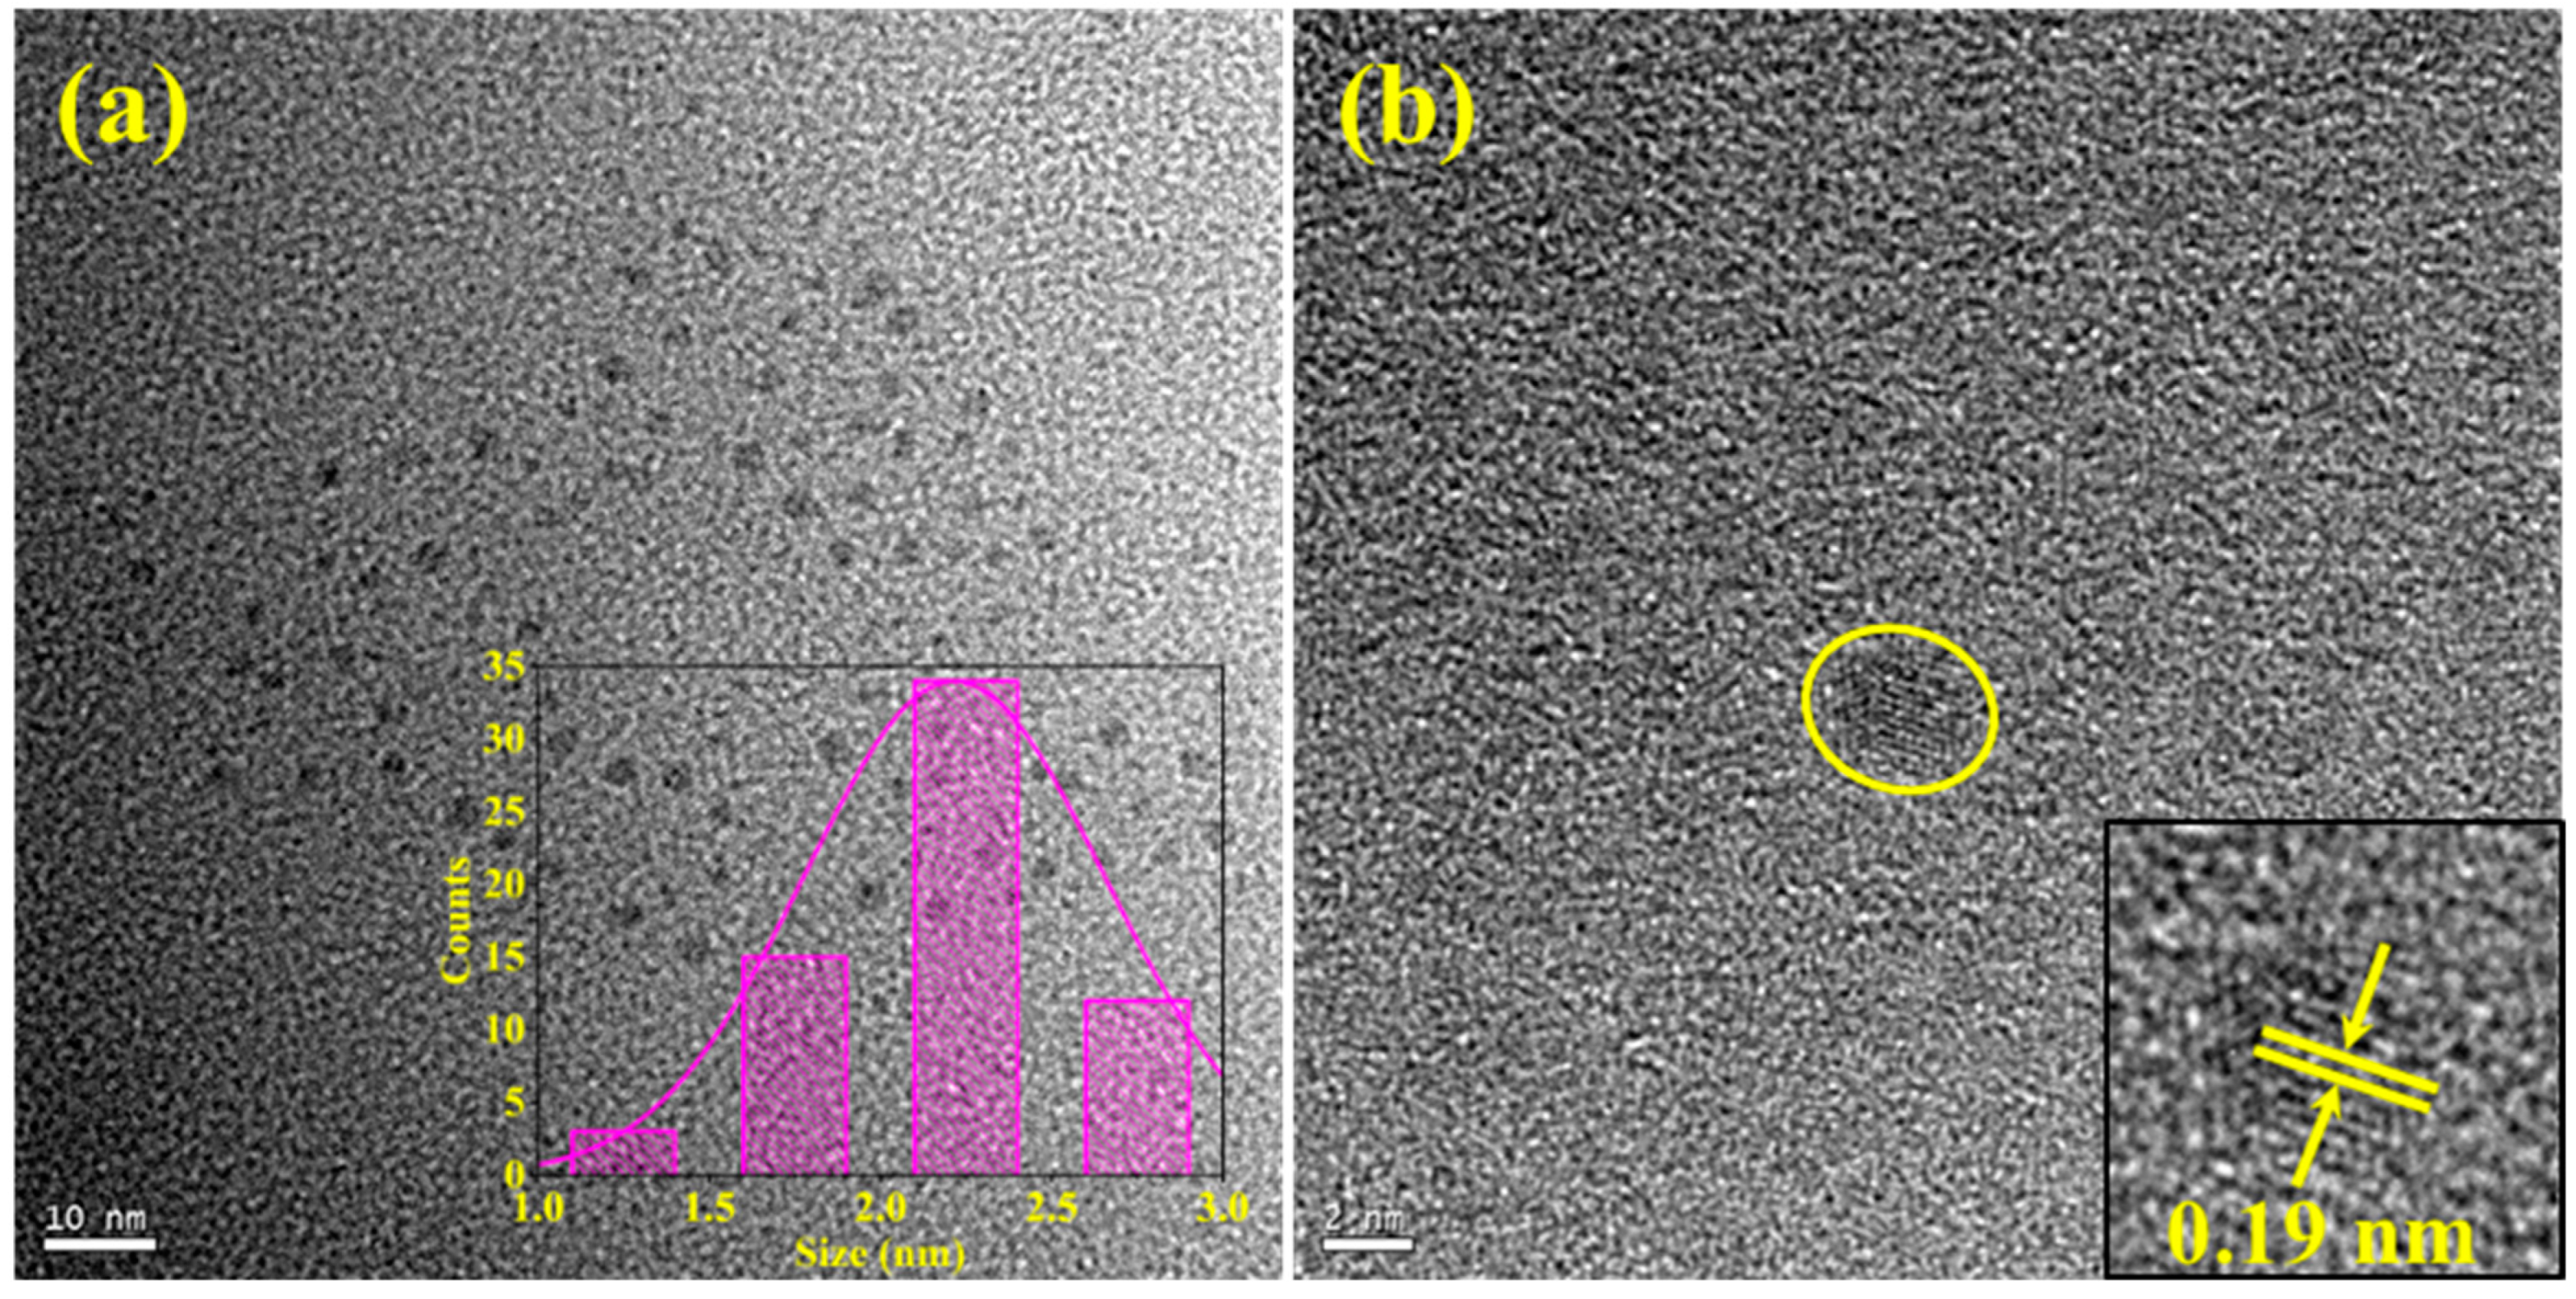
3.1. Analysis of Morphology and Chemical Compositions

The morphology and size distribution of the NS-CDs were examined using TEM and HR-TEM. Figure 1a displays a TEM image of NS-CDs that are spherical with uniform dispersibility. The particles are distributed between 1.1 nm and 3.7 nm, with an average size of 2.2 ± 0.41 nm (inset of Figure 1a). The average particle size and standard deviation were calculated from the histogram plotted by measuring the diameter of 65 particles using ImageJ 1.41 software. As shown in Figure 1b, the synthesized NS-CDs exhibited good crystallinity, with an interplanar spacing of 0.19 nm (inset of Figure 1b), which coincides with the (102) diffraction facets of graphitic carbon [35].
The functional groups on the surface of the NS-CDs were studied through FT-IR spectroscopy. In Figure S1, the peaks at 3346 cm−1 and 2972 cm−1 can be linked to the stretching vibrations of the N–H and C–H groups, respectively. The characteristic peaks centered at 1743 cm−1 and 1653 cm−1 correspond to the stretching vibrations of the C=C group. The peak located at 1382 cm−1 can be ascribed to the deformation vibrations of the O–H group. The peaks at 1084 cm−1 and 1045 cm−1 are assigned to the stretching vibrations of the C=S/C–O and C–N groups, respectively. The peaks at 833 cm−1 and 630 cm−1 are associated with the deformation vibrations and rocking vibrations of the C–H group, respectively [36,37,38]. The FT-IR spectral results confirm the existence of amino- and sulfur-containing groups on the NS-CDs’ surface.
Moreover, the surface chemical states and elemental compositions of the NS-CDs were revealed by XPS analysis. In Figure S2, the XPS survey scan discloses four peaks around 163.93 eV, 285.16 eV, 400.66 eV, and 531.45 eV, corresponding to S2p, C1s, N1s, and O1s, respectively. This indicates that the N and S atoms were successfully doped into the CDs. Particularly, the deconvoluted C1s spectrum in Figure 2a can be resolved into three different peaks at 284.63 eV, 286.05 eV, and 288.32 eV, which can be attributed to C–C/C=C, C–N/C–O, and C=O, respectively [39]. In the high-resolution N1s spectrum (Figure 2b), the two peaks located at 399.32 eV and 400.76 eV are due to the amino-N and pyrrolic-N groups, respectively [40]. The high-resolution O1s spectrum (Figure 2c) exhibits two peaks at 531.14 eV and 532.79 eV, which are assigned to the C=O and C–O–C/C–OH groups, respectively. The high-resolution S2p spectrum (Figure 2d) consists of two characteristic peaks at 163.33 eV and 164.61 eV, arising from the 2p3/2 and 2p1/2 positions in the C–S–C covalent bonds due to the spin–orbit coupling, respectively. Another peak located at 167.96 eV can be attributed to the presence of –C–SOx− (x = 2) species [39,41]. The XPS analysis results are in good agreement with the FT-IR measurements, verifying that the synthesized NS-CDs have rich nitrogen and sulfur groups to qualify NS-CDs with good luminescence properties.

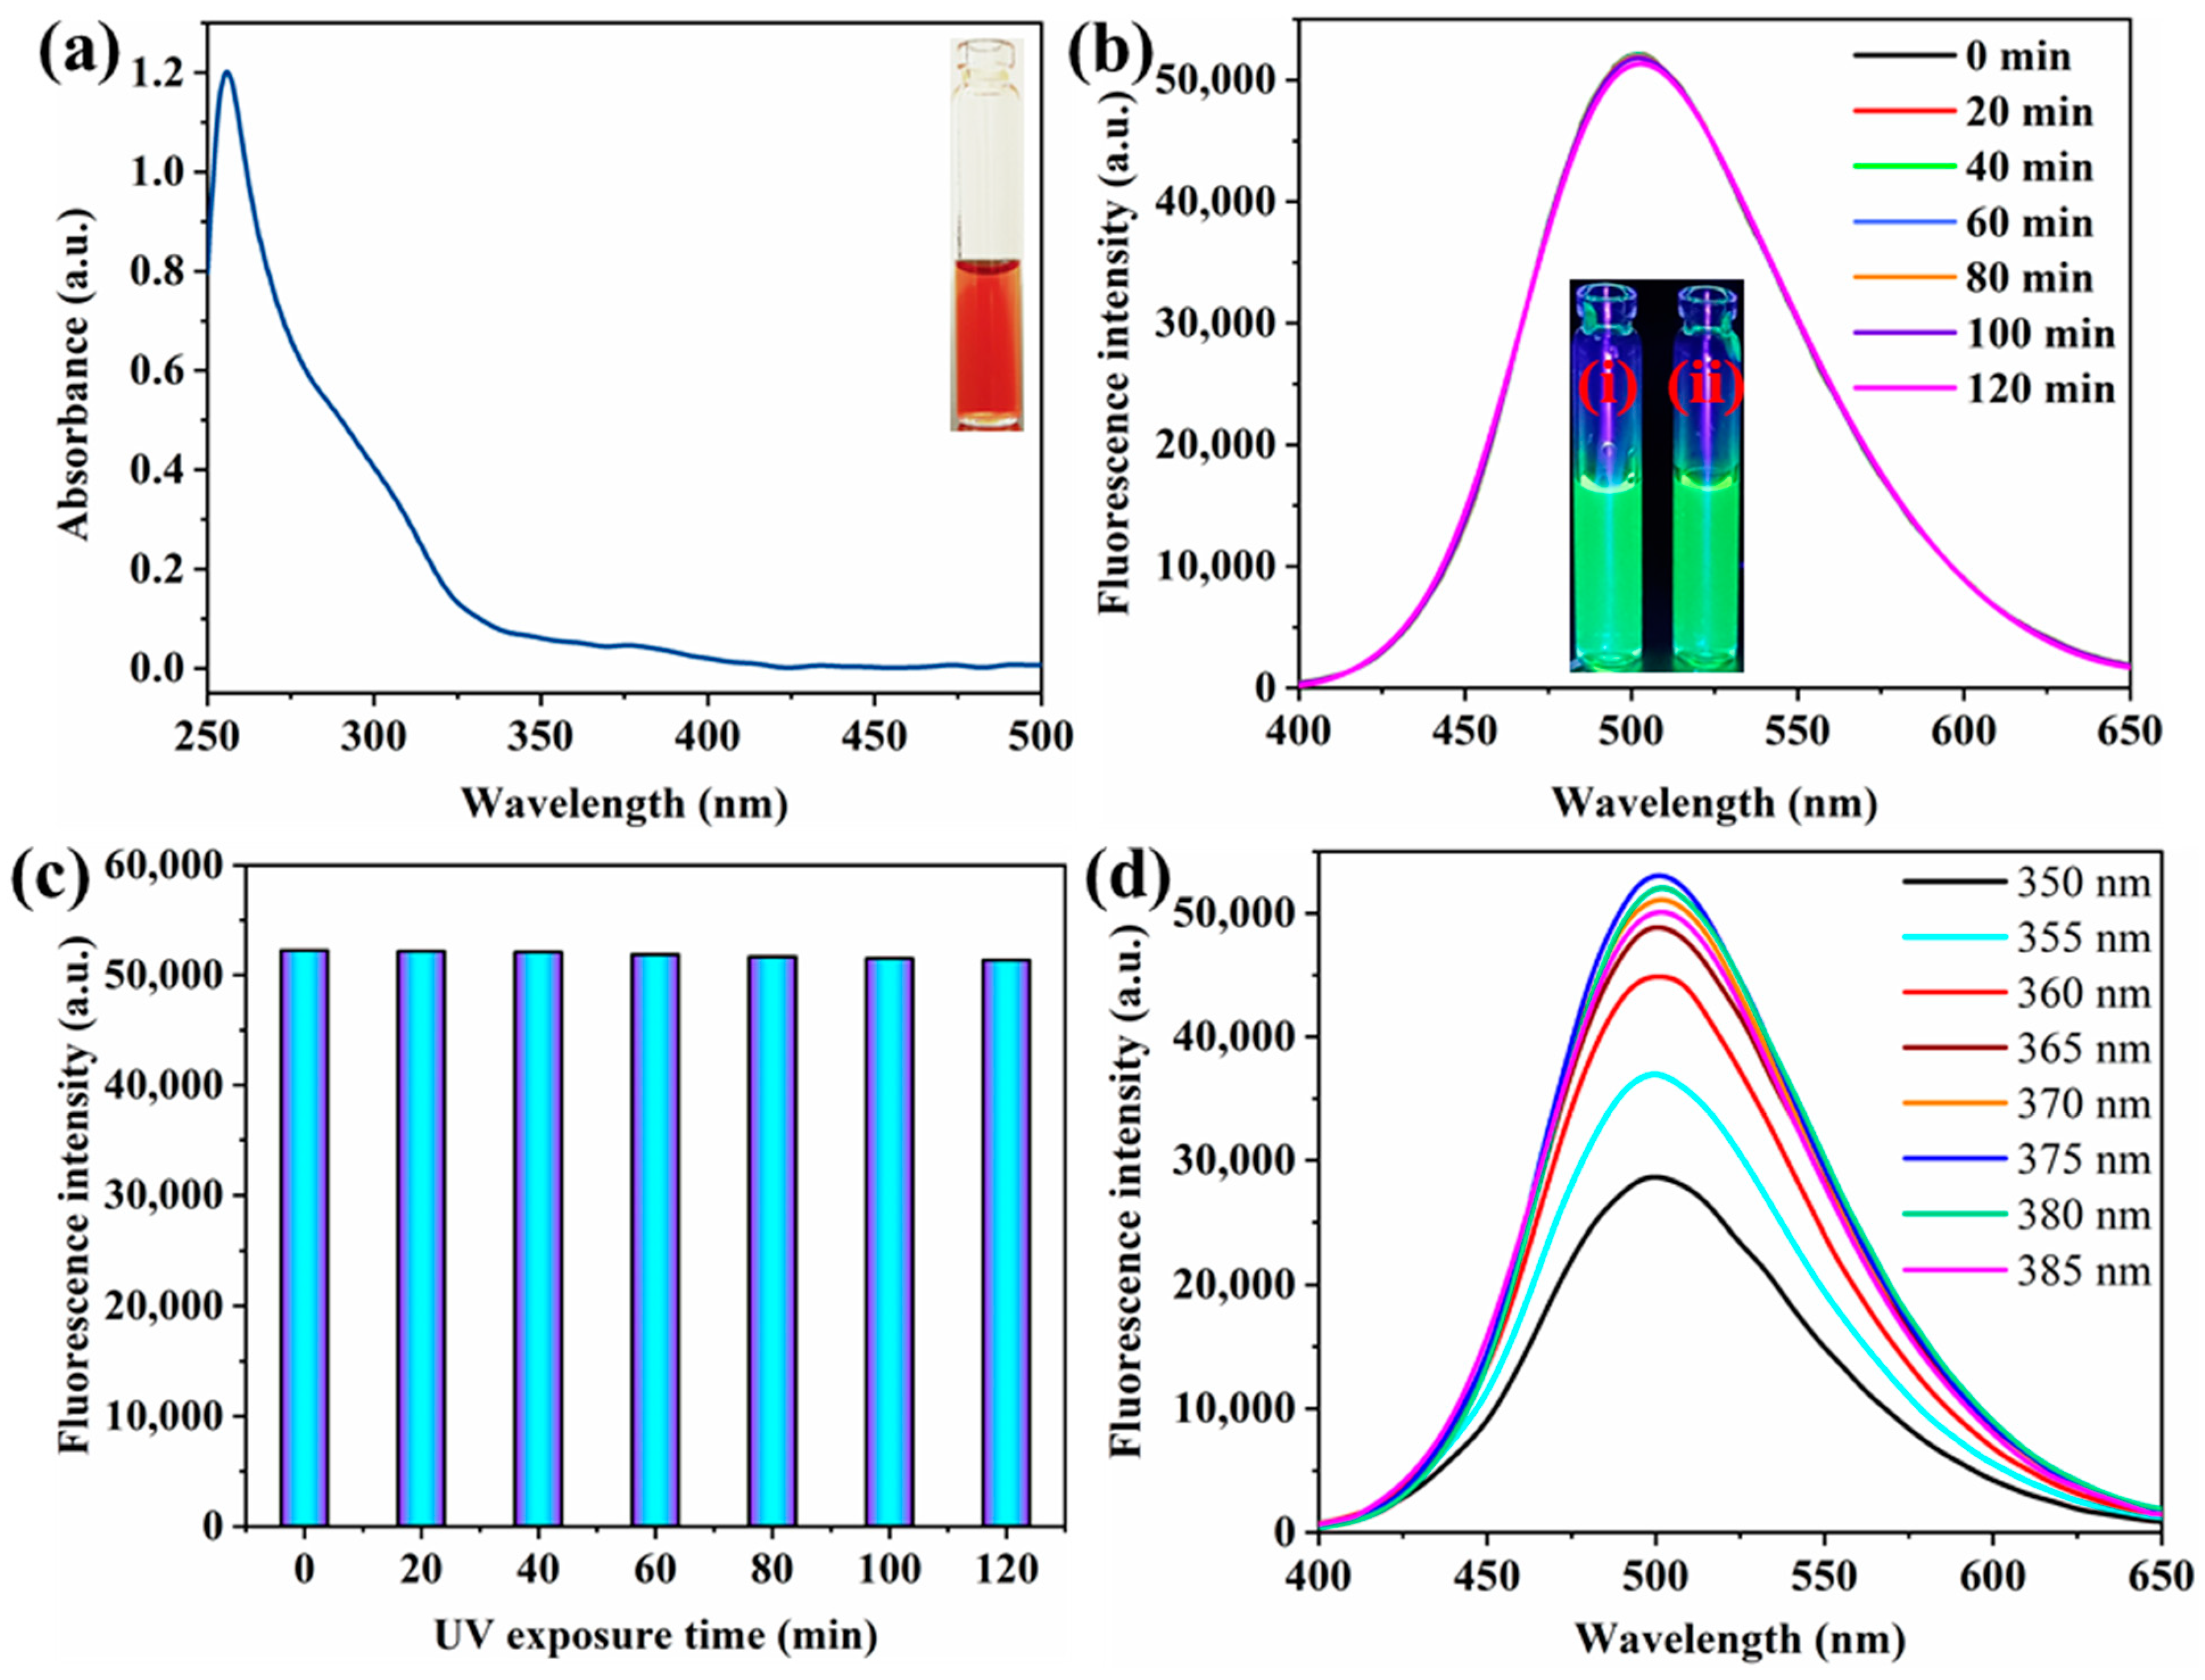
3.2. Optical Properties

The optical properties of the NS-CDs were investigated using UV–vis absorption and fluorescence spectra. In Figure 3a, a wide absorption region around 300 nm arises from the π–π* transitions of the aromatic sp2 domains [42]. Another absorption peak at 377 nm can be ascribed to the trapping of excited-state energy of the surface states contributed by the functional groups connected to the surface of the NS-CDs [43]. This peak might be consistent with the optimal excitation peak for NS-CDs. As shown in the inset of Figure 3a, the aqueous solution of NS-CDs was a wine-red color in visible light and displayed a strong green fluorescence under UV illumination (λ = 365 nm), illustrating the excellent luminescence properties of NS-CDs with good dispersibility. The photostability of the NS-CDs was verified at different time intervals (0, 20, 40, 60, 80, 100, and 120 min) by illuminating the NS-CDs with UV light continuously for up to 120 min. As displayed in Figure 3b, the fluorescence intensities were not significantly different before and after the UV illumination. This is further detailed by the bar chart in Figure 3c, showing that the NS-CDs have excellent photostability against photobleaching.
Figure 3d displays the fluorescence emission spectra of the NS-CDs for different excitation wavelengths ranging between 350 nm and 385 nm. The position of the emission peak was not shifted with respect to the excitation wavelength, and the strongest emission peak appeared at 500 nm for the excitation at 375 nm, which is well consistent with the UV–vis absorption spectrum. This excitation-independent emission behavior arises from the homogeneous surface states’ emissive trap sites, and it could also be useful in condensing the interfering effect of autofluorescence during the analyte detection [44]. Hence, the excitation and emission wavelengths were set at 375 nm and 500 nm, respectively, to record the fluorescence intensity. The Stokes shift was about 125 nm, indicating the potential of NS-CDs for analytical application. Moreover, the QY of the NS-CDs was determined under 375 nm excitation with reference to rhodamine B, and a high QY of 28% was achieved. This is because the N–S-codoping increases the degree of conjugated π-domains or makes it easier for electrons to be trapped by the newly developed surface states, thereby promoting a high yield of radiative recombination [29].

3.3. Optimized Conditions

The parameters that could affect the performance of the NS-CDs fluorescence probe in the detection of QT were optimized. First, to ascertain the kinetic response of the fluorescence probe, the incubation time was monitored for 30 min. The fluorescence response of the NS-CDs was checked every 2 min following the addition of QT (10 μM). As shown in Figure S3, QT could completely react with the NS-CDs within 2 min, which resulted in a sharp decrease in fluorescence intensity. Following this time, the fluorescence intensity was almost stable, suggesting that 2 min would be the ideal incubation time for the sensing studies.
Next, the effect of pH (3.0–9.0) on the fluorescence intensity of the NS-CDs was investigated. As displayed in Figure S4, it could be observed that the fluorescence intensity gradually increased in the pH range of 3.0–7.0. Afterward, the fluorescence intensity did not remarkably change up to the pH value of 9.0. As the highest fluorescence intensity of the NS-CDs was attained at pH ~7.0, this value was selected as the optimal pH for QT detection.

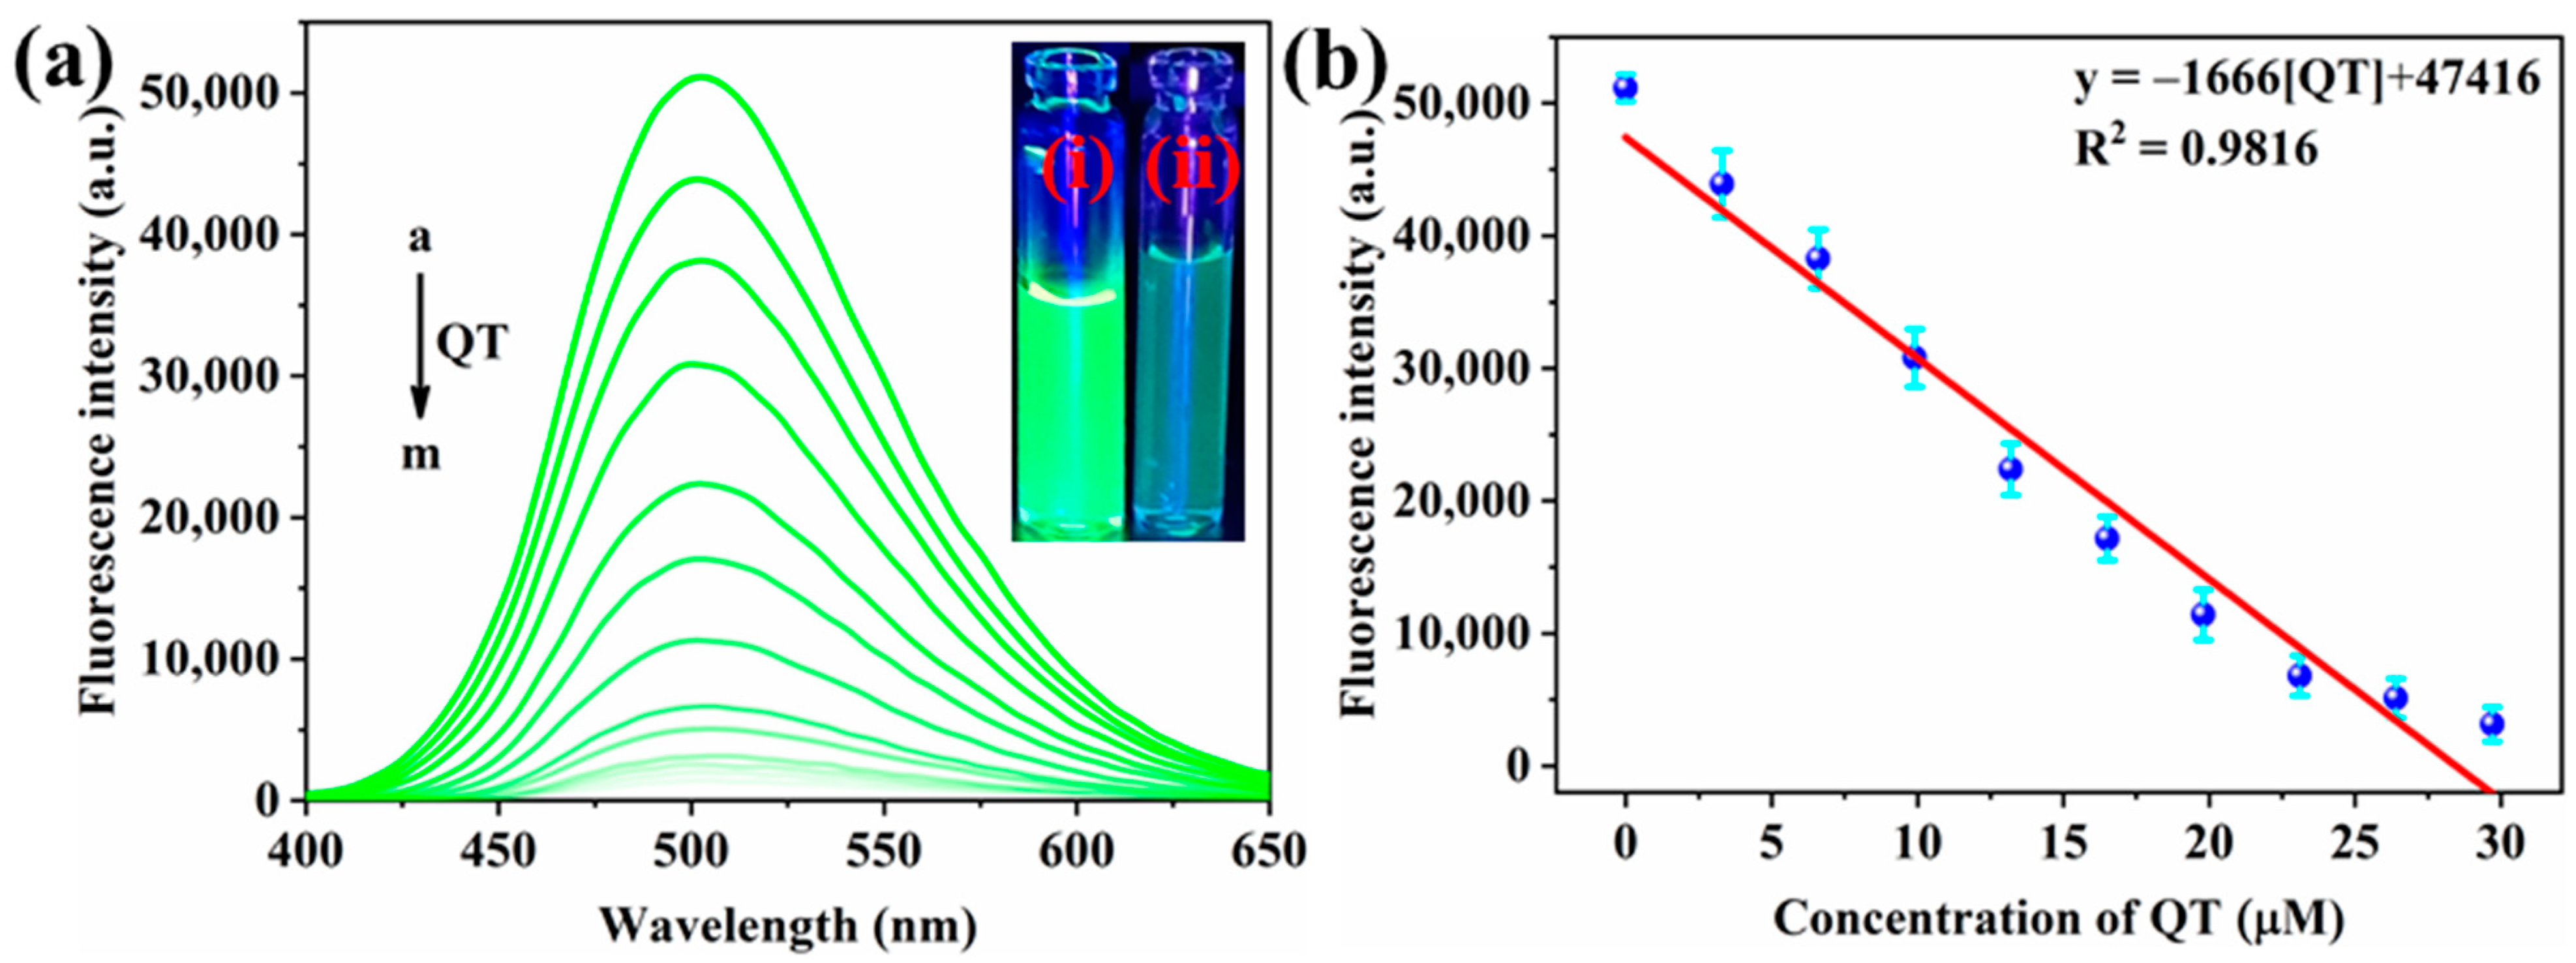
3.4. Sensitive Detection of QT

As the developed NS-CDs probe exhibited excellent fluorescence properties, the performance of the fluorescence probe in the quantitative detection of QT was examined by carrying out titration experiments under optimal conditions. For the excitation at 375 nm, the fluorescence intensity of the NS-CDs was exactly 500 nm. As shown in Figure 4a, the fluorescence intensity was sensitive to QT and was systematically reduced with the increase in the QT concentration (0–39.6 μM), signifying a typical concentration-dependent behavior of the probe. Upon increasing the concentration to 39.6 μM, the fluorescence of the NS-CDs was almost quenched by 97%, signifying the competence of the proposed fluorescence probe. As shown in Figure 4b, the fluorescence intensity of the NS-CDs has a good linear relationship with the concentration of QT in the range between 0 and 29.7 μM. This linear portion of the plot can be fitted into the equation F0/F = −1666[QT] + 47,416, R2 = 0.9816, where F0 and F represent the fluorescence intensities of the NS-CDs without QT and with QT, respectively, and [QT] is the quencher’s concentration. The LOD was determined from the equation LOD = 3σ/m, where σ is the standard deviation obtained from the blank measurement (n = 5) and m is the slope acquired from the linear plot [45]. The value of the LOD was 17.3 nM. In terms of the linear detection range and LOD, a comparison of the current fluorescence probe with previously reported probes is given in Table 1. Obviously, the LOD of the present approach is significantly lower than in other reported works, which reveals that NS-CDs can perform well in practical fluorescence-based analytical applications.

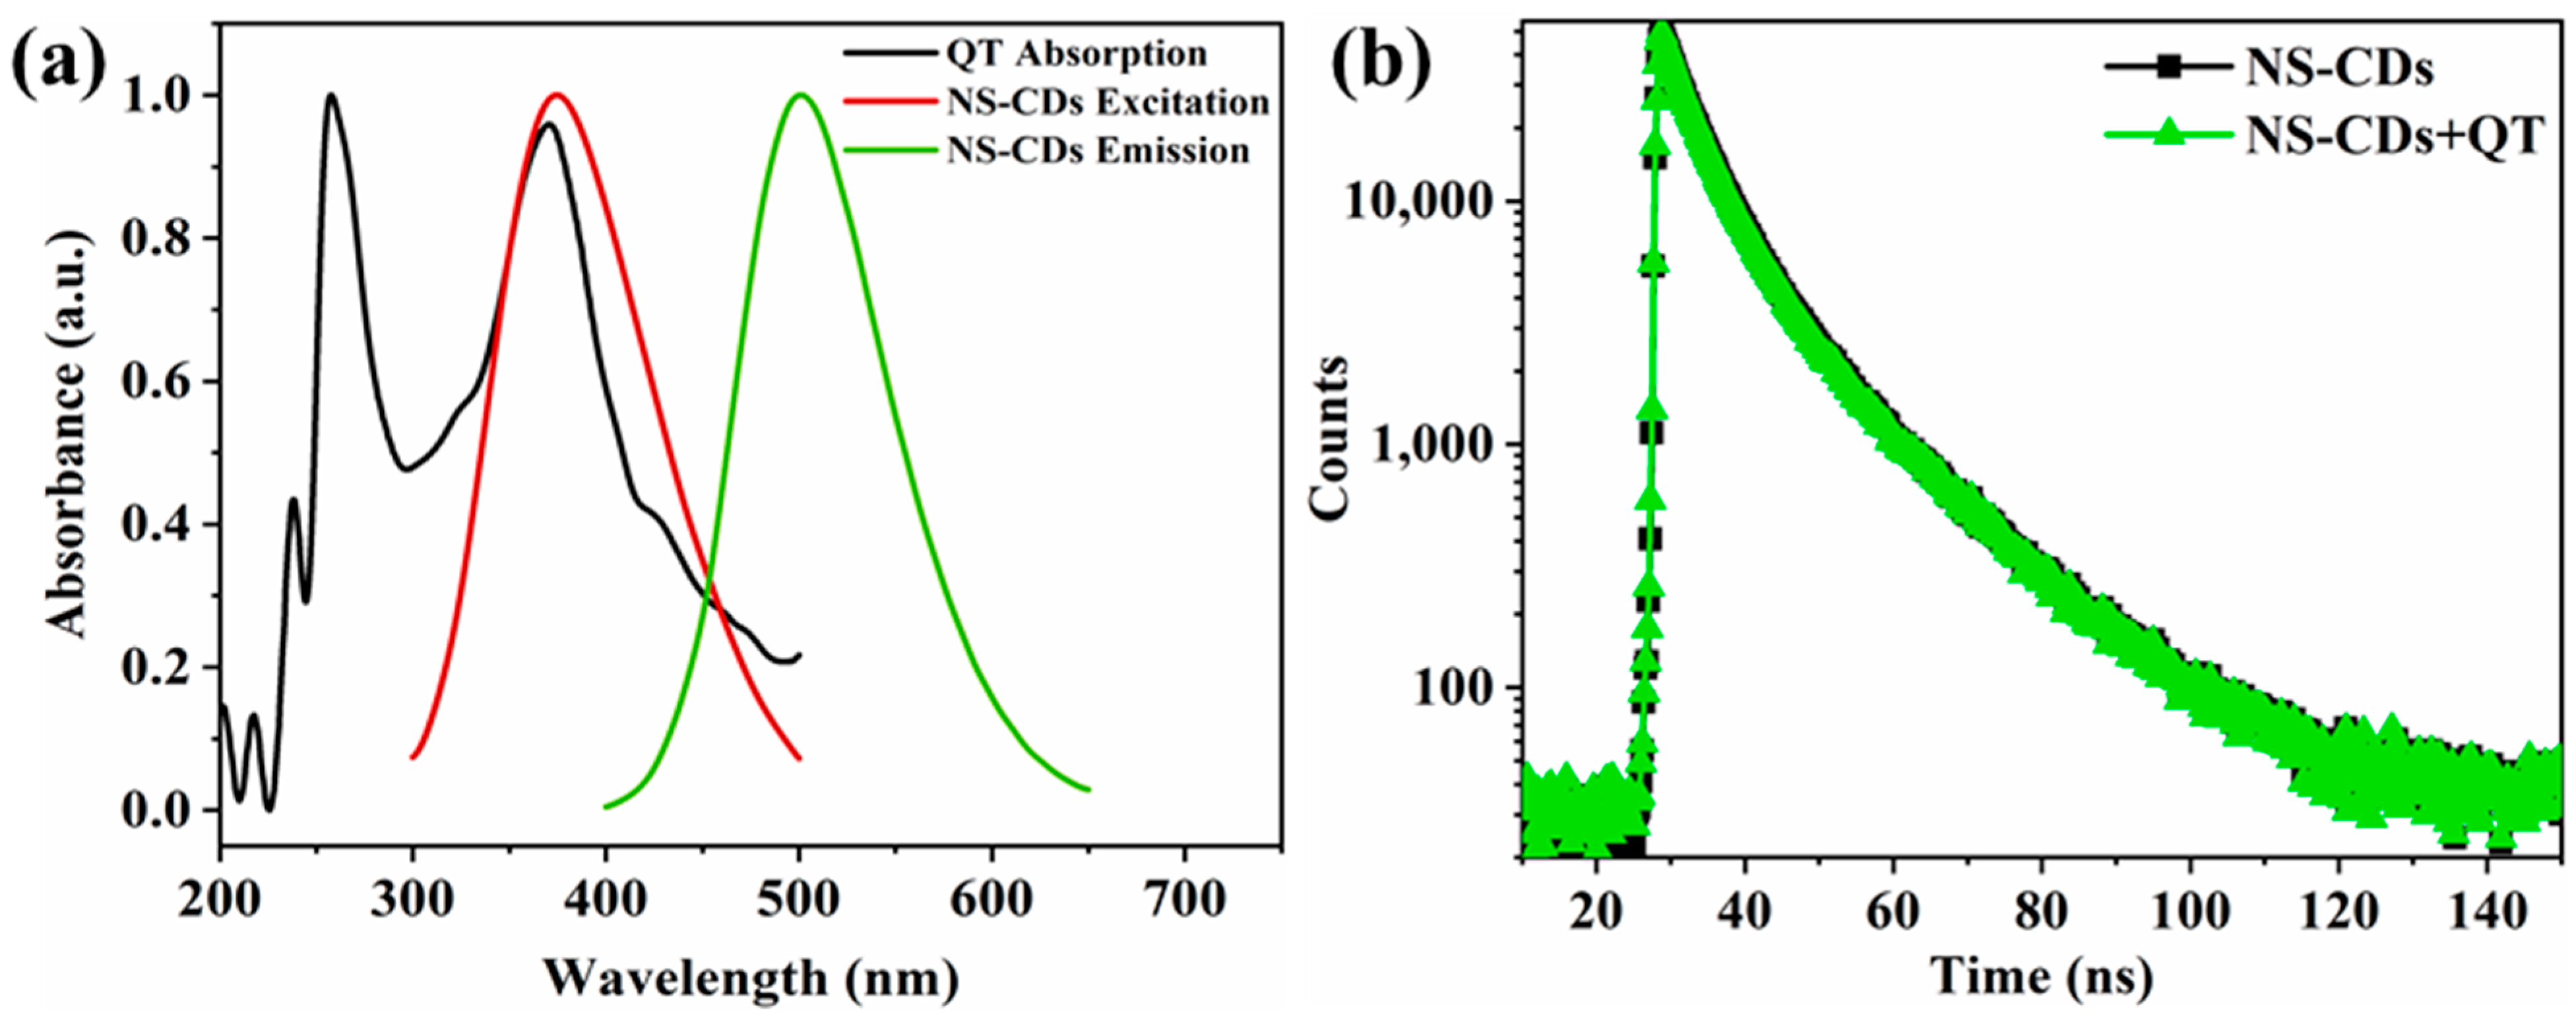
3.5. Fluorescence Quenching Mechanism

Of the various types of quenching mechanisms, Förster resonance energy transfer (FRET) ensues when the emission spectrum of the fluorophore overlaps the absorption spectrum of the quencher molecule, as well as if the distance between them is less than 10 nm [53]. In the case of the IFE, a spectral overlap occurs between the excitation and/or emission spectrum of the fluorophore and the absorption spectrum of the quencher molecule [54]. Also, in the presence of a quencher, the fluorescence lifetime of the fluorophore decreases in the FRET process, while it remains constant in the IFE process [55]. So, in order to reveal the quenching mechanism, the spectra of QT and NS-CDs were studied first. In Figure 5a, the absorption band of QT at 370 nm overlaps with the excitation band of the NS-CDs at 375 nm, suggesting that the QT-induced fluorescence quenching effect may be due to the presence of an IFE or FRET. To elucidate this further, the fluorescence lifetimes of the NS-CDs without QT (τ0) and with QT (τ1) were measured. The data were fitted using a triple exponential model and are shown in Figure 5b. The values were τ0 = 8.73 ns and τ1 = 8.54 ns for bare the NS-CDs and QT-added NS-CDs, respectively. As the lifetime values were almost the same, the possibility of the FRET mechanism could be ruled out. So, the IFE could be the main mechanism for the fluorescence quenching of NS-CDs.
Moreover, the quenching action of QT on the fluorescence response of NS-CDs can be classified into static and dynamic quenching, which can be evaluated by following the standard Stern–Volmer equation [56,57]:
F0/F = 1 + kqτ0[QT] = 1 + KSV[QT]
where F0 and F are the fluorescence intensities of the fluorophore without and with the quencher, respectively, kq is the bimolecular quenching constant, τ0 is the lifetime of the fluorophore without the quencher, [QT] is the quencher’s concentration, and KSV is the Stern–Volmer constant. Static quenching is usually caused by means of the non-fluorescent ground-state complex formation between the fluorophore and the quencher molecule. In contrast, dynamic quenching occurs due to the collisions between the above molecular systems. It is commonly known that quenching action can be either static or dynamic if the Stern–Volmer plot displays a linear relationship; the coexistence of both static and dynamic quenching is evidenced by a nonlinear upward curve in the plot [58,59]. As shown in Figure S5, the Stern–Volmer plot establishes good linearity in the concentration range of 3.3–16.5 μM, with a regression coefficient (R2) of 0.9799. From the slope of the linear plot, KSV was calculated to be 1.387 × 10⁵ M−1. Substituting the values of KSV and τ0 in Equation (3), the quenching constant (kq) was determined to be 1.588 × 10¹² M−1s−1. The obtained kq value was much greater than the dynamic quenching constant (1.0 × 10¹⁰ M−1s−1), representing the static quenching process by the ground-state complex (non-fluorescent NS-CDs-QT complex) formation. This can be verified based on the theory of “hard and soft acids and bases (HSAB)”. According to this model, the high polarizable donor atoms (i.e., N, S heteroatoms) on the NS-CDs’ surface belong to the soft bases. Due to the hydroxyl groups attached to the aromatic rings in phenol, QT belongs to the soft acids. Consequently, an NS-CDs-QT complex might have formed as a result of the electrostatic interaction between the NS-CDs and QT, which may restrict the transfer of non-radiative electrons and cause the fluorescence intensity to decrease [49,60]. Overall, the NS-CDs showed good sensitivity and high specificity for QT detection due to the occurrence of a strong IFE and a remarkable static quenching process.

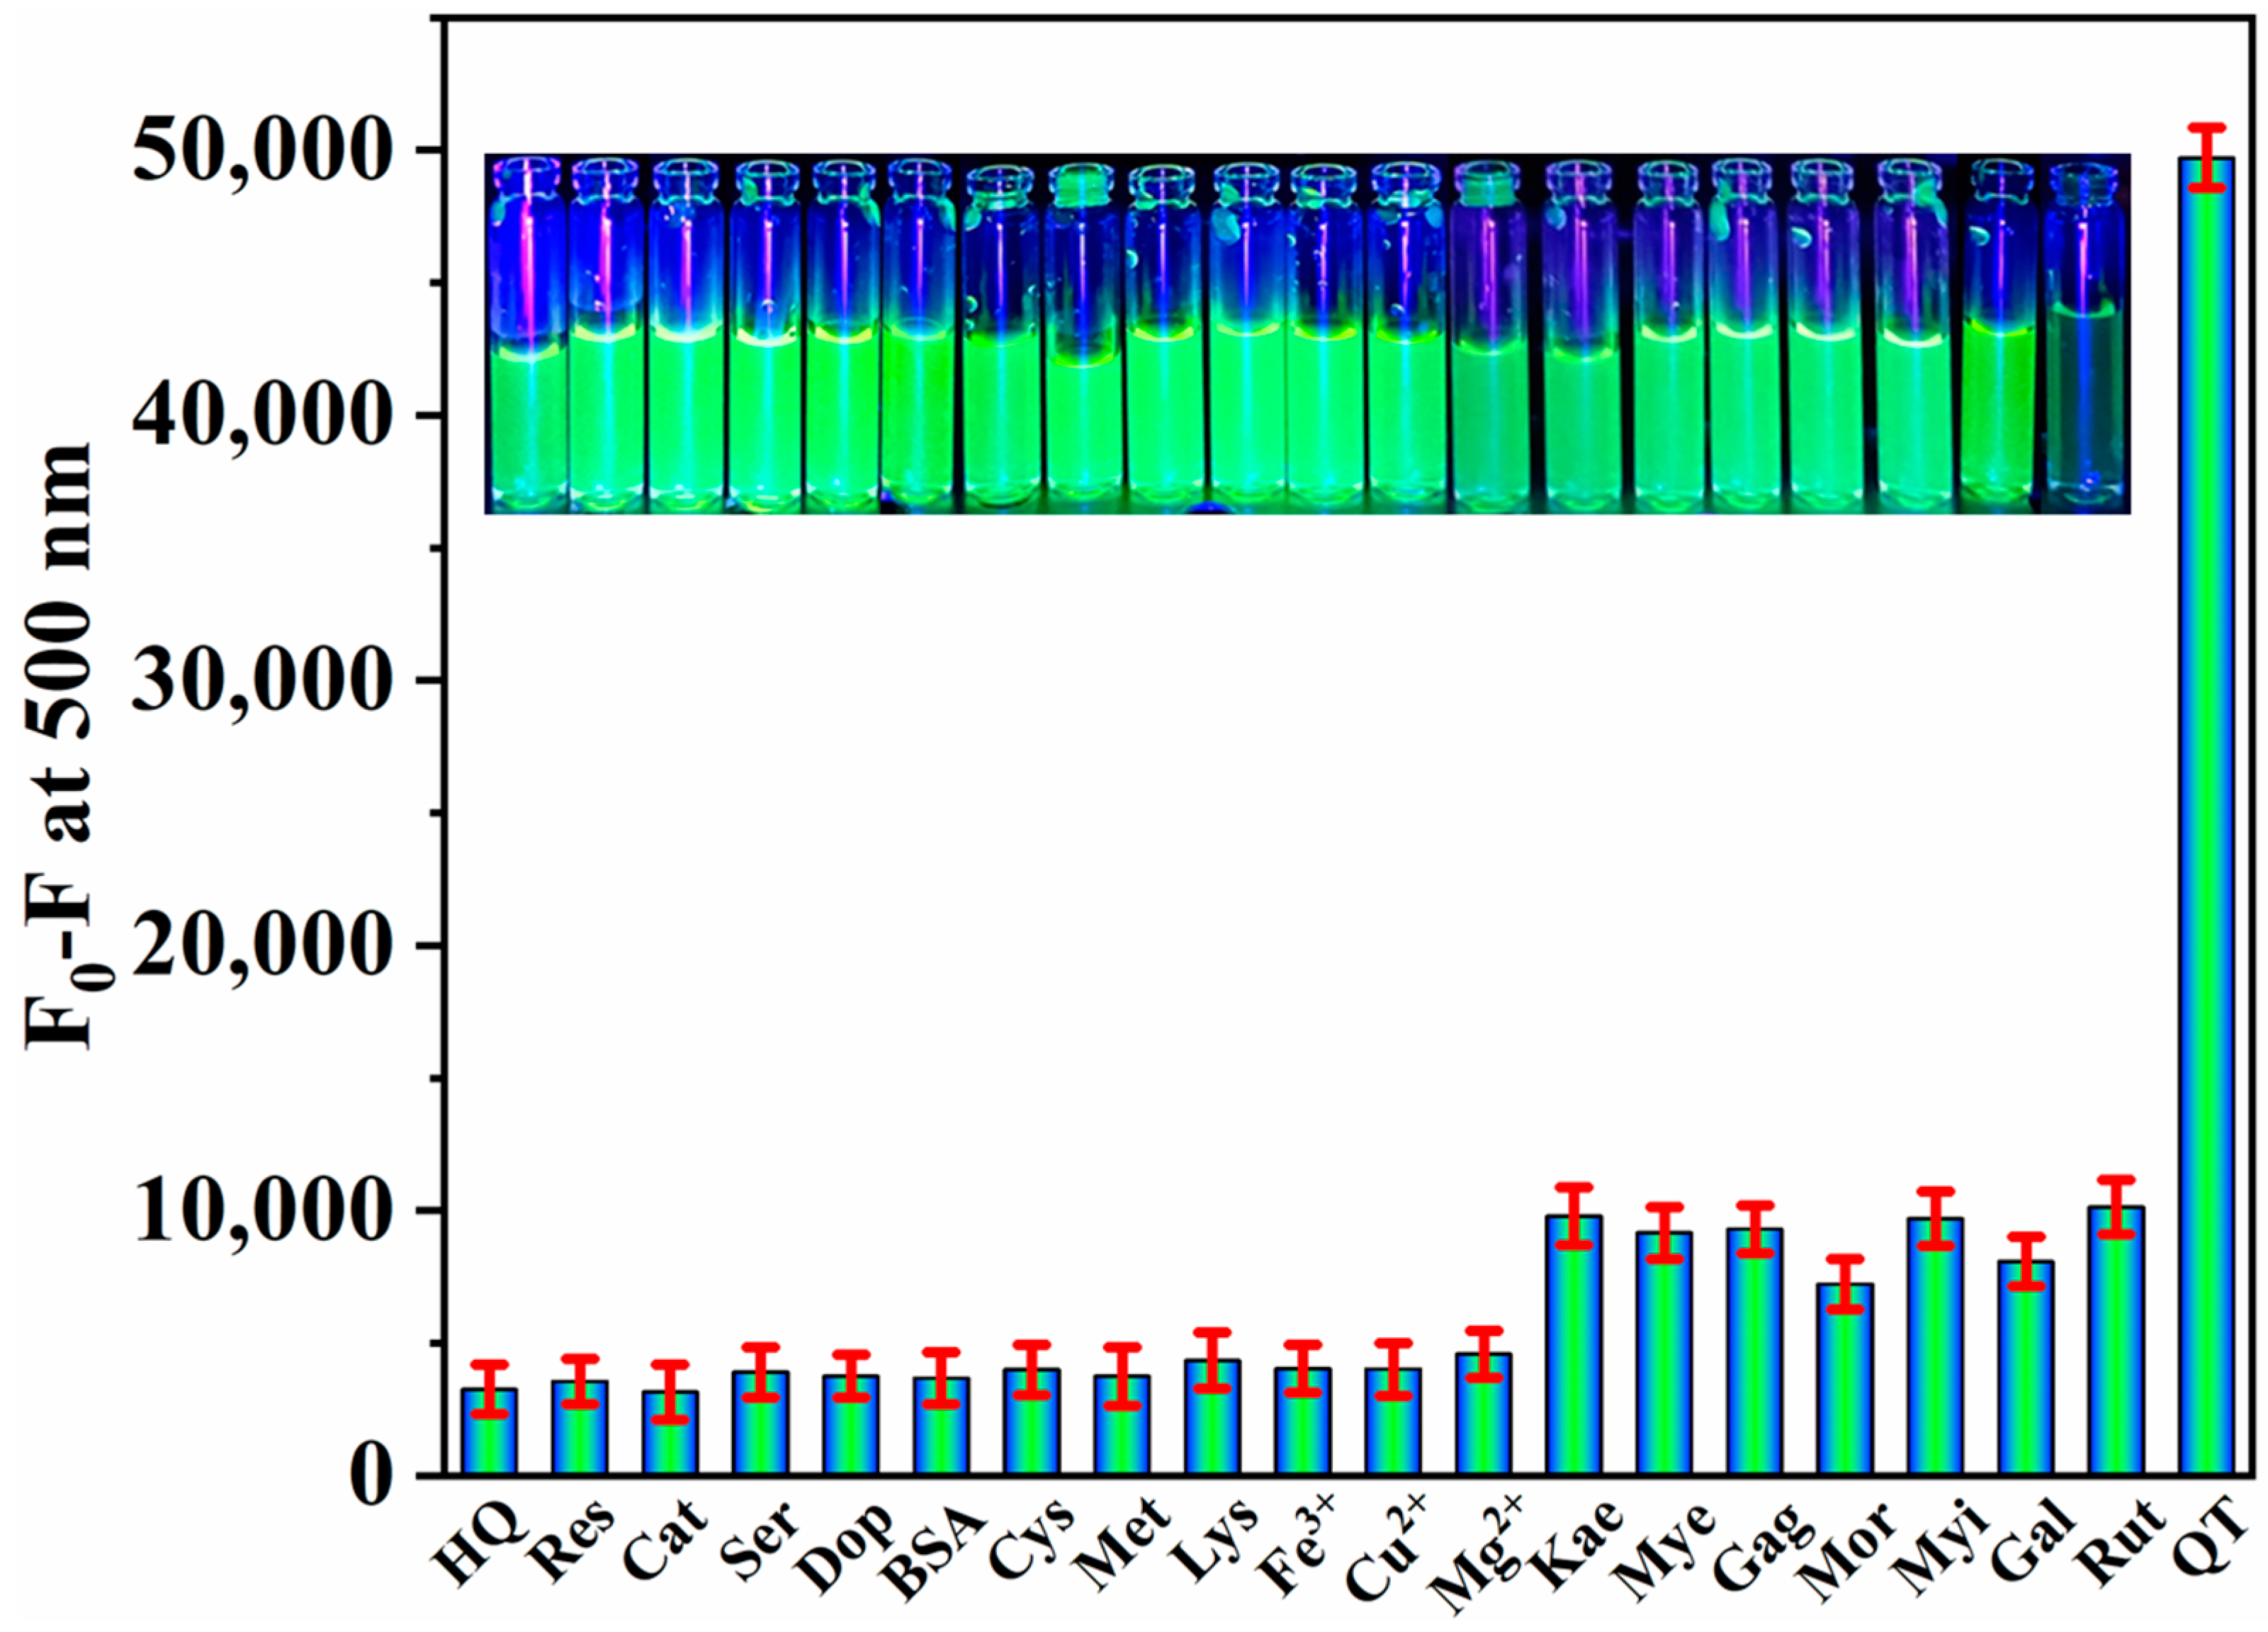
3.6. Specificity of QT Detection

The specificity of the NS-CDs fluorescence probe for QT was appraised in ultrapure water based on the fluorescence change upon excitation at 375 nm. Various chemical compounds, such as phenols, biomolecules, amino acids, metal ions, and flavonoids, acted as potential interferents against QT. Hydroquinone (HQ), resorcinol (Res), catechol (Cat), serotonin (Ser), dopamine (Dop), bovine serum albumin (BSA), cysteine (Cys), methionine (Met), lysine (Lys), Fe3+, Cu2+, Mg2+, kaempferol (Kae), myricetin (Mye), galangin (Gag), morin (Mor), myricitrin (Myi), gallic acid (Gal), and rutin (Rut) were taken fivefold with NS-CDs, and the corresponding fluorescence intensity was recorded. As displayed in Figure 6, QT quenched the fluorescence intensity of NS-CDs effectively compared to the same concentration of other interferents. The poor quenching efficiency of some interferents for the fluorescence response of NS-CDs might be due to the minimal overlap between the excitation or fluorescence spectrum of NS-CDs and the absorption spectrum of the interferents, leading to a weak IFE.

3.7. Detection of QT in Food Samples

To determine the competence of the NS-CDs fluorescence probe, different QT concentrations (0, 5.0, 10.0, 15.0, and 30.0 μM) were added to red wine and onion samples, and the assessment was carried out by the standard addition method. After spiking the QT in each sample, the recovery was performed by measuring the fluorescence spectrum. The obtained results are listed in Table 2 with the relative standard deviation (RSD), indicating that the NS-CDs probe possesses good accuracy and high specificity to QT in food samples. Moreover, the recovery (93.87–102.27%) and RSD (1.08–2.86%) values are within the acceptable ranges. These results clearly suggest that the proposed NS-CD-based fluorescence probe offers significant value for QT detection in food samples.

4. Conclusions

Highly green fluorescent NS-CDs were prepared through a solvothermal method, using p-PD and thioacetamide as the precursors. The NS-CDs showed emission at 500 nm under the excitation at 375 nm. The excitation-independent emission and superior QY (28%) of the NS-CDs were achieved due to the uniform distribution of surface states by means of the amino and sulfur groups attached to the NS-CDs’ surface. Fluorescence quenching of the NS-CDs, caused by both a QT-induced IFE and ground-state complex formation, was used for the quantitative detection of QT. The LOD of 17.3 nM was achieved, reflecting very high sensitivity together with remarkable specificity to QT against various potential interferents. The NS-CD-based detection strategy also demonstrated the successful analysis of QT in red wine and onion samples, with good reproducibility in the range of 93.87–102.27%. These findings suggest that the detection strategy demonstrated can serve to quantify QT in food samples.

Supplementary Materials

The following supporting information can be downloaded at: https://www.mdpi.com/article/10.3390/ma16247686/s1. Figure S1: FT-IR spectra of NS-CDs. Figure S2. XPS survey scan of NS-CDs. Figure S3. Effect of time on the fluorescence intensity of NS-CDs in the presence of QT (10 μM) at room temperature. Figure S4. pH-induced change in fluorescence intensity of NS-CDs at room temperature. Figure S5. Stern–Volmer plot of the quenching of fluorescence of NS-CDs by QT in the concentration range of 3.3–16.5 μM.

Author Contributions

K.S.: Conceptualization, Methodology, Data Curation, Formal Analysis, Investigation, Writing—Original Draft. R.R.: Conceptualization, Methodology, Validation, Investigation, Visualization. H.J.: Validation, Investigation, Resources, Writing—Review and Editing, Visualization, Supervision, Funding Acquisition. All authors have read and agreed to the published version of the manuscript.

Funding

This work was supported by the National Research Foundation of Korea (NRF) grant funded by the Korean government (MSIT) (No. NRF-2021M3H4A3A02086939), and also supported by the National Research Foundation of Korea (NRF) grant funded by the Korean government (MSIT) (No. RS-2023-00279149).

Institutional Review Board Statement

Not applicable.

Informed Consent Statement

Not applicable.

Data Availability Statement

Data are contained within the article and Supplementary Materials.

Conflicts of Interest

The authors declare no conflict of interest.

References

  1. Jakhar, R.; Paul, S.; Park, Y.R.; Han, J.; Kang, S.C. 3,5,7,3′,4′-Pentamethoxyflavone, a quercetin derivative protects DNA from oxidative challenges: Potential mechanism of action. J. Photochem. Photobiol. B 2014, 131, 96–103. [Google Scholar] [CrossRef]
  2. Cornard, J.P.; Merlin, J.C. Spectroscopic and structural study of complexes of quercetin with Al (III). J. Inorg. Biochem. 2002, 92, 19–27. [Google Scholar] [CrossRef] [PubMed]
  3. Chen, X.; Zou, L.; Liu, W.; McClements, D.J. Potential of excipient emulsions for improving quercetin bioaccessibility and antioxidant activity: An in vitro study. J. Agric. Food. Chem. 2016, 64, 3653–3660. [Google Scholar] [CrossRef] [PubMed]
  4. Sivakumar, R.; Park, S.Y.; Lee, N.Y. Quercetin-mediated silver nanoparticle formation for the colorimetric detection of infectious pathogens coupled with loop-mediated isothermal amplification. ACS Sens. 2023, 8, 1422–1430. [Google Scholar] [CrossRef] [PubMed]
  5. Boots, A.W.; Haenen, G.R.; Bast, A. Health effects of quercetin: From antioxidant to nutraceutical. Eur. J. Pharmacol. 2008, 585, 325–337. [Google Scholar] [CrossRef] [PubMed]
  6. Vilian, A.E.; Puthiaraj, P.; Kwak, C.H.; Choe, S.R.; Huh, Y.S.; Ahn, W.S.; Han, Y.K. Electrochemical determination of quercetin based on porous aromatic frameworks supported Au nanoparticles. Electrochim. Acta 2016, 216, 181–187. [Google Scholar] [CrossRef]
  7. van Zanden, J.J.; Hamman, O.B.; van Iersel, M.L.; Boeren, S.; Cnubben, N.H.; Bello, M.L.; Vervoort, J.; van Bladeren, P.J.; Rietjens, I.M. Inhibition of human glutathione S-transferase P1-1 by the flavonoid quercetin. Chem. Biol. Interact. 2003, 145, 139–148. [Google Scholar] [CrossRef] [PubMed]
  8. Ravichandran, R.; Rajendran, M.; Devapiriam, D. Antioxidant study of quercetin and their metal complex and determination of stability constant by spectrophotometry method. Food Chem. 2014, 146, 472–478. [Google Scholar] [CrossRef]
  9. Gomez, F.J.V.; Espino, M.; de los Angeles Fernandez, M.; Raba, J.; Silva, M.F. Enhanced electrochemical detection of quercetin by natural deep eutectic solvents. Anal. Chim. Acta 2016, 936, 91–96. [Google Scholar] [CrossRef]
  10. Sun, Y.; Guo, T.; Sui, Y.; Li, F. Quantitative determination of rutin, quercetin, and adenosine in Flos Carthami by capillary electrophoresis. J. Sep. Sci. 2003, 26, 1203–1206. [Google Scholar] [CrossRef]
  11. Jones, D.J.L.; Lim, C.K.; Ferry, D.R.; Gescher, A. Determination of quercetin in human plasma by HPLC with spectrophotometric or electrochemical detection. Biomed. Chromatogr. 1998, 12, 232–235. [Google Scholar] [CrossRef]
  12. Wu, L.; Zhu, L.; Ma, J.; Li, J.; Liu, J.; Chen, Y. DNA enzyme mediated ratiometric fluorescence assay for Pb(II) ion using magnetic nanosphere-loaded gold nanoparticles and CdSe/ZnS quantum dots. Microchim. Acta 2020, 187, 1–9. [Google Scholar] [CrossRef] [PubMed]
  13. Tran, V.T.; Seok, J.S.; Yoon, I.; Ju, H. Ultraviolet fluorescence-based quantitative detection of polycyclic aromatic hydrocarbons. Biochip J. 2021, 15, 356–361. [Google Scholar] [CrossRef]
  14. Tran, V.T.; Ju, H. Fluorescence based on surface plasmon coupled emission for ultrahigh sensitivity immunoassay of cardiac troponin I. Biomedicines 2021, 9, 448. [Google Scholar] [CrossRef] [PubMed]
  15. Rajamanikandan, R.; Ilanchelian, M. Protein-localized bright-red fluorescent gold nanoclusters as cyanide-selective colorimetric and fluorometric nanoprobes. ACS Omega 2018, 3, 14111–14118. [Google Scholar] [CrossRef] [PubMed]
  16. Wu, L.; Zhou, S.; Yun, Y.; Zhu, L.; Li, B.; Zhang, W. A multifunctional probe for lead(II) sensing using CdSe/ZnS-luminol-conjugated Fe3O4 magnetic nanocomposites. Sens. Actuators B 2022, 356, 131124. [Google Scholar] [CrossRef]
  17. Yu, J.; Zhang, X.; Hao, X.; Zhang, X.; Zhou, M.; Lee, C.S.; Chen, X. Near-infrared fluorescence imaging using organic dye nanoparticles. Biomaterials 2014, 35, 3356–3364. [Google Scholar] [CrossRef]
  18. Luo, X.; Han, Y.; Chen, X.; Tang, W.; Yue, T.; Li, Z. Carbon dots derived fluorescent nanosensors as versatile tools for food quality and safety assessment: A review. Trends Food Sci. Technol. 2020, 95, 149–161. [Google Scholar] [CrossRef]
  19. Behi, M.; Gholami, L.; Naficy, S.; Palomba, S.; Dehghani, F. Carbon dots: A novel platform for biomedical applications. Nanoscale Adv. 2022, 4, 353–376. [Google Scholar] [CrossRef]
  20. Xu, X.; Ray, R.; Gu, Y.; Ploehn, H.J.; Gearheart, L.; Raker, K.; Scrivens, W.A. Electrophoretic analysis and purification of fluorescent single-walled carbon nanotube fragments. J. Am. Chem. Soc. 2004, 126, 12736–12737. [Google Scholar] [CrossRef]
  21. Egorova, M.; Tomskaya, A.; Smagulova, S.A. Optical properties of carbon dots synthesized by the hydrothermal method. Materials 2023, 16, 4018. [Google Scholar] [CrossRef] [PubMed]
  22. Liu, J.; Li, R.; Yang, B. Carbon dots: A new type of carbon-based nanomaterial with wide applications. ACS Cent. Sci. 2020, 6, 2179–2195. [Google Scholar] [CrossRef] [PubMed]
  23. Lu, Y.; Wang, J.; Yuan, H.; Xiao, D. Separation of carbon quantum dots on a C18 column by binary gradient elution via HPLC. Anal. Methods 2014, 6, 8124–8128. [Google Scholar] [CrossRef]
  24. Sasikumar, K.; Rajamanikandan, R.; Ju, H. Fluorescent carbon dots for highly sensitive bilirubin sensing with excellent selectivity. J. Sci. Adv. Mater. Devices 2023, 8, 100599. [Google Scholar] [CrossRef]
  25. Xu, Q.; Kuang, T.; Liu, Y.; Cai, L.; Peng, X.; Sreeprasad, T.S.; Zhao, P.; Yu, Z.; Li, N. Heteroatom-doped carbon dots: Synthesis, characterization, properties, photoluminescence mechanism and biological applications. J. Mater. Chem. B 2016, 4, 7204–7219. [Google Scholar] [CrossRef] [PubMed]
  26. Yan, F.; Sun, Z.; Zhang, H.; Sun, X.; Jiang, Y.; Bai, Z. The fluorescence mechanism of carbon dots, and methods for tuning their emission color: A review. Microchim. Acta 2019, 186, 1–37. [Google Scholar] [CrossRef] [PubMed]
  27. Ding, H.; Li, X.H.; Chen, X.B.; Wei, J.S.; Li, X.B.; Xiong, H.M. Surface states of carbon dots and their influences on luminescence. J. Appl. Phys. 2020, 127, 231101. [Google Scholar] [CrossRef]
  28. Ge, G.; Li, L.; Wang, D.; Chen, M.; Zeng, Z.; Xiong, W.; Wu, X.; Guo, C. Carbon dots: Synthesis, properties and biomedical applications, J. Mater. Chem. B 2021, 9, 6553–6575. [Google Scholar] [CrossRef]
  29. Yuan, Y.H.; Liu, Z.X.; Li, R.S.; Zou, H.Y.; Lin, M.; Liu, H.; Huang, C.Z. Synthesis of nitrogen-doping carbon dots with different photoluminescence properties by controlling the surface states. Nanoscale 2016, 8, 6770–6776. [Google Scholar] [CrossRef]
  30. Wang, Y.; Zhuang, Q.; Ni, Y. Facile microwave-assisted solid-phase synthesis of highly fluorescent nitrogen-sulfur-codoped carbon quantum dots for cellular imaging applications. Chem. Eur. J. 2015, 21, 13004–13011. [Google Scholar] [CrossRef]
  31. Mohamed, R.M.; Mohamed, S.H.; Asran, A.M.; Alsohaimi, I.H.; Hassan, H.M.; Ibrahim, H.; El-Wekil, M.M. Bifunctional ratiometric sensor based on highly fluorescent nitrogen and sulfur biomass-derived carbon nanodots fabricated from manufactured dairy product as a precursor. Spectrochim. Acta A 2023, 293, 122444. [Google Scholar] [CrossRef] [PubMed]
  32. Gao, D.; Zhang, Y.; Liu, A.; Zhu, Y.; Chen, S.; Wei, D.; Sun, J.; Guo, Z.; Fan, H. Photoluminescence-tunable carbon dots from synergy effect of sulfur doping and water engineering. Chem. Eng. J. 2020, 388, 124199. [Google Scholar] [CrossRef]
  33. Qu, Z.B.; Zhou, X.; Gu, L.; Lan, R.; Sun, D.; Yu, D.; Shi, G. Boronic acid functionalized graphene quantum dots as a fluorescent probe for selective and sensitive glucose determination in microdialysate. Chem. Commun. 2013, 49, 9830–9832. [Google Scholar] [CrossRef] [PubMed]
  34. Rajamanikandan, R.; Ilanchelian, M.; Ju, H. Highly selective uricase-based quantification of uric acid using hydrogen peroxide sensitive poly-(vinylpyrrolidone) templated copper nanoclusters as a fluorescence probe. Chemosensors 2023, 11, 268. [Google Scholar] [CrossRef]
  35. Parvin, N.; Mandal, T.K. Synthesis of a highly fluorescence nitrogen-doped carbon quantum dots bioimaging probe and its in vivo clearance and printing applications. RSC Adv. 2016, 6, 18134–18140. [Google Scholar] [CrossRef]
  36. Liu, Q.; Niu, X.; Xie, K.; Yan, Y.; Ren, B.; Liu, R.; Li, Y.; Li, L. Fluorescent carbon dots as nanosensors for monitoring and imaging Fe3+ and [HPO4]2– ions. ACS Appl. Nano Mater. 2020, 4, 190–197. [Google Scholar] [CrossRef]
  37. Barhum, H.; Alon, T.; Attrash, M.; Machnev, A.; Shishkin, I.; Ginzburg, P. Multicolor phenylenediamine carbon dots for metal-ion detection with picomolar sensitivity. ACS Appl. Nano Mater. 2021, 4, 9919–9931. [Google Scholar] [CrossRef]
  38. Wang, B.; Liu, X.; Duan, W.; Dai, S.; Lu, H. Visual and ratiometric fluorescent determination of Al3+ by a red-emission carbon dot-quercetin system. Microchem. J. 2020, 156, 104807. [Google Scholar] [CrossRef]
  39. Zhang, Z.; Pei, K.; Yang, Q.; Dong, J.; Yan, Z.; Chen, J. A nanosensor made of sulfur-nitrogen co-doped carbon dots for “off-on” sensing of hypochlorous acid and Zn(II) and its bioimaging properties. New J. Chem. 2018, 42, 15895–15904. [Google Scholar] [CrossRef]
  40. Zhao, Y.; Geng, X.; Shi, X.; Guo, Y.; Sun, Y.; Qu, L.; Li, Z. A fluorescence-switchable carbon dot for the reversible turn-on sensing of molecular oxygen. J. Mater. Chem. C 2021, 9, 4300–4306. [Google Scholar] [CrossRef]
  41. Hu, Y.; Yang, Z.; Lu, X.; Guo, J.; Cheng, R.; Zhu, L.; Wang, C.F.; Chen, S. Facile synthesis of red dual-emissive carbon dots for ratiometric fluorescence sensing and cellular imaging. Nanoscale 2020, 12, 5494–5500. [Google Scholar] [CrossRef] [PubMed]
  42. Lin, J.S.; Tsai, Y.W.; Dehvari, K.; Huang, C.C.; Chang, J.Y. A carbon dot based theranostic platform for dual-modal imaging and free radical scavenging. Nanoscale 2019, 11, 20917–20931. [Google Scholar] [CrossRef] [PubMed]
  43. Duan, J.; Yu, J.; Feng, S.; Su, L. A rapid microwave synthesis of nitrogen–sulfur co-doped carbon nanodots as highly sensitive and selective fluorescence probes for ascorbic acid. Talanta 2016, 153, 332–339. [Google Scholar] [CrossRef] [PubMed]
  44. Zhang, Y.; Cui, P.; Zhang, F.; Feng, X.; Wang, Y.; Yang, Y.; Liu, X. Fluorescent probes for “off–on” highly sensitive detection of Hg2+ and L-cysteine based on nitrogen-doped carbon dots. Talanta 2016, 152, 288–300. [Google Scholar] [CrossRef] [PubMed]
  45. Zhang, Y.; He, Y.H.; Cui, P.P.; Feng, X.T.; Chen, L.; Yang, Y.Z.; Liu, X.G. Water-soluble, nitrogen-doped fluorescent carbon dots for highly sensitive and selective detection of Hg2+ in aqueous solution. RSC Adv. 2015, 5, 40393–40401. [Google Scholar] [CrossRef]
  46. Guo, J.; Lu, W.; Meng, Y.; Wang, H.; Dong, C.; Shuang, S. Facile synthesis of multifunctional red-emissive carbon dots for fluorescent quercetin and pH sensing. Dyes Pigm. 2022, 208, 110766. [Google Scholar] [CrossRef]
  47. Gao, M.; He, M.; Xing, R.; Wang, X.; Wang, Z. Borate-modified carbon dots as a probe for quercetin in plants. Analyst 2021, 146, 590–596. [Google Scholar] [CrossRef]
  48. Li, T.; Guo, G.; Xing, H.; Wang, Y.; Luo, X.; Wang, L.; Gu, C.; Hou, Y.; Chen, D. Energy transfer mediated rapid and visual discrimination of tetracyclines and quercetin in food by using N, Cu Co-doped carbon dots. Anal. Chim. Acta 2023, 1239, 340706. [Google Scholar] [CrossRef]
  49. Montes, C.; Villamayor, N.; Villaseñor, M.J.; Rios, A. Distinctive sensing nanotool for free and nanoencapsulated quercetin discrimination based on S,N co-doped graphene dots. Anal. Chim. Acta 2022, 1230, 340406. [Google Scholar] [CrossRef]
  50. Kadian, S.; Manik, G. Sulfur doped graphene quantum dots as a potential sensitive fluorescent probe for the detection of quercetin. Food Chem. 2020, 317, 126457. [Google Scholar] [CrossRef]
  51. Zou, Y.; Yan, F.; Zheng, T.; Shi, D.; Sun, F.; Yang, N.; Chen, L. Highly luminescent organosilane-functionalized carbon dots as a nanosensor for sensitive and selective detection of quercetin in aqueous solution. Talanta 2015, 135, 145–148. [Google Scholar] [CrossRef] [PubMed]
  52. Du, F.; Shuang, S.; Guo, Z.; Gong, X.; Dong, C.; Xian, M.; Yang, Z. Rapid synthesis of multifunctional carbon nanodots as effective antioxidants, antibacterial agents, and quercetin nanoprobes. Talanta 2020, 206, 120243. [Google Scholar] [CrossRef] [PubMed]
  53. Koc, Ö.K.; Üzer, A.; Apak, R. High quantum yield nitrogen-doped carbon quantum dot-based fluorescent probes for selective sensing of 2,4,6-trinitrotoluene. ACS Appl. Nano Mater. 2022, 5, 5868–5881. [Google Scholar] [CrossRef]
  54. Chang, H.C.; Ho, J.A.A. Gold nanocluster-assisted fluorescent detection for hydrogen peroxide and cholesterol based on the inner filter effect of gold nanoparticles. Anal. Chem. 2015, 87, 10362–10367. [Google Scholar] [CrossRef] [PubMed]
  55. Singh, P.; Kumar, S.; Kumar, P.; Kataria, N.; Bhankar, V.; Kumar, K.; Kumar, R.; Hsieh, C.T.; Khoo, K.S. Assessment of biomass-derived carbon dots as highly sensitive and selective templates for the sensing of hazardous ions. Nanoscale 2023, 15, 16241–16267. [Google Scholar] [CrossRef] [PubMed]
  56. Lakowicz, J.R. Principles of Fluorescence Spectroscopy, 3rd ed.; Springer: New York, NY, USA, 2006. [Google Scholar]
  57. Rajamanikandan, R.; Ilanchelian, M. Fluorescence sensing approach for high specific detection of 2,4,6-trinitrophenol using bright cyan blue color-emittive poly (vinylpyrrolidone)-supported copper nanoclusters as a fluorophore. ACS Omega 2018, 3, 18251–18257. [Google Scholar] [CrossRef]
  58. Das, R.; Rajender, G.; Giri, P.K. Anomalous fluorescence enhancement and fluorescence quenching of graphene quantum dots by single walled carbon nanotubes. Phys. Chem. Chem. Phys. 2018, 20, 4527–4537. [Google Scholar] [CrossRef]
  59. Wang, Y.; Yue, Q.; Hu, Y.; Liu, C.; Tao, L.; Zhang, C. Synthesis of N-doped carbon dots and application in vanillin detection based on collisional quenching. RSC Adv. 2019, 9, 40222–40227. [Google Scholar] [CrossRef]
  60. Pearson, R.G. Hard and soft acids and bases. J. Am. Chem. Soc. 1963, 85, 3533–3539. [Google Scholar] [CrossRef]
Scheme 1. Synthesis of NS-CDs and detection of QT by fluorescence quenching.
Materials 16 07686 sch001
Figure 1. (a) TEM photograph of NS-CDs. Inset: histogram of particle size distribution. (b) HR-TEM image of a single NS-CD. Inset: the corresponding lattice fringes.
Materials 16 07686 g001
Figure 2. High-resolution XPS spectra of (a) C1s, (b) N1s, (c) O1s, and (d) S2p of the NS-CDs.
Materials 16 07686 g002
Figure 3. (a) UV–vis spectrum of NS-CDs. Inset: photograph of NS-CDs in visible light. (b) Fluorescence emission spectra of NS-CDs at different times of UV light exposure (λ = 365 nm). Inset: photographs of NS-CDs under UV light for (i) 0 min and (ii) 120 min. (c) Bar chart showing the photostability of NS-CDs in different time intervals under UV light. (d) Changes in the fluorescence emission intensity of NS-CDs at different excitation wavelengths ranging from 350 nm to 385 nm.
Materials 16 07686 g003
Figure 4. (a) Quenching of the fluorescence intensity of NS-CDs with the addition of QT increasing in steps of 3.3 μM (a→m: 0–39.6 μM) (λex = 375 nm; λem = 500 nm). Inset: photographs of NS-CDs (i) without QT and (ii) with QT (39.6 μM). (b) Plot of fluorescence intensity vs. QT concentration within the linear range of 0–29.7 μM.
Materials 16 07686 g004
Figure 5. (a) Spectral overlap between absorption of QT and excitation of NS-CDs. (b) Fluorescence lifetime decay of NS-CDs without QT and with QT (40 μM).
Materials 16 07686 g005
Figure 6. Specificity of NS-CDs to QT over potential interferents.
Materials 16 07686 g006
Table 1. Comparison of NS-CDs with various fluorescence probes for QT detection.
Fluorescence ProbeChemical PrecursorsLinear Range (μM)LOD
(nM)
Ref.
Red-emissive CDsNeutral red + catechol0.66–111.33190.0[46]
Boron-functionalized CDsEthylenediamine + 4-boronobenzoyl chloride0–28.528.8[47]
N,Cu-codoped CDsEthylenediaminetetraacetic acid + CuCl20–100.075.4[48]
N,S-codoped graphene quantum dotsCitric acid + cysteamine hydrochloride0.17–33.0956.25[49]
Sulfur-doped graphene quantum dotsCitric acid +
3-mercaptopropionic acid
0–50.019.85[50]
Organosilane-functionalized CDs (SiCDs)Citric acid +
N-(b-aminoethyl)-g-aminopropyl methyldimethoxy silane
0–40.079.0[51]
Carbon nanodotsGlucose + ethylenediamine + nitric acid1.0–47.0172.4[52]
N,S-codoped CDsp-Phenylenediamine + thioacetamide0–29.717.3This work
Table 2. Recovery results of food samples spiked with QT at different standard levels.
SamplesAmount of QT Spiked (μM)Amount of QT Detected (μM)Recovery (%)RSD * (%)
(n = 5)
Red wine04.38 ± 0.05---1.08
5.09.24 ± 0.2397.22.53
10.013.97 ± 0.2095.91.42
15.018.46 ± 0.5093.872.72
30.033.91 ± 0.4698.431.35
Onion01.50 ± 0.04---2.56
5.06.22 ± 0.1294.41.91
10.011.13 ± 0.3296.32.86
15.016.84 ± 0.19102.271.13
30.030.59 ± 0.8196.972.64
* RSD: relative standard deviation = (standard deviation/average) × 100.
Disclaimer/Publisher’s Note: The statements, opinions and data contained in all publications are solely those of the individual author(s) and contributor(s) and not of MDPI and/or the editor(s). MDPI and/or the editor(s) disclaim responsibility for any injury to people or property resulting from any ideas, methods, instructions or products referred to in the content.

