
A High-Performance Supercapacitor Based on Hierarchical Template-Free Ni/SnO2 Nanostructures via Hydrothermal Method
 , , , , and
Abstract
:1. Introduction
2. Experimental Procedure
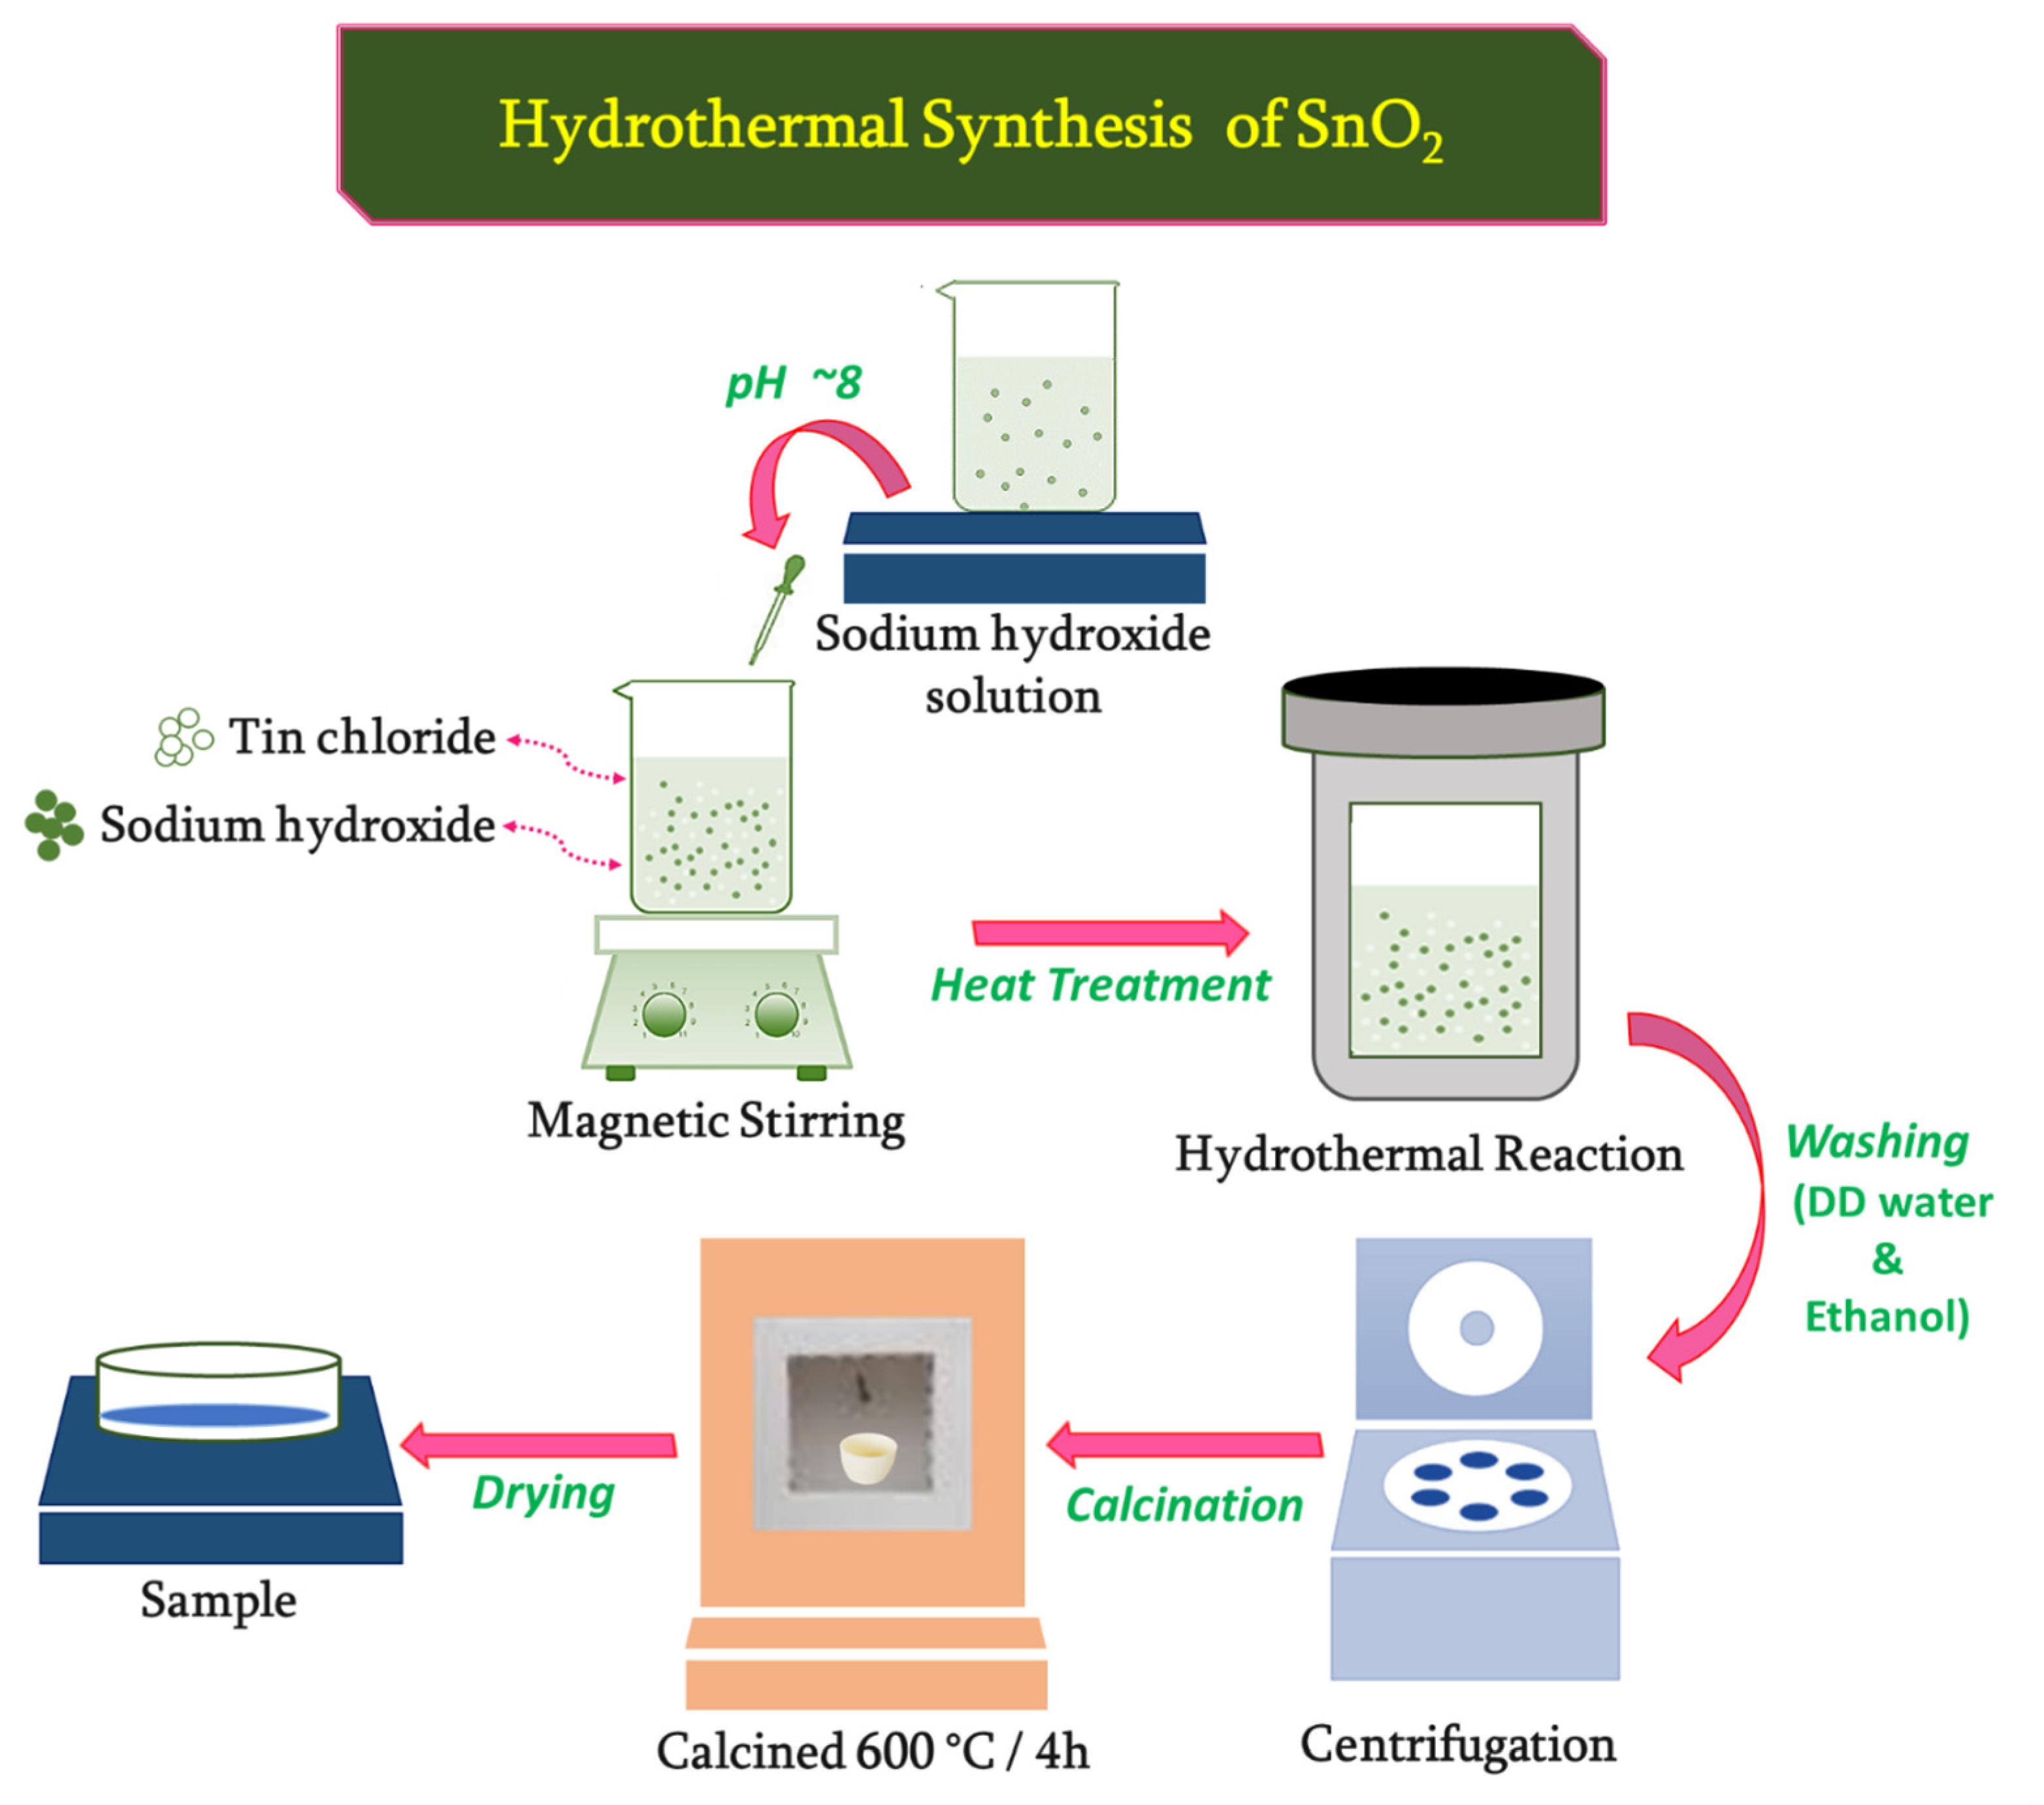
2.1. Synthesis of Ni1−xSnxO2 (x = 0, 0.001, 0.003, 0.005) Microplates
2.2. Characterization Techniques of Synthesized Nanostructures
2.3. Preparation of Electrode for Supercapacitor Investigations
3. Results and Discussion
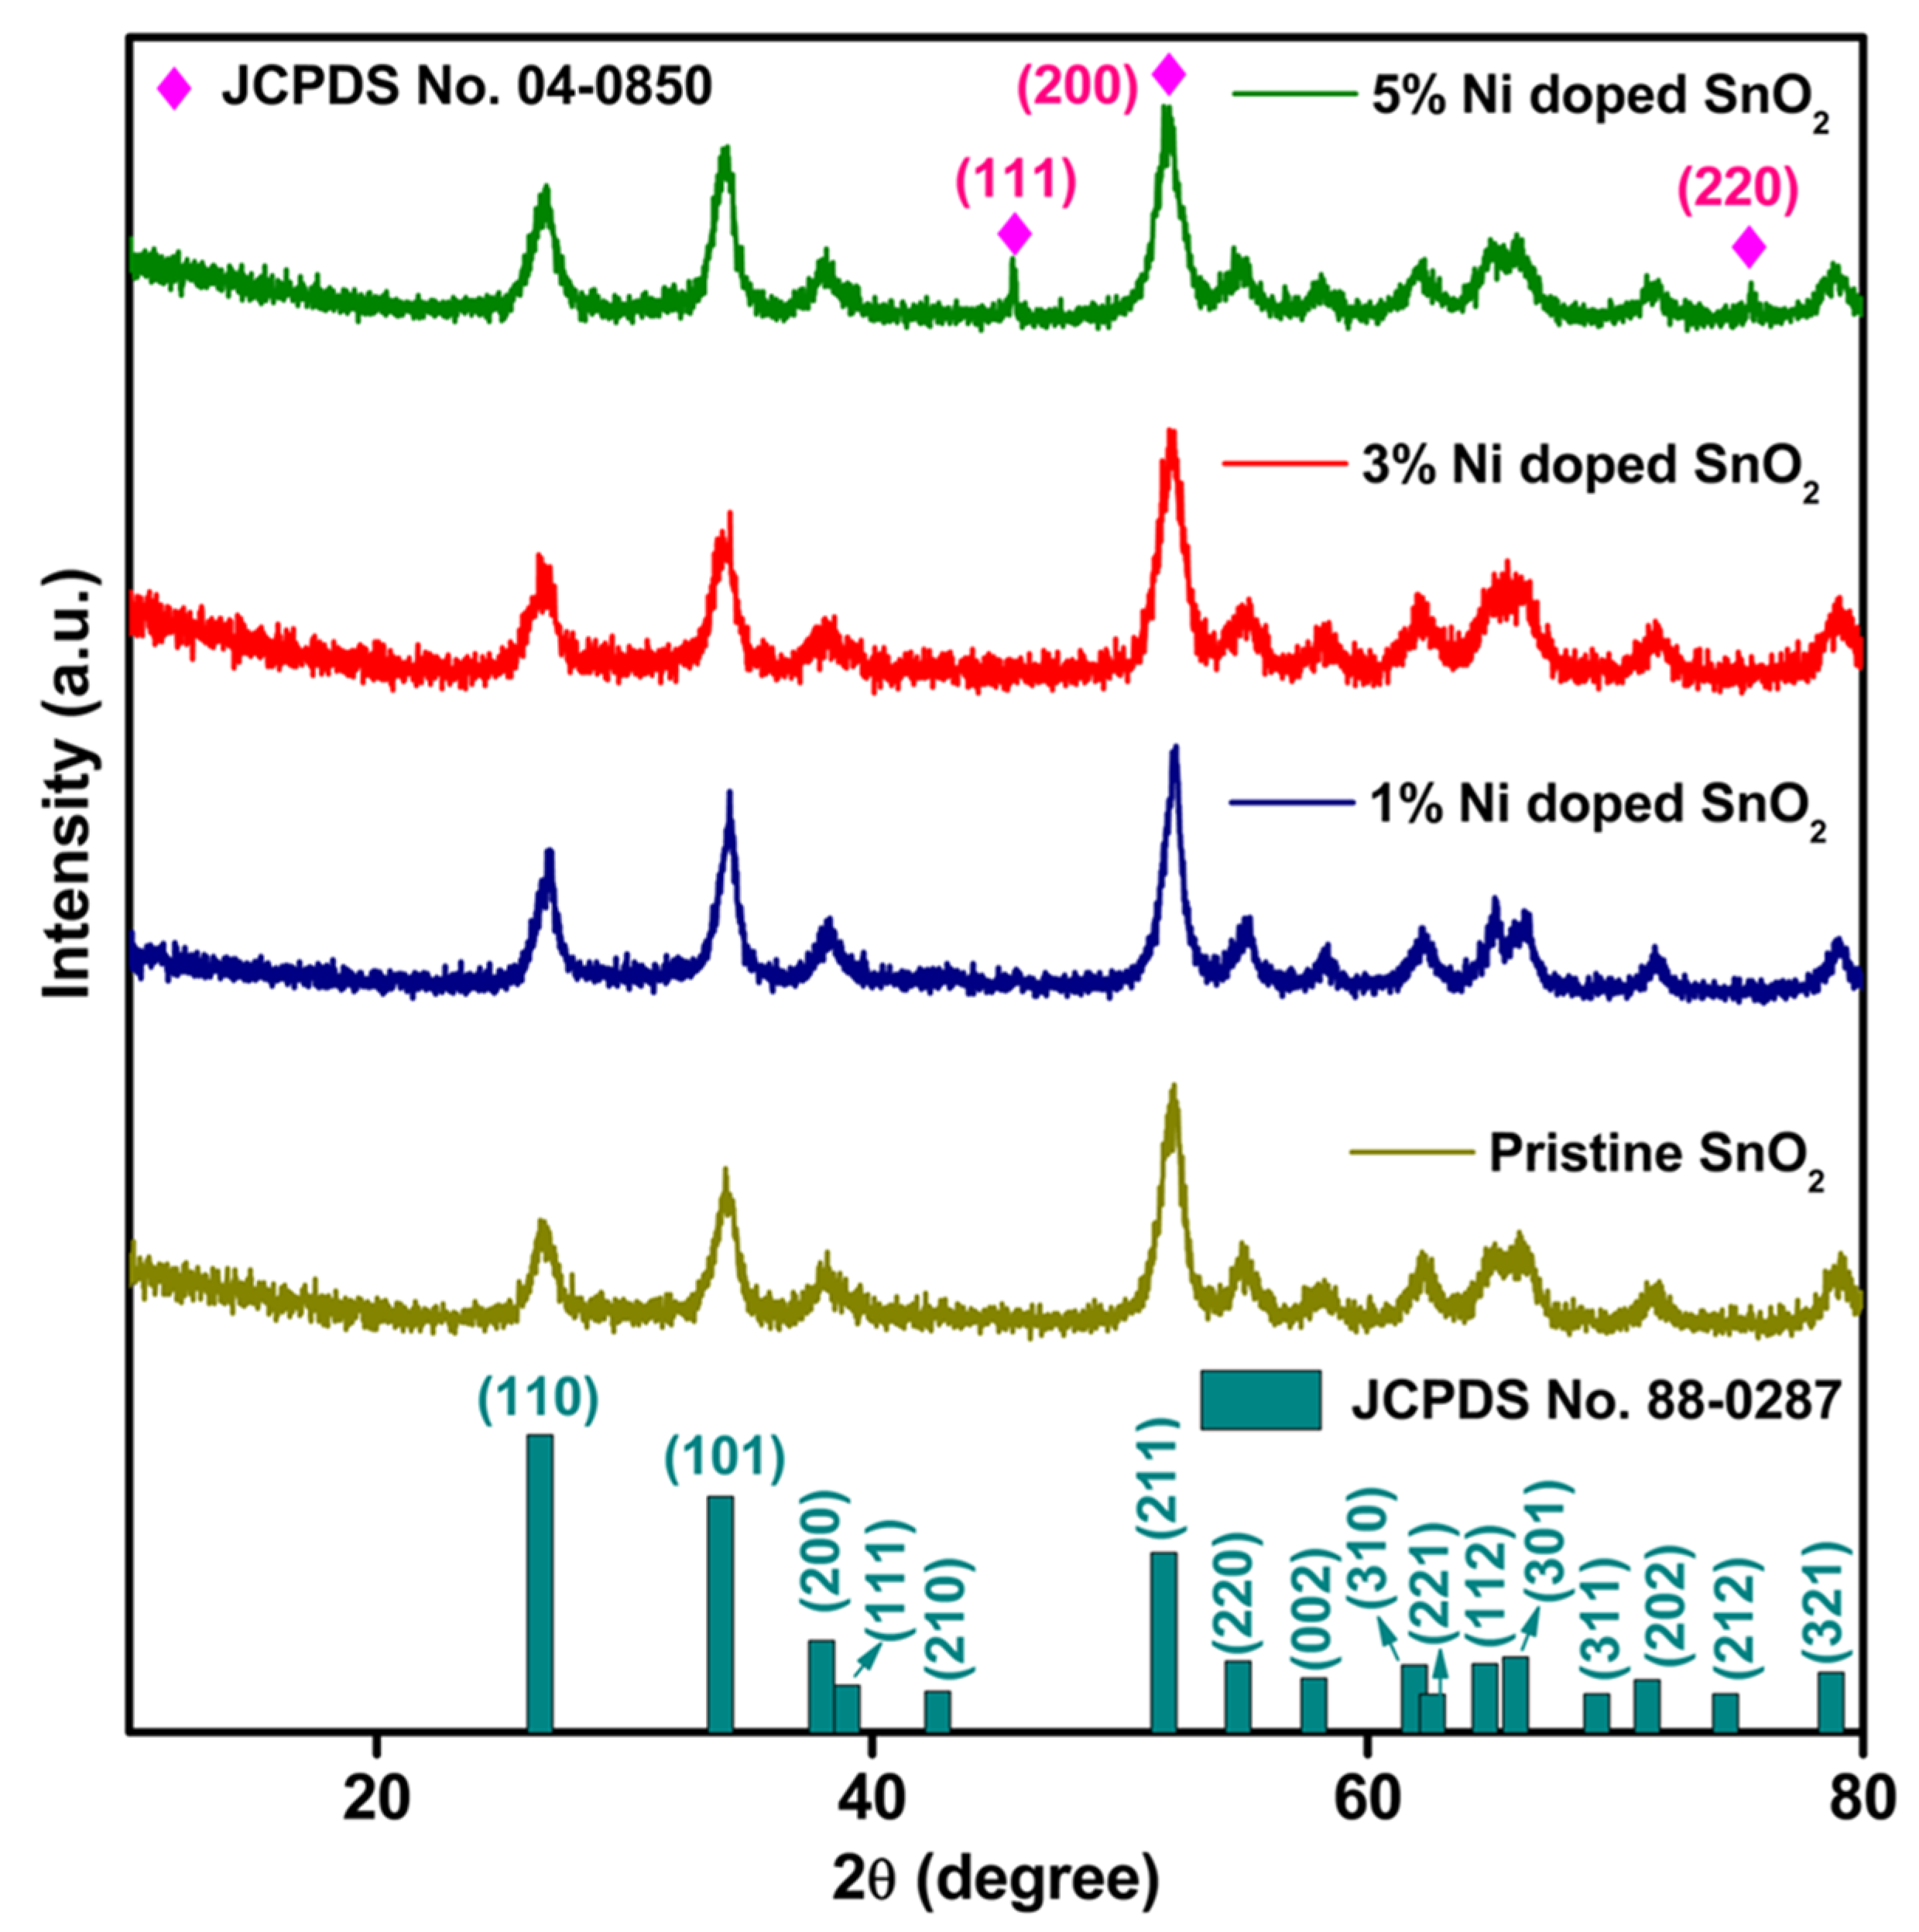
3.1. XRD Analysis
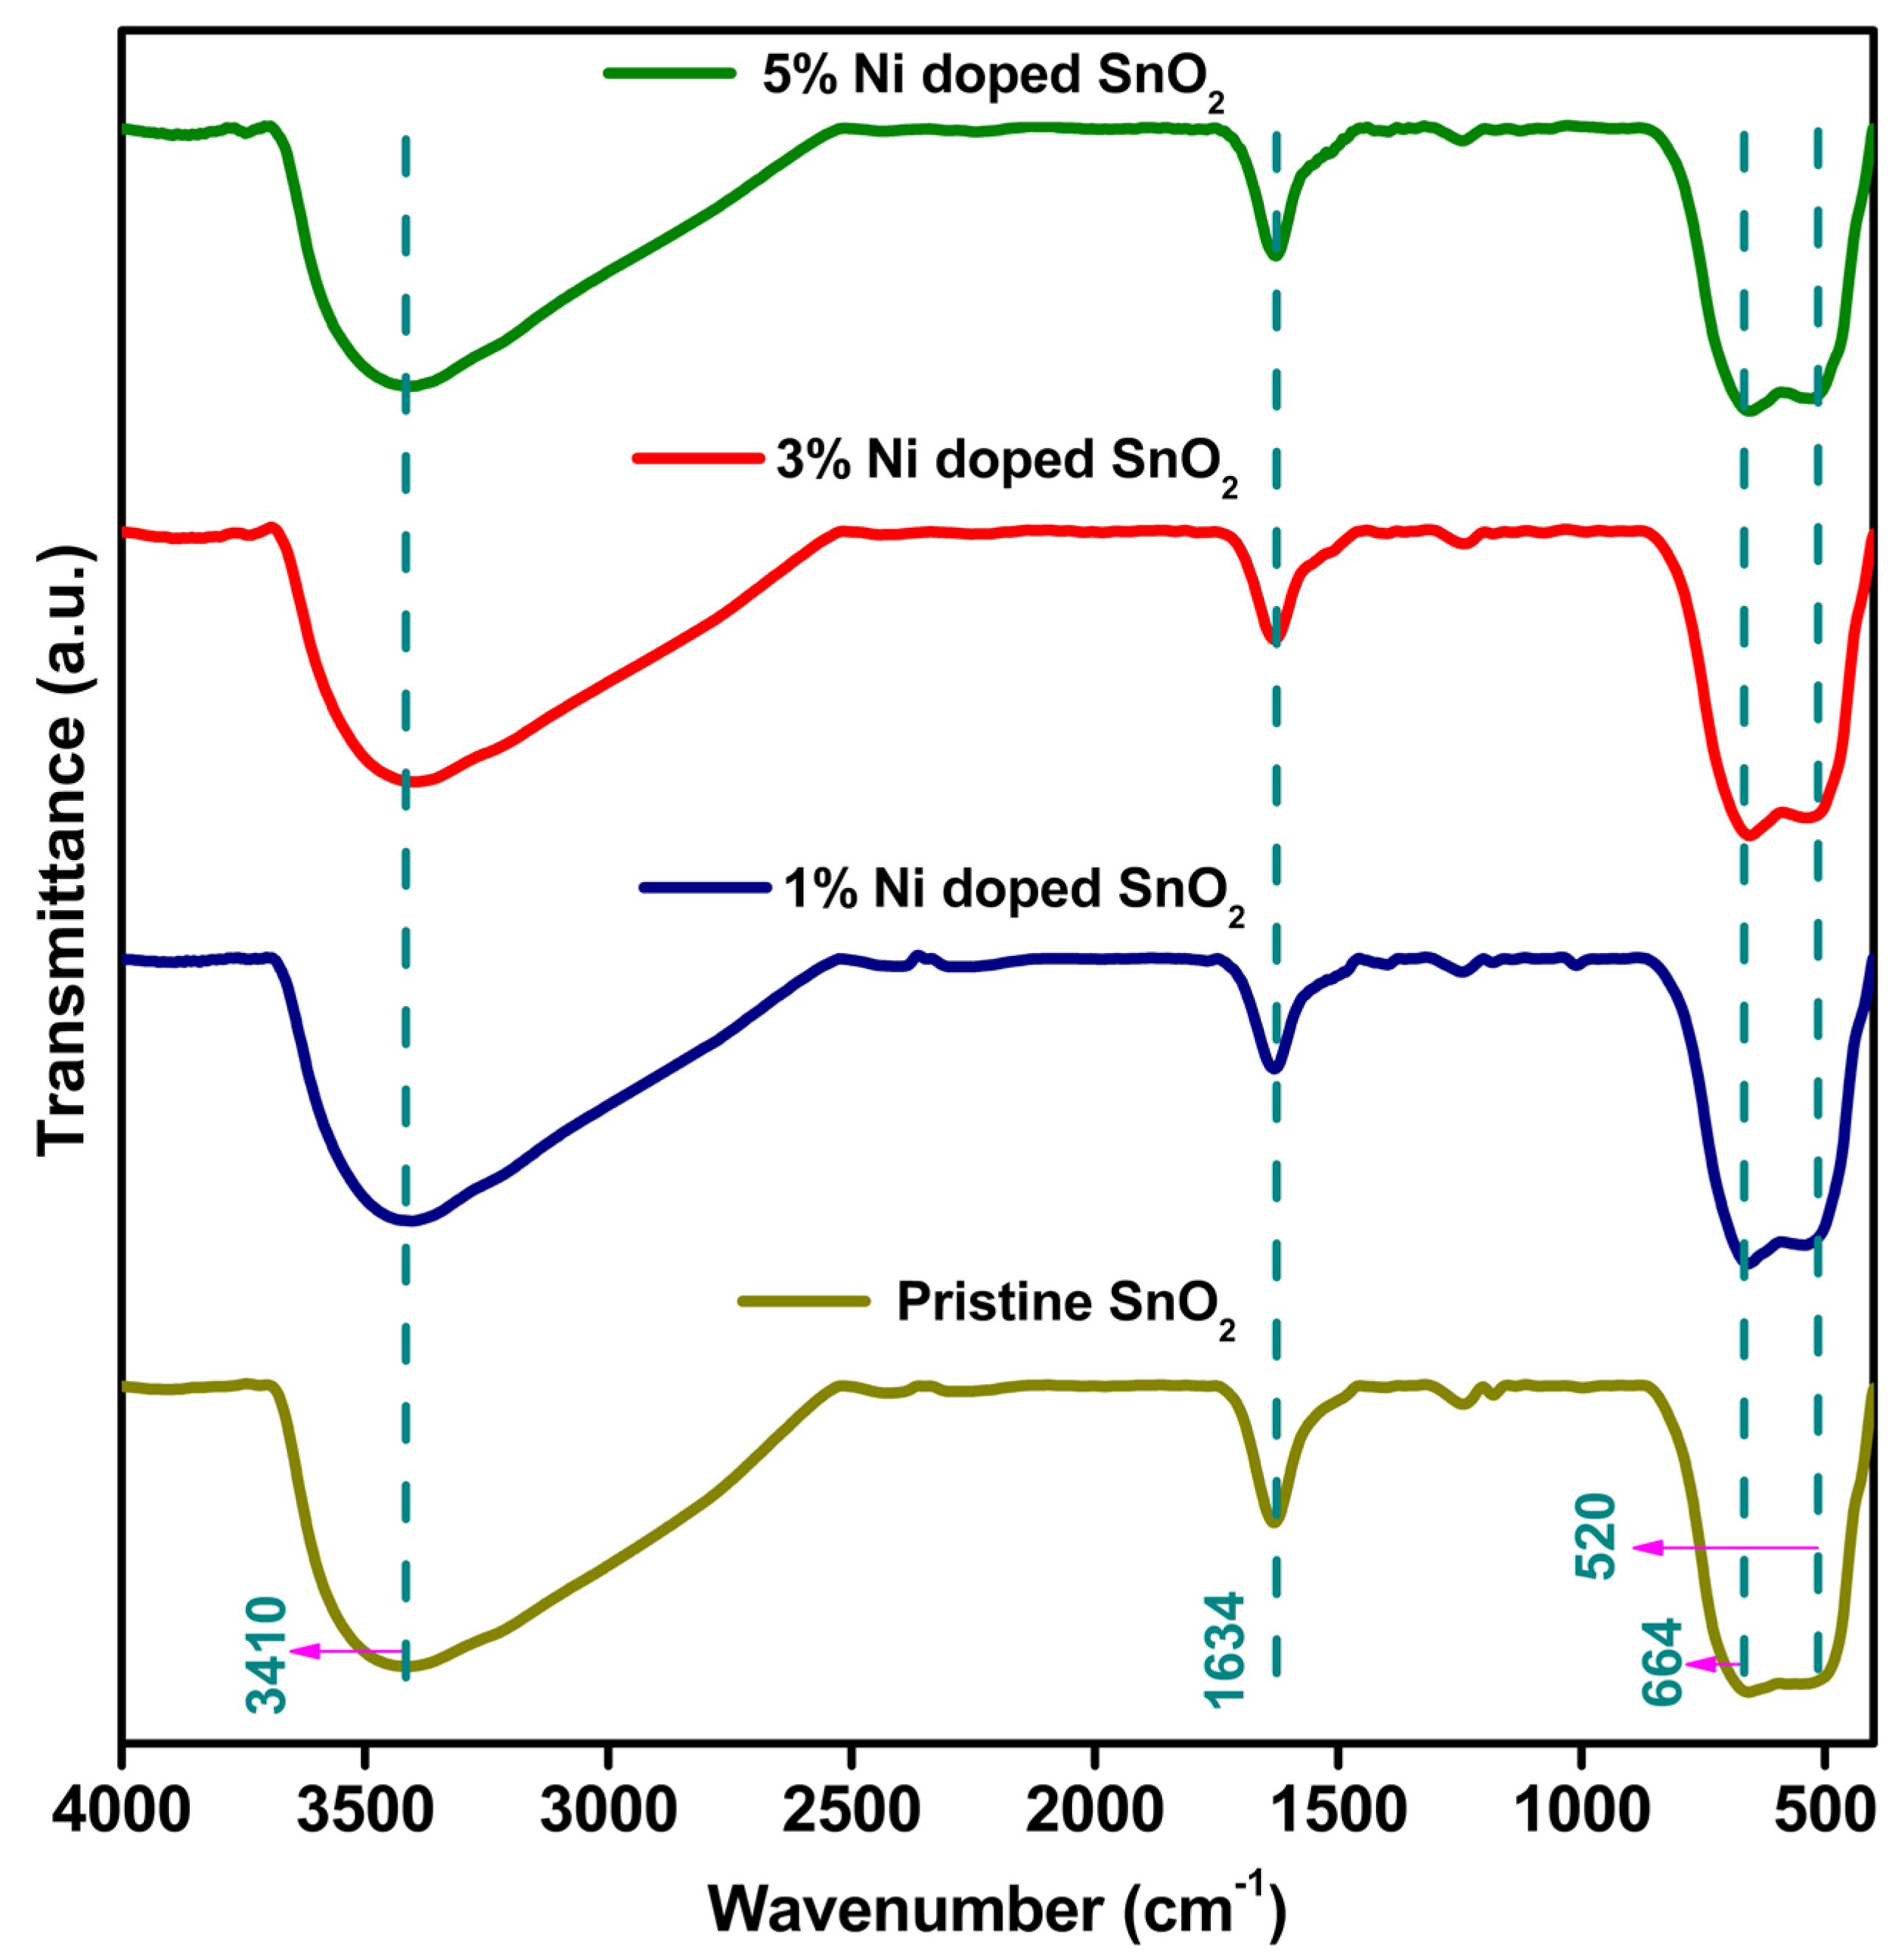
3.2. FTIR
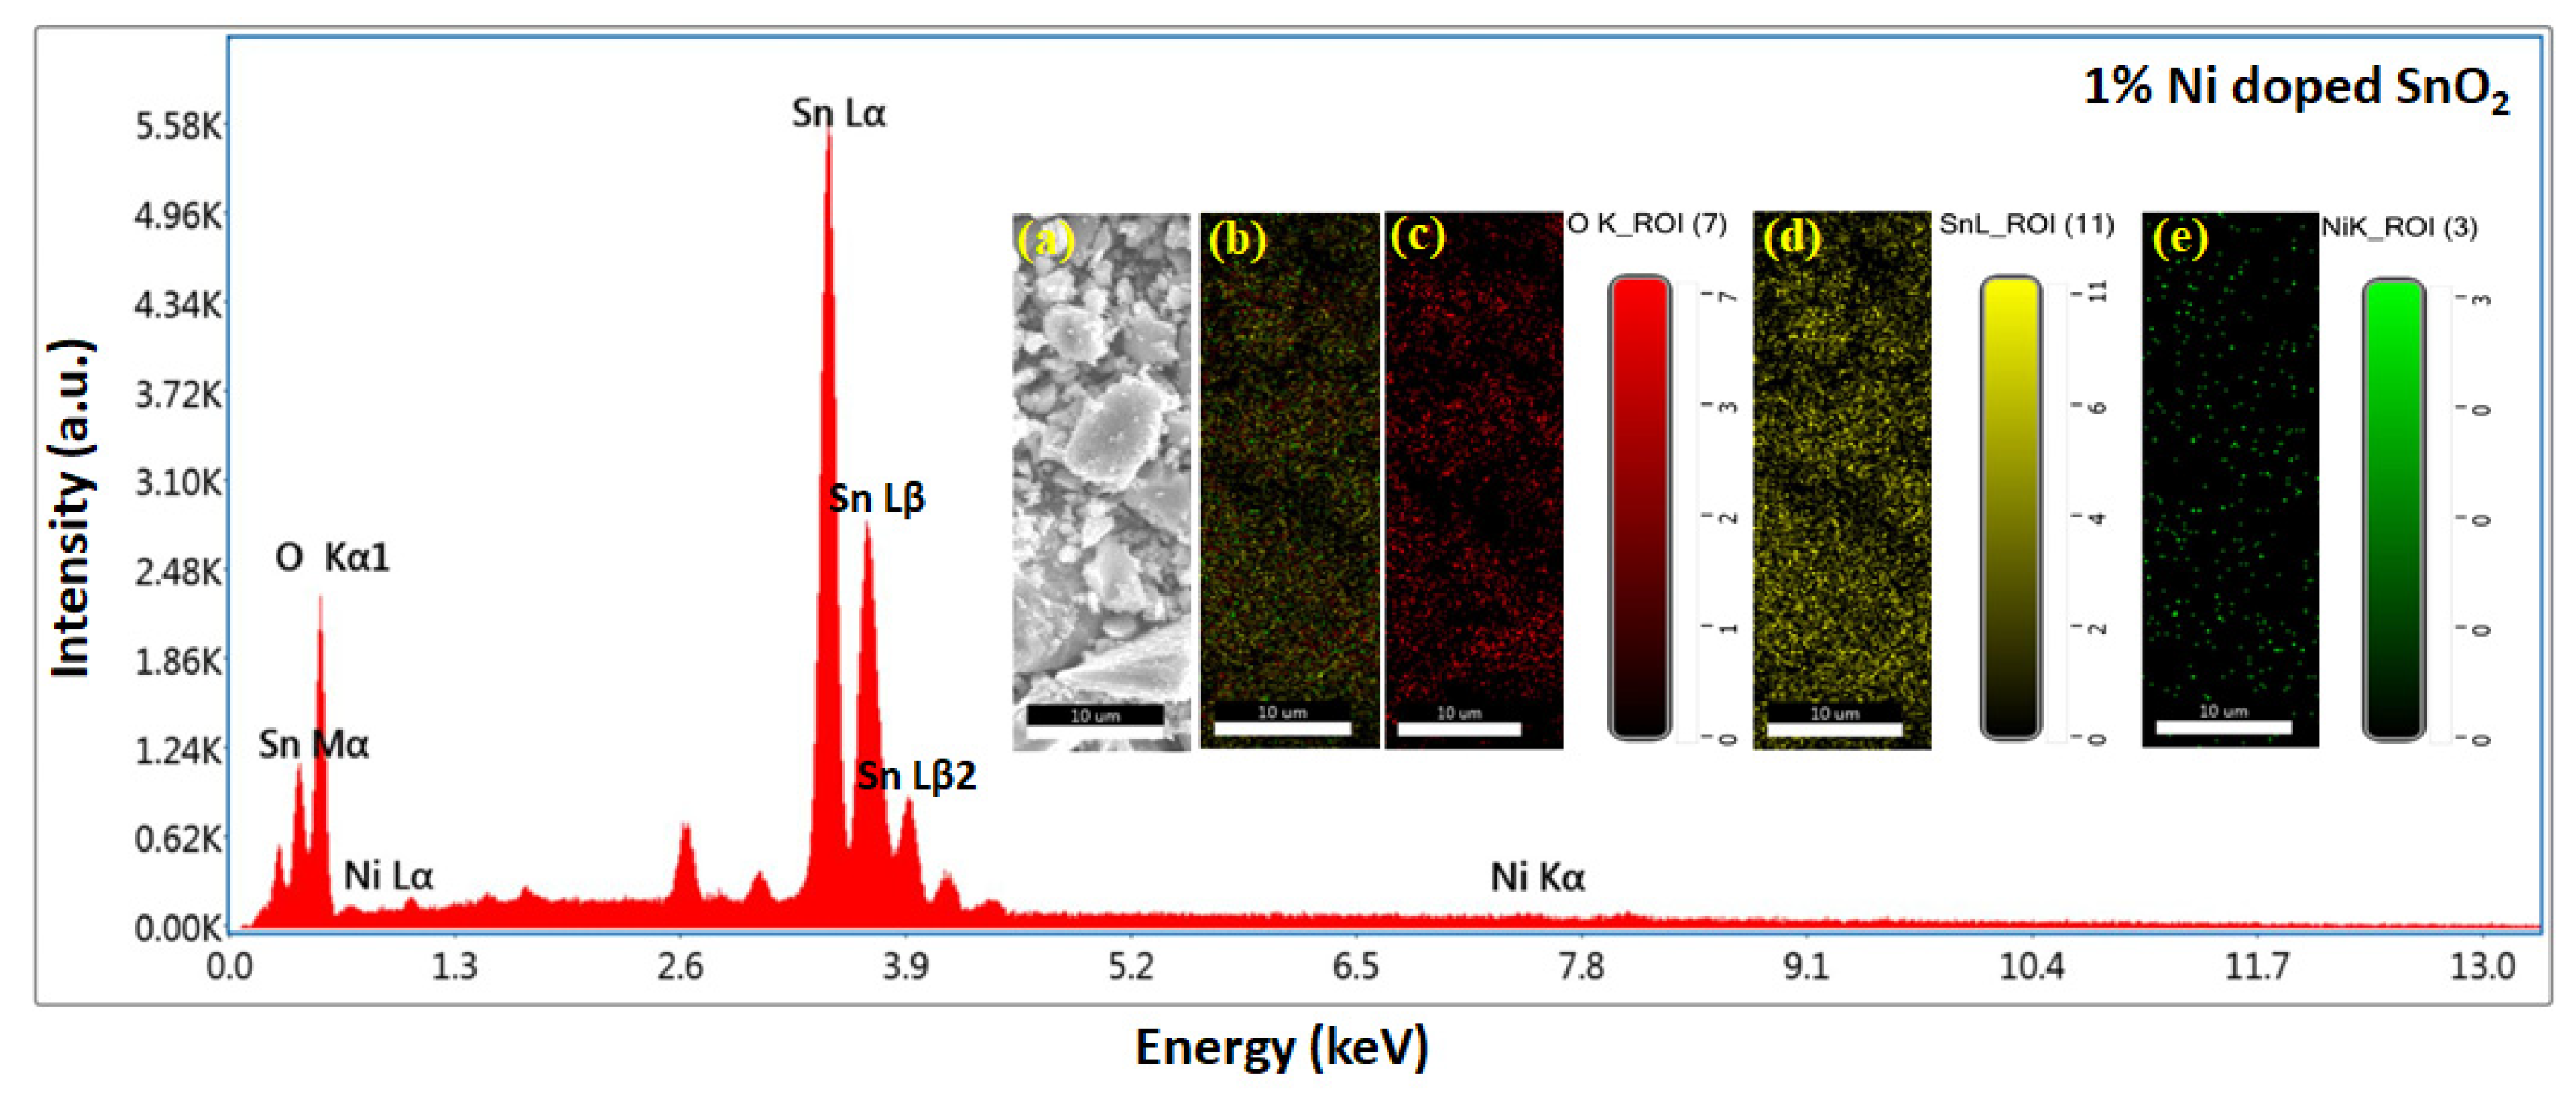
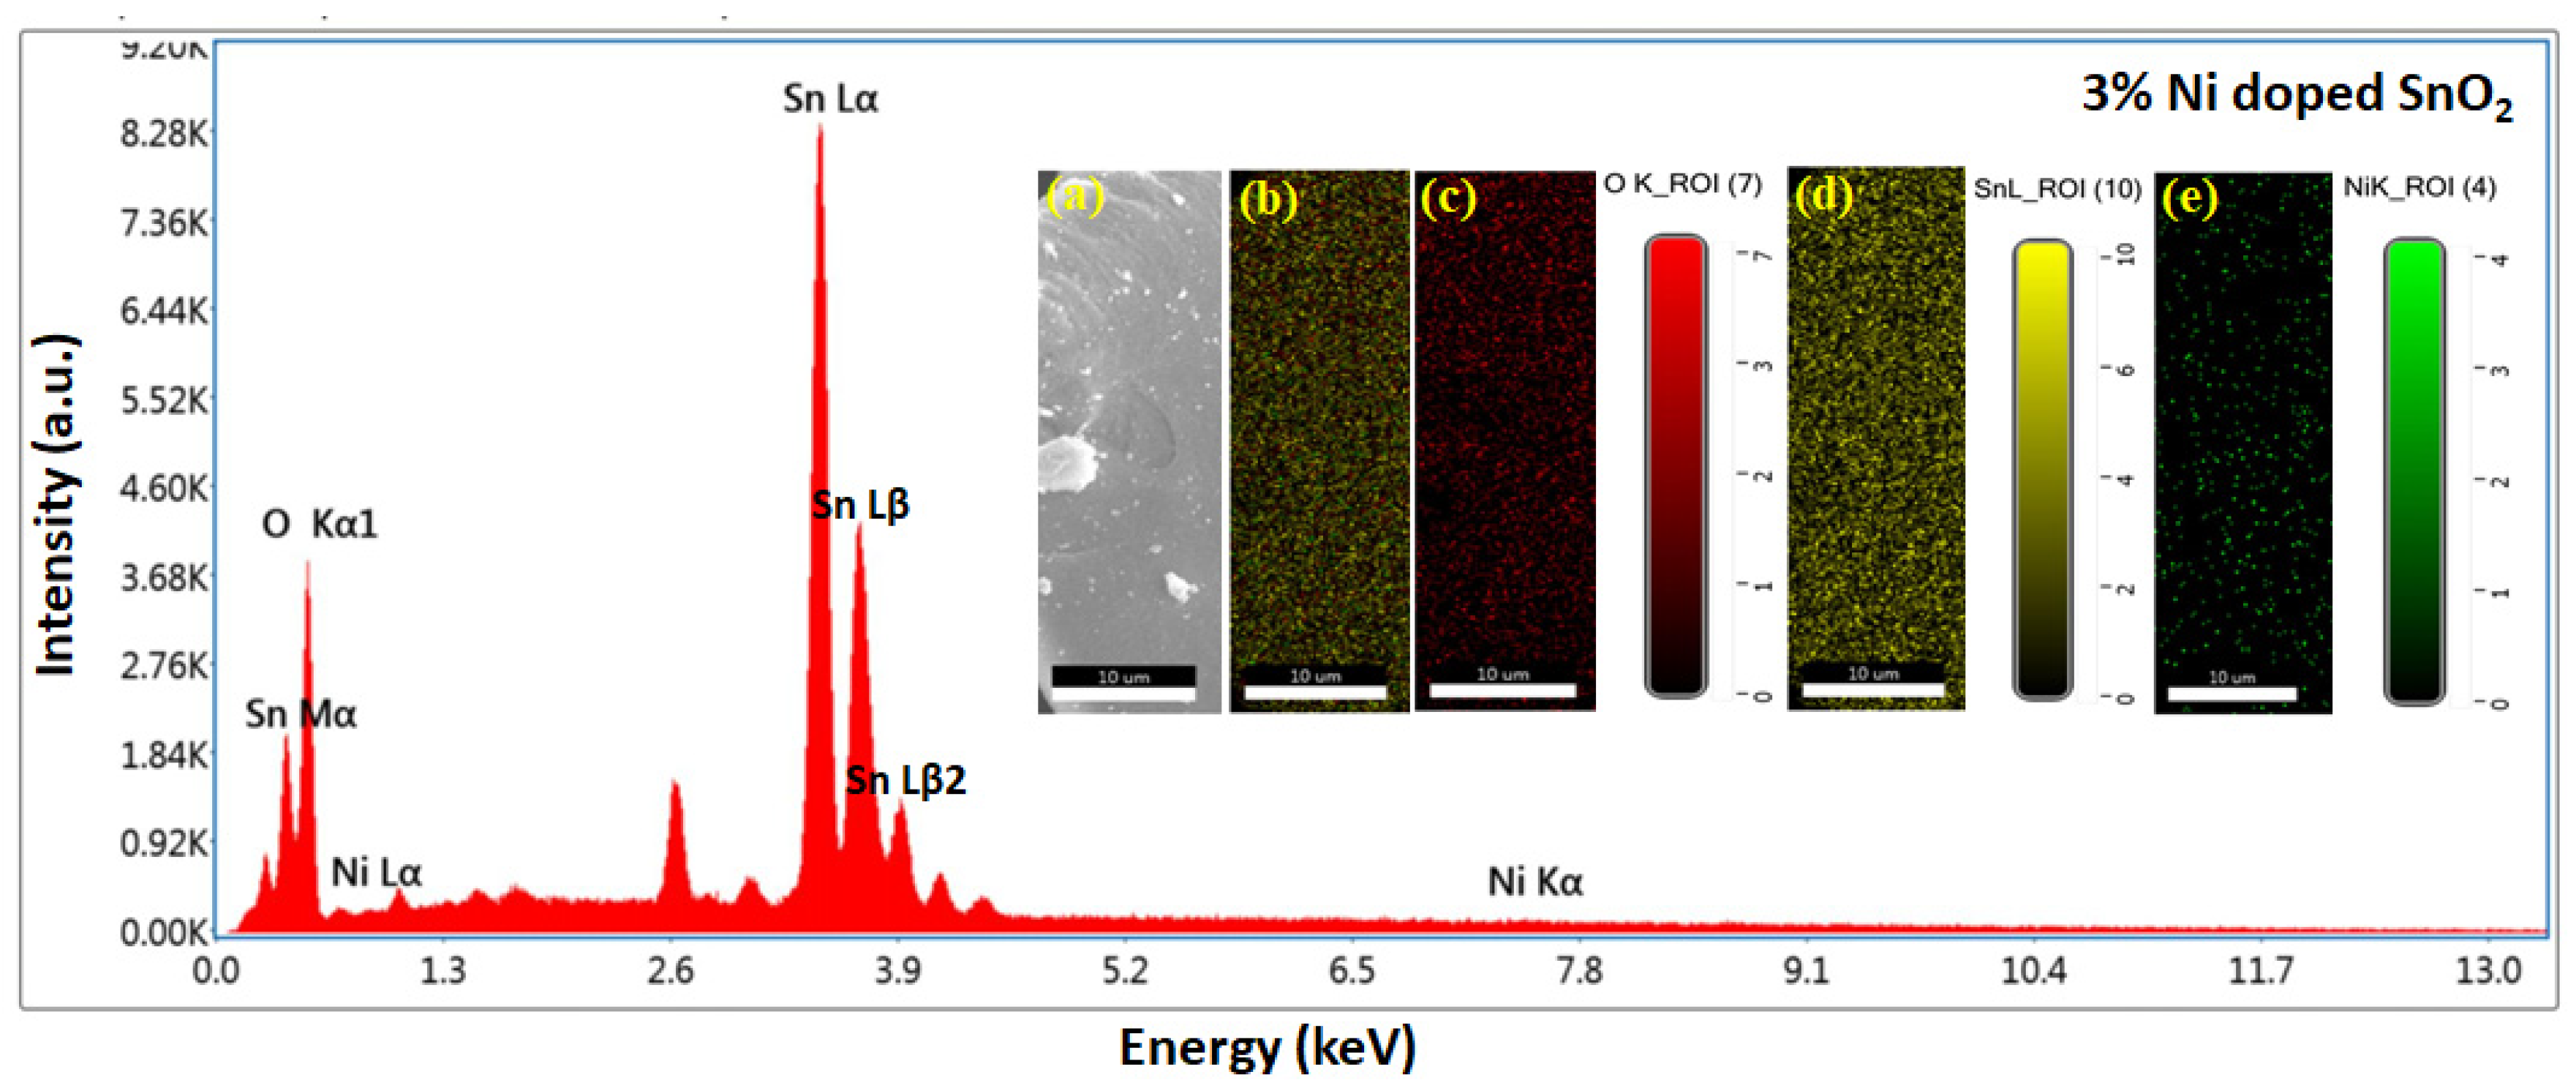
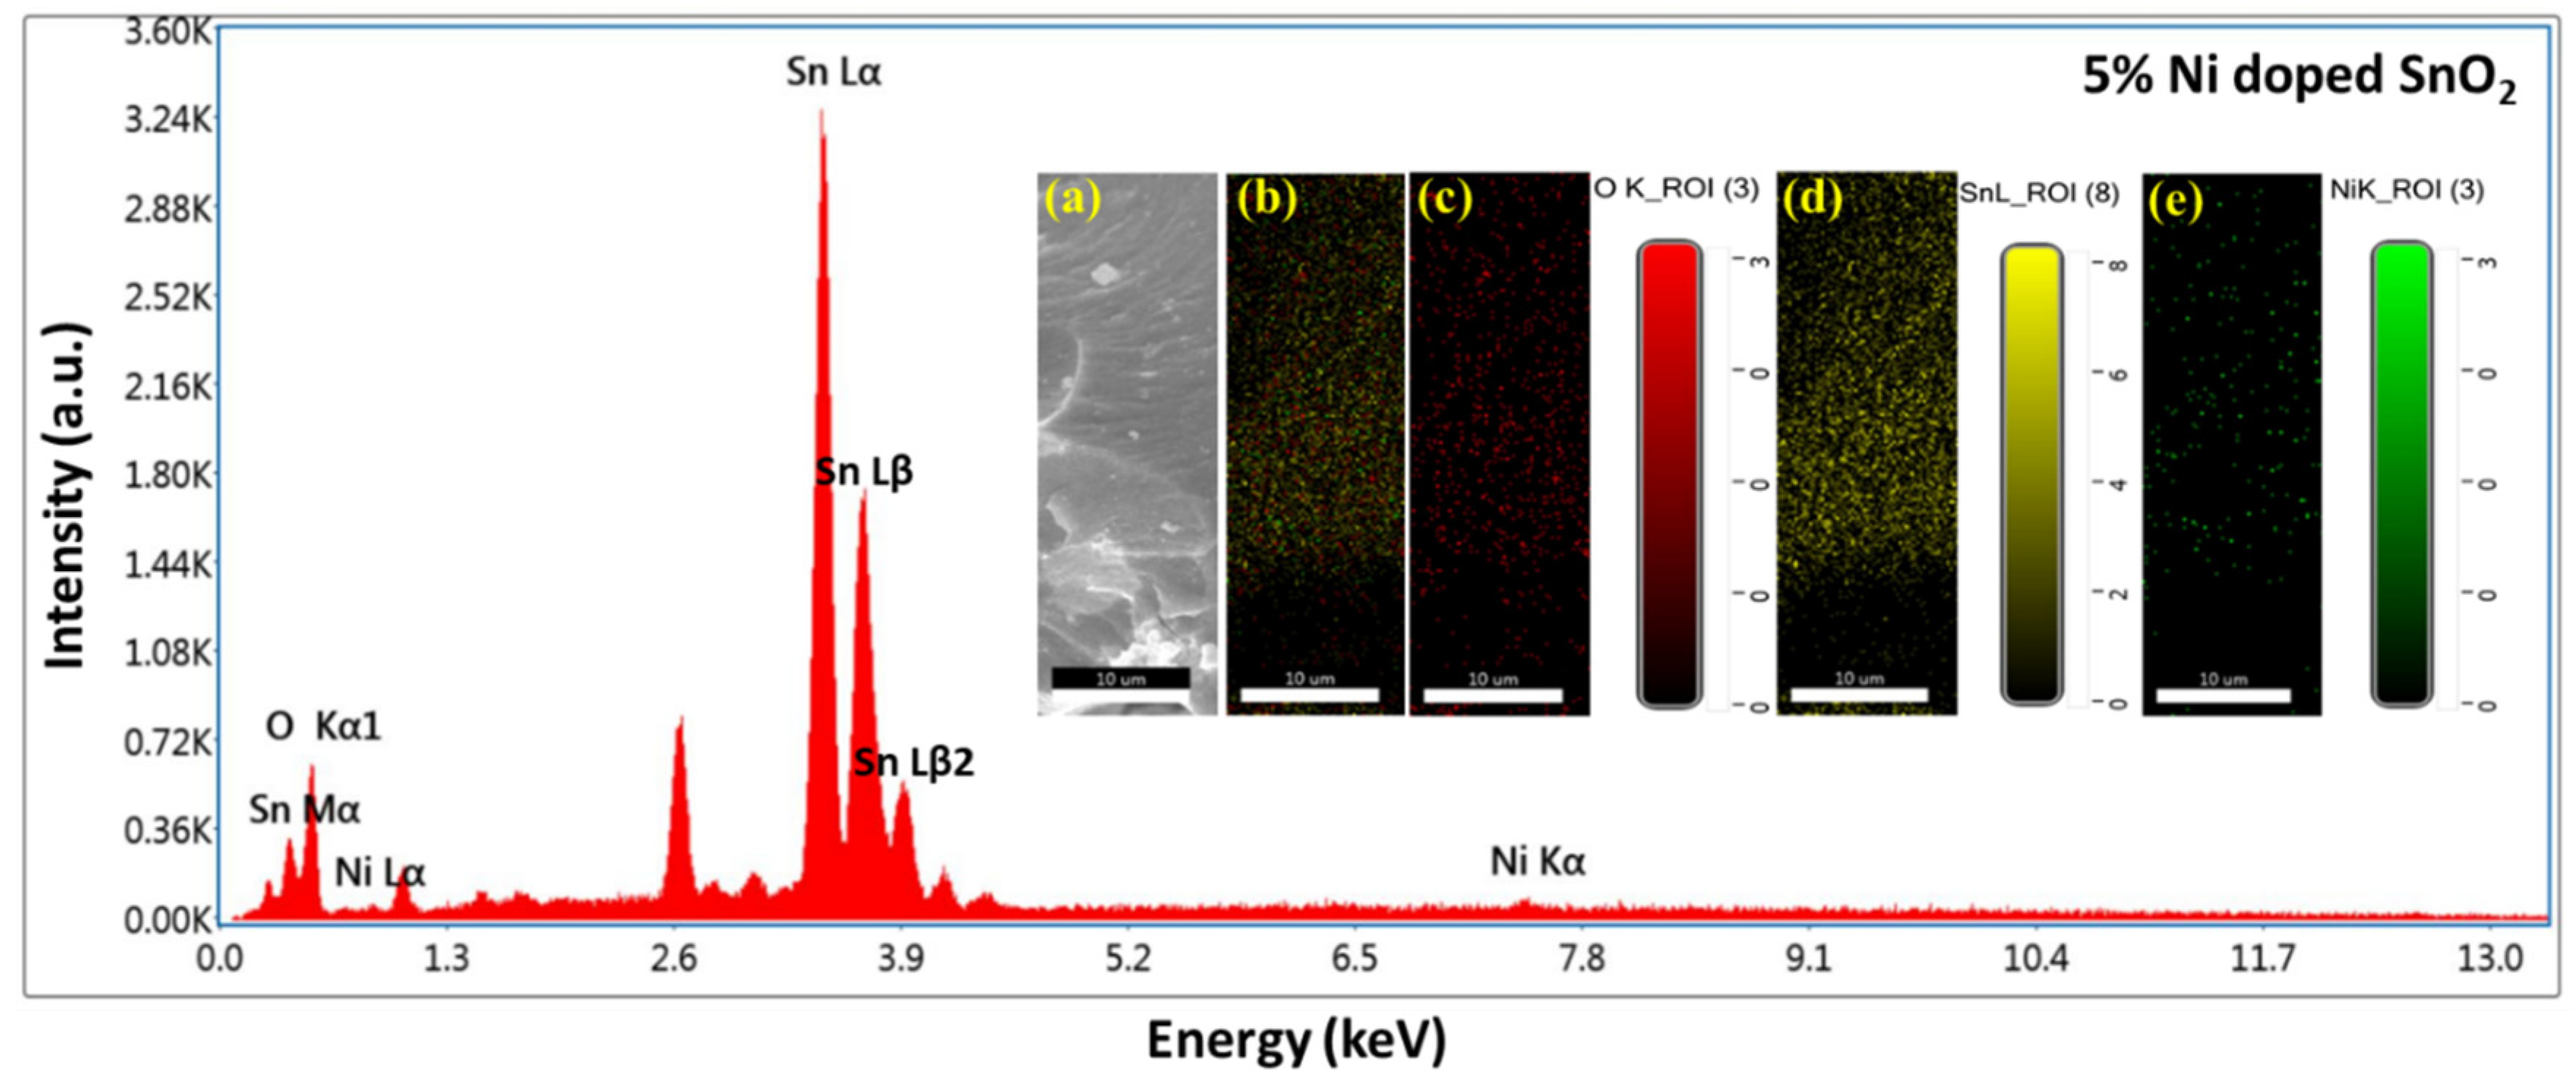
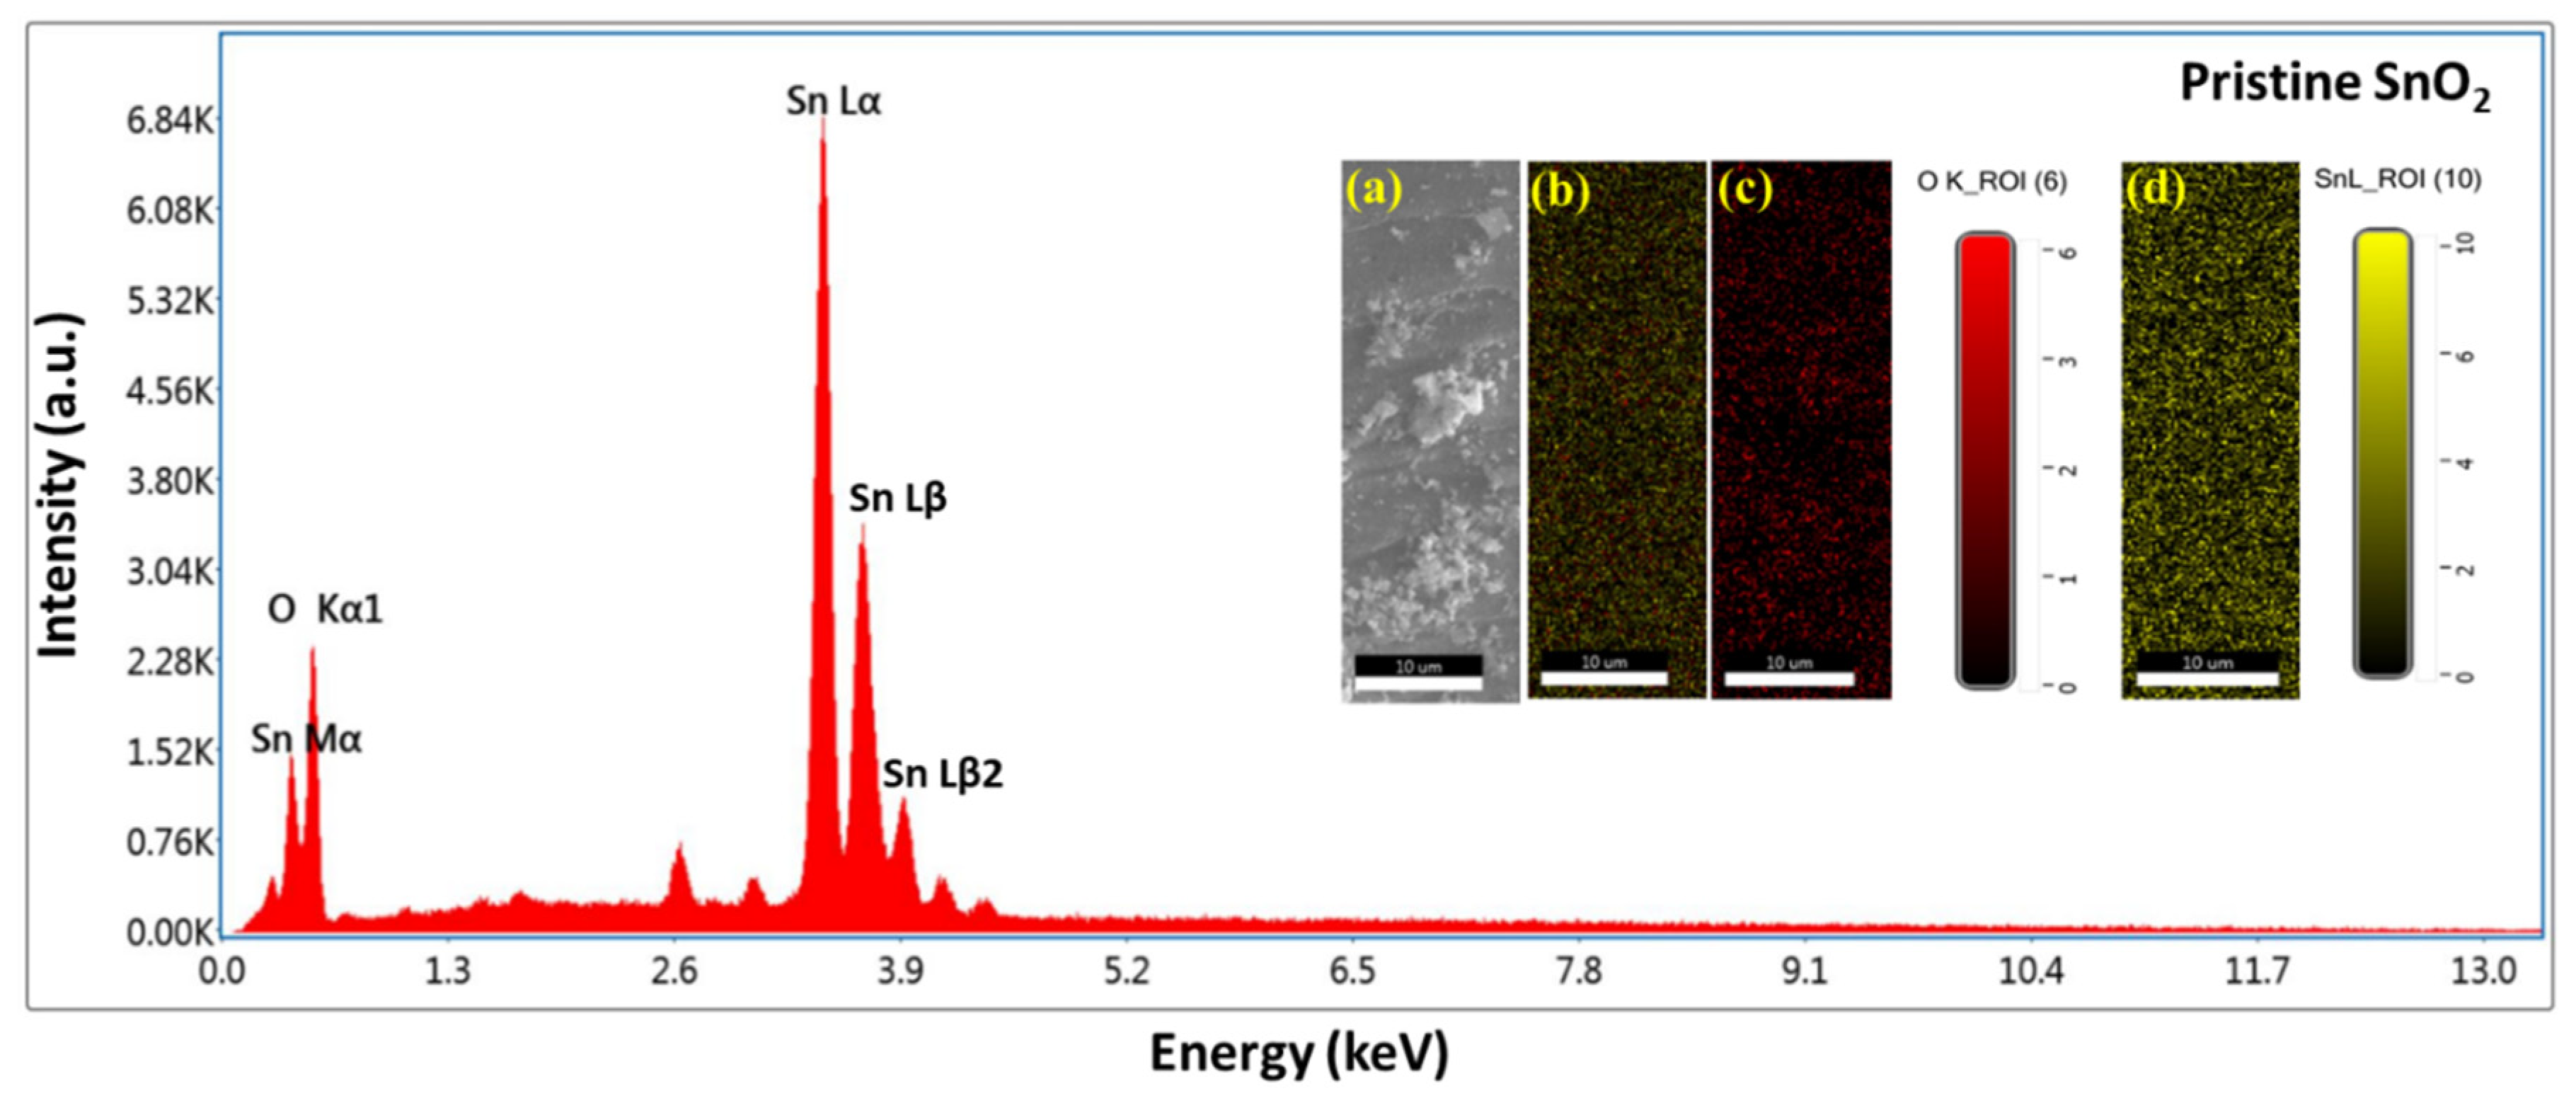
3.3. SEM, EDS, and Mapping
3.4. Electrochemical Studies
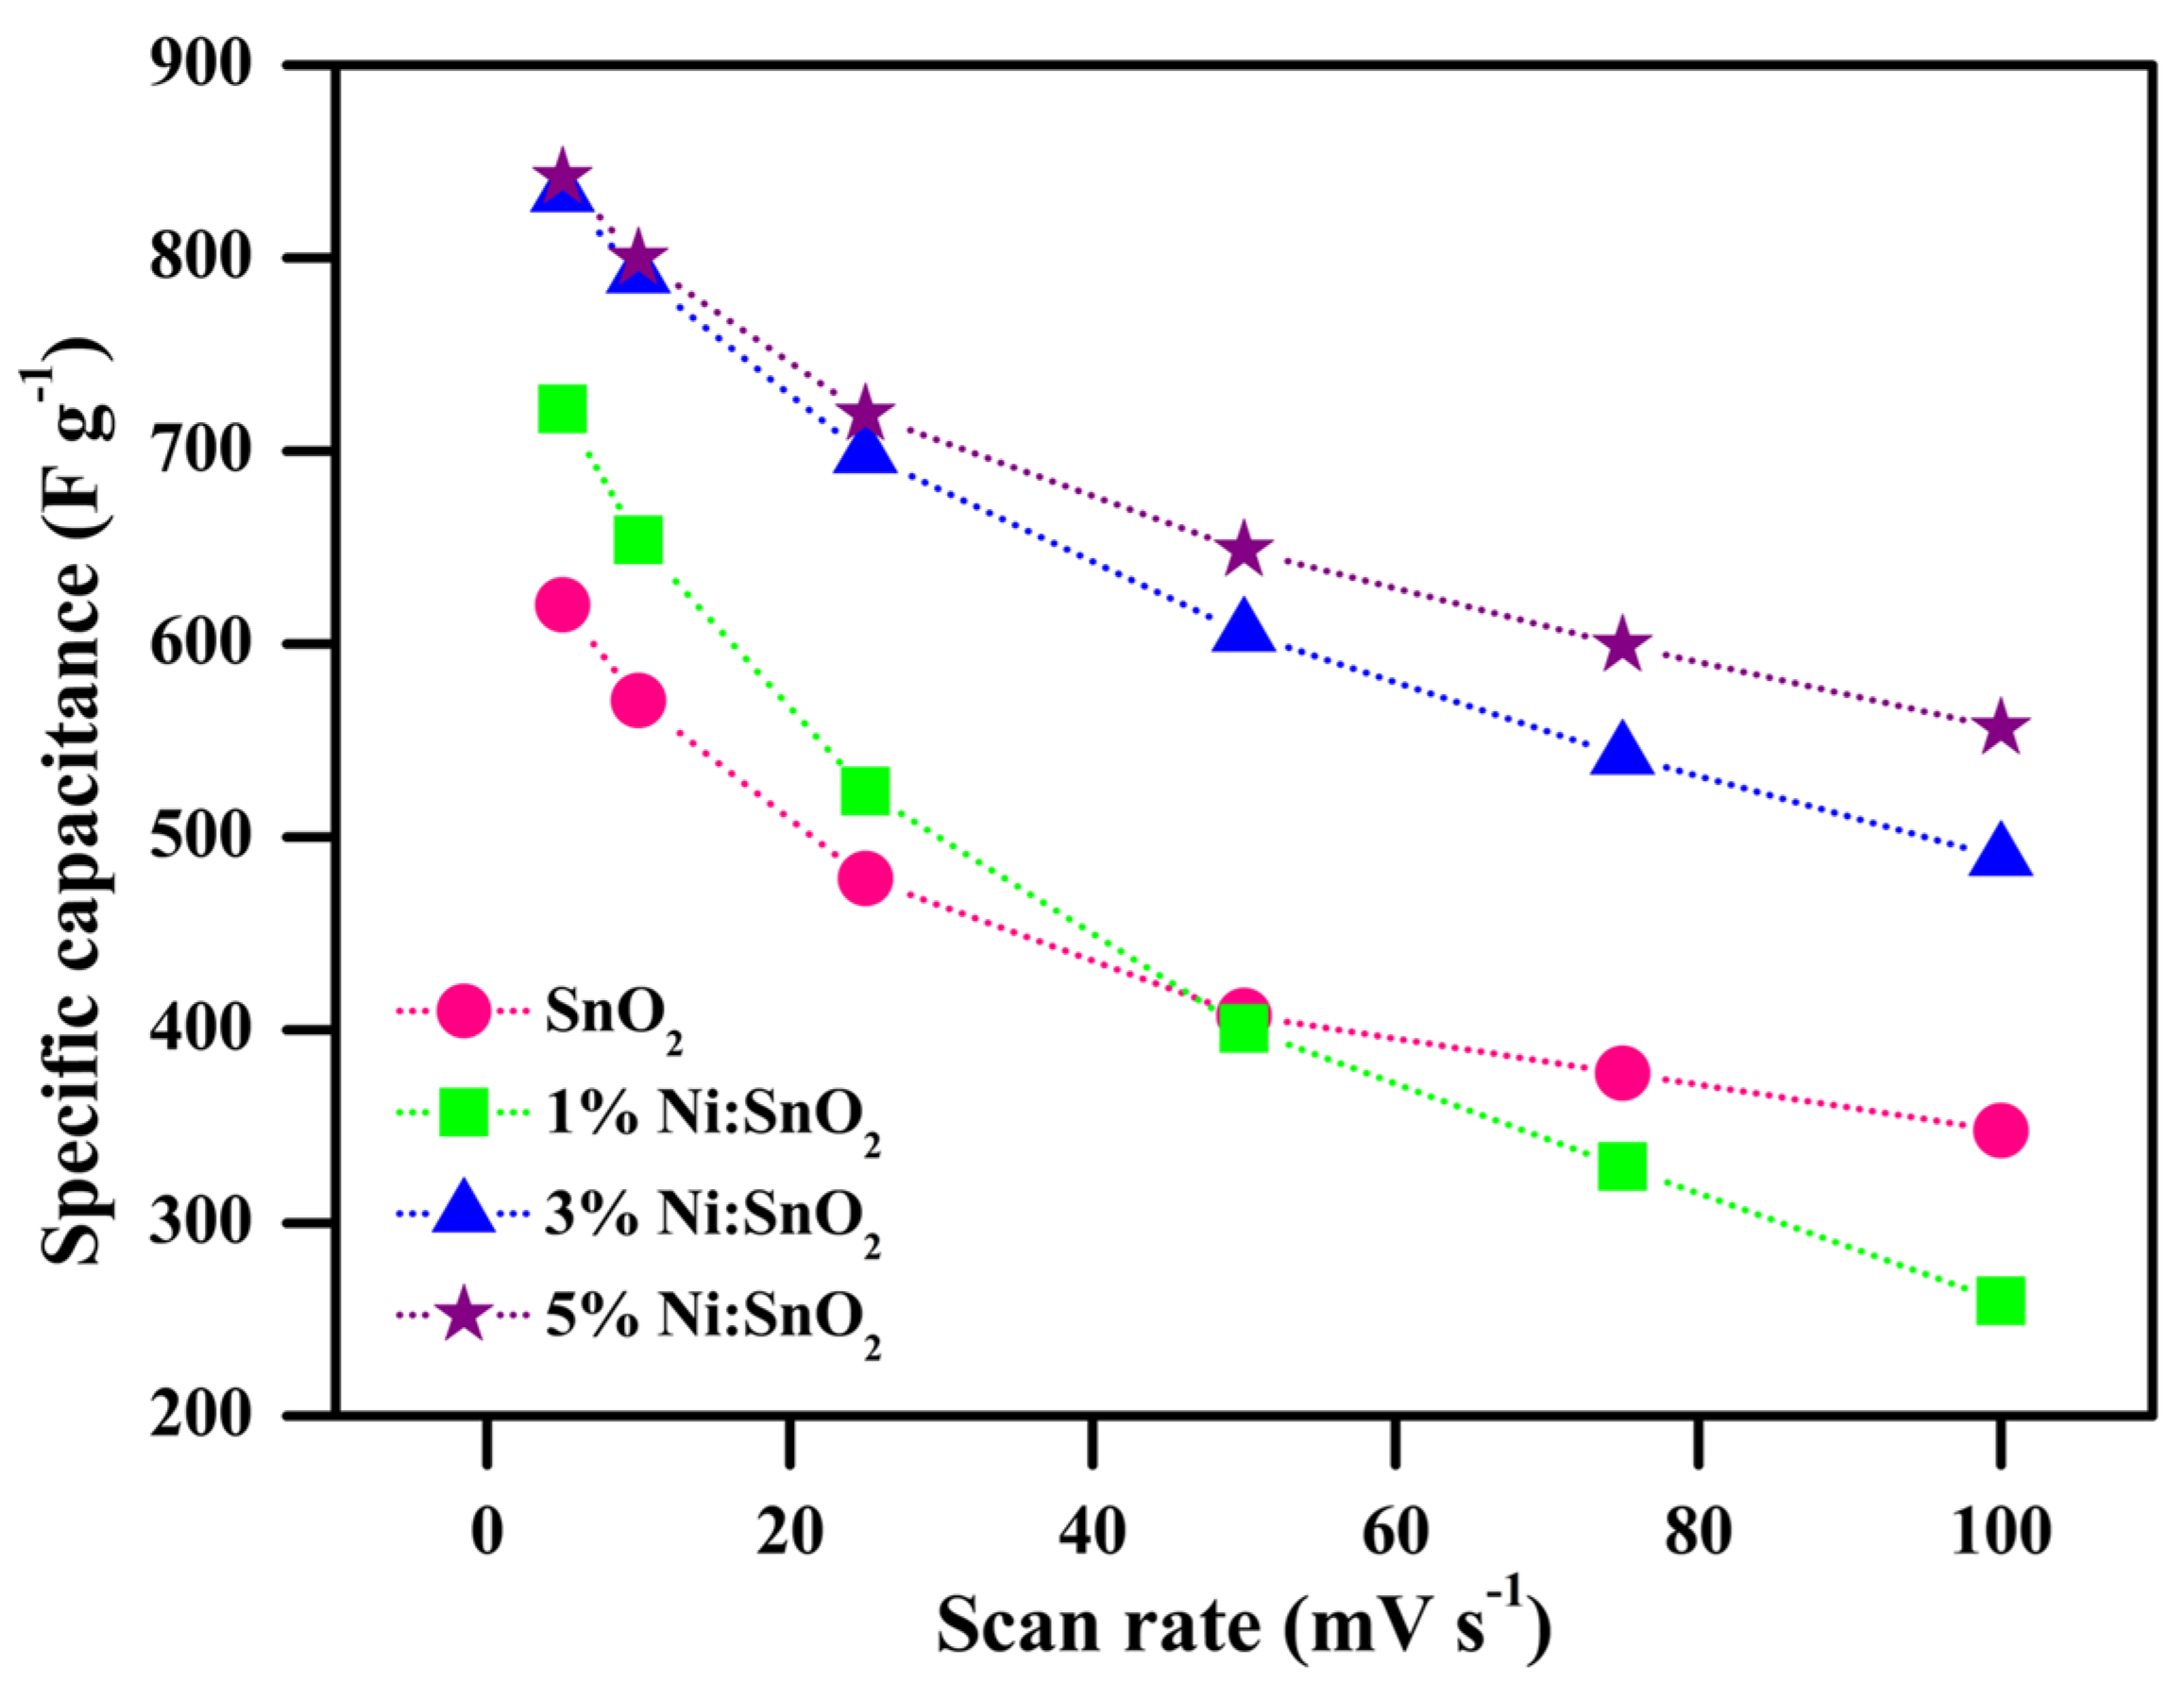
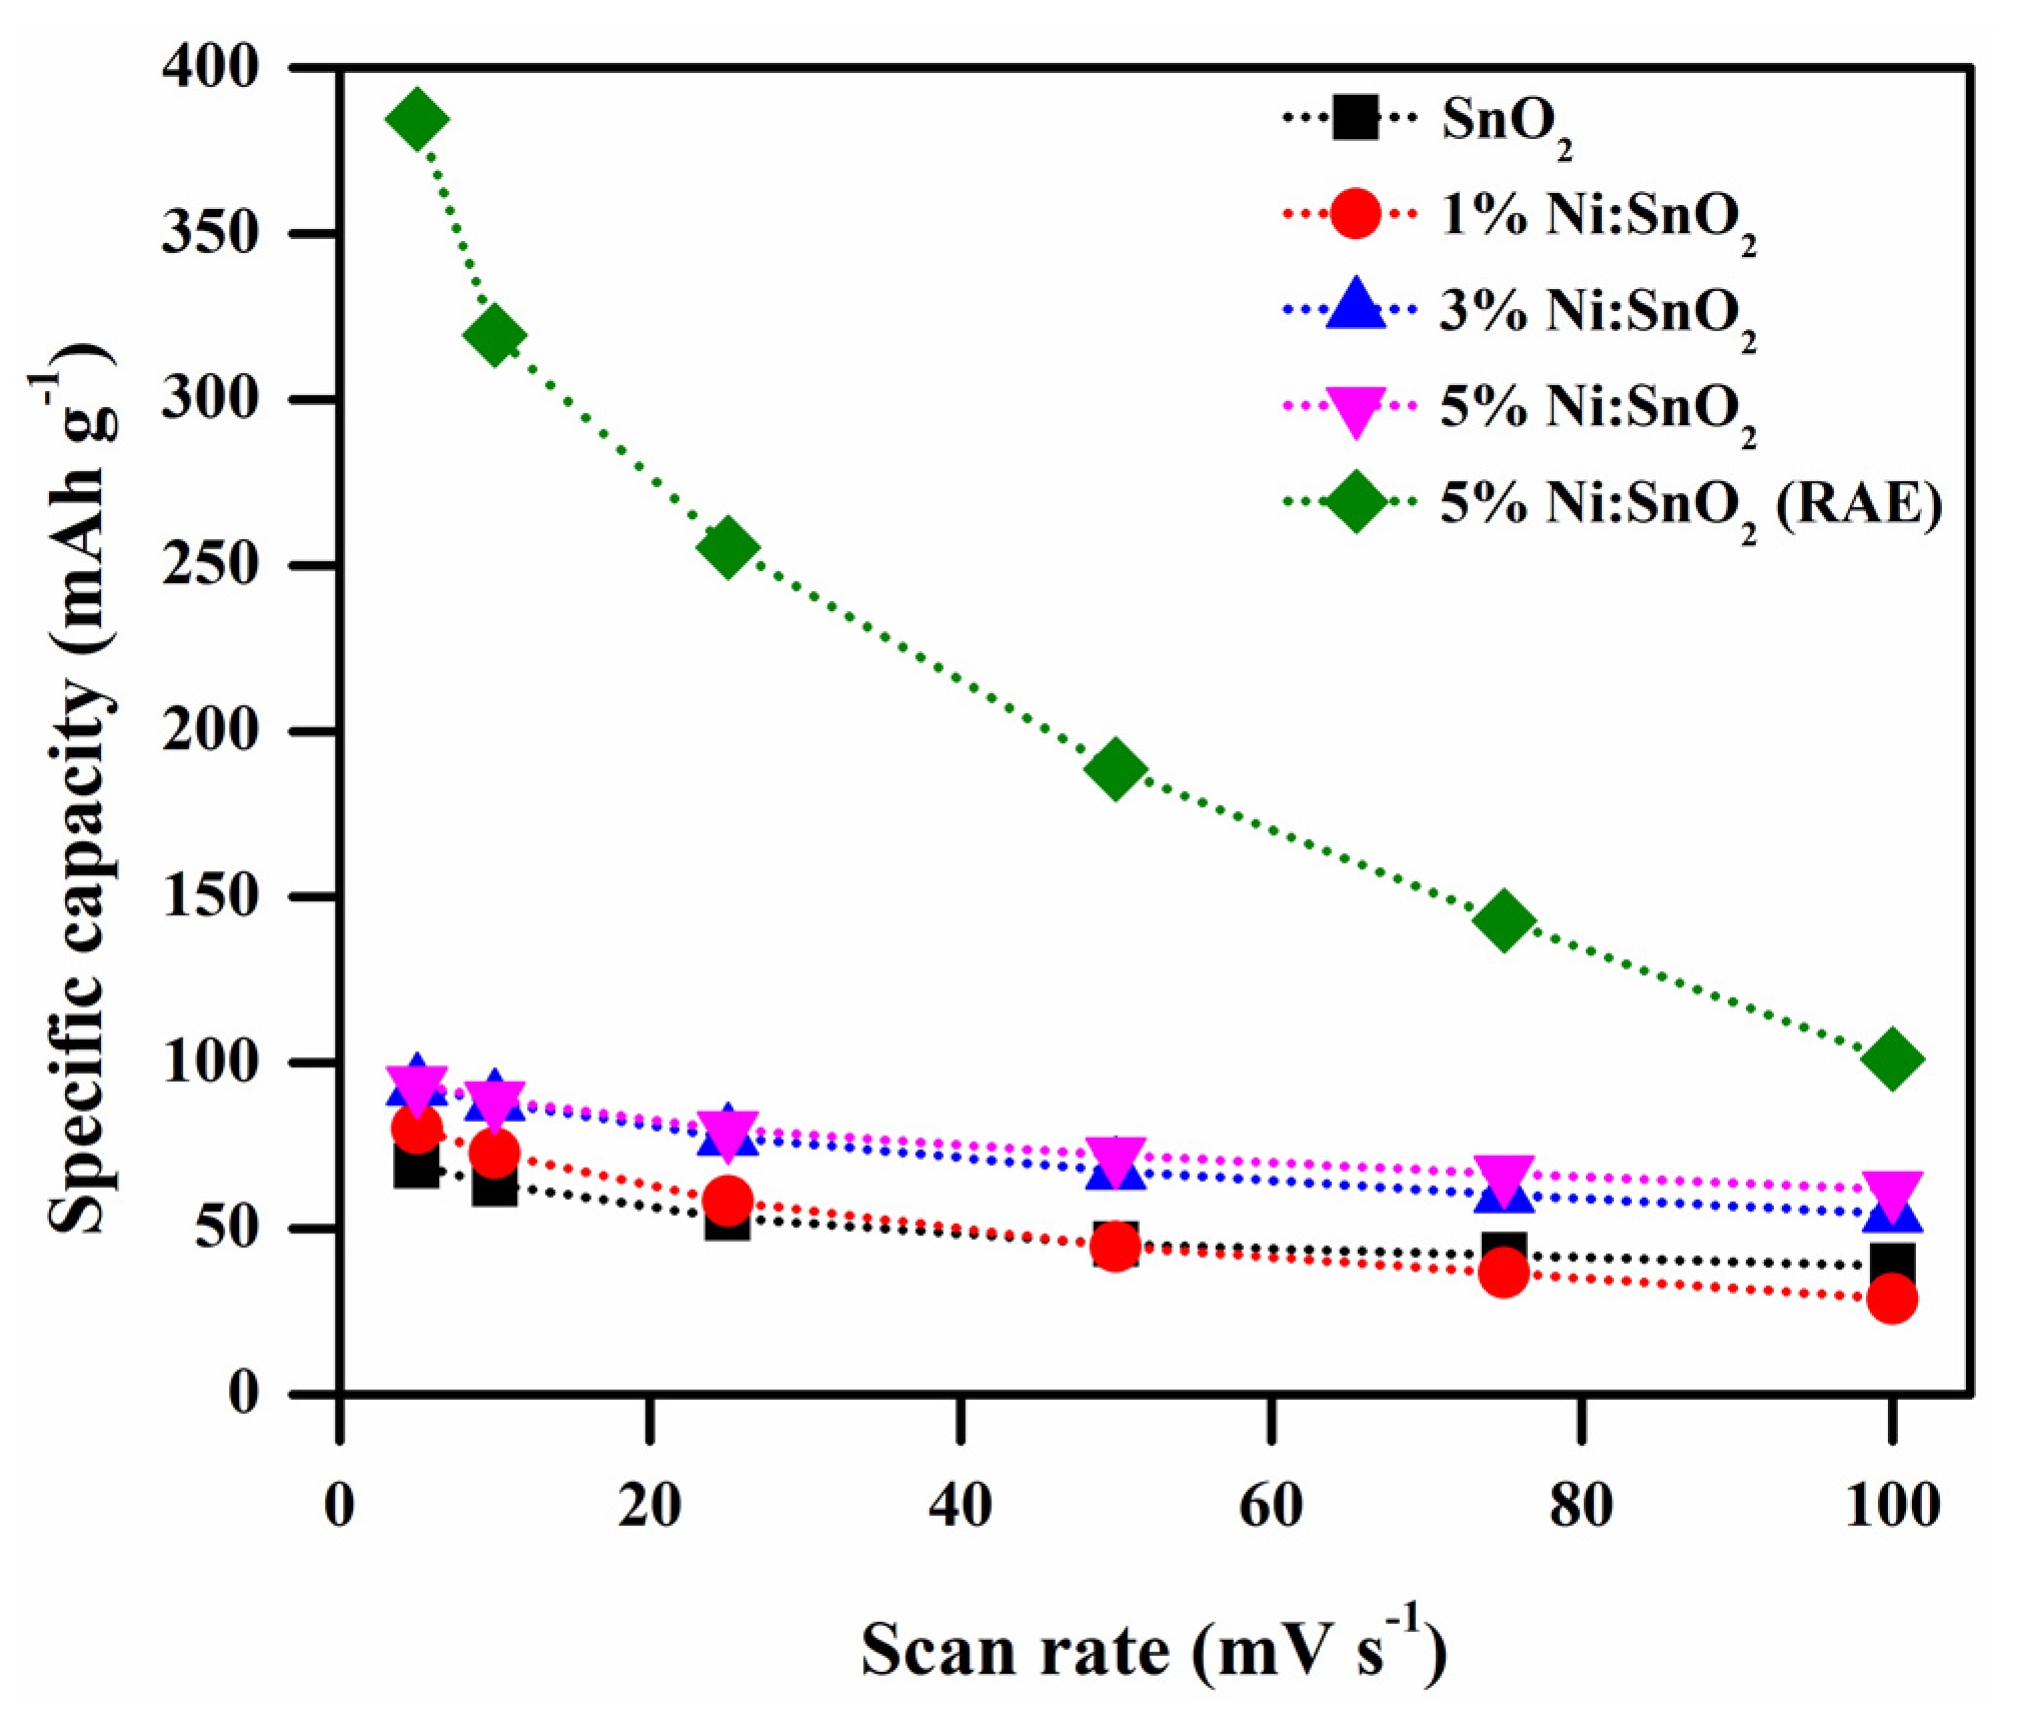
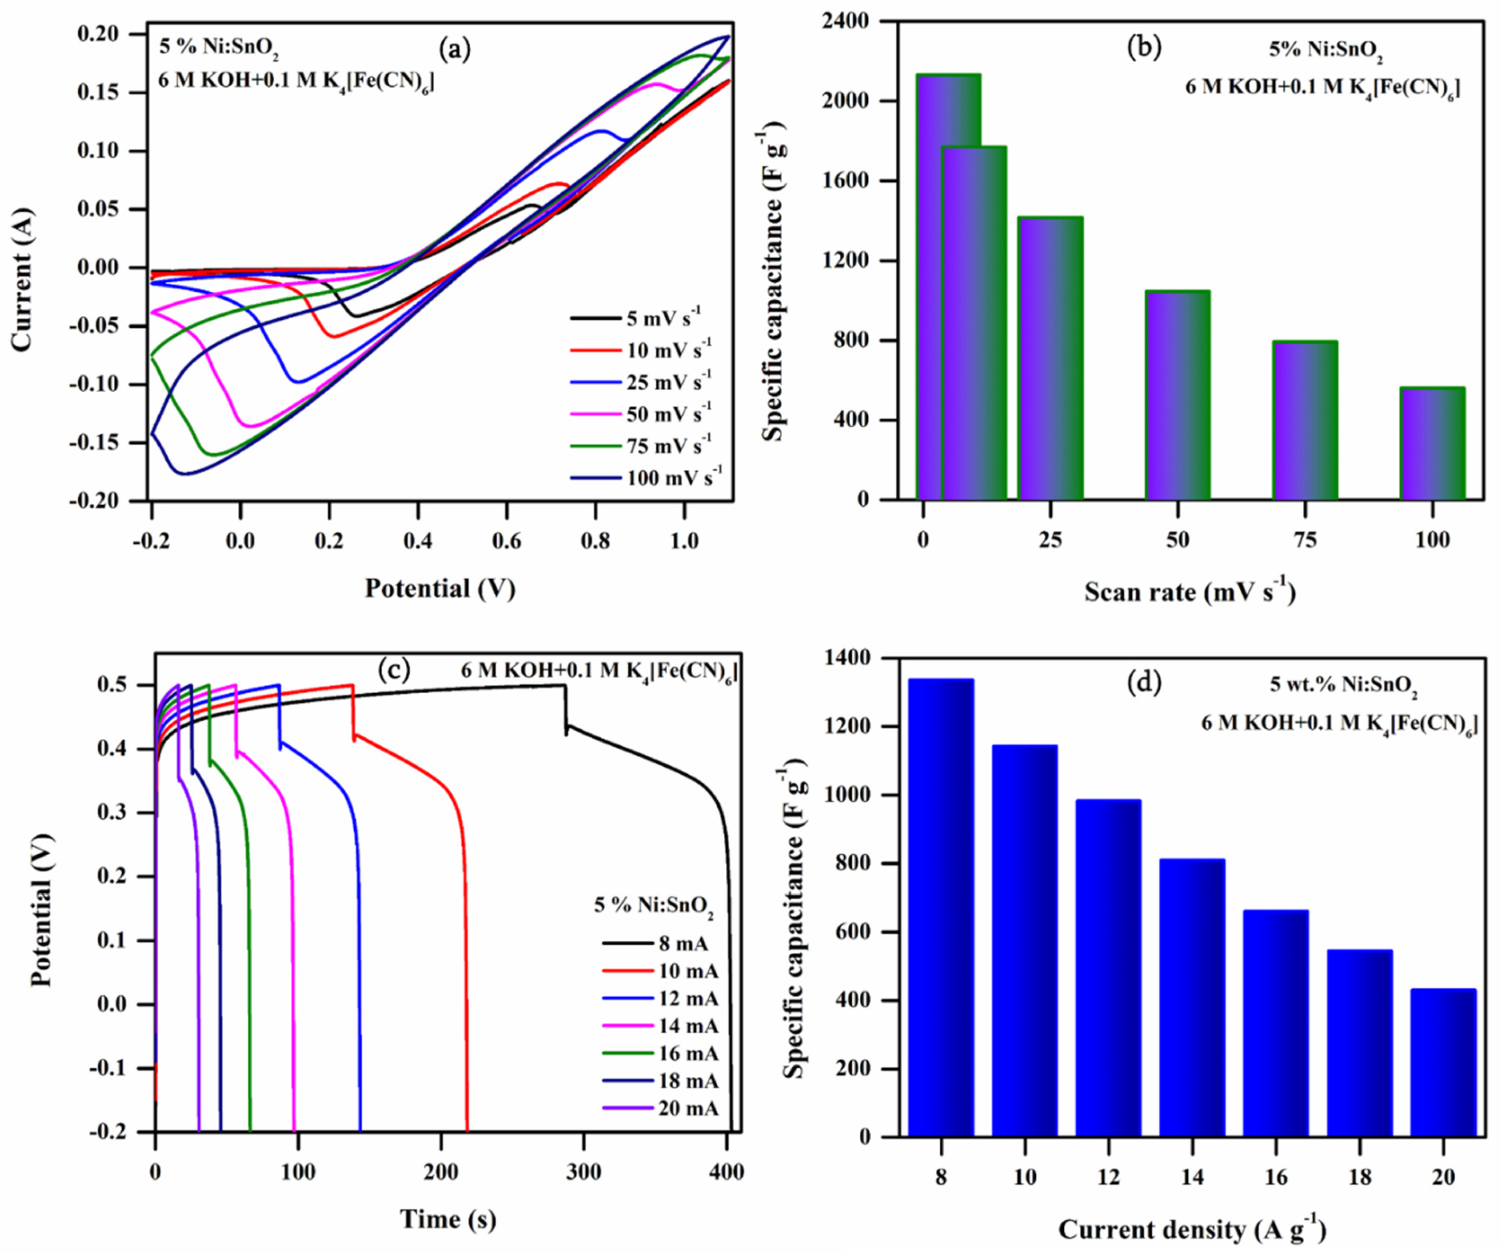
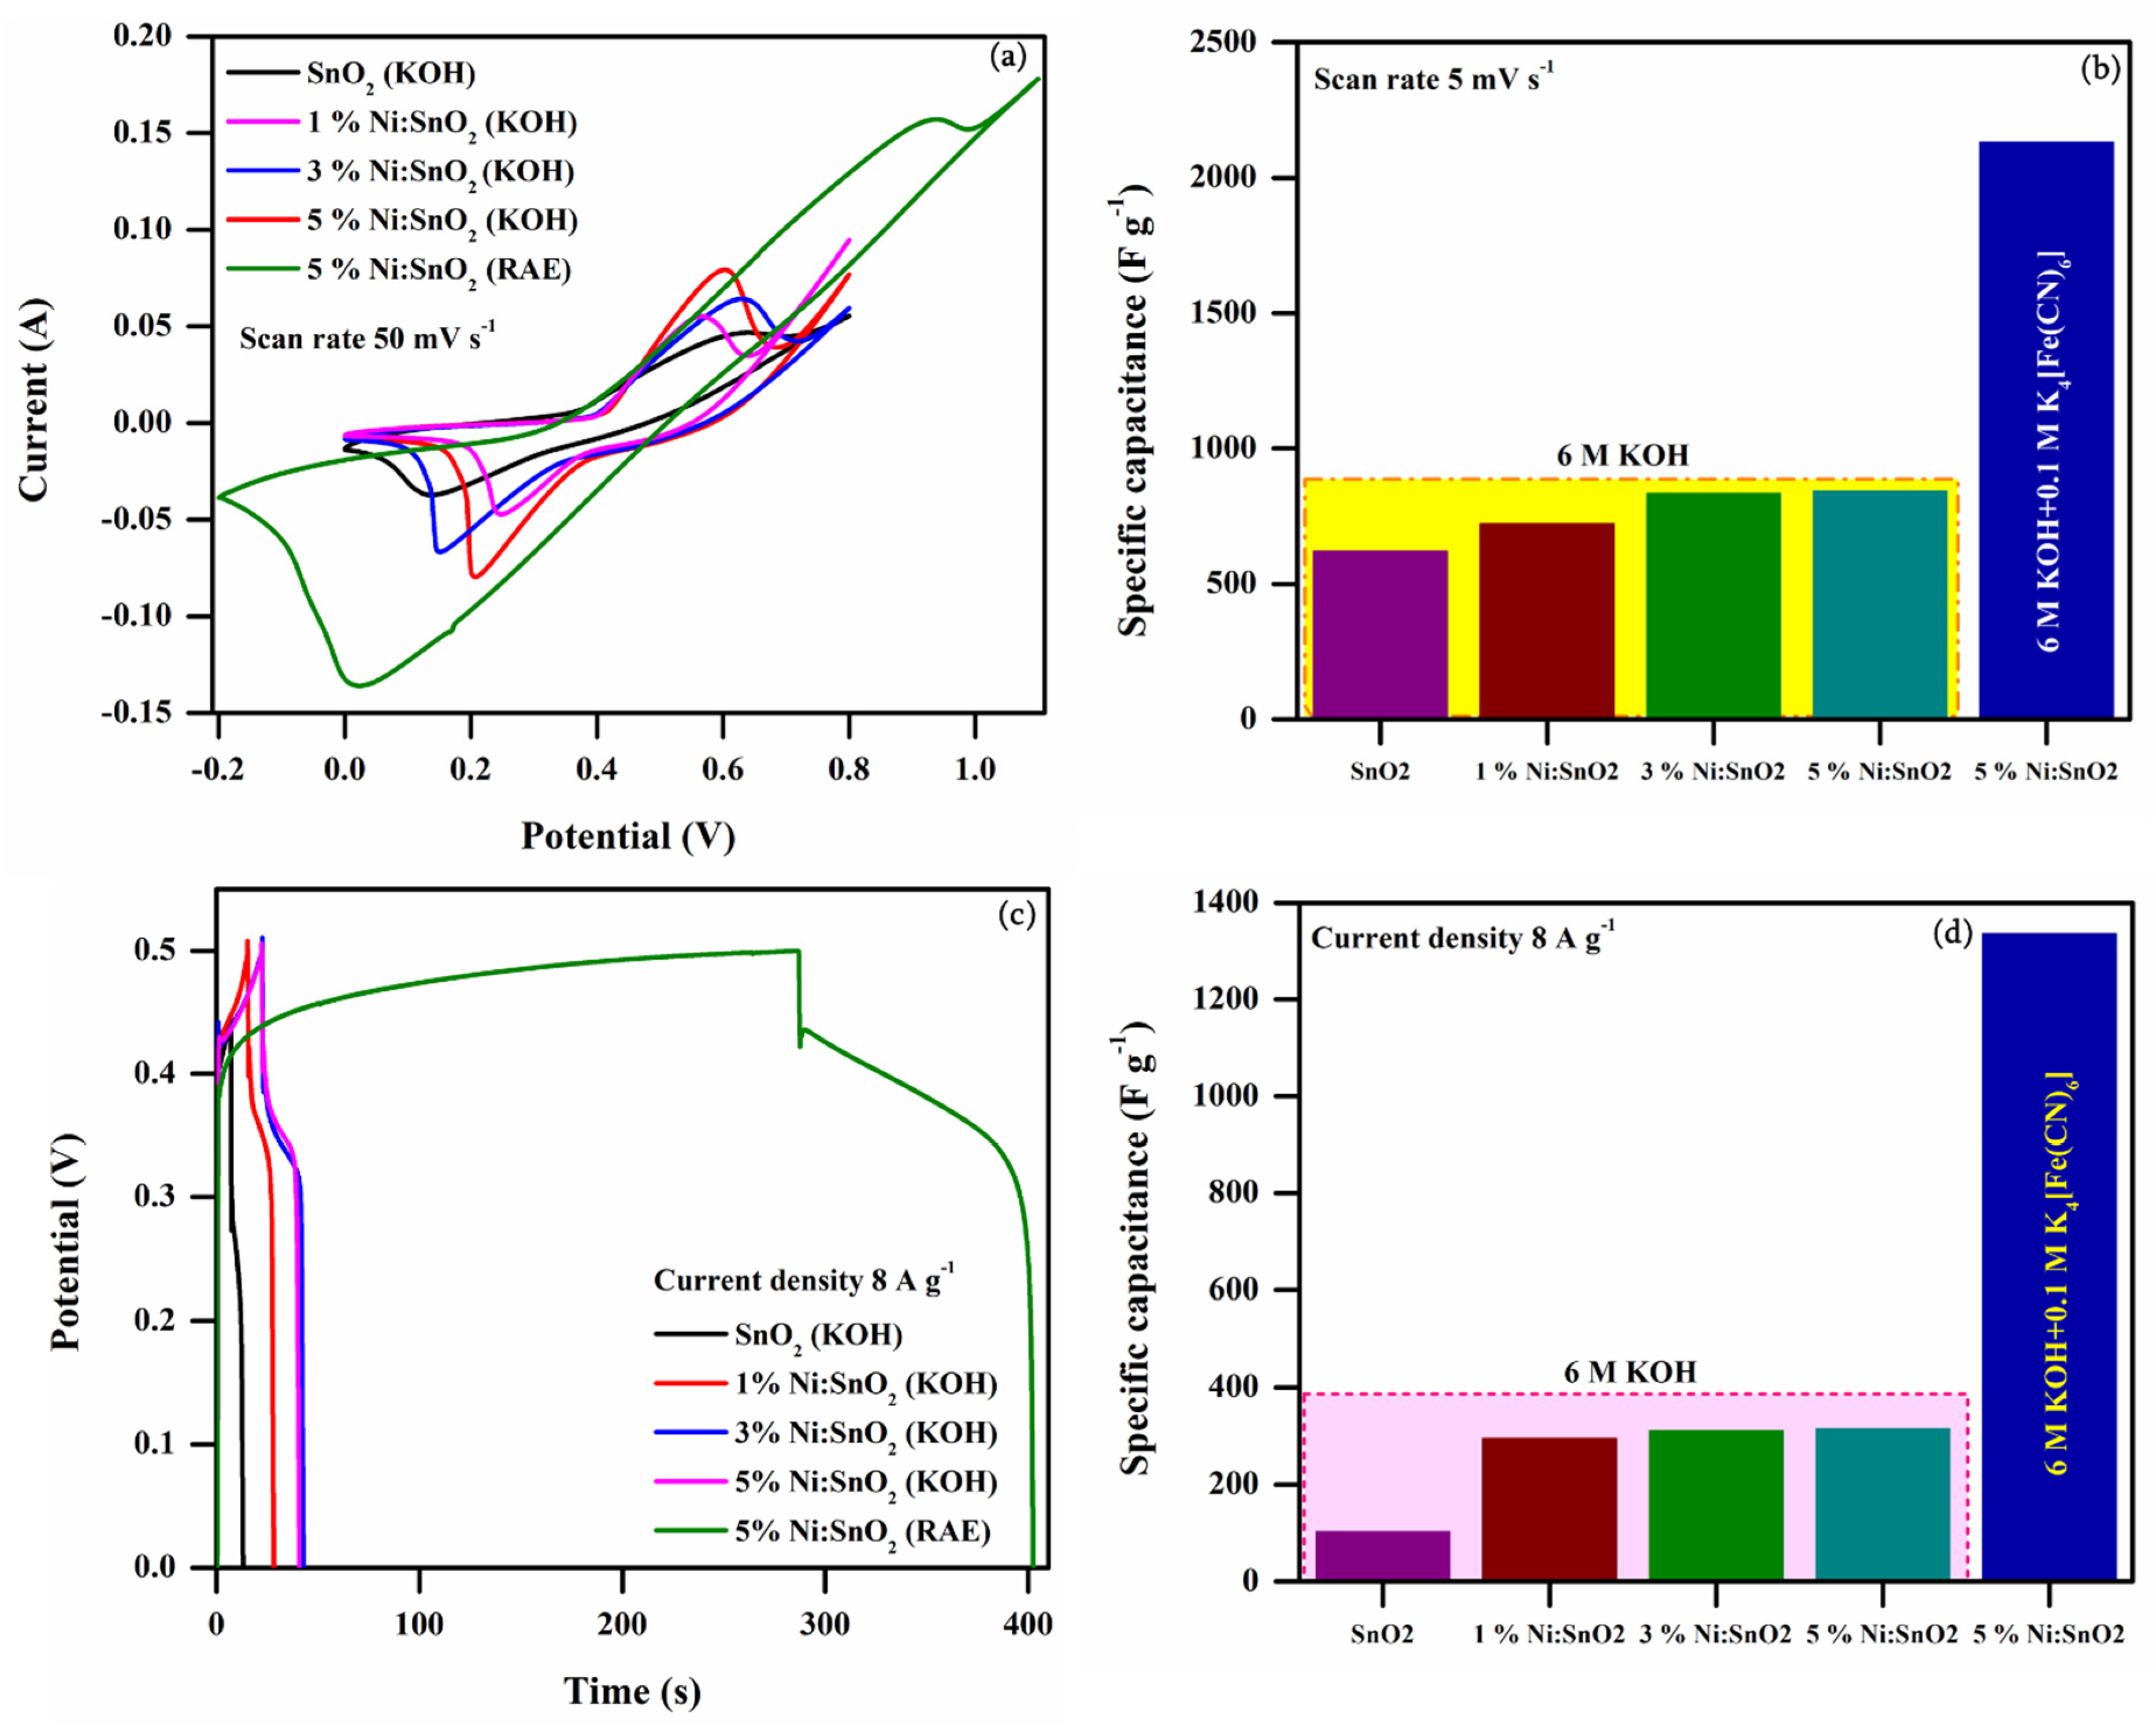
3.4.1. Cyclic Voltammetry Analysis
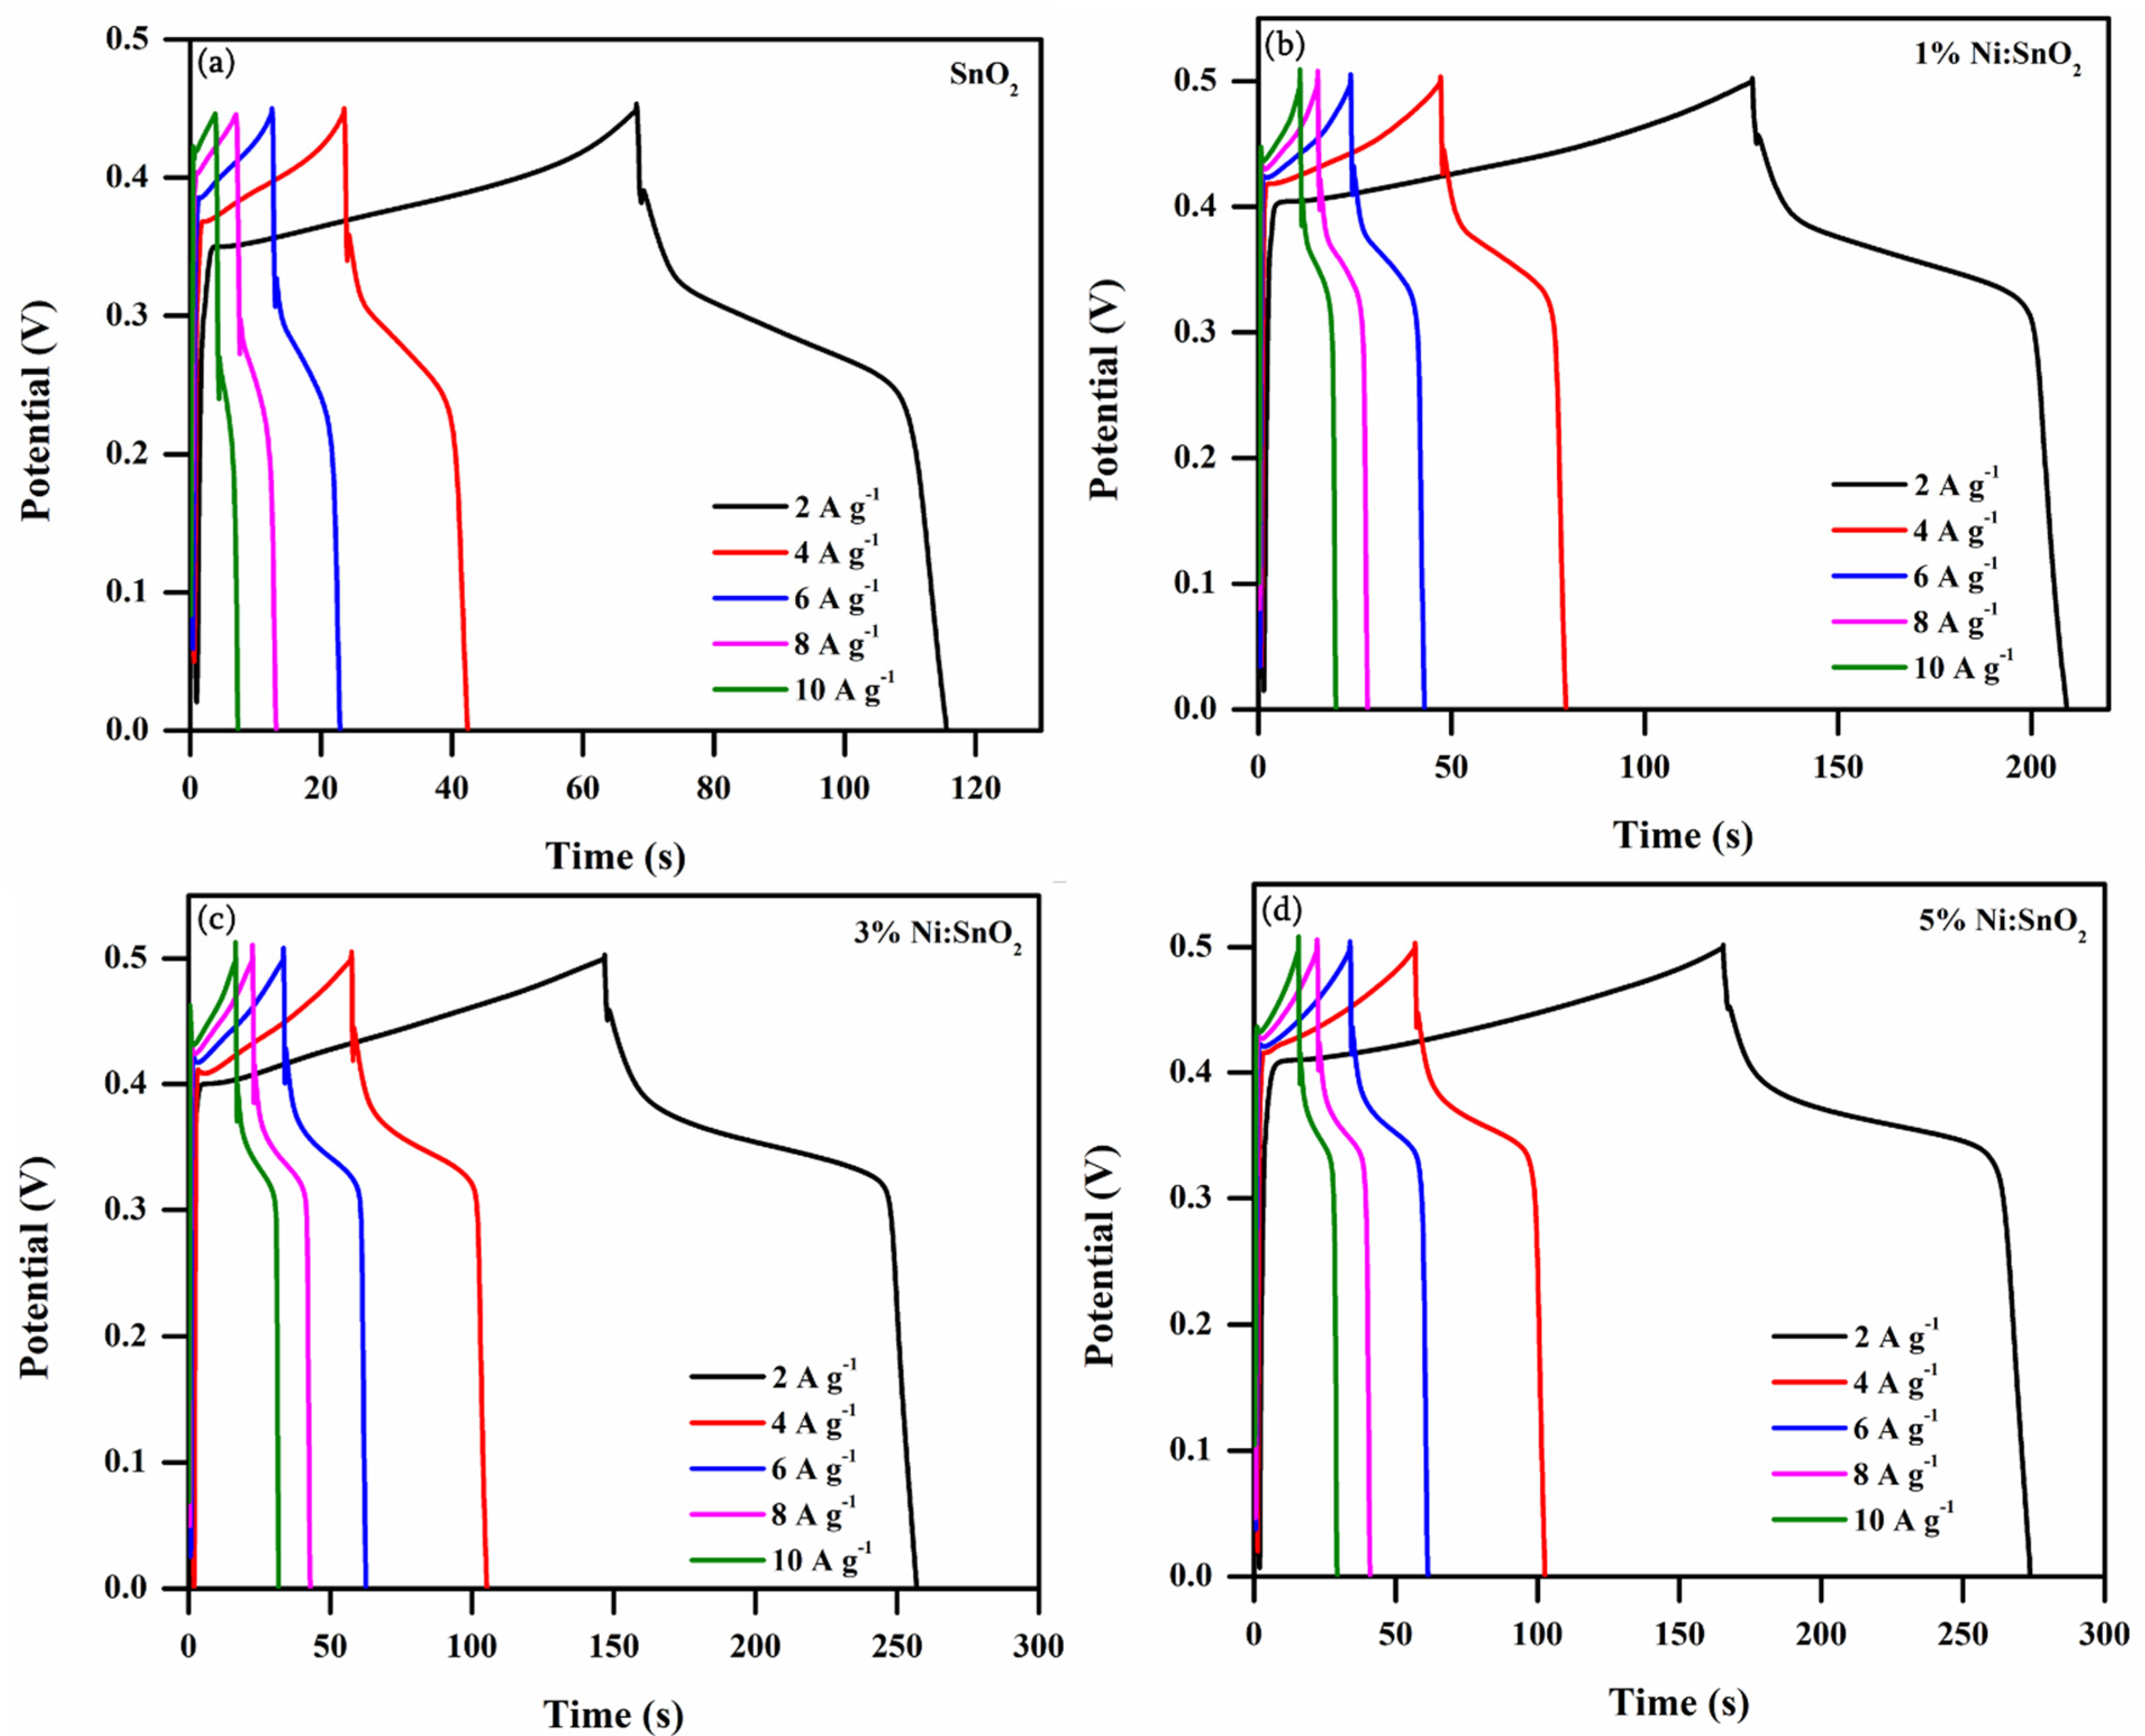
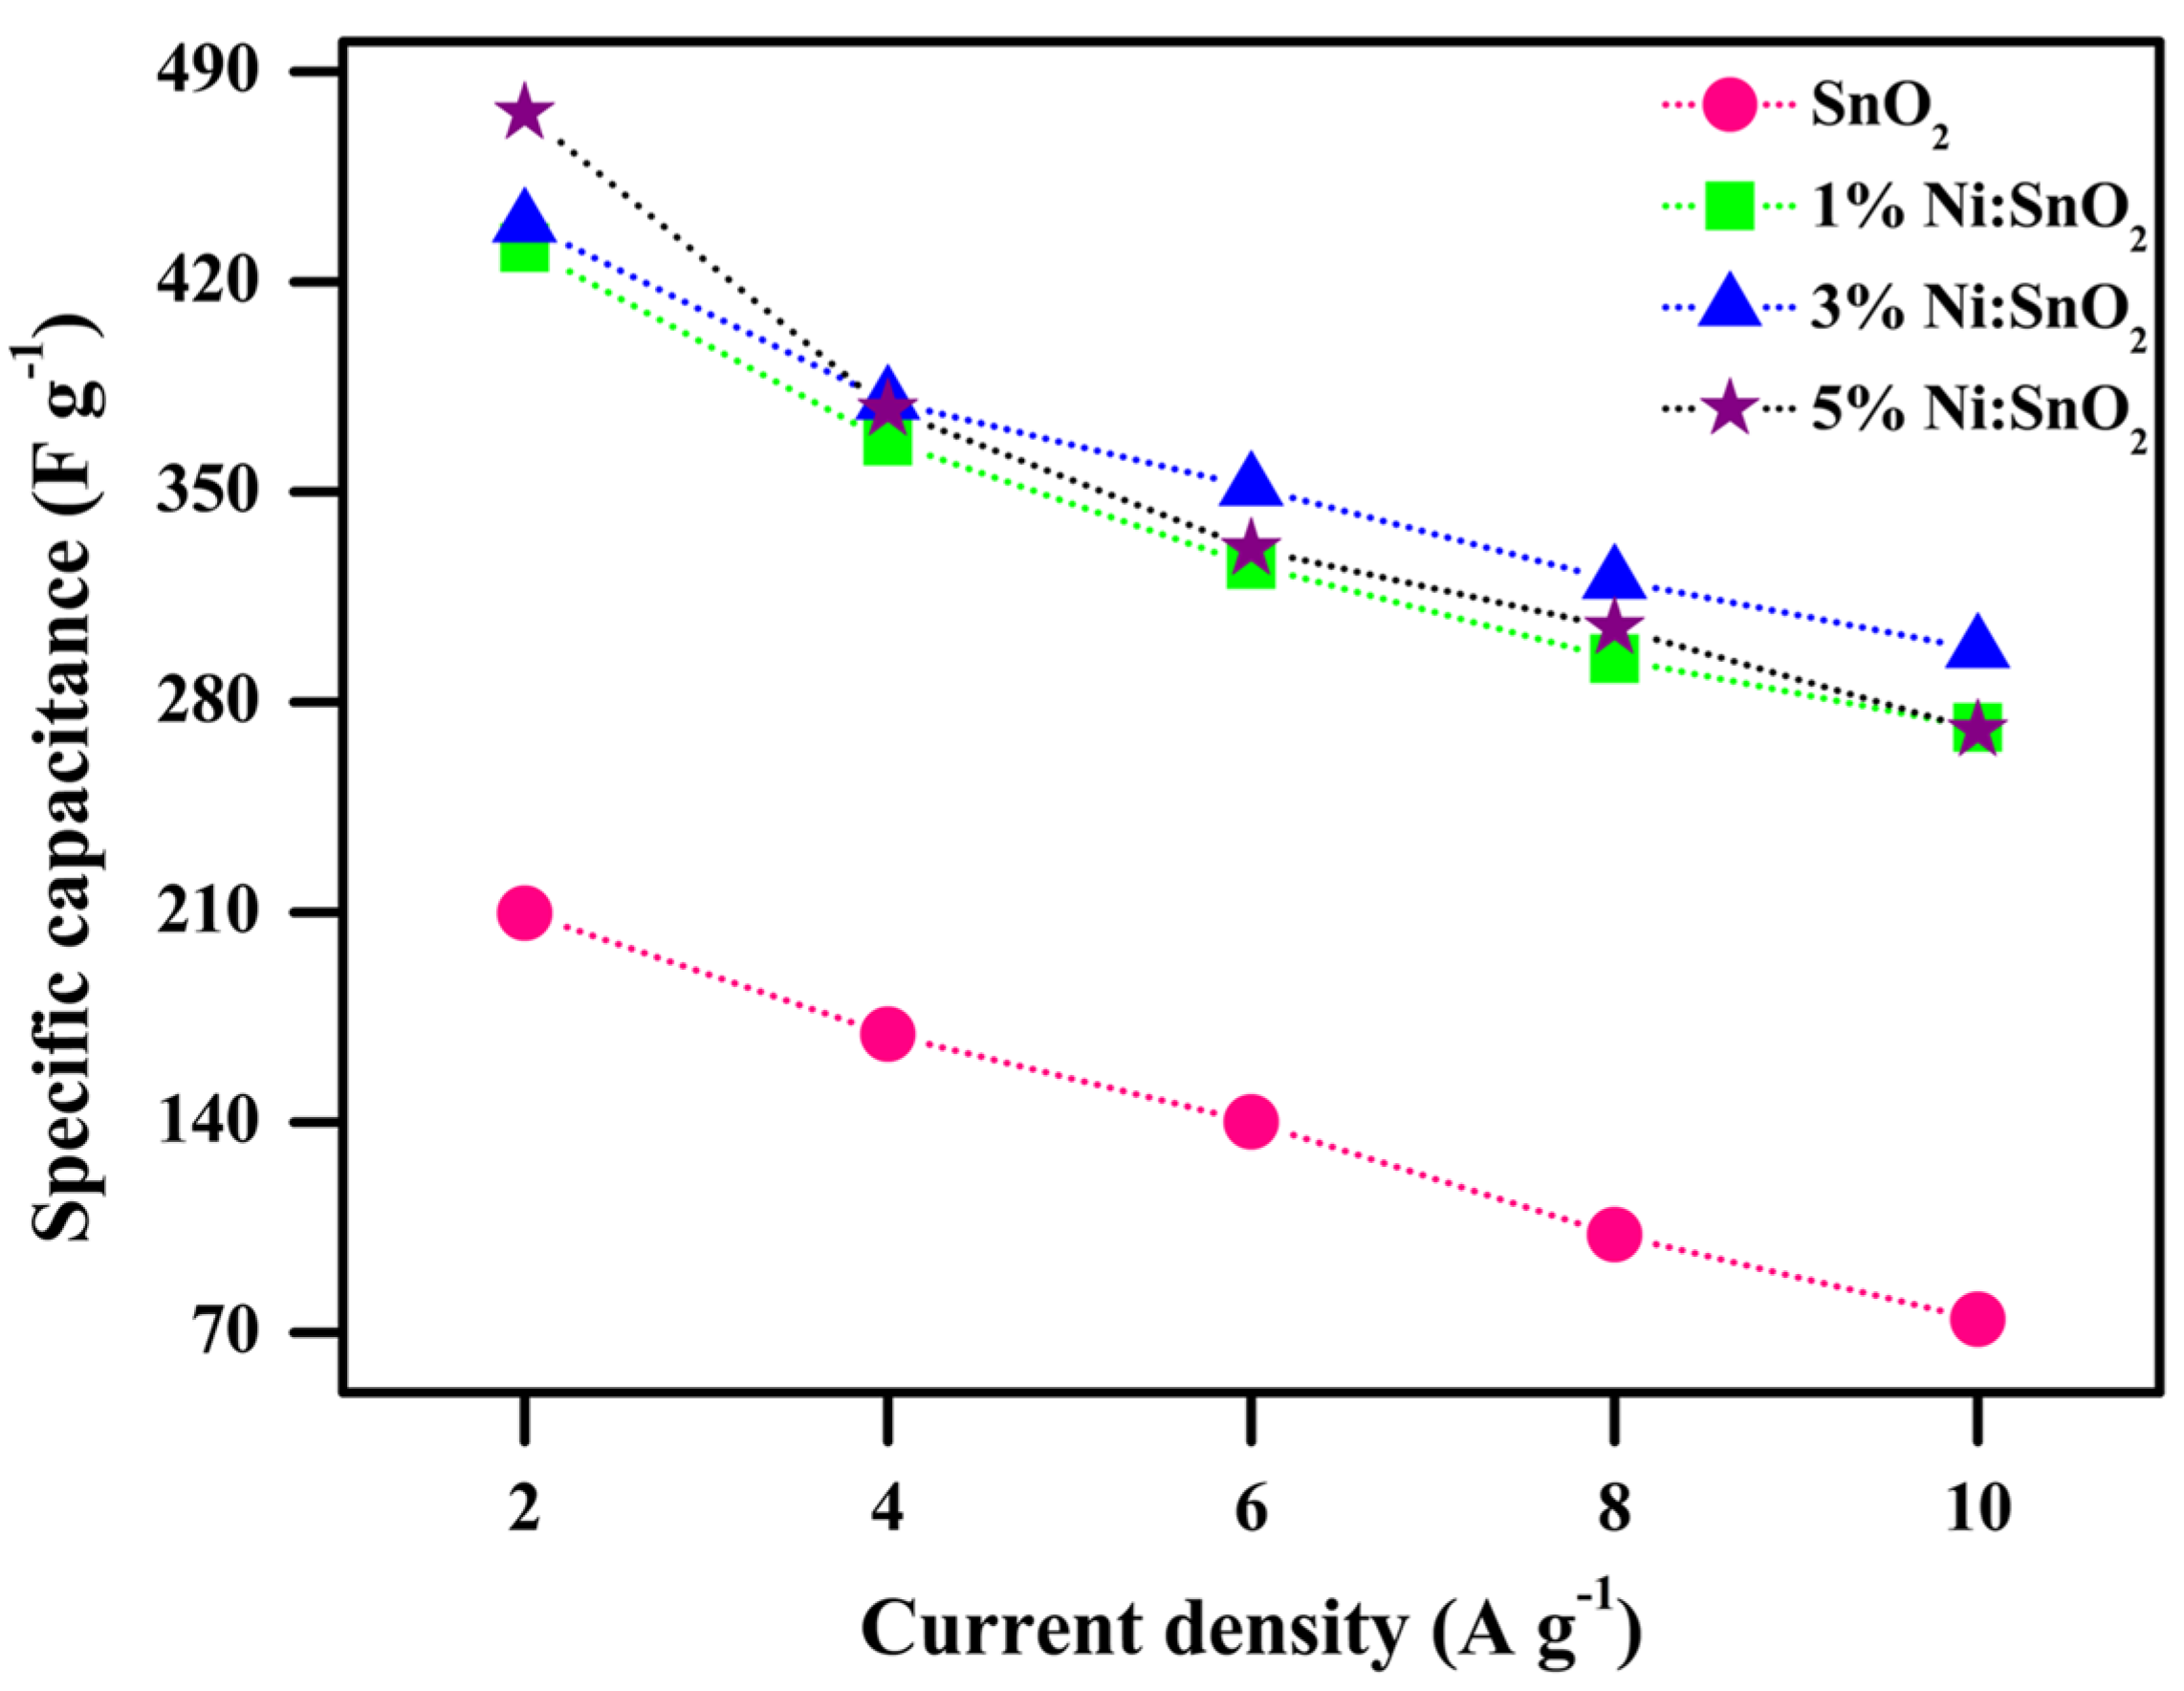
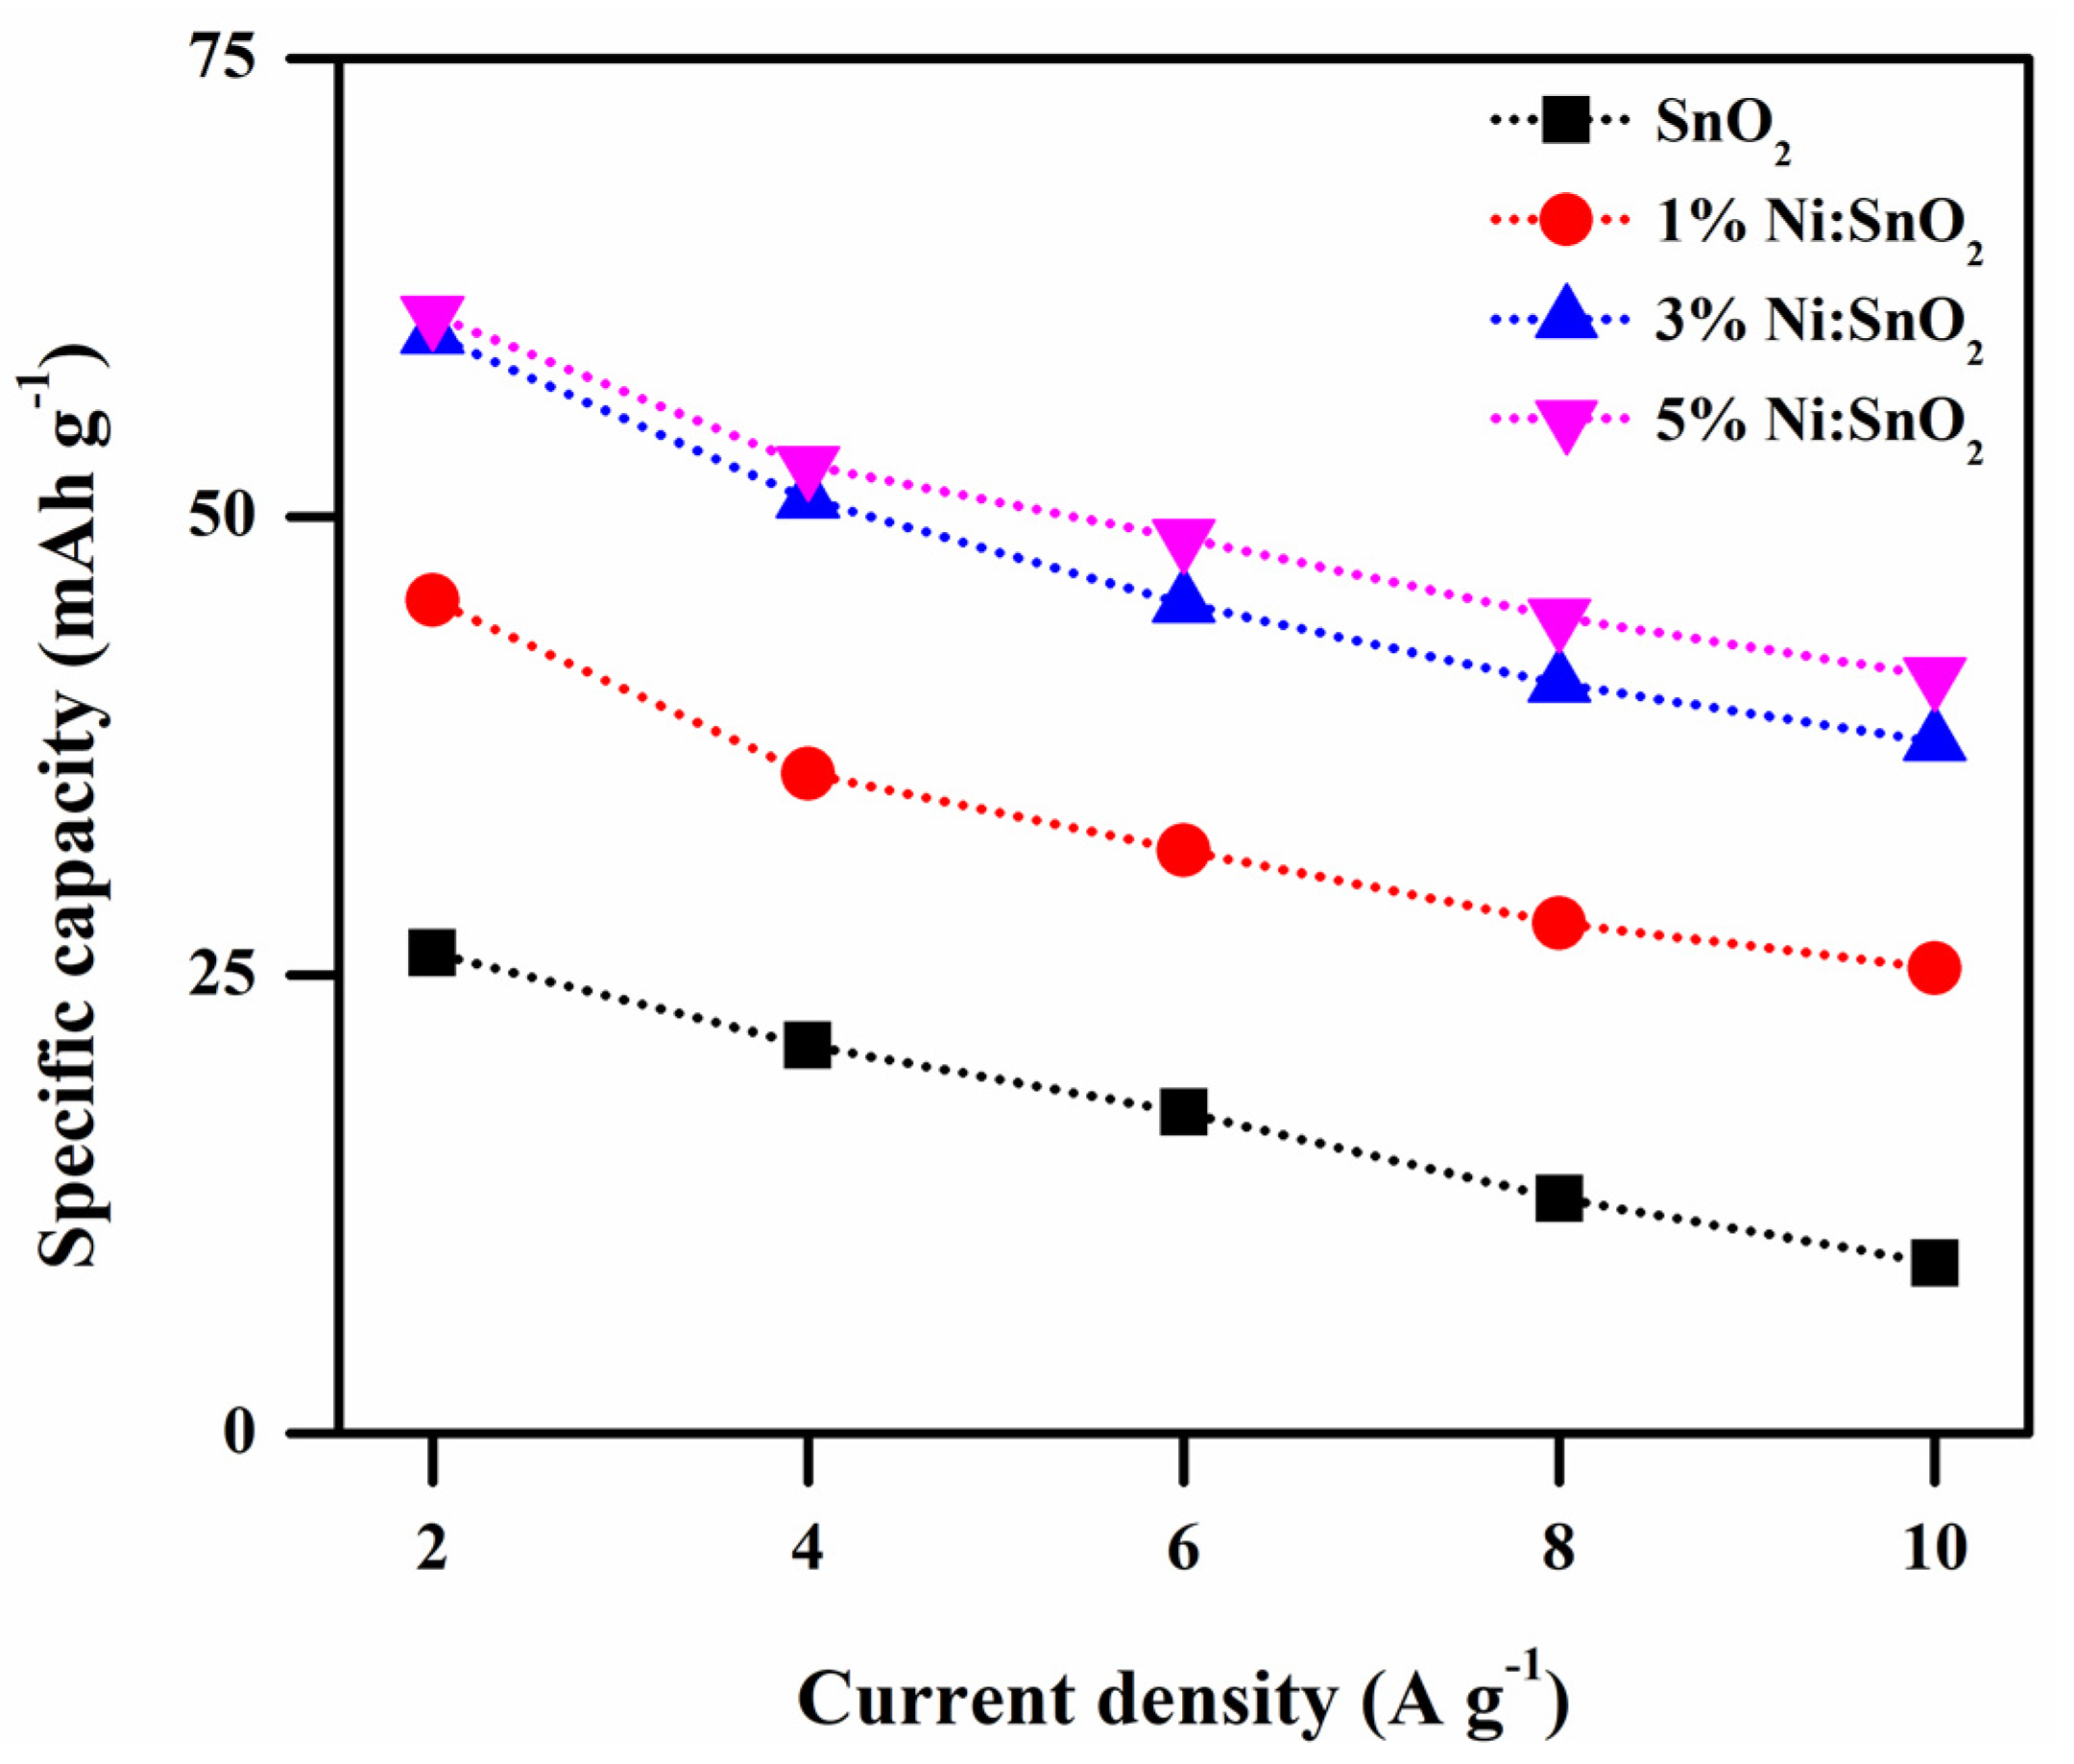
3.4.2. Galvanostatic Charge–Discharge Analysis
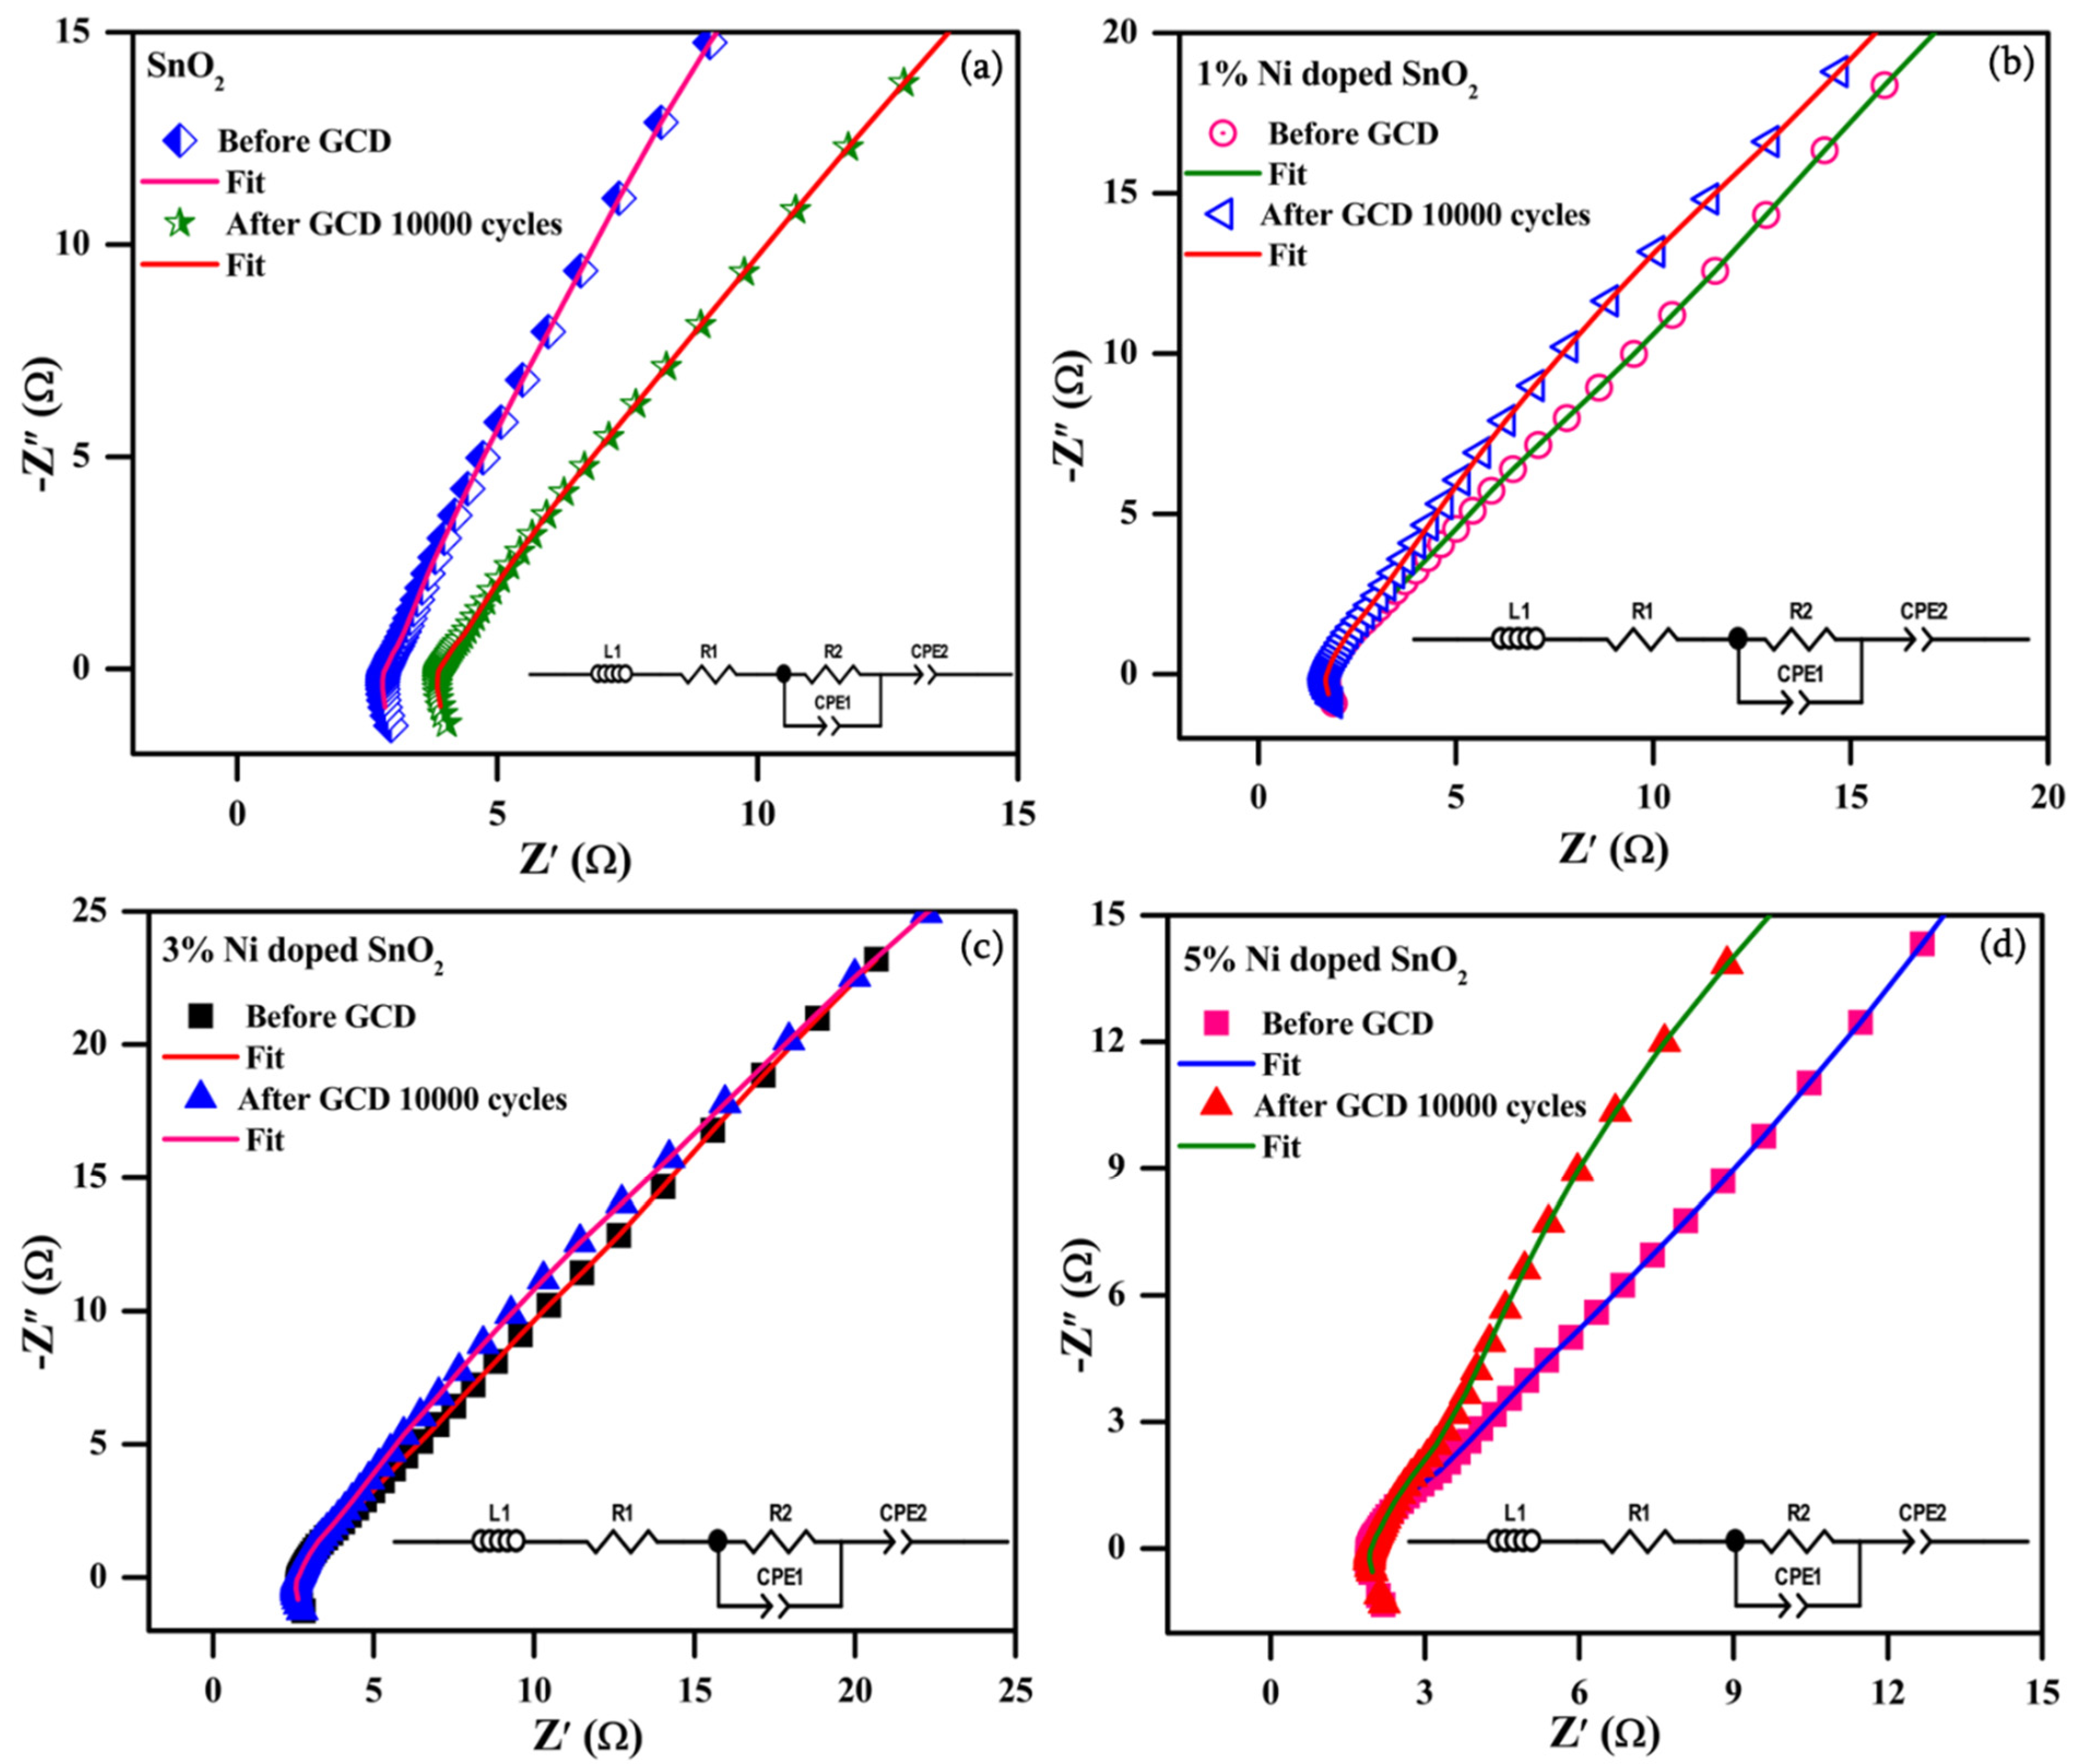
3.4.3. Electrochemical Impedance Spectroscopy
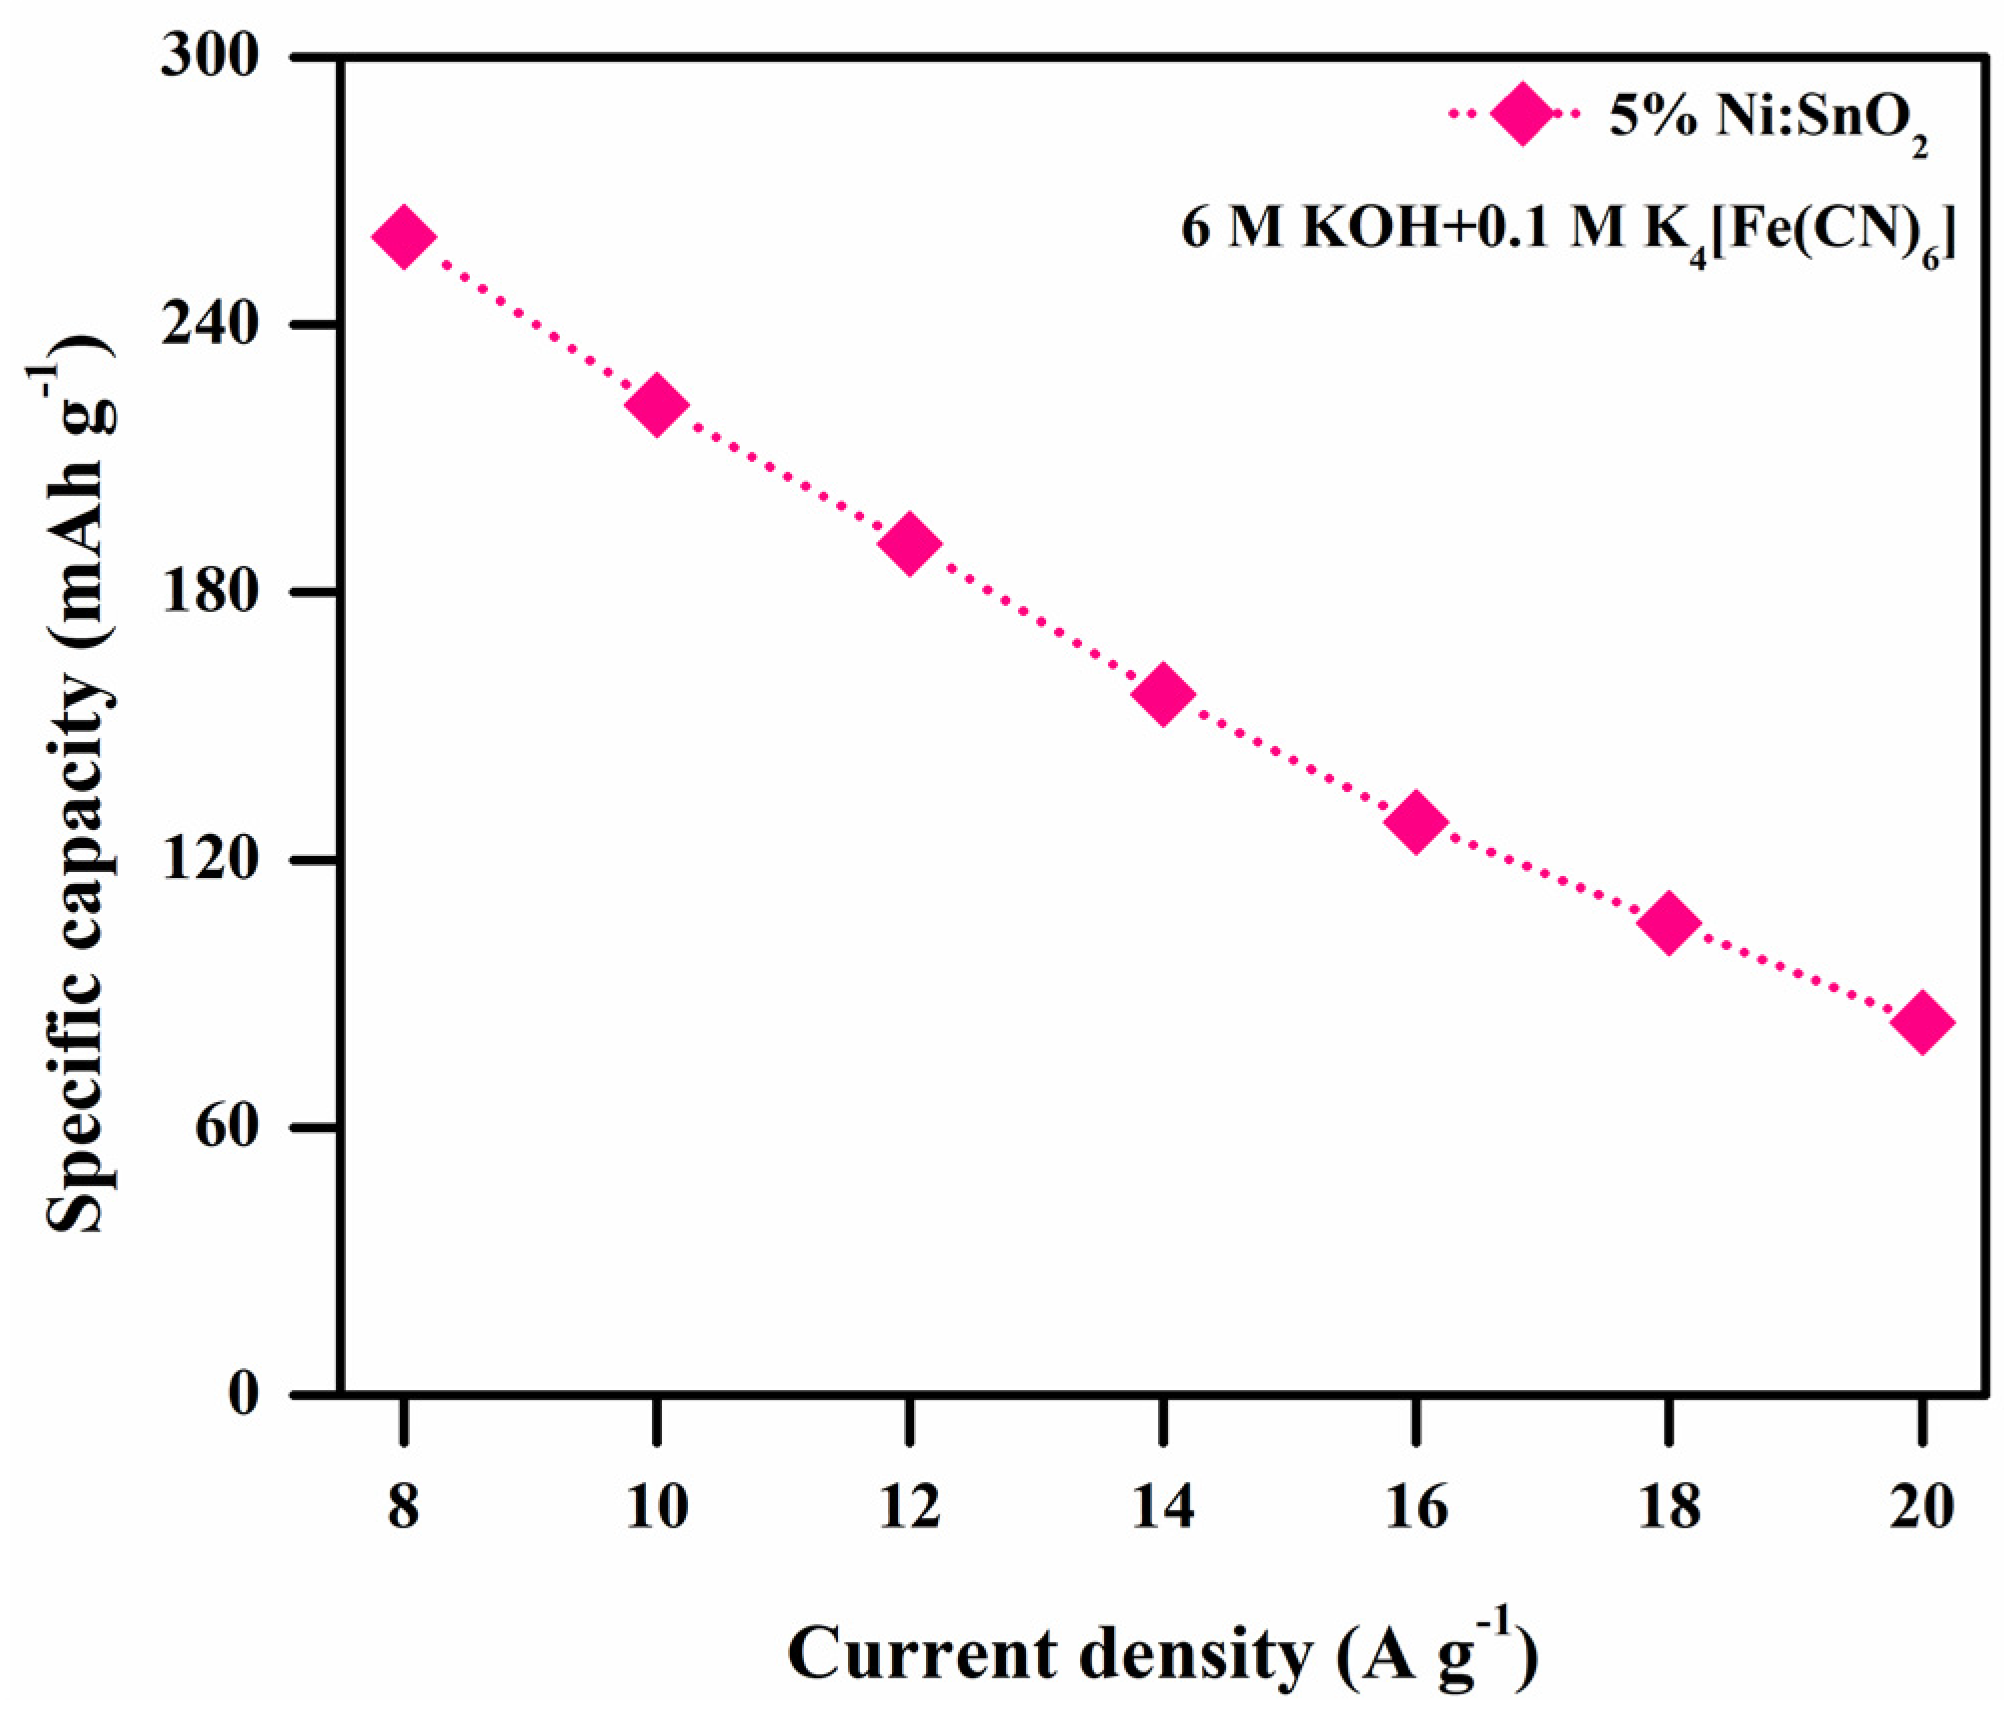
3.4.4. Electrochemical Performance of 5% Ni-Doped SnO2 in Additive Electrolyte
4. Conclusions
Author Contributions
Funding
Institutional Review Board Statement
Informed Consent Statement
Data Availability Statement
Acknowledgments
Conflicts of Interest
References
- Sahoo, P.K.; Kumar, N.; Jena, A.; Mishra, S.; Lee, C.-P.; Lee, S.-Y.; Park, S.-J. Recent progress in graphene and its derived hybrid materials for high-performance supercapacitor electrode applications. RSC Adv. 2024, 14, 1284–1303. [Google Scholar] [CrossRef]
- Wang, Y.; Lu, Y. Sodium Alginate-Based Functional Materials toward Sustainable Applications: Water Treatment and Energy Storage. Ind. Eng. Chem. Res. 2023, 62, 11279–11304. [Google Scholar] [CrossRef]
- Panda, S.; Deshmukh, K.; Pasha, S.K.; Theerthagiri, J.; Manickam, S.; Choi, M.Y. MXene based emerging materials for supercapacitor applications: Recent advances, challenges, and future perspectives. Coord. Chem. Rev. 2022, 462, 214518. [Google Scholar] [CrossRef]
- Wang, W.; Hao, Q.; Lei, W.; Xia, X.; Wang, X. Graphene/SnO2/polypyrrole ternary nanocomposites as supercapacitor electrode materials. RSC Adv. 2012, 2, 10268–10274. [Google Scholar] [CrossRef]
- Su, B.-L.; Zhang, Q.; Bonifazi, D.; Li, J. Advanced Materials for Sustainable Energy and a Greener Environment. ChemSusChem 2011, 4, 1327–1331. [Google Scholar] [CrossRef] [PubMed]
- Siva, V.; Murugan, A.; Shameem, A.; Thangarasu, S.; Kannan, S.; Bahadur, S.A. In situ encapsulation of V2O5@ZIF-8 nanocomposites as electrode materials for high-performance supercapacitors with long term cycling stability. J. Mater. Chem. C 2023, 11, 3070–3085. [Google Scholar] [CrossRef]
- Shameem, A.; Siva, V.; Murugan, A.; Mayakkannan, M.; Karthikeyan, P.; Bahadur, S.A.; Devendran, P.; Al-Sehemi, A.G. Synthesis of transition metal oxide-based nanocomposite as a robust electrode with a simple approach for supercabattery application. J. Alloys Compd. 2024, 979, 173455. [Google Scholar] [CrossRef]
- Hu, X.; Deng, Z.; Suo, J.; Pan, Z. A high rate, high capacity and long life (LiMn2O4+AC)/Li4Ti5O12 hybrid battery–supercapacitor. J. Power Sources 2009, 187, 635–639. [Google Scholar] [CrossRef]
- Lim, S.; Huang, N.; Lim, H. Solvothermal synthesis of SnO2/graphene nanocomposites for supercapacitor application. Ceram. Int. 2013, 39, 6647–6655. [Google Scholar] [CrossRef]
- Jayalakshmi, M.; Balasubramanian, K. Simple Capacitors to Supercapacitors—An Overview. Int. J. Electrochem. Sci. 2008, 3, 1196–1217. [Google Scholar] [CrossRef]
- Hu, Z.-A.; Xie, Y.-L.; Wang, Y.-X.; Mo, L.-P.; Yang, Y.-Y.; Zhang, Z.-Y. Polyaniline/SnO2 nanocomposite for supercapacitor applications. Mater. Chem. Phys. 2009, 114, 990–995. [Google Scholar] [CrossRef]
- Zhong, X.; Tang, J.; Cao, L.; Kong, W.; Sun, Z.; Cheng, H.; Lu, Z.; Pan, H.; Xu, B. Cross-linking of polymer and ionic liquid as high-performance gel electrolyte for flexible solid-state supercapacitors. Electrochim. Acta 2017, 244, 112–118. [Google Scholar] [CrossRef]
- Chen, H.; Wang, X.; Guan, L.; Chen, L.; Tao, J. Surface engineering of layered SnO micro-plates for impressive high supercapacitor performance. Mater. Chem. Phys. 2019, 238, 121889. [Google Scholar] [CrossRef]
- Varghese, S.M.; Mohan, V.V.; Suresh, S.; Gowd, E.B.; Rakhi, R. Synergistically modified Ti3C2Tx MXene conducting polymer nanocomposites as efficient electrode materials for supercapacitors. J. Alloys Compd. 2024, 973, 172923. [Google Scholar] [CrossRef]
- Chen, J.S.; Guan, C.; Gui, Y.; Blackwood, D.J. Rational Design of Self-Supported Ni3S2 Nanosheets Array for Advanced Asymmetric Supercapacitor with a Superior Energy Density. ACS Appl. Mater. Interfaces 2017, 9, 496–504. [Google Scholar] [CrossRef] [PubMed]
- Fan, Z.-S.; Kaneti, Y.V.; Chowdhury, S.; Wang, X.; Karim, M.R.; Alnaser, I.A.; Zhang, F.-B. Weak base-modulated synthesis of bundle-like carbon superstructures from metal-organic framework for high-performance supercapacitors. Chem. Eng. J. 2023, 462, 142094. [Google Scholar] [CrossRef]
- Kondratiev, V.V.; Holze, R. Intrinsically conducting polymers and their combinations with redox-active molecules for rechargeable battery electrodes: An update. Chem. Pap. 2021, 75, 4981–5007. [Google Scholar] [CrossRef]
- Wu, R.; Sun, J.; Xu, C.; Chen, H. MgCo2O4-based electrode materials for electrochemical energy storage and conversion: A comprehensive review. Sustain. Energy Fuels 2021, 5, 4807–4829. [Google Scholar] [CrossRef]
- Hayat, M.; Ali, B.; Yunis, M.; Al-Sehemi, A.G.; Messali, M.; Manzoor, S.; Abdullah, M.; Alanazi, M.M.; Abdelmohsen, S.A.M.; Ashiq, M.N. CeSe nanocube anchored on the nanosheet of reduced graphene oxide (rGO) as a binder free electrode for energy conversion system. J. Korean Ceram. Soc. 2023, 60, 646–656. [Google Scholar] [CrossRef]
- Zhang, Y.-N.; Su, C.-Y.; Chen, J.-L.; Huang, W.-H.; Lou, R. Recent progress of transition metal-based biomass-derived carbon composites for supercapacitor. Rare Met. 2022, 42, 769–796. [Google Scholar] [CrossRef]
- Hussain, M.; Alahmari, S.D.; Alharbi, F.; Ejaz, S.R.; Abdullah, M.; Aman, S.; Al-Sehemi, A.G.; Henaish, A.; Sadaf, A.; Farid, H.M.T. Hydrothermal synthesis of the NiS@g-C3N4 nanohybrid electrode material for supercapacitor applications. J. Energy Storage 2024, 80, 110289. [Google Scholar] [CrossRef]
- Velmurugan, V.; Srinivasarao, U.; Ramachandran, R.; Saranya, M.; Grace, A.N. Synthesis of tin oxide/graphene (SnO2/G) nanocomposite and its electrochemical properties for supercapacitor applications. Mater. Res. Bull. 2016, 84, 145–151. [Google Scholar] [CrossRef]
- Siva, V.; Murugan, A.; Shameem, A.; Thangarasu, S.; Kannan, S.; Raja, A. Gel combustion synthesized NiMoO4 anchored polymer nanocomposites as a flexible electrode material for solid state asymmetric supercapacitors. Int. J. Hydrogen Energy 2023, 48, 18856–18870. [Google Scholar] [CrossRef]
- Podurets, A.; Khalidova, M.; Chistyakova, L.; Bobrysheva, N.; Osmolowsky, M.; Voznesenskiy, M.; Osmolovskaya, O. Experimental and computational study of Ni-doped SnO2 as a photocatalyst and antibacterial agent for water remediation: The way for a rational design. J. Alloys Compd. 2022, 926, 166950. [Google Scholar] [CrossRef]
- Kandasamy, M.; Seetharaman, A.; Sivasubramanian, D.; Nithya, A.; Jothivenkatachalam, K.; Maheswari, N.; Gopalan, M.; Dillibabu, S.; Eftekhari, A. Ni-Doped SnO2 Nanoparticles for Sensing and Photocatalysis. ACS Appl. Nano Mater. 2018, 1, 5823–5836. [Google Scholar] [CrossRef]
- Khan, D.; Rehman, A.; Rafiq, M.Z.; Khan, A.M.; Ali, M. Improving the optical properties of SnO2 nanoparticles through Ni doping by sol-gel technique. Curr. Res. Green Sustain. Chem. 2021, 4, 100079. [Google Scholar] [CrossRef]
- Meng, X.; Zhou, M.; Li, X.; Yao, J.; Liu, F.; He, H.; Xiao, P.; Zhang, Y. Synthesis of SnO2 nanoflowers and electrochemical properties of Ni/SnO2 nanoflowers in supercapacitor. Electrochim. Acta 2013, 109, 20–26. [Google Scholar] [CrossRef]
- Shameem, A.; Devendran, P.; Murugan, A.; Siva, V.; Bahadur, S.A. Cost-effective synthesis of efficient La doped CoMoO4 nanocomposite electrode for sustainable high-energy symmetric supercapacitors. J. Energy Storage 2023, 73, 108856. [Google Scholar] [CrossRef]
- Park, S.H.; Son, Y.C.; Willis, W.S.; Suib, S.L.; Creasy, K.E. Tin Oxide Films Made by Physical Vapor Deposition-Thermal Oxidation and Spray Pyrolysis. Chem. Mater. 1998, 10, 2389–2398. [Google Scholar] [CrossRef]
- Kim, K.T.; Ha, G.H.; Eckert, J. Microstructures and magnetic properties of carbon nanotube/Co-oxide nanocomposite powders. J. Alloys Compd. 2011, 509, S412–S415. [Google Scholar] [CrossRef]
- Wang, C.; Wang, Y.; Liu, X.; Diao, F.; Yuan, L.; Zhou, G. Novel hybrid nanocomposites of polyhedral Cu2O nanoparticles–CuO nanowires with enhanced photoactivity. Phys. Chem. Chem. Phys. 2014, 16, 17487–17492. [Google Scholar] [CrossRef] [PubMed]
- Murugan, A.; Siva, V.; Shameem, A.; Bahadur, S.A.; Sasikumar, S.; Nallamuthu, N. Structural and charge density distribution studies on Tin Oxide nanoparticles for Supercapacitor application. J. Energy Storage 2020, 28, 101194. [Google Scholar] [CrossRef]
- Shameem, A.; Devendran, P.; Siva, V.; Venkatesh, K.S.; Manikandan, A.; Bahadur, S.A.; Nallamuthu, N. Dielectric Investigation of NaLiS Nanoparticles Loaded on Alginate Polymer Matrix Synthesized by Single Pot Microwave Irradiation. J. Inorg. Organomet. Polym. Mater. 2017, 28, 671–678. [Google Scholar] [CrossRef]
- Shameem, A.; Devendran, P.; Siva, V.; Packiaraj, R.; Nallamuthu, N.; Bahadur, S.A. Electrochemical performance and optimization of α-NiMoO4 by different facile synthetic approach for supercapacitor application. J. Mater. Sci. Mater. Electron. 2019, 30, 3305–3315. [Google Scholar] [CrossRef]
- Gajendiran, J.; Rajendran, V. A study of the nano-structured aggregated tin oxides (SnO2/SnO) and their structural and photoluminescence properties by a hydrothermal method. Mater. Lett. 2015, 139, 116–118. [Google Scholar] [CrossRef]
- Qin, W.; Zhou, N.; Wu, C.; Xie, M.; Sun, H.; Guo, Y.; Pan, L. Mini-Review on the Redox Additives in Aqueous Electrolyte for High Performance Supercapacitors. ACS Omega 2020, 5, 3801–3808. [Google Scholar] [CrossRef]
- Zang, X.; Shen, C.; Kao, E.; Warren, R.; Zhang, R.; Teh, K.S.; Zhong, J.; Wei, M.; Li, B.; Chu, Y.; et al. Titanium Disulfide Coated Carbon Nanotube Hybrid Electrodes Enable High Energy Density Symmetric Pseudocapacitors. Adv. Mater. 2017, 30, 1704754. [Google Scholar] [CrossRef] [PubMed]
- Nguyen, V.T.; Ting, J.-M. A Redox-Additive Electrolyte and Nanostructured Electrode for Enhanced Supercapacitor Energy Density. ACS Sustain. Chem. Eng. 2020, 8, 18023–18033. [Google Scholar] [CrossRef]
- Zhong, C.; Deng, Y.; Hu, W.; Qiao, J.; Zhang, L.; Zhang, J. A review of electrolyte materials and compositions for electrochemical supercapacitors. Chem. Soc. Rev. 2015, 44, 7484–7539. [Google Scholar] [CrossRef]
- Tian, Z.; Yuan, S.; He, J.; Li, P.; Zhang, S.; Wang, C.; Wang, Y.; Yin, S.; Liu, L. Structure and magnetic properties in Mn doped SnO2 nanoparticles synthesized by chemical co-precipitation method. J. Alloys Compd. 2008, 466, 26–30. [Google Scholar] [CrossRef]
- Varshney, B.; Siddiqui, M.J.; Anwer, A.H.; Khan, M.Z.; Ahmed, F.; Aljaafari, A.; Hammud, H.H.; Azam, A. Synthesis of mesoporous SnO2/NiO nanocomposite using modified sol–gel method and its electrochemical performance as electrode material for supercapacitors. Sci. Rep. 2020, 10, 11032. [Google Scholar] [CrossRef]
- Wang, L.; Ji, H.; Zhu, F.; Chen, Z.; Yang, Y.; Jiang, X.; Pinto, J.; Yang, G. Large-scale preparation of shape controlled SnO and improved capacitance for supercapacitors: From nanoclusters to square microplates. Nanoscale 2013, 5, 7613–7621. [Google Scholar] [CrossRef] [PubMed]
- Shameem, A.; Devendran, P.; Murugan, A.; Siva, V.; Ramadoss, G.; Shamima, H.; Bahadur, S.A. Microwave-assisted design and fabrication of rare earth doped NiMoO4: An admirable electrode material in redox electrolytes with excellent power density for high-end energy storage systems. Sustain. Mater. Technol. 2023, 37, e00661. [Google Scholar] [CrossRef]
- Shameem, A.; Devendran, P.; Murugan, A.; Siva, V.; Seevakan, K.; Hussain, S.; Sivaganesh, D.; Bahadur, S.A. Rare earth doped bismuth molybdate nanoplatelets for boosting electrochemical performance: Facile synthesis and device fabrication. J. Alloys Compd. 2023, 968, 171825. [Google Scholar] [CrossRef]
- Korotcenkov, G.; Brinzari, V.; Boris, I. (Cu, Fe, Co, or Ni)-doped tin dioxide films deposited by spray pyrolysis: Doping influence on film morphology. J. Mater. Sci. 2008, 43, 2761–2770. [Google Scholar] [CrossRef]
- Yuan, C.; Li, J.; Hou, L.; Zhang, X.; Shen, L.; Lou, X.W. Ultrathin Mesoporous NiCo2O4 Nanosheets Supported on Ni Foam as Advanced Electrodes for Supercapacitors. Adv. Funct. Mater. 2012, 22, 4592–4597. [Google Scholar] [CrossRef]
- Zhang, L.; Hu, X.; Chen, C.; Guo, H.; Liu, X.; Xu, G.; Zhong, H.; Cheng, S.; Wu, P.; Meng, J.; et al. In operando mechanism analysis on nanocrystalline silicon anode material for reversible and ultrafast sodium storage. Adv. Mater. 2017, 29, 1604708. [Google Scholar] [CrossRef] [PubMed]
- Lan, Y.; Zhao, H.; Zong, Y.; Li, X.; Sun, Y.; Feng, J.; Wang, Y.; Zheng, X.; Du, Y. Phosphorization boosts the capacitance of mixed metal nanosheet arrays for high performance supercapacitor electrodes. Nanoscale 2018, 10, 11775–11781. [Google Scholar] [CrossRef]
- Majumdar, D.; Mandal, M.; Bhattacharya, S.K. Journey from supercapacitors to supercapatteries: Recent advancements in electrochemical energy storage systems. Emergent Mater. 2020, 3, 347–367. [Google Scholar] [CrossRef]
- Liu, J.; Wang, J.; Xu, C.; Jiang, H.; Li, C.; Zhang, L.; Lin, J.; Shen, Z.X. Advanced Energy Storage Devices: Basic Principles, Analytical Methods, and Rational Materials Design. Adv. Sci. 2017, 5, 1700322. [Google Scholar] [CrossRef]
- Wang, X.; Shen, G. Intercalation pseudo-capacitive TiNb2O7@ carbon electrode for high-performance lithi-um-ion hybrid electrochemical supercapacitors with ultrahigh energy density. Nano Energy 2015, 15, 104–115. [Google Scholar] [CrossRef]
- Zhang, F.; Zhang, X.-G.; Hao, L. Solution synthesis and electrochemical capacitance performance of Mn3O4 polyhedral nanocrystals via thermolysis of a hydrogen-bonded polymer. Mater. Chem. Phys. 2011, 126, 853–858. [Google Scholar] [CrossRef]
- Zhou, M.; Lu, F.; Shen, X.; Xia, W.; He, H.; Zeng, X. One-pot construction of three dimensional CoMoO4/Co3O4 hybrid nanostructures and their application in supercapacitors. J. Mater. Chem. A 2015, 3, 21201–21210. [Google Scholar] [CrossRef]
- Tian, X.; Yang, T.; Song, Y.; Li, Y.; Peng, H.; Xue, R.; Ren, X.; Liu, Z. Symmetric supercapacitor operating at 1.5 V with combination of nanosheet-based NiMoO4 microspheres and redox additive electrolyte. J. Energy Storage 2022, 47, 103960. [Google Scholar] [CrossRef]
- Veeresh, S.; Ganesha, H.; Nagaraju, Y.; Vijeth, H.; Devendrappa, H. Activated carbon incorporated graphene oxide with SnO2 and TiO2-Zn nanocomposite for supercapacitor application. J. Alloys Compd. 2023, 952, 169907. [Google Scholar] [CrossRef]
- Inayat, A.; Faizan, M.; Ullah, I.; Haider, A.; Nam, K.W.; Kim, J.Y.; Alam, M.; Abbas, S.M. Graphene oxide supported SnO2-WO3 nano-composite as electrode material for lithium-ion batteries and battery-type supercapacitor. J. Electroanal. Chem. 2023, 951, 117903. [Google Scholar] [CrossRef]
- Li, X.; Zhou, L.; Zhao, S.; Ding, H.; Cao, H.; Fang, Z.; Jiang, F.; Li, H.; Liu, Y.; Zhu, Y. Reduced graphite oxide wrapped ZnO-SnO2 hollow nanospheres with as anodes for hybrid high energy density supercapacitors. Diam. Relat. Mater. 2023, 136, 110076. [Google Scholar] [CrossRef]


| S. No | Scanning Rate (mV s−1) | Csp (CV) (F g−1) | ||||
|---|---|---|---|---|---|---|
| KOH Electrolyte | Additive Electrolyte | |||||
| Pristine SnO2 | 1% Ni/SnO2 | 3% Ni/SnO2 | 5% Ni/SnO2 | 5% Ni/SnO2 | ||
| 1 | 5 | 620.31 | 721.78 | 833.53 | 841.85 | 2130.33 |
| 2 | 10 | 570.75 | 653.96 | 791.42 | 799.84 | 1769.20 |
| 3 | 25 | 478.45 | 523.83 | 698.29 | 719.03 | 1415.07 |
| 4 | 50 | 407.52 | 400.90 | 605.71 | 648.73 | 1044.24 |
| 5 | 75 | 377.59 | 329.17 | 542.05 | 599.30 | 791.73 |
| 6 | 100 | 347.97 | 259.67 | 489.43 | 556.43 | 560.01 |
| S. No | Current Density (A g−1) | Csp(GCD) (F g−1) | |||
|---|---|---|---|---|---|
| Pristine SnO2 | 1% Ni/SnO2 | 3% Ni/SnO2 | 5% Ni/SnO2 | ||
| 1 | 2 | 209.70 | 431.40 | 439.32 | 476.22 |
| 2 | 4 | 169.29 | 366.81 | 380.25 | 377.46 |
| 3 | 6 | 140.13 | 325.82 | 351.57 | 331.08 |
| 4 | 8 | 102.59 | 294.35 | 320.59 | 304.73 |
| 5 | 10 | 74.44 | 271.51 | 297.56 | 270.68 |
Disclaimer/Publisher’s Note: The statements, opinions and data contained in all publications are solely those of the individual author(s) and contributor(s) and not of MDPI and/or the editor(s). MDPI and/or the editor(s) disclaim responsibility for any injury to people or property resulting from any ideas, methods, instructions or products referred to in the content. |
© 2024 by the authors. Licensee MDPI, Basel, Switzerland. This article is an open access article distributed under the terms and conditions of the Creative Commons Attribution (CC BY) license (https://creativecommons.org/licenses/by/4.0/).
Share and Cite
Shameem, A.S.; Murugan, A.; Siva, V.; Palanisamy, G.; Kim, I.; Lee, J.; Paramasivam, S. A High-Performance Supercapacitor Based on Hierarchical Template-Free Ni/SnO2 Nanostructures via Hydrothermal Method. Materials 2024, 17, 1894. https://doi.org/10.3390/ma17081894
Shameem AS, Murugan A, Siva V, Palanisamy G, Kim I, Lee J, Paramasivam S. A High-Performance Supercapacitor Based on Hierarchical Template-Free Ni/SnO2 Nanostructures via Hydrothermal Method. Materials. 2024; 17(8):1894. https://doi.org/10.3390/ma17081894
Chicago/Turabian StyleShameem, Abdul Samad, Anbazhagan Murugan, Vadivel Siva, Govindasamy Palanisamy, Ikhyun Kim, Jintae Lee, and Sivaprakash Paramasivam. 2024. "A High-Performance Supercapacitor Based on Hierarchical Template-Free Ni/SnO2 Nanostructures via Hydrothermal Method" Materials 17, no. 8: 1894. https://doi.org/10.3390/ma17081894