Communication

Green- and Blue-Emitting Tb3+-Activated Linde Type A Zeolite-Derived Boro-Aluminosilicate Glass for Deep UV Detection/Imaging

Jihua Laboratory, Foshan 528251, China
*
Author to whom correspondence should be addressed.
Materials 2024, 17(3), 671; https://doi.org/10.3390/ma17030671
Submission received: 3 January 2024 / Revised: 17 January 2024 / Accepted: 22 January 2024 / Published: 30 January 2024

Abstract

:
Tb3+-activated LTA zeolite-derived boro-aluminosilicate glass samples with a composition of xTb2O3-68(Na2O-Al2O3-SiO2)–32B2O3 (x = 0.2, 1.0 and 10 extra wt%) were prepared using the melt-quenching method. The emission spectra recorded upon ultraviolet (UV) excitation with two different wavelengths of 193 and 378 nm showed blue light (5D3 to 7FJ=6,5,4 and 5D4 to 7F6 transitions of Tb3+) and green light (5D4 to 7F5 transition of Tb3+) emissions with comparable intensities up to a Tb3+ concentration of 10 extra wt%. Of note, the mean decay times of the green luminescence of the glass samples were relatively fast (<20 μs). The synthesized glass has potential in applications concerning UV imaging, UV detection, and plasma display panels.

1. Introduction

There is ongoing research on the luminescence properties of rare earth-doped glasses and ceramics [1,2] potentially suitable for applications concerning lighting [3], displays [4,5], X-ray scintillation [6], increasing the efficiency of solar cells [7,8], and UV detection and imaging [9]. Emission in such materials is the result of optical transitions attributed to energy levels of 4f-electrons of rare earth ions (e.g., 4f8 (for Tb3+), 4f7 (for Gd3+), 4f6 (for Eu3+), and 4f12 (for Tm3+)) [10]. Thus, for the case of Tb3+-doped materials, the emission is due to transitions from 5D3 (violet-blue light) and 5D4 (green-orange light) levels to integer multiplets of 7FJ of Tb3+ ions [11]. Additionally, Tb3+ is an important dopant in commercial phosphor LaPO4:Ce3+, Tb3+ [12,13]. Nevertheless, in practice, the emission spectra of Tb3+-doped materials are often dominated by a characteristic green light (543 nm; 5D4 to 7F5 transition) due to a non-radiative relaxation from the 5D3 level to the 5D4 level via cross-relaxation to a neighbor Tb3+ [11,14,15,16]. In fact, examples of Tb3+-doped glasses showing 5D3-originated blue emission with intensities comparable to those of the green emission are limited to glasses with low contents of Tb3+ (typically no more than 1 mol%) [14,15,17,18,19]. The green luminescence decay time of Tb3+-doped glasses is typically on the order of ms [16,20,21,22,23,24,25,26], which normally does not satisfy the fast response time required for some applications, e.g., scintillation detectors [27] and plasma display panels [28,29]. In fact, examples of Tb3+-doped glasses with decay times on the order of μs are rare [29].
Different host lattices have been used for Tb3+-activated glasses, e.g., aluminates [14,19,21,26,30], phosphates [16,18,22,23], and germanates [24,25,31]. Linde Type A (LTA) zeolites are synthetic aluminosilicates with a porous and periodic structure with the composition of Na12(AlSi)12O48⋅27H2O, which can adopt an amorphous structure via thermal treatment at high temperatures [32]. To our knowledge, only a few studies have examined the luminescence properties of rare earth-activated LTA zeolite-derived ceramics/glasses, which have included ions of Tb3+ [20], Dy3+ (with or without Ag+) [33], and Eu2+ [20,34]. In the study that used Tb3+ as the dopant [20], the sample was prepared by ion exchanging Tb3+ for Na+ in the LTA zeolite in deionized water, followed by applying the melt quenching method. The sample was green-emitting and showed a green luminescence decay time of 2.398 ms. Thus, in the present paper, we report on the preparation, physical characterization, and luminescence study of green- and blue-emitting Tb3+-doped LTA zeolite-derived boro-aluminosilicate glasses that show fast green luminescence decay times on the order of μs.

2. Experimental Processes

2.1. Sample Preparation

The Tb3+-doped glass samples were prepared via the melt quenching method using LTA zeolites (4A, A. R, Tosoh, Tokyo, Japan; Na12(AlSi)12O48⋅27H2O), boron oxide (B2O3, 98%, Shanghai Aladdin Biochemical Technology Co. Ltd., Shanghai, China), and Tb4O7 (Shanghai Diyang Chemicals Co., Ltd., Shanghai, China). The amounts of LTA zeolite and boron oxide were fixed at 34 g (68 wt%) and 16 g (32 wt%), respectively. Thus, to 50 g mixtures of LTA zeolite and boron oxide, Tb4O7 was added in amounts of 0.1 g (extra 0.2 wt%; sample #1), 0.5 g (extra 1.0 wt%; sample #2), and 5 g (extra 10 wt%; sample #3). The powder mixtures were placed in an agate mortar and mixed homogeneously. Heating the mixture to 1200 °C using a high-temperature muffle furnace [35], the Tb3+ ions diffuse and evenly distribute within the LTA molecular sieve. Subsequently, the thoroughly melted liquid is quenched by pouring it into water, thus obtaining colorless transparent glass with the nominal composition xTb2O3-68(Na2O-Al2O3-SiO2)-32B2O3 (x = 0.2, 1.0 and 10 extra wt%). We have also illustrated a brief description of the preparation process [36,37,38,39] of LTA:Tb3+, as shown in Figure 1.

2.2. Characterization

The structures of all of the obtained samples were analyzed with X-ray diffraction (XRD) (Rigaku, Model Mini Flex 600, Tokyo, Japan), using Cu Kα irradiation (λ = 1.5418 Å) operated at 40 kV, 15 mA. The morphology of the fracture surfaces of the samples was observed using a scanning electron microscope (SEM), while energy dispersive X-ray spectroscopy (EDX) was performed in the SEM (Verios 5 UC, Eindhoven, The Netherlands). The optical transmission spectra were recorded with an ultraviolet–visible–NIR spectrophotometer (PerkinElmer, LAMBDA 1050, Waltham, MA, USA). The steady photoluminescence (PL) and photoluminescence excitation (PLE) spectra and the dynamic emission decay curves were recorded using a fluorescence spectrophotometer (Edinburgh Instruments, FLS-1000, Livingston, UK).

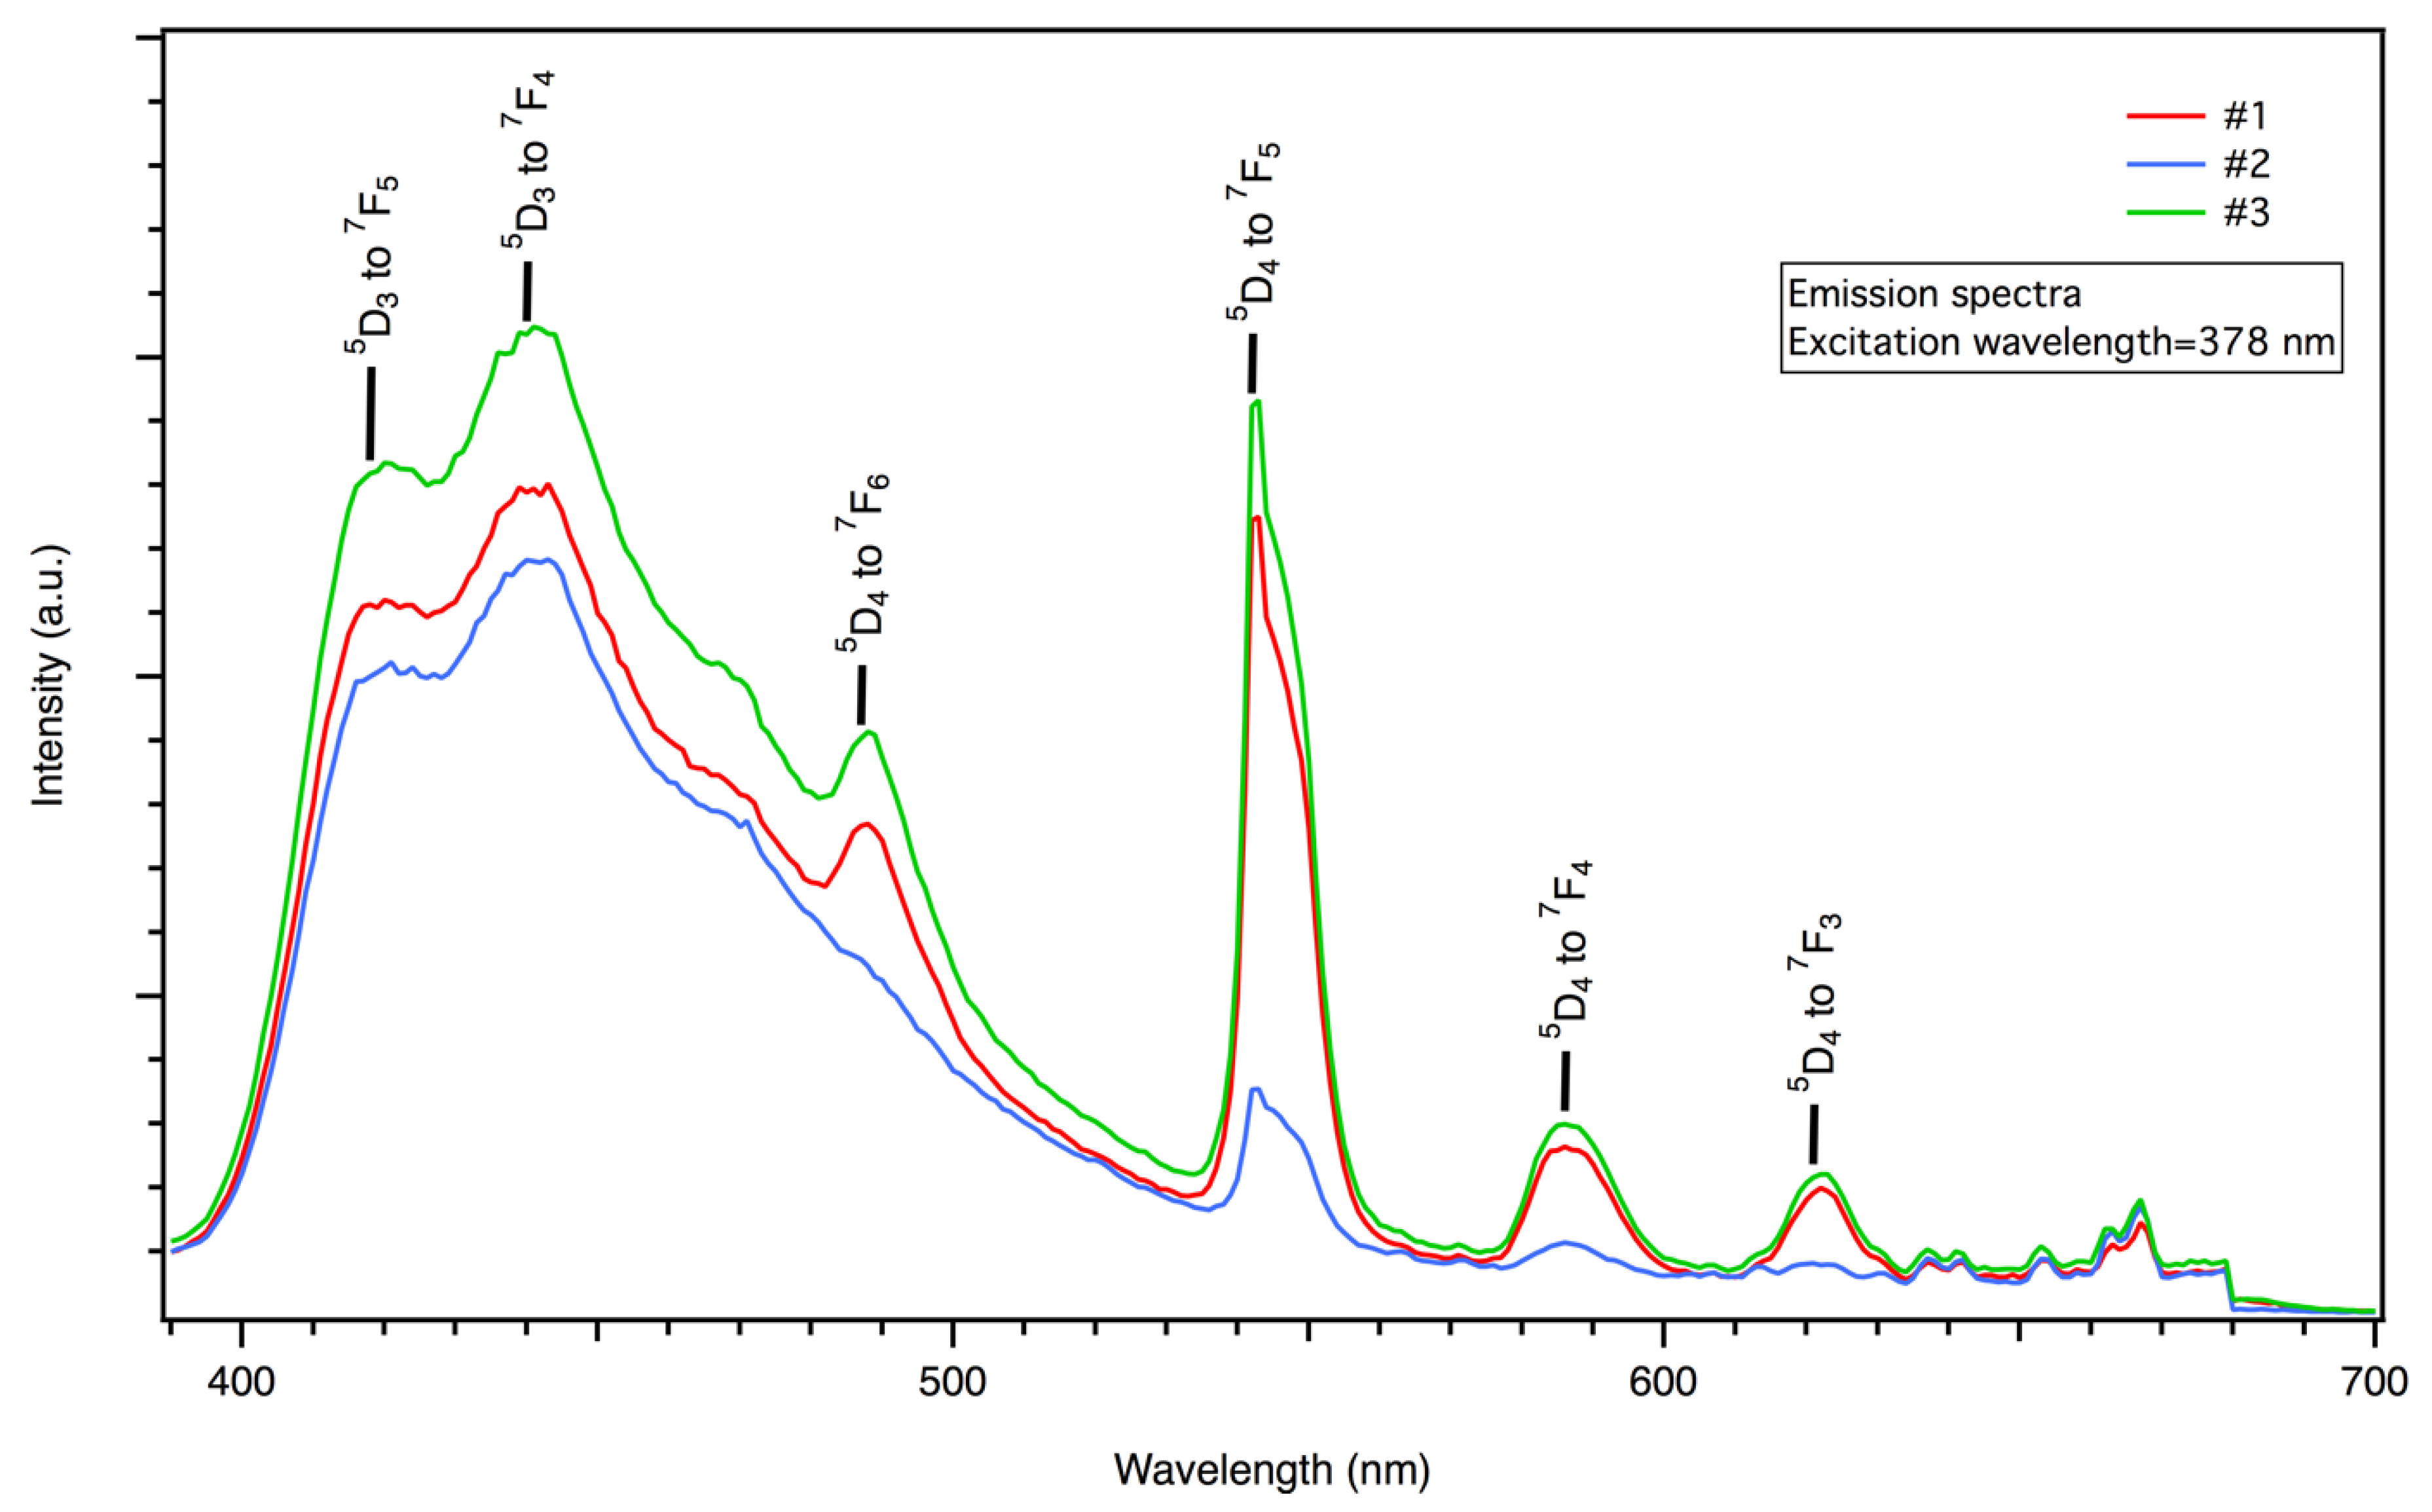
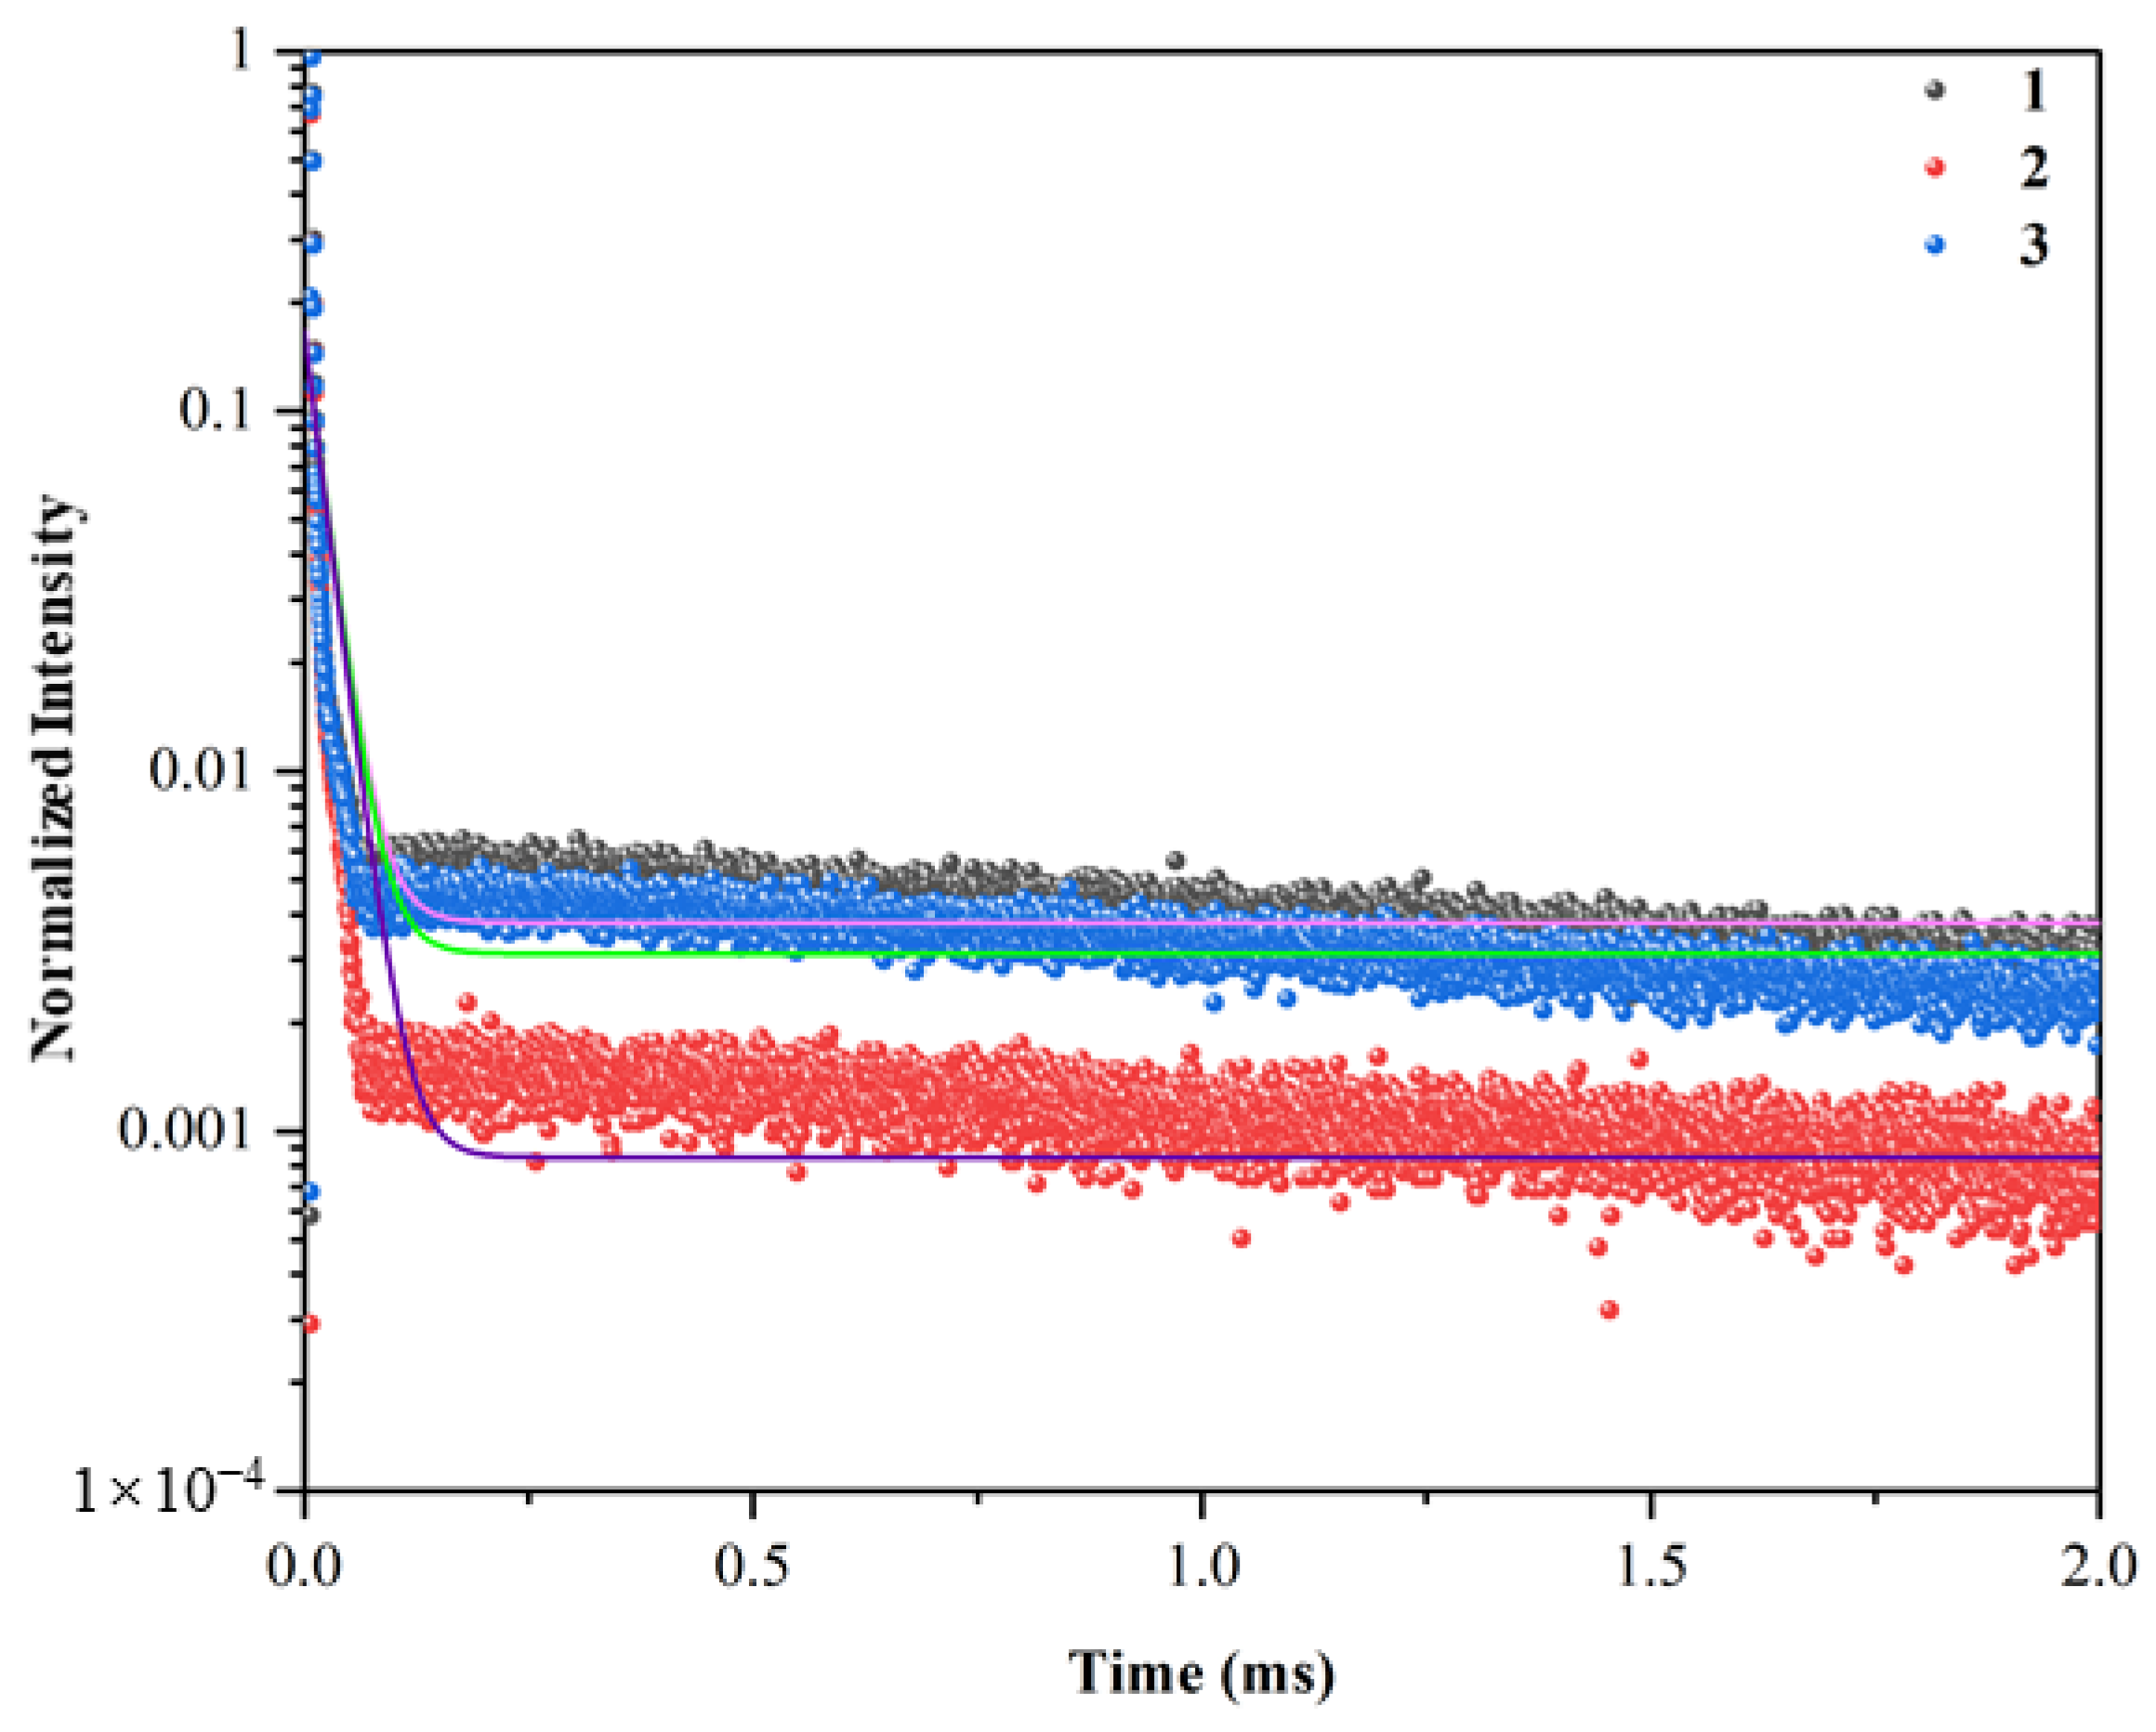
3. Results and Discussion

The SEM images did not show pores in the samples. The results of the experimental determination of the wt% of the elements in the samples using EDX are presented in Table 1. The values in Table 1 are the average values of two measurements. The inconsistencies between the nominal and experimental compositions can be explained by (i) the uncertainty in the determination of wt% of the elements (18–25%) dictated by the instrumentation used, and (ii) the fact that the glass matrix consisted of light elements such as B, Al, Si, Na, and O, which could be evaporated from the surface, e.g., B could have been undetected due to being very light.
The XRD analysis of samples #1, #2, and #3 did not show crystalline peaks, thus confirming the glass nature of the samples (Figure 2). The transmission spectra of samples #1, #2, and #3, presented in Figure 3, showed that the visible light transmittance was beyond 85%. Also, photos of these samples were colorless and transparent (Figure 4). The transmittance of a standard sample showed absorption peaks at 378 nm and 485 nm, which were attributed to 7F6 to 5D3 and 7F6 to 5D4 transitions of Tb3+, respectively [30,31]. The high transparency of the fabricated LTA zeolite glass samples in the visible light range and the low doping concentration of Tb3+ could have resulted in overshadowing or overlapping of the absorption peak of Tb3+ by those of the LTA base material in the absorption spectra. Therefore, the transmittance spectra of the Tb3+:LTA material did not show a distinct absorption peak for Tb3+, and there was no significant correlation with the doping amount of Tb3+. The peaks observed and the corresponding transitions in the PLE spectra (λem = 543 nm) were 304 nm (7F6 to 5H6), 318 nm (7F6 to 5H7), 341 nm (7F6 to 5L7), 354 nm (7F6 to 5L9), 369 nm (7F6 to 5D2), 378 nm (7F6 to 5D3), and 485 nm (7F6 to 5D4) (Figure 5) [30,31].
The PL of the samples was examined by measuring their emission spectra upon excitation with two ultraviolet (UV) light excitations, one with a wavelength of λexc = 378 nm, which lay in the ultraviolet A (UV-A)/near-ultraviolet (N-UV) regions, and another with a wavelength of λexc = 193 nm (a laser light), which lay in the ultraviolet C (UV-C)/far-ultraviolet (F-UV) regions. Peaks of both 5D3 and 5D4 transitions were present in the emission spectra upon excitation with UV-A/N-UV light, which were located at 418 nm (5D3 to 7F5), 440 nm (5D3 to 7F4), 487 nm (5D4 to 7F6), 543 nm (5D4 to 7F5), 586 nm (5D4 to 7F4), and 621 nm (5D4 to 7F3) [16,30,36] (Figure 6). Upon excitation with UV-C/F-UV light, the same peaks from the 5D4 to 7FJ transitions were present, but emission from 5D4 to 7FJ was limited to one peak at 386 nm (5D4 to 7F6) [14] (Figure 7). In all of these transitions, 5D47F6 (487 nm) and 5D47F5 (543 nm) are magnetically dipole and parity-forbidden transitions, respectively [20]. Therefore, LTA:Tb3+ exhibits a strong emission intensity at 543 nm. In this context, we should point out that a non-radiative relaxation from the 5D3 to the 5D4 levels via cross-relaxation to a neighbor Tb3+ is a well-known phenomenon in Tb3+ systems [11,14,15,16]. This process occurs because due to the closely matched energy difference between the 5D4 and 5D3 levels (5800 cm−1) and the 7F6 and 7F0 levels (5700 cm−1), excitation from 7F6 to 7F0 promotes the non-radiative drain from 5D3 to 5D4 of a nearby ion ((5D3, 7F6) → (5D4, 7F0)) [11,14,15]. Thus, if the dispersion of Tb3+ in the matrix is ideal, the ratio of the intensity of the green light to the intensity of the blue light (IG/IB) is expected to increase when Tb3+ concentration is increased [15]. In our experiments, while IG/IB increased when the Tb3+ concentration was increased from 1 to 10 extra wt%, it decreased when the Tb3+ concentration was increased from 0.1 to 1 extra wt% (Figure 8), possibly because Tb3+ pair formation, clustering, and phase separation played a role in our system [15]. Interestingly, for both excitation wavelengths (λexc = 193 and 378 nm), IB and IG were comparable for the samples studied (Figure 8).
A graph of the green PL decay curves is shown in Figure 9exc = 378 nm; λem = 543 nm). The curves did not follow single exponential decays, indicating the presence of a radiationless process due to the energy transfer among active Tb3+ ions, caused by either cross-relaxation or a cooperative energy transfer to upper levels [21]. We employed two methods for obtaining the luminescence decay times. In the first method, the following theoretical intensity curve with two exponential decay terms was fitted to the experimental data (Figure 9):
I = I 0 + A 1 × e x p t τ 1 + A 2 × e x p t τ 2  
The values for the luminescence decay times (τ1 and τ2) obtained using this method were similar for the samples and included τ1 = 1.21, 1.21, and 1.20 μs and τ2 = 11.80, 12.28, and 12.00 μs for samples #1, #2, and #3, respectively. In the second method, the mean luminescence decay time (τm) was calculated from the following equation [17,22,30,36]
τ m = I t t d t I t d t
The values obtained for τm from this method were 18, 14, and 17 μs for samples #1, #2, and #3, respectively. A decay time on the order of μs is potentially suitable for applications concerning static imaging, UV detection [27], and plasma display panels [28,29,30]. Importantly, these decay times are substantially shorter than those typically obtained for Tb3+-doped glass materials, which are on the order of ms (Table 2). The Tb3+-doped glass materials listed in Table 2 were based upon calcium aluminosilicate [14,19,21], fluorophosphate [16], fluoroborate [17], zinc phosphate [16,20], LTA zeolite-derived aluminosilicate [20], zinc phosphate [20], zinc fluorophosphate [21], borogermanate [22,29], lead germanate [25], strontium aluminoborate [26], and strontium fluoroaluminate [30] glasses. Of note, in the only other example of LTA zeolite-derived Tb3+-doped glass we are aware of [20], the sample was green-emitting and had a decay time of 2.398 ms.

4. Conclusions

Colorless, transparent, Tb3+-doped, LTA zeolite-derived boro-aluminosilicate glass samples were prepared using the melt quenching method. The emission spectra obtained using two different excitation wavelengths (λexc = 193 and 378 nm) showed blue and green light emissions with comparable intensities. The green luminescence decay curves were not single-exponential. The mean decay times were 18, 14, and 17 μs for 0.2, 1.0, and 10 extra wt% of Tb3+, respectively, and the computed decay times from fitting a theoretical curve with two decay terms were ~1.2 and ~12 μs (irrespective of the Tb3+ concentration). Given their relatively fast green luminescence decay times, these synthesized glass materials have potential for applications concerning static imaging, UV detection, and plasma display panels.

Author Contributions

Formal analysis, S.H., Z.Y., Y.G., S.J., X.H. (Xiaochan Huang) and F.W.; Investigation, Y.X., S.H., Z.Y., X.H. (Xingxing Huangand), Q.H. and X.G.; Resources, X.G.; Data curation, Y.X., S.H., Z.Y., X.H. (Xingxing Huangand), Y.G., S.J., X.H. (Xiaochan Huang), F.W. and X.G.; Writing—original draft, Y.X.; Writing—review & editing, Z.Y. and Q.H. All authors have read and agreed to the published version of the manuscript.

Funding

This work was financially supported by the National Natural Science Foundation of China (No. 52202365), and the Guangdong Basic and Applied Basic Research Foundation (General Program No. 2022A1515011016).

Informed Consent Statement

Not applicable.

Data Availability Statement

The data of this paper are available on request from the corresponding author.

Conflicts of Interest

The authors declare no conflict of interest.

References

  1. Gupta, I.; Singh, S.; Bhagwan, S.; Singh, D. Rare earth (RE) doped phosphors and their emerging applications: A review. Ceram. Int. 2021, 47, 19282–19303. [Google Scholar] [CrossRef]
  2. Pisarski, W.A. Rare Earth Doped Glasses/Ceramics: Synthesis, Structure, Properties and Their Optical Applications. Materials 2022, 15, 8099. [Google Scholar] [CrossRef] [PubMed]
  3. Erol, E.; Vahedigharehchopogh, N.; Kıbrıslı, O.; Ersundu, M.Ç.; Ersundu, A.E. Recent progress in lanthanide-doped luminescent glasses for solid-state lighting applications-a review. J. Phys. Condens. Matter. 2021, 33, 483001. [Google Scholar] [CrossRef] [PubMed]
  4. Li, X.; Zhang, Y.; Geng, D.; Lian, J.; Zhang, G.; Hou, Z.; Lin, J. CaGdAlO4:Tb3+/Eu3+ as promising phosphors for full-color field emission displays. J. Mater. Chem. C 2014, 2, 9924–9933. [Google Scholar] [CrossRef]
  5. Kadyan, S.; Singh, S.; Sheoran, S.; Samantilleke, A.; Mari, B.; Singh, D. Optical and structural investigations of MLaAlO4:Eu3+ (M = Mg2+, Ca2+, Sr2+, and Ba2+) nanophosphors for full-color displays. J. Mater. Sci. Mater. Electron. 2020, 31, 414–422. [Google Scholar] [CrossRef]
  6. Yanagida, T.; Kato, T.; Nakauchi, D.; Kawaguchi, N. Fundamental aspects, recent progress and future prospects of inorganic scintillators. Jpn. J. Appl. Phys. 2023, 62, 010508. [Google Scholar] [CrossRef]
  7. Righini, G.; Enrichi, F.; Zur, L.; Ferrari, M. Rare-earth doped glasses and light managing in solar cells. J. Phys. Conf. Ser. 2019, 1221, 012028. [Google Scholar] [CrossRef]
  8. Huang, X.; Han, S.; Huang, W.; Liu, X. Enhancing solar cell efficiency: The search for luminescent materials as spectral converters. Chem. Soc. Rev. 2013, 42, 173–201. [Google Scholar] [CrossRef]
  9. Tao, K.; Ye, Y.; Bai, H.; Wang, S. Synthesis and luminescence characteristics of Tb3+-doped fluorophosphate glass for UV detection. J. Non-Cryst. Solids 2021, 572, 121012. [Google Scholar] [CrossRef]
  10. Kuro, T.; Okada, G.; Kawaguchi, N.; Fujimoto, Y.; Masai, H.; Yanagida, T. Scintillation properties of rare-earth doped NaPO3-Al(PO3)3 glasses. Opt. Mater. 2016, 62, 561–568. [Google Scholar] [CrossRef]
  11. Silversmith, A.J.; Boye, D.M.; Brewer, K.S.; Gillespie, C.E.; Lu, Y.; Campbell, D.L. 5D37FJ emission in terbium-doped sol–gel glasses. J. Lumin. 2006, 121, 14–20. [Google Scholar] [CrossRef]
  12. Pankratov, V.; Popov, A.; Kotlov, A.; Feldmann, C. Luminescence of nano- and macrosized LaPO4:Ce,Tb excited by synchrotron radiation. Opt. Mater. 2011, 33, 1102–1105. [Google Scholar] [CrossRef]
  13. Beladi-Mousavi, M.; Walder, L. Photo-Electrochemical Device Enabling Luminescence Switching of LaPO4:Ce,Tb Nanoparticle Layers. Adv. Opt. Mater. 2020, 9, 2001891. [Google Scholar]
  14. dos Santos, J.F.M.; Zanuto, V.S.; Soares, A.C.C.; Savi, E.; Nunes, L.A.D.O.; Baesso, M.L.; Catunda, T. Evaluating the link between blue-green luminescence and cross-relaxation processes in Tb3+-doped glasses. J. Lumin. 2021, 240, 118430. [Google Scholar] [CrossRef]
  15. de Graaf, D.; Stelwagen, S.; Hintzen, H.; de With, G. Tb3+ luminescence as a tool to study clustering of lanthanide ions in oxynitride glasses. J. Non-Cryst. Solids 2003, 325, 29–33. [Google Scholar] [CrossRef]
  16. Linganna, K.; Ju, S.; Basavapoornima, C.; Venkatramu, V.; Jayasankar, C.K. Luminescence and decay characteristics of Tb 3+-doped fluorophosphate glasses. J. Asian Ceram. Soc. 2018, 6, 82–87. [Google Scholar] [CrossRef]
  17. Sales, T.; Amjad, R.; Jacinto, C.; Dousti, M. Concentration dependent luminescence and cross-relaxation energy transfers in Tb3+ doped fluoroborate glasses. J. Lumin. 2019, 205, 282–286. [Google Scholar] [CrossRef]
  18. Kesavulu, C.; Silva, A.C.A.; Dousti, M.R.; Dantas, N.O.; de Camargo, A.; Catunda, T. Concentration effect on the spectroscopic behavior of Tb3+ ions in zinc phosphate glasses. J. Lumin. 2015, 165, 77–84. [Google Scholar] [CrossRef]
  19. dos Santos, J.F.M.; Astrath, N.G.C.; Baesso, M.L.; Nunes, L.A.D.O.; Catunda, T. The effect of silica content on the luminescence properties of Tb3+-doped calcium aluminosilicate glasses. J. Lumin. 2018, 202, 363–369. [Google Scholar] [CrossRef]
  20. Pan, Y.; Fan, Y.; Lin, H.; Zhang, D.; Xu, X.; Yao, X. Preparation and characterization of green emitting NASO:Tb3+ and red emitting NASO:Eu3+ glasses derived from ions exchanged LTA zeolite. J. Lumin. 2022, 251, 119250. [Google Scholar] [CrossRef]
  21. Sontakke, A.D.; Biswas, K.; Annapurna, K. Concentration-dependent luminescence of Tb3+ ions in high calcium aluminosilicate glasses. J. Lumin. 2009, 129, 1347–1355. [Google Scholar] [CrossRef]
  22. Juárez-Batalla, J.; Meza-Rocha, A.N.; Muñoz, H.G.; Camarillo, I.; Caldiño, U. Luminescence properties of Tb3+-doped zinc phosphate glasses for green laser application. Opt. Mater. 2016, 58, 406–411. [Google Scholar] [CrossRef]
  23. Linganna, K.; Sreedhar, V.B.; Jayasankar, C.K. Luminescence properties of Tb3+ ions in zinc fluorophosphate glasses for green laser applications. Mater. Res. Bull. 2015, 67, 196–200. [Google Scholar] [CrossRef]
  24. Sun, X.Y.; Yu, X.G.; Wang, W.F.; Li, Y.N.; Zhang, Z.J.; Zhao, J.T. Luminescent properties of Tb3+-activated B2O3–GeO2–Gd2O3 scintillating glasses. J. Non-Cryst. Solids 2013, 379, 127–130. [Google Scholar] [CrossRef]
  25. Żur, L. Structural and luminescence properties of Eu3+, Dy3+ and Tb3+ ions in lead germanate glasses obtained by conventional high-temperature melt-quenching technique. J. Mol. Struct. 2013, 1041, 50–54. [Google Scholar] [CrossRef]
  26. Kawano, N.; Kawaguchi, N.; Okada, G.; Fujimoto, Y.; Yanagida, T. Photoluminescence, scintillation and TSL properties of Tb-doped strontium aluminoborate glasses. Radiat. Meas. 2019, 124, 69–73. [Google Scholar] [CrossRef]
  27. Kumar, V.; Luo, Z. A Review on X-ray Excited Emission Decay Dynamics in Inorganic Scintillator Materials. Photonics 2021, 8, 71. [Google Scholar] [CrossRef]
  28. Zang, D.S.; Song, J.H.; Park, D.H.; Kim, Y.C.; Yoon, D.H. New fast-decaying green and red phosphors for 3D application of plasma display panels. J. Lumin. 2009, 129, 1088–1093. [Google Scholar] [CrossRef]
  29. Xia, F.; Liu, S.; Wang, Y.; Mao, J.; Li, X.; Wang, Y.; Chen, G. Fast and intense green emission of Tb3+ in borosilicate glass modified by Cu+. Sci. Rep. 2015, 5, 15387. [Google Scholar] [CrossRef] [PubMed]
  30. Teng, L.; Zhang, W.; Chen, W.; Cao, J.; Sun, X.; Guo, H. Highly efficient luminescence in bulk transparent Sr2GdF7:Tb3+ glass ceramic for potential X-ray detection. Ceram. Int. 2020, 46, 10718–10722. [Google Scholar] [CrossRef]
  31. Struebing, C.; Lee, G.; Wagner, B.; Kang, Z. Synthesis and luminescence properties of Tb doped LaBGeO5 and GdBGeO5 glass scintillators. J. Alloys Compd. 2016, 686, 9–14. [Google Scholar] [CrossRef] [PubMed]
  32. Greaves, G.N.; Meneau, F.; Sapelkin, A.; Colyer, L.M.; Ap Gwynn, I.; Wade, S.; Sankar, G. The rheology of collapsing zeolites amorphized by temperature and pressure. Nat. Mater. 2003, 2, 622–629. [Google Scholar] [CrossRef] [PubMed]
  33. Wang, Z.; Lin, H.; Xu, L.; Hong, R.; Zhang, D.; Zhou, S. White emitting aluminosilicate glass phosphors derived from Dy3+, Ag+ co-exchanged LTA zeolite. Ceram. Int. 2020, 46, 28933–28938. [Google Scholar] [CrossRef]
  34. Fan, Y.; Lin, H.; Liu, H.; Zhang, L.; Wang, J.; Xie, Q.; Zhou, L.; Hong, R.; Zhang, D.; Tian, Y.; et al. Ion-exchanged LTA zeolite derived nepheline phase NaAlSiO4:Eu2+ ceramic phosphor for laser illumination. Ceram. Int. 2021, 47, 30514–30522. [Google Scholar] [CrossRef]
  35. Bao, H.; Lin, H.; Zhang, D.; Hong, R.; Tao, C.; Han, Z.; Yin, X.; Pan, Y.; Zhou, S.; Zhang, Z.-J.; et al. SrAlSiN3:Eu~(2+) containing phosphor-in-glass: A color converter for solid state laser lighting. Opt. Mater. 2022, 126, 112169. [Google Scholar] [CrossRef]
  36. Cao, J.; Wang, X.; Li, X.; Wei, Y.; Chen, L.; Guo, H. Enhanced emissions in Tb3+-doped oxyfluoride scintillating glass ceramics containing KLu2F7 nano-crystals. J. Lumin. 2016, 170, 207–211. [Google Scholar] [CrossRef]
  37. Papynov, E.; Belov, A.; Shichalin, O.; Buravlev, I.Y.; Azon, S.; Golub, A.; Gerasimenko, A.; Parotkina, Y.; Zavjalov, A.; Tananaev, I.; et al. SrAl2Si2O8 Ceramic Matrices for 90Sr Immobilization Obtained via Spark Plasma Sintering-Reactive Synthesis. Nucl. Eng. Technol. 2021, 53, 2289–2294. [Google Scholar] [CrossRef]
  38. Shichalin, O.; Papynov, E.; Ivanov, N.; Balanov, M.; Dran’Kov, A.; Shkuratov, A.; Zarubina, N.; Fedorets, A.; Mayorov, V.; Lembikov, A.; et al. Study of adsorption and immobilization of Cs+, Sr2+, Co2+, Pb2+, La3+ ions on Na-Faujasite zeolite transformed in solid state matrices. Sep. Purif. Technol. 2024, 332, 125662. [Google Scholar] [CrossRef]
  39. Dran’Kov, A.; Shichalin, O.; Papynov, E.; Nomerovskii, A.; Mayorov, V.; Pechnikov, V.; Ivanets, A.; Buravlev, I.; Yarusova, S.; Zavjalov, A.; et al. Hydrothermal synthesis, structure and sorption performance to cesium and strontium ions of nanostructured magnetic zeolite composites. Nucl. Eng. Technol. 2022, 54, 1991–2003. [Google Scholar] [CrossRef]
Figure 1. Schematic diagram of the preparation process of LTA:Tb3+ glass samples.
Materials 17 00671 g001
Figure 2. XRD analysis of the Tb3+-activated LTA zeolite-derived boro-aluminosilicate glass samples.
Materials 17 00671 g002
Figure 3. Transmission spectra of the Tb3+-activated LTA zeolite-derived boro-aluminosilicate glass samples.
Materials 17 00671 g003
Figure 4. Photos of the Tb3+-activated LTA zeolite-derived boro-aluminosilicate glass samples (The bottom font is the name of our laboratory).
Materials 17 00671 g004
Figure 5. PLE spectra of the Tb3+-activated LTA zeolite-derived boro-aluminosilicate glass samples (λem = 543 nm).
Materials 17 00671 g005
Figure 6. PL spectra of the Tb3+-activated LTA zeolite-derived boro-aluminosilicate glass samples (λexc = 378 nm).
Materials 17 00671 g006
Figure 7. PL spectra of the Tb3+-activated LTA zeolite-derived boro-aluminosilicate glass samples (λexc = 193 nm).
Materials 17 00671 g007
Figure 8. Variation in IG/IB with varying concentrations of Tb3+ (IG and IB were determined by integrating the intensities of the green and blue peaks in the emission spectra, respectively).
Materials 17 00671 g008
Figure 9. Green luminescence decay curves of the Tb3+-activated LTA zeolite-derived boro-aluminosilicate glass samples (each curve was normalized according to the intensity of sample #1). The solid lines represent the results of fitting Equation (1) to the experimental data.
Materials 17 00671 g009
Table 1. Comparison of nominal and experimental compositions obtained from EDX analysis.
Nominal (wt%)Experimental (wt%)
NaAlSiOBTbNaAlSiOBTbY
#18.510.010.458.79.80.26.215.125.347.902.43.2
#28.510.010.358.39.80.96.816.9521.245.103.56.5
#37.89.19.554.89.07.710.112.6513.845.106.711.8
Table 2. Green luminescence decay times of various Tb3+-doped glasses under excitation with UV light.
Tb3+-Doped Glass MaterialCompositionDecay Time (ms)Refs.
LTA zeolite-derived boro-aluminosilicatexTb2O3-68(Na2O-Al2O3-SiO2)–32B2O3 (x = 0.2, 1.0 and 10 extra wt%)τ1~1.2 μs, τ2~12 μs
τm = 18, 14, 17 μs
Present study
calcium aluminosilicate47.2CaO-41.3Al2O-4.1MgO-7.0SiO2-xTb4O7 (x = 0.04–15) (in wt%) and 33.2CaO-27.7Al2O3-4.1MgO-34SiO2-0.5Tb4O7 (in wt%)1.9, 2.3[14,19]
fluorophosphate44P2O5-17K2O-(29 − x) SrF2-9Al2O3-x Tb4O7 (x = 0.1–4) (in mol%)2.65–2.94[16]
fluoroborate(50 − x)B2O3-20ZnF2-30BaF2-xTbF3 (x = 0.1–4.0) (in mol%)3.33–4.57[17]
zinc phosphate60P2O5-15ZnO-5Al2O3-10BaO-10PbO-xTb2O3 (in mol%) (x = 1.0–5.0) (in wt%)2.62–2.94[18]
LTA zeolite-derived aluminosilicateNa+ was ion-exchanged with Tb3+ in Na12Al12Si12O482.398[19]
calcium aluminosilicate(100 − x)(58SiO2-23CaO-5Al2O3-4MgO-0NaF in mol%)-xTb2O3 (x = 0.25–40 in wt%)2.32–3.38[20]
zinc phosphate(100.0 − x)Zn(PO3)2-xTb2O3 (x = 0.6–5.0) (in mol%)2.76–2.97[22]
zinc fluorophosphate44P2O5-17K2O-9Al2O3-(29 − x)ZnF2-xTb4O7 (x = 0.1–2.0) (in mol%)3.12–3.78[23]
borogermanate25B2O3-40GeO2-(35 − x)Gd2O3-xTb2O3 (x = 0.25–16) (in mol%)1.0–1.8[24]
lead germanate45PbO-45GeO2-9.5Ga2O3-0.5Tb2O3 (in mol%)1.34[25]
strontium aluminoborate50B2O3-15Al2O3-35-xSrO-xTb4O7 (x = 0.1–5.0) (in mol%)2.2–2.6[26]
strontium fluoroaluminate70SiO2-7Al2O3-16SrF2-7GdF3-4TbF3 (in mol%)~3.1[30]
borogermanate50GeO2-25B2O3-(25 − x)La2O3/Gd2O3-xTb2O3 (x = 1–4)1.87–1.97[31]
Disclaimer/Publisher’s Note: The statements, opinions and data contained in all publications are solely those of the individual author(s) and contributor(s) and not of MDPI and/or the editor(s). MDPI and/or the editor(s) disclaim responsibility for any injury to people or property resulting from any ideas, methods, instructions or products referred to in the content.

