
Effect of Ni Doping on the Thermoelectric Properties of YbCo2Zn20
by
 , , , ,
Jorge R. Galeano-Cabral
1,2,
Benny Schundelmier
2,3,
Olatunde Oladehin
2,3,
Keke Feng
2,3,†,
Juan C. Ordonez
1,
Ryan E. Baumbach
2,3,‡ and
Kaya Wei
2,3,* 1
FAMU-FSU College of Engineering, Florida State University, Tallahassee, FL 32310, USA
2
National High Magnetic Field Laboratory, Florida State University, Tallahassee, FL 32310, USA
3
Department of Physics, Florida State University, Tallahassee, FL 32306, USA
*
Author to whom correspondence should be addressed.
†
Current affiliation: Department of Physics, University of California, San Diego, CA 92093, USA.
‡
Current affiliation: Department of Physics, University of California, Santa Cruz, CA 95064, USA.
Materials 2024, 17(8), 1906; https://doi.org/10.3390/ma17081906
Submission received: 21 March 2024
/
Revised: 13 April 2024
/
Accepted: 16 April 2024
/
Published: 19 April 2024
(This article belongs to the Special Issue Disorder-Driven Structure-Property Functionality in Materials: From Material Discovery to Device Development)
Abstract
:Thermoelectric devices are both solid-state heat pumps and energy generators. Having a reversible process without moving parts is of high importance for applications in remote locations or under extreme conditions. Yet, most thermoelectric devices have a rather limited energy conversion efficiency due to the natural competition between high electrical conductivity and low thermal conductivity, both being essential conditions for achieving a high energy conversion efficiency. Heavy-fermion compounds YbT2Zn20 (T = Co, Rh, Ir) have been reported to be potential candidate materials for thermoelectric applications at low temperatures. Motivated by this result, we applied chemical substitution studies on the transition metal site in order to optimize the charge carrier concentration as well as promote more efficient phonon scatterings. Here, we present the latest investigation on the Ni-doped specimens YbCo2−xNixZn20, where enhanced thermoelectric figure of merit values have been obtained.
1. Introduction
Thermal processes are a fundamental aspect of many crucial operations, ranging from water purification protocols to energy generation [1,2]. However, a persistent challenge prevails: the dissipation of valuable energy in the form of heat throughout these processes. Consequently, there has been a growing interest in waste-heat recovery systems to improve the efficiency of energy operations. Among the array of solutions, thermoelectric generators (TEGs) have emerged as promising contenders, capitalizing on the Seebeck effect to directly convert heat into electrical power. TEGs have been proposed for a wide variety of applications including waste-heat recovery from automobile engines [3,4,5], cooling of electronics [6,7,8], health monitoring [9,10], space power [11,12], and vaccine storage [13,14]. While strides have been made in making TEGs viable for real-world applications, the domain of thermoelectric technology still grapples with substantial hurdles, notably exemplified by the low values of the Seebeck coefficient, S, observed in the majority of thermoelectric materials. S can be defined as the ratio between the voltage and the corresponding temperature gradient (). The figure of merit of a thermoelectric material is given by , where and denote the electrical and thermal conductivities, respectively. Because the figure of merit is temperature-dependent, the primary metric for evaluating the efficiency of thermoelectric materials is .
From the figure of merit, it is clear that to improve thermoelectric performance, it is desirable to identify materials with large electrical conductivity, low thermal conductivity, and a large Seebeck coefficient. It is worth noting that and are intrinsically linked, posing a limitation for conventional metals and semiconductors [15,16].
The electrical conductivity is related to the density of charge carriers (n) and their mobility (), and it is typically expressed as , where e is the charge of the electron. Large electrical conductivity reduces Joule heating. The mobility is given by where is the effective mass and is the mean scattering time between collisions for the carriers. In an intrinsic semiconductor, the two types of charge carriers, with densities n and p for electrons and holes, respectively, move through the lattice with mobilities and , respectively. In this case, the conductivity occurs through the contributions of both holes () and electrons (), as follows: . Since electrons and holes are fermions, the probability of their occupation of a given energy state is determined by Fermi–Dirac statistics. The electrical conductivity is typically optimized as a function of the carrier concentration through extrinsic doping to produce P- and N-type materials [17].
The high absolute value of the Seebeck coefficient, S, would result in a high conversion of heat to electrical power, or electrical power to cooling performance. The sign of S indicates the majority of the charge carriers. For a positive value, the holes are the major carriers, and a negative value means the electrons dominate. The change of the sign of S with respect to T is an indication of a two-band model in the material, a competition between electrons and holes for dominating the charge transport [18]. S for different carrier types (e.g., an intrinsic semiconductor) is determined by the partial Seebeck coefficient of the electron () and holes () through the following relation: . Extrinsic conduction of the appropriate carrier type is possible by doping the material with either electrons or holes. Since S will be lower than that of either of the individual contributions, good thermoelectric materials have a band gap large enough to effectively minimize the minority carrier contributions [19]. Possible mechanisms to increase S include phonon drag, heavy-fermion materials, Kondo systems, and materials that exhibit phase transitions [20].
Low thermal conductivity values minimize the transfer of heat through the material. This transfer of heat could be done by electrons or via quantized vibrations of the lattice (phonons), such that , where and are the lattice and electronic contributions, respectively. and are connected through the Wiedmann–Franz relationship [21,22], , where the Lorentz number . The ratio between and is constant at a given temperature, which means that a more efficient way to reduce the total thermal conductivity would be to decrease the lattice contribution . This could be achieved by scattering phonons in a wide frequency range, which is possible through a variety of methods, such as tuning the mass fluctuation phonon scatterings in ternary and quaternary compounds [19].
For metals or degenerate semiconductors, the relationship between the charge carrier density, n, and Seebeck coefficient, S, can be expressed as
where n is the density of the charge carriers and is the effective mass of the carrier. Here, another conflict arises with the effective mass of the charge carrier, where larger effective masses result in a higher Seebeck coefficient but lower electrical conductivity. in Equation (1) is related to the curvature of the Fermi surface, and it increases when there is a large density of states close to the Fermi surface; however, heavy carriers will exhibit reduced velocities, resulting in diminished mobilities and subsequently leading to decreased electrical conductivity [23]. Therefore, a balance needs to be found when considering the effective mass of the predominant charge carrier in order to create a trade-off between a large effective mass and high mobility.
Significant progress has been made in the development of certain intermetallic materials for thermoelectric applications. Intermetallic compounds composed of rare-earth and transition metals have earned considerable attention due to their versatile properties, which manifest in exotic magnetism and strongly correlated electronic behaviors [24,25,26,27]. This versatility has led to the emergence of intriguing thermoelectric characteristics in specific intermetallic materials [28,29]. Notably, increased focus has been directed toward materials incorporating Yb, which can undergo hybridization with conduction electrons, resulting in what is known as heavy-fermion behavior. Compounds exhibiting a combination of these intriguing characteristics have been a focus of interest among scientists for quite some time. For example, the RT2Zn20 (R = rare earth, T = transition metal) family of materials, as discovered by Nasch et al. [30], has been the subject of study for over 25 years. Among its variants, the Yb analog has shown promise for low-temperature thermoelectric applications. Specifically, the heavy-fermion compounds YbT2Zn20 (T = Co, Rh, Ir) exhibit favorable S and ZT values at lower temperatures [31,32]. Among the three specimens, YbIr2Zn20 has emerged as the most promising in terms of thermoelectric performance, exhibiting a peak figure of merit (ZT) of approximately 0.07 at 35 K. In contrast, the Co and Rh analogs demonstrate lower ZT values of 0.0024 and 0.025, respectively. Further studies have revealed the potential for enhancing the thermoelectric properties of the Ir variant by incorporating other f-electron elements into the Yb site. Notably, the compound [33] achieved a value of 0.076 at 18.63 K, positioning it as the second-best performer, trailing only behind the state-of-the-art solid solutions with 0.15 at 35 K [34,35]. This achievement significantly surpasses other well-known cryogenic thermoelectric materials such as FeSb2 [36], Bi0.5Sb1.5Te3, Bi2Te3, CsBi4Te6 [37], and YbAl3 [38], all of which exhibit values below 0.03 at temperatures below 50 K. However, a notable challenge in achieving such enhancements lies in synthesizing a doping series, as not all substitutions on the Yb site yield the desired 1-2-20 structure, particularly those involving triple fillers.
It is also important to note that among the three specimens reported by Wei et al. [32], the Co version is the cheapest and most abundant variant, which is an important factor for practical applications. Rhodium (Rh) and Iridium (Ir) constitute only 0.0001 and 0.001 ppm of the Earth’s crust, respectively, which make them exceedingly rare elements compared to the 29 ppm of Cobalt (Co) [39]. Additionally, Co, unlike Rh and Ir, is part of the 35 mineral commodities identified as critical. Critical materials are used in many products important to the U.S. economy and national security [40]. Therefore, it is unlikely that these materials would not be available for research and development. The U.S. Department of Energy (DOE) assesses material criticality based on its importance to a range of energy technologies and the potential for supply risk. Co, for instance, is a battery-critical material used in electric vehicles and grid storage (in the battery cathode, Co enables high energy density and thermal stability) [41], and it is also used in the production of permanent magnets for high-temperature applications, such as SmCo5 and YCo5 [42]. Consequently, in our investigation, we chose to prioritize the YbCo2Zn20 specimen. We have decided to dope the Co site with Ni, hoping to optimize the charge carrier concentration and promote a stronger hybridization between the f- and conduction electrons. This strategy could lead to an enhancement in the Seebeck coefficient and, consequently, a better . Elevating the performance of the Co variant to match that of the Ir counterpart could unlock significant opportunities within the industry.
For this study, we synthesized six single-crystalline samples through the molten metal flux growth method. In Section 3.2, we survey the thermoelectric properties in this doping series to establish the impact of Ni substitution on the Co site. In Section 3.3, we examine the impact of chemical substitution on the magnetic properties and heat capacity, which provides insights into the hybridization between the f- and conduction electron states. In Section 3.4, a Hall-effect analysis is performed to determine the connection between Ni doping, the charge carrier concentration, and the enhanced thermoelectric values. Collectively, these measurements elucidate the parameters governing the behavior of YbCo2Zn20, offering valuable insights for optimizing its thermoelectric properties.
2. Materials and Methods
2.1. Sample Synthesis
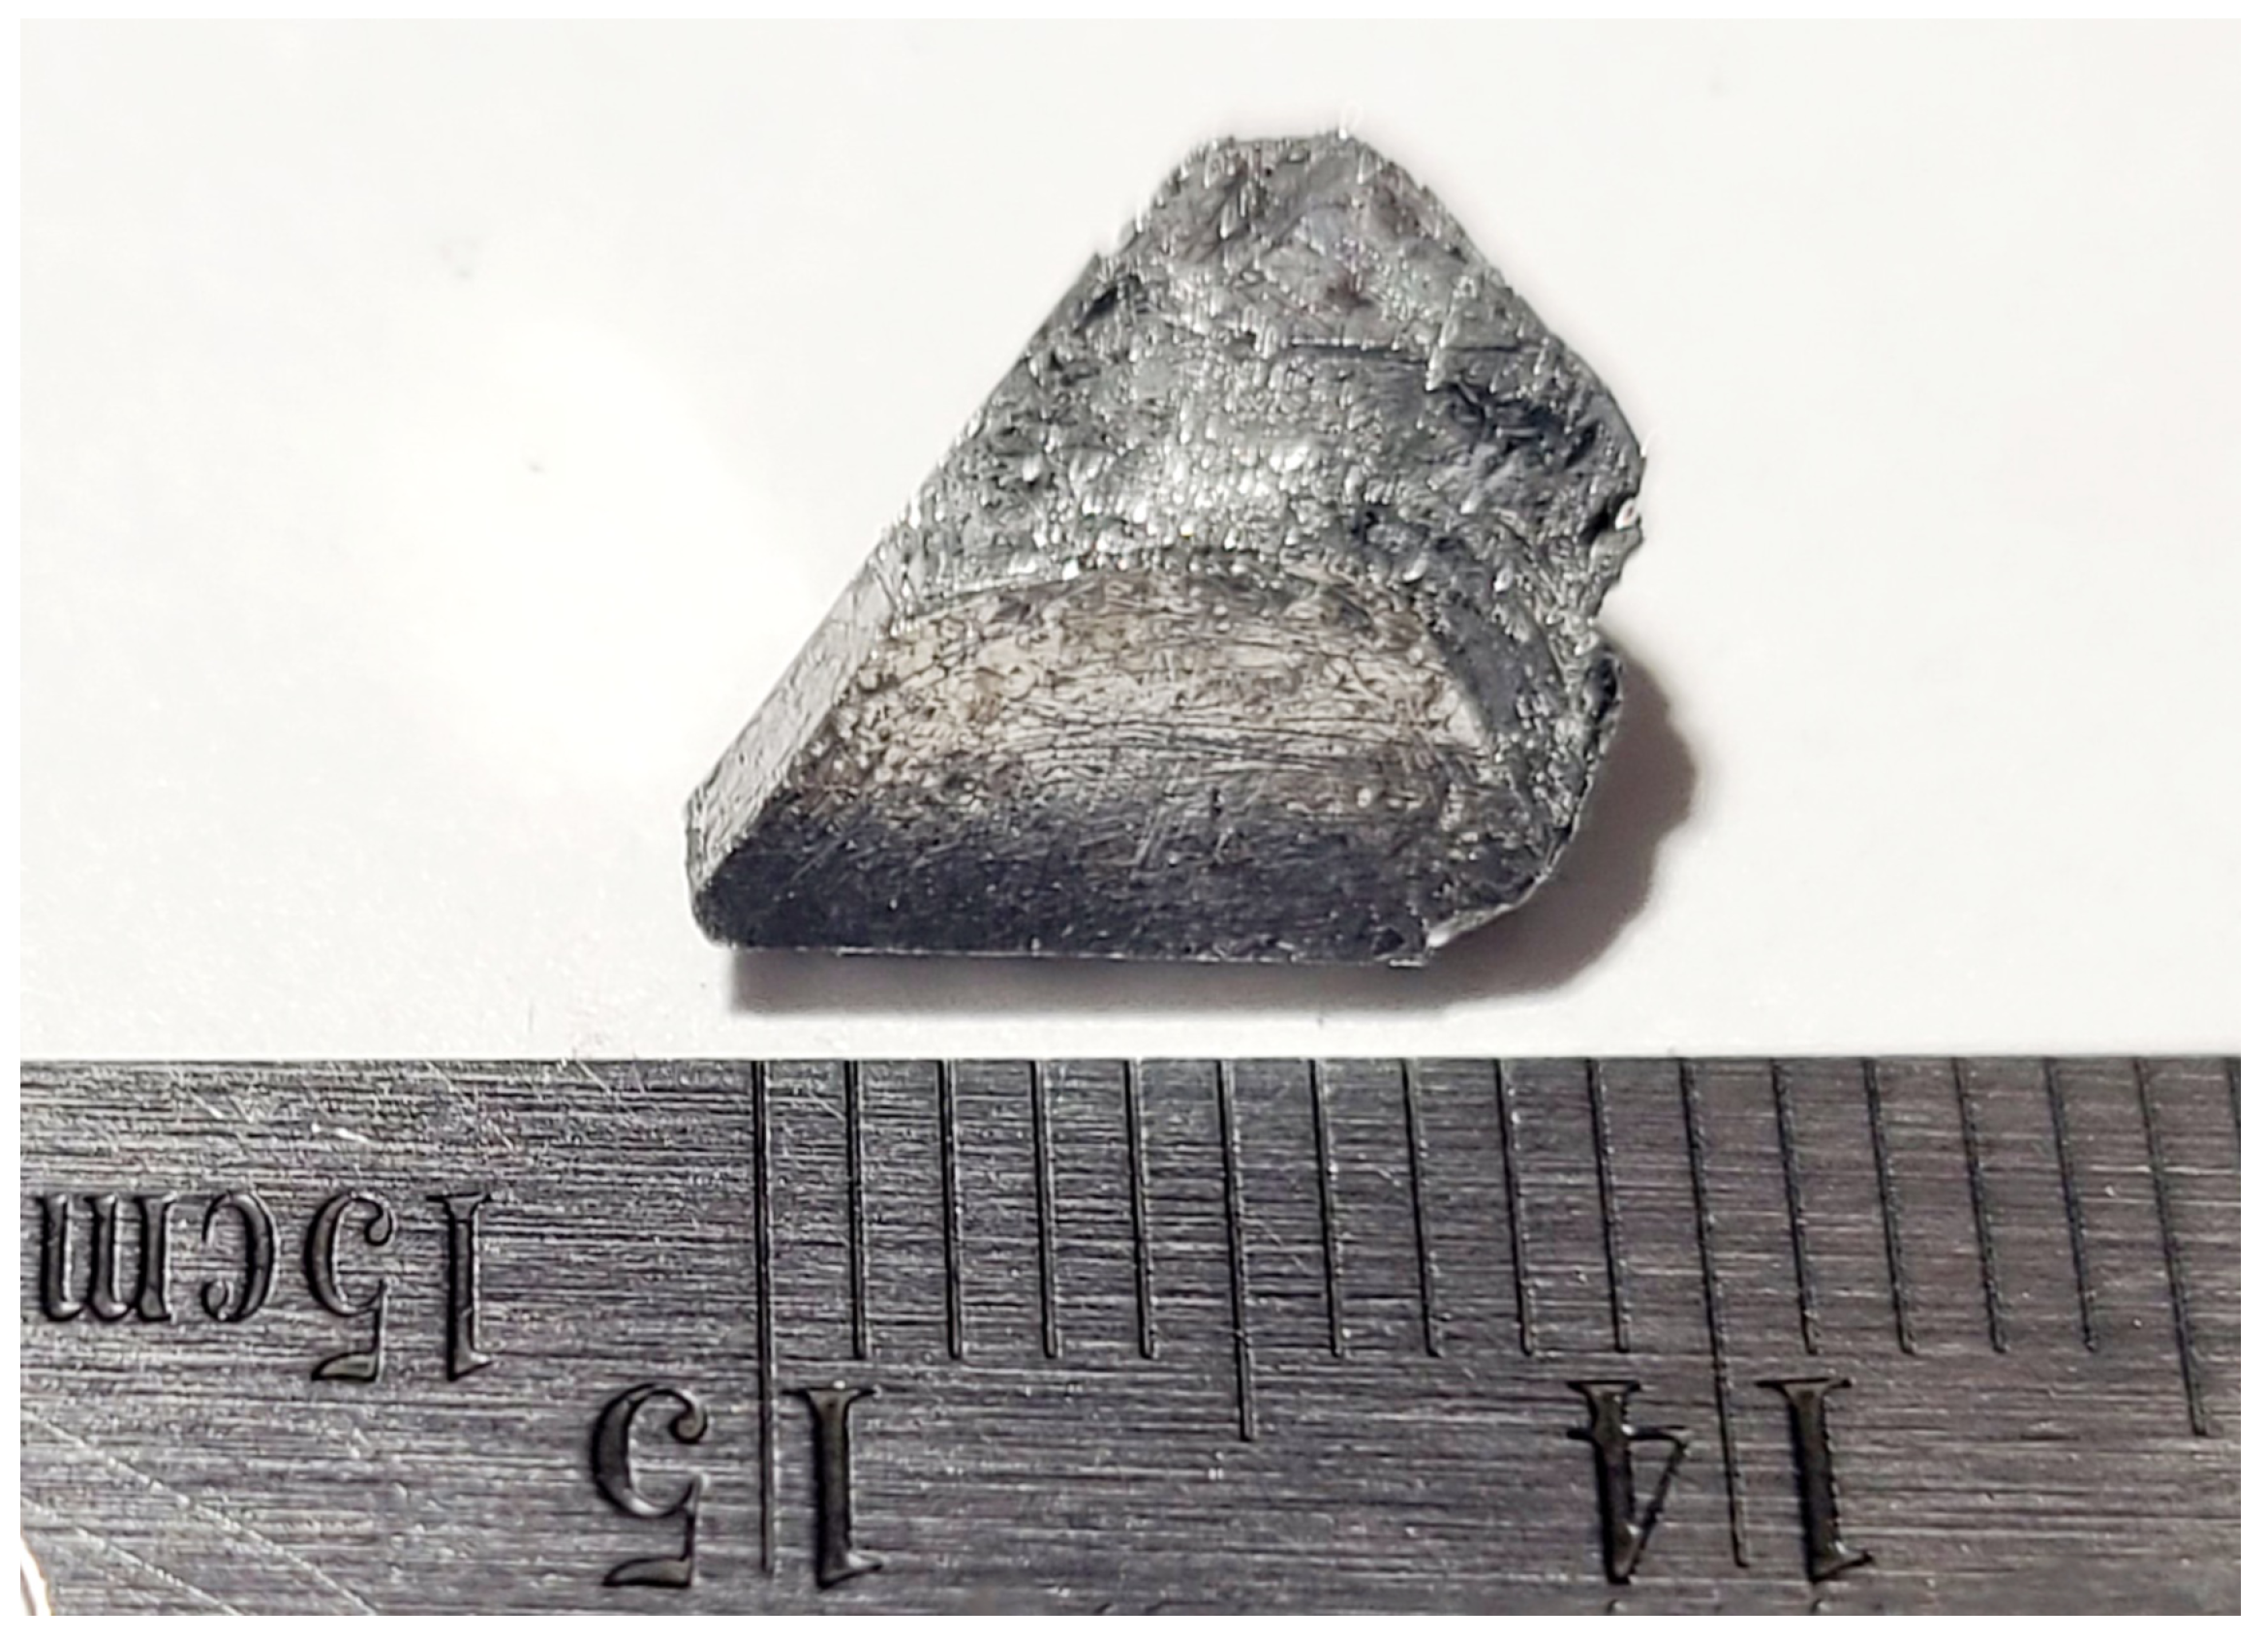
Single-crystalline samples were synthesized from a Zn-rich self-flux, employing the growth procedures outlined by Torikachvili et al. [43]. Elements with purities greater than 99.9% were loaded into 2 mL Canfield alumina crucibles [44] with a molar ratio of 1(Yb):2(Co, Ni):60(Zn). The crucibles were sealed under vacuum in 2 mm thick quartz tubes, heated to 1050 °C at a rate of 50 °C/h, and held at that temperature for 72 h. Next, the ampules were cooled down to 700 °C at a rate of 2 °C/h and held at that temperature for another 72 h. Finally, at 700 °C, the excess flux was removed by centrifuging, after which crystals with dimensions of several millimeters were collected. Figure 1 shows the as-synthesized YbCo1.86Ni0.14Zn20 single crystal.
2.2. Sample Characterization
In the realm of materials science and analytical chemistry, energy-dispersive X-ray spectroscopy (EDS or EDX) has emerged as a powerful tool, playing a pivotal role in the characterization and examination of diverse materials at the microscale. As an integral component of electron microscopy, EDS offers a comprehensive understanding of the elemental composition within a sample, enabling researchers to delve into the intricacies of material properties with unparalleled precision. The process involves the detection and quantification of characteristic X-rays emitted by a specimen when bombarded with a focused electron beam. In preparation for an EDS measurement, specimens are affixed to an aluminum holder using carbon tape to secure them in place. The sample holder is then introduced into a scanning electron microscope (SEM) equipped with EDS capabilities. After achieving a vacuum environment and resolving the sample image, three to five spots, each a few microns in diameter, are selected as focal points for the electron beam on each sample. The selection of multiple targets serves the purpose of evaluating the uniformity of the entire sample.
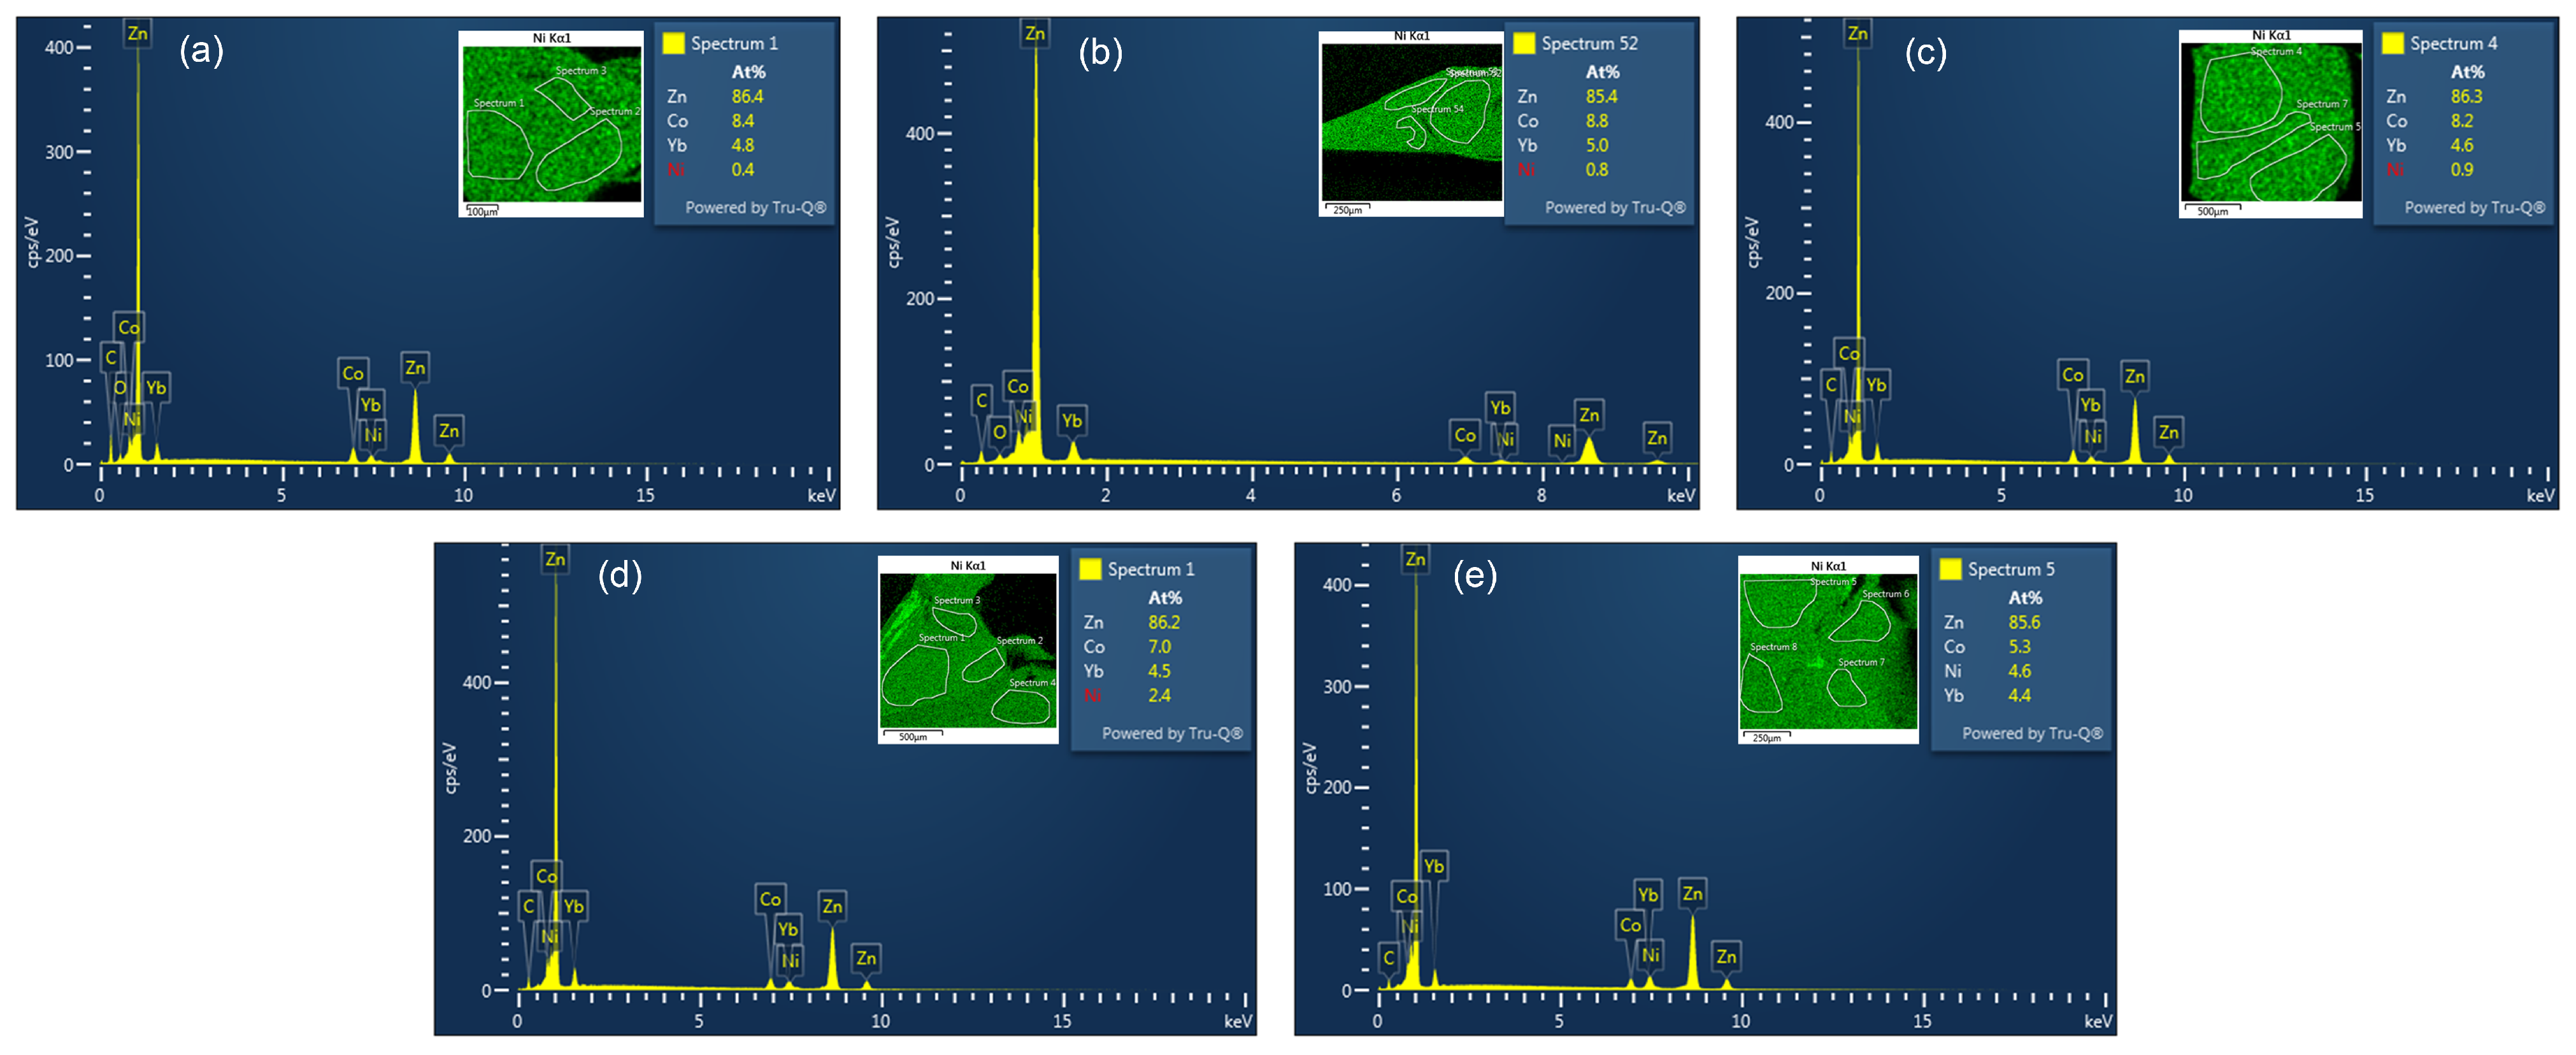
For this study, the elemental analysis is performed using an FEI NOVA 400 nanoSEM scanning electron microscope [Field Electron and Ion (FEI) Company, Hillsboro, OR, USA]. The Nova NanoSEM is an ultra-high-resolution Low-Vacuum Schottky Field-Emission Scanning Electron Microscope (FEG-SEM). The instrument combines a field-emission electron source, an oil-free vacuum system, a magnetic immersion final lens, and a heated objective aperture [45]. The device is equipped with energy-dispersive X-ray spectroscopy (EDS or EDX) capabilities using an Oxford 100 mm2 UltimMax SDD (silicon drift detector) X-ray detector [Oxford Instruments plc., Abingdon, UK]. In Figure 2, the EDS spectrum of a representative focal point for all the doped samples is displayed. The insets provide the elemental mapping of Ni and the atomic percentages of all elements detected in the selected spectrum. To ensure accuracy, the values of x for the doping series were derived by averaging data from multiple focal points for each sample and subsequently normalizing them based on the total number of atoms in the compound formula, which is 23 for 1-2-20 compounds.
The crystal structure and unit cell parameters were characterized by powder X-ray diffraction (pXRD) using a Rigaku SmartLab SE X-ray diffractometer [Rigaku Corporation, Tokyo, Japan] with a Cu K source. Temperature-dependent magnetic susceptibility, , and isothermal magnetization, , measurements were performed for single crystals using a VSM SQUID Magnetometer from Quantum Design, model MPMS-3 [Quantum Design Inc, San Diego, CA, USA]. measurements were taken at a constant temperature of T = 1.8 K under applied magnetic fields, H, from −7 T to 7 T. measurements were taken under a constant magnetic field of H = 0.1 T from 1.8 K to 300 K. For both cases, single crystals were mounted such that the magnetic field was parallel to the (111) planes. Heat capacity () was measured from 1.8 K to 250 K using a Quantum Design Physical Property Measurement System (PPMS), model 6000 [Quantum Design Inc, San Diego, CA, USA]. The temperature-dependent Seebeck coefficient, S, thermal conductivity, , and electrical resistivity, , were measured using the PPMS Thermal Transport Option (TTO). For these measurements, single crystals were cut into rectangular bars with a general dimension of 7 mm by 2 mm by 1 mm. All surfaces were polished to reduce surface scattering. TTO measurements were performed from 1.8 K to 400 K, obtaining , , and S simultaneously as a function of T to assess both and the power factor, . Both the and the TTO measurements were performed under high vacuum (≈ Torr), with no magnetic field being applied to the specimens. Magnetic field-dependent Hall resistance measurements were conducted at K across a range of magnetic fields from T to T. Subsequently, the density of the charge carriers was determined for each sample. These measurements were performed on single crystals polished to a thickness of less than 1 mm.
3. Results and Discussion
3.1. Structural Characterization
Zn20 crystalizes in the same space group, -3m (#227), as the other 1-2-20 compounds [46,47,48,49]. The X-ray diffraction peaks from 2 = 30° to 50° are shown in Figure 3a, and the zoomed-in peaks from 37° to 39° are shown in Figure 3b. The peak positions across the doping series only show slight to negligible shifts. This is as expected since the atomic radii of Ni and Co are very similar [50], suggesting that this type of chemical substitution has a minimal impact on the lattice constant.
3.2. Electrical Transport and Thermoelectric Properties
Figure 4a shows the temperature-dependent electrical resistivities of all specimens of Zn20. All the samples show similar behavior, where decreases with increasing temperature for 1.8 K 50 K, and a broad minimum is observed. At high temperatures, K, the specimens exhibit metallic behavior, where increases with increasing temperature. This behavior is consistent with earlier reports, where it was also shown that the parent compound (YbCo2Zn20) exhibited a coherence peak, typical for Kondo lattice systems [51,52,53], below 1.8 K and a sudden drop around 20 mK [43]. It can be seen that a small amount of Ni in the system does not significantly affect the behavior of the electrical resistivity; however, for specimens x = 0.5 and x = 1 (25% and 50% Ni on the Co site, respectively), the value of the minima increases from 30 cm to 50 cm (see Table 1). Figure 4b illustrates the thermal conductivity values for all synthesized specimens. Notably, specimens exhibiting lower thermal conductivity values also demonstrate higher electrical resistivity, except for . Considering that all the specimens are mostly Zn, the lattice thermal conductivity values () are expected to be similar across the doping series.
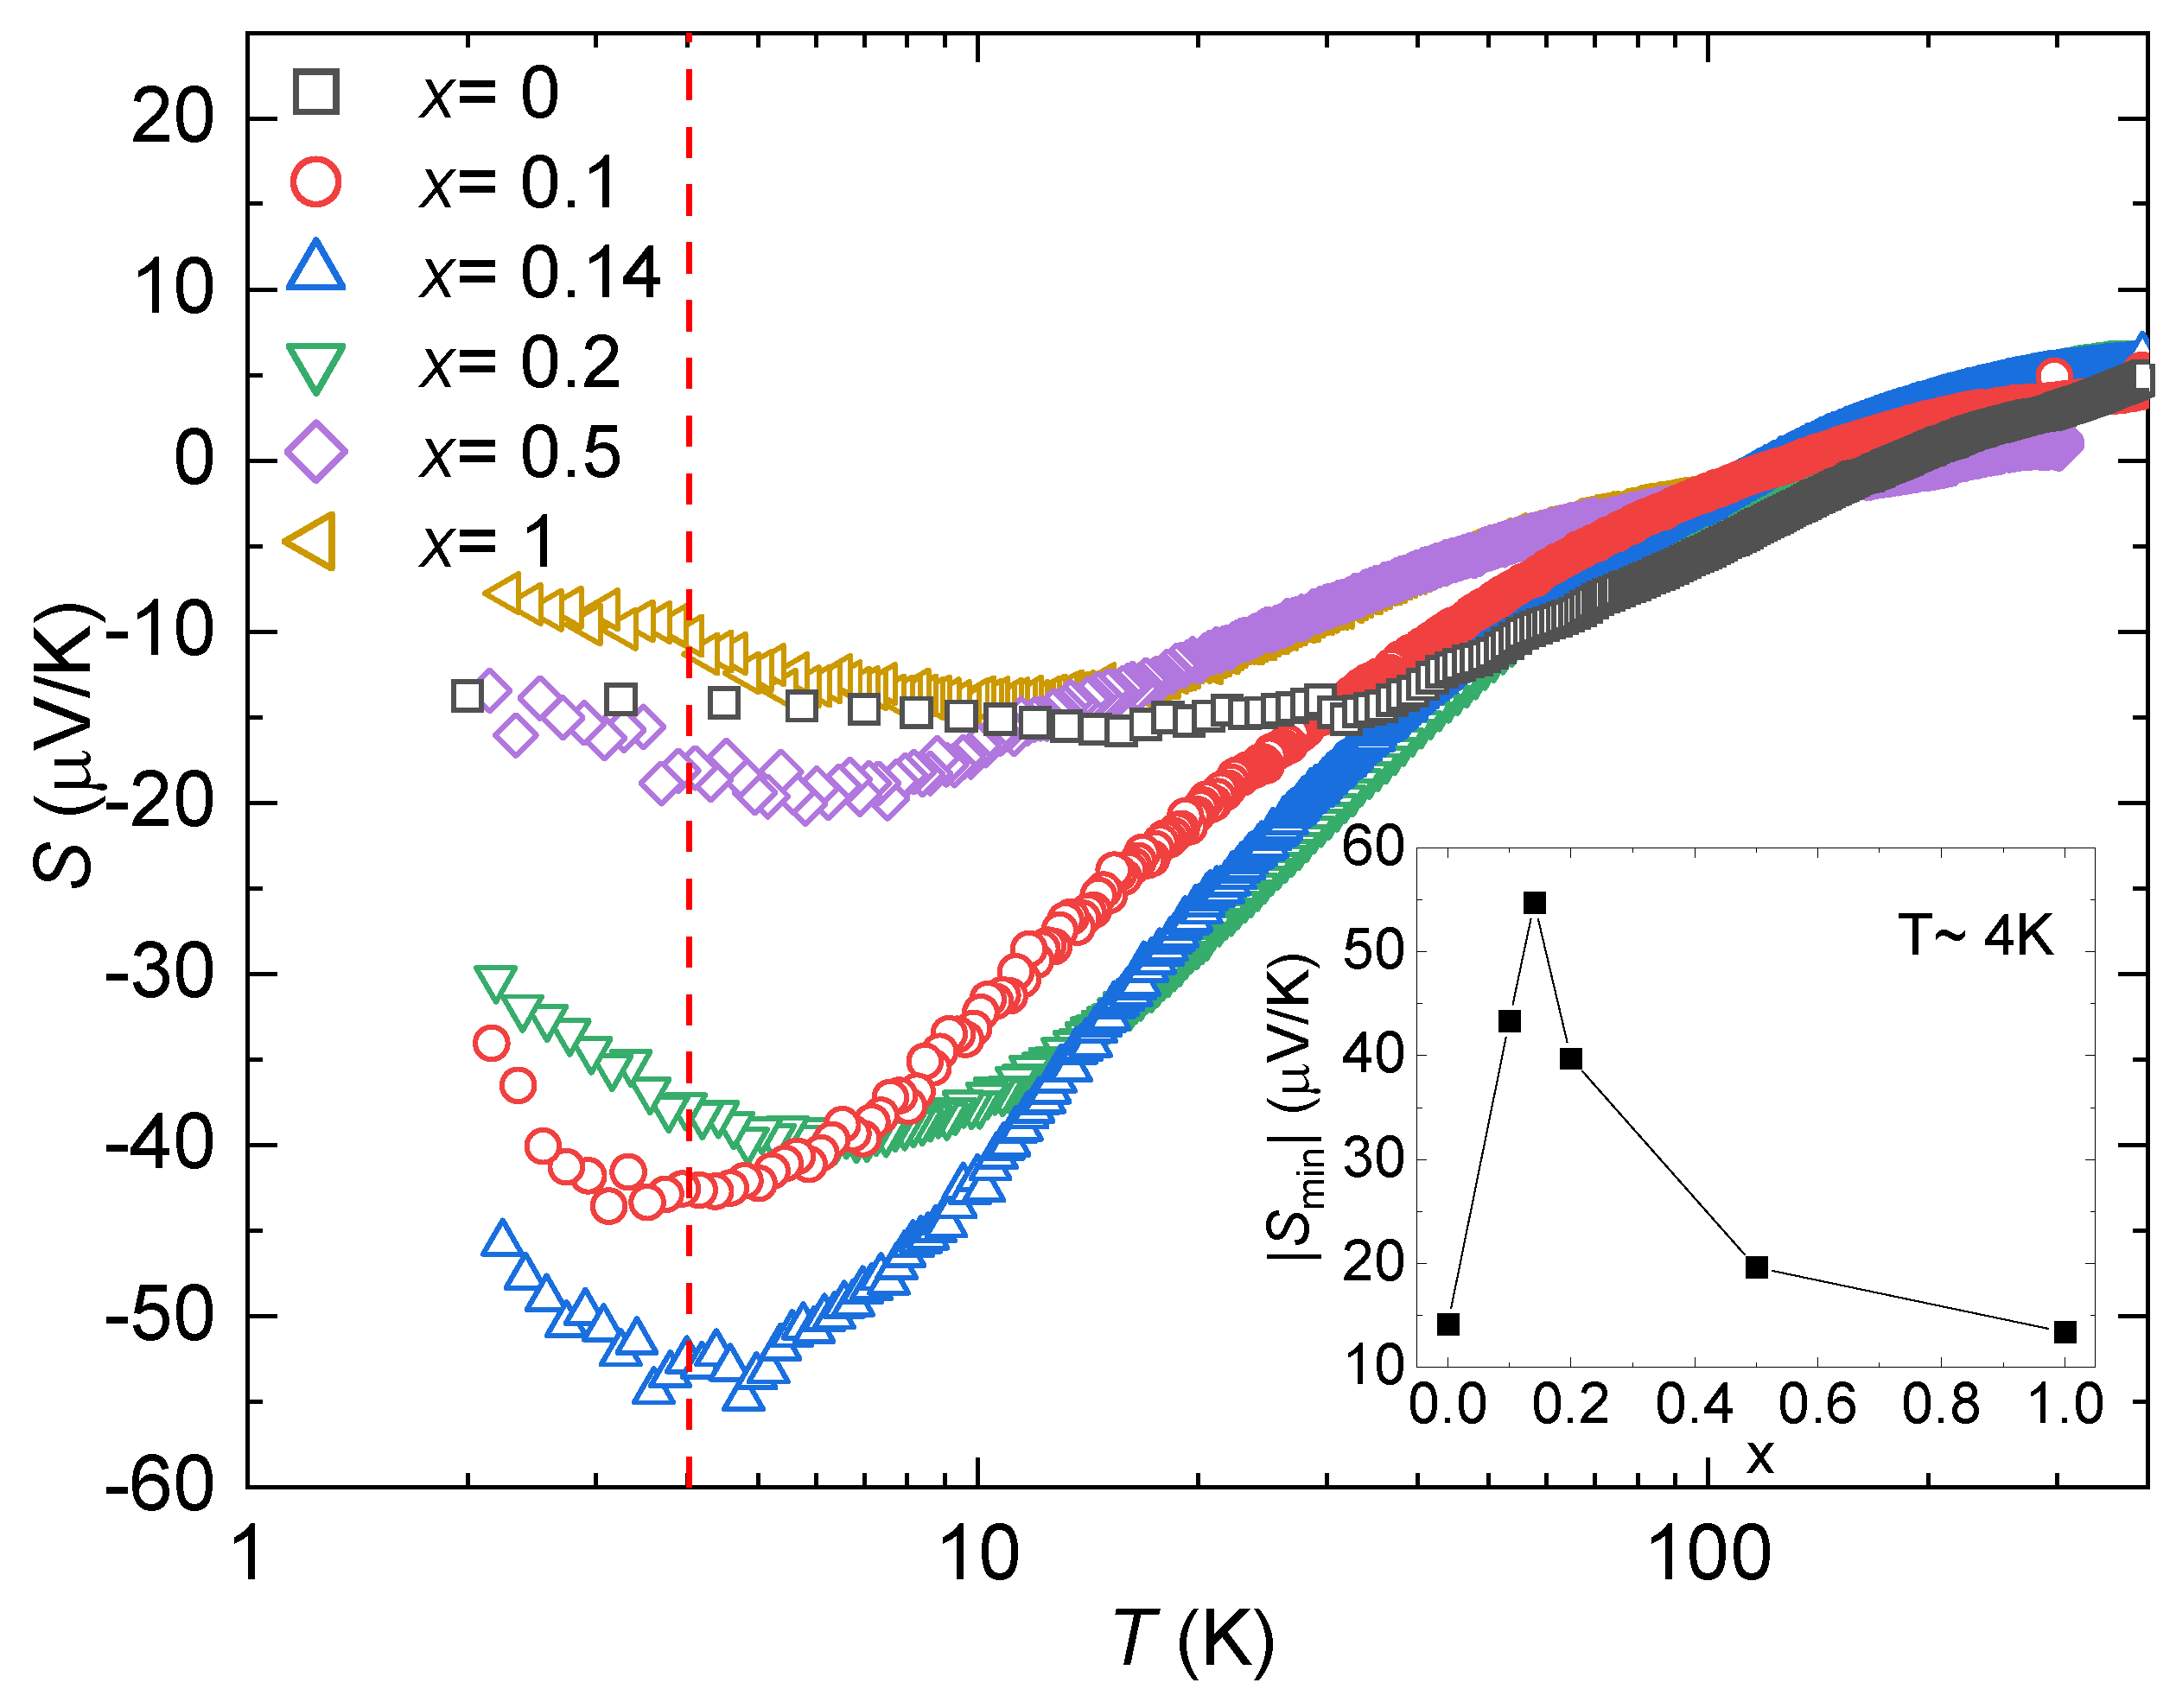
Looking at the Seebeck coefficient S (Figure 5), we can see that for all the samples increases with decreasing temperature and peaks around K, then decreases as K. This peak is more prominent in the Ni-containing samples. The inset in Figure 5 shows the absolute value of the peak as a function of the Ni content (values listed in Table 1), where an optimum content of Ni can be observed between x = 0.1 and x = 0.2 with a significant improvement in S compared to the parent compound. While YbCo2Zn20 has been reported to have a value of V/K [32], introducing 7% of Ni in the system (x = 0.14) enhanced that value to V/K.
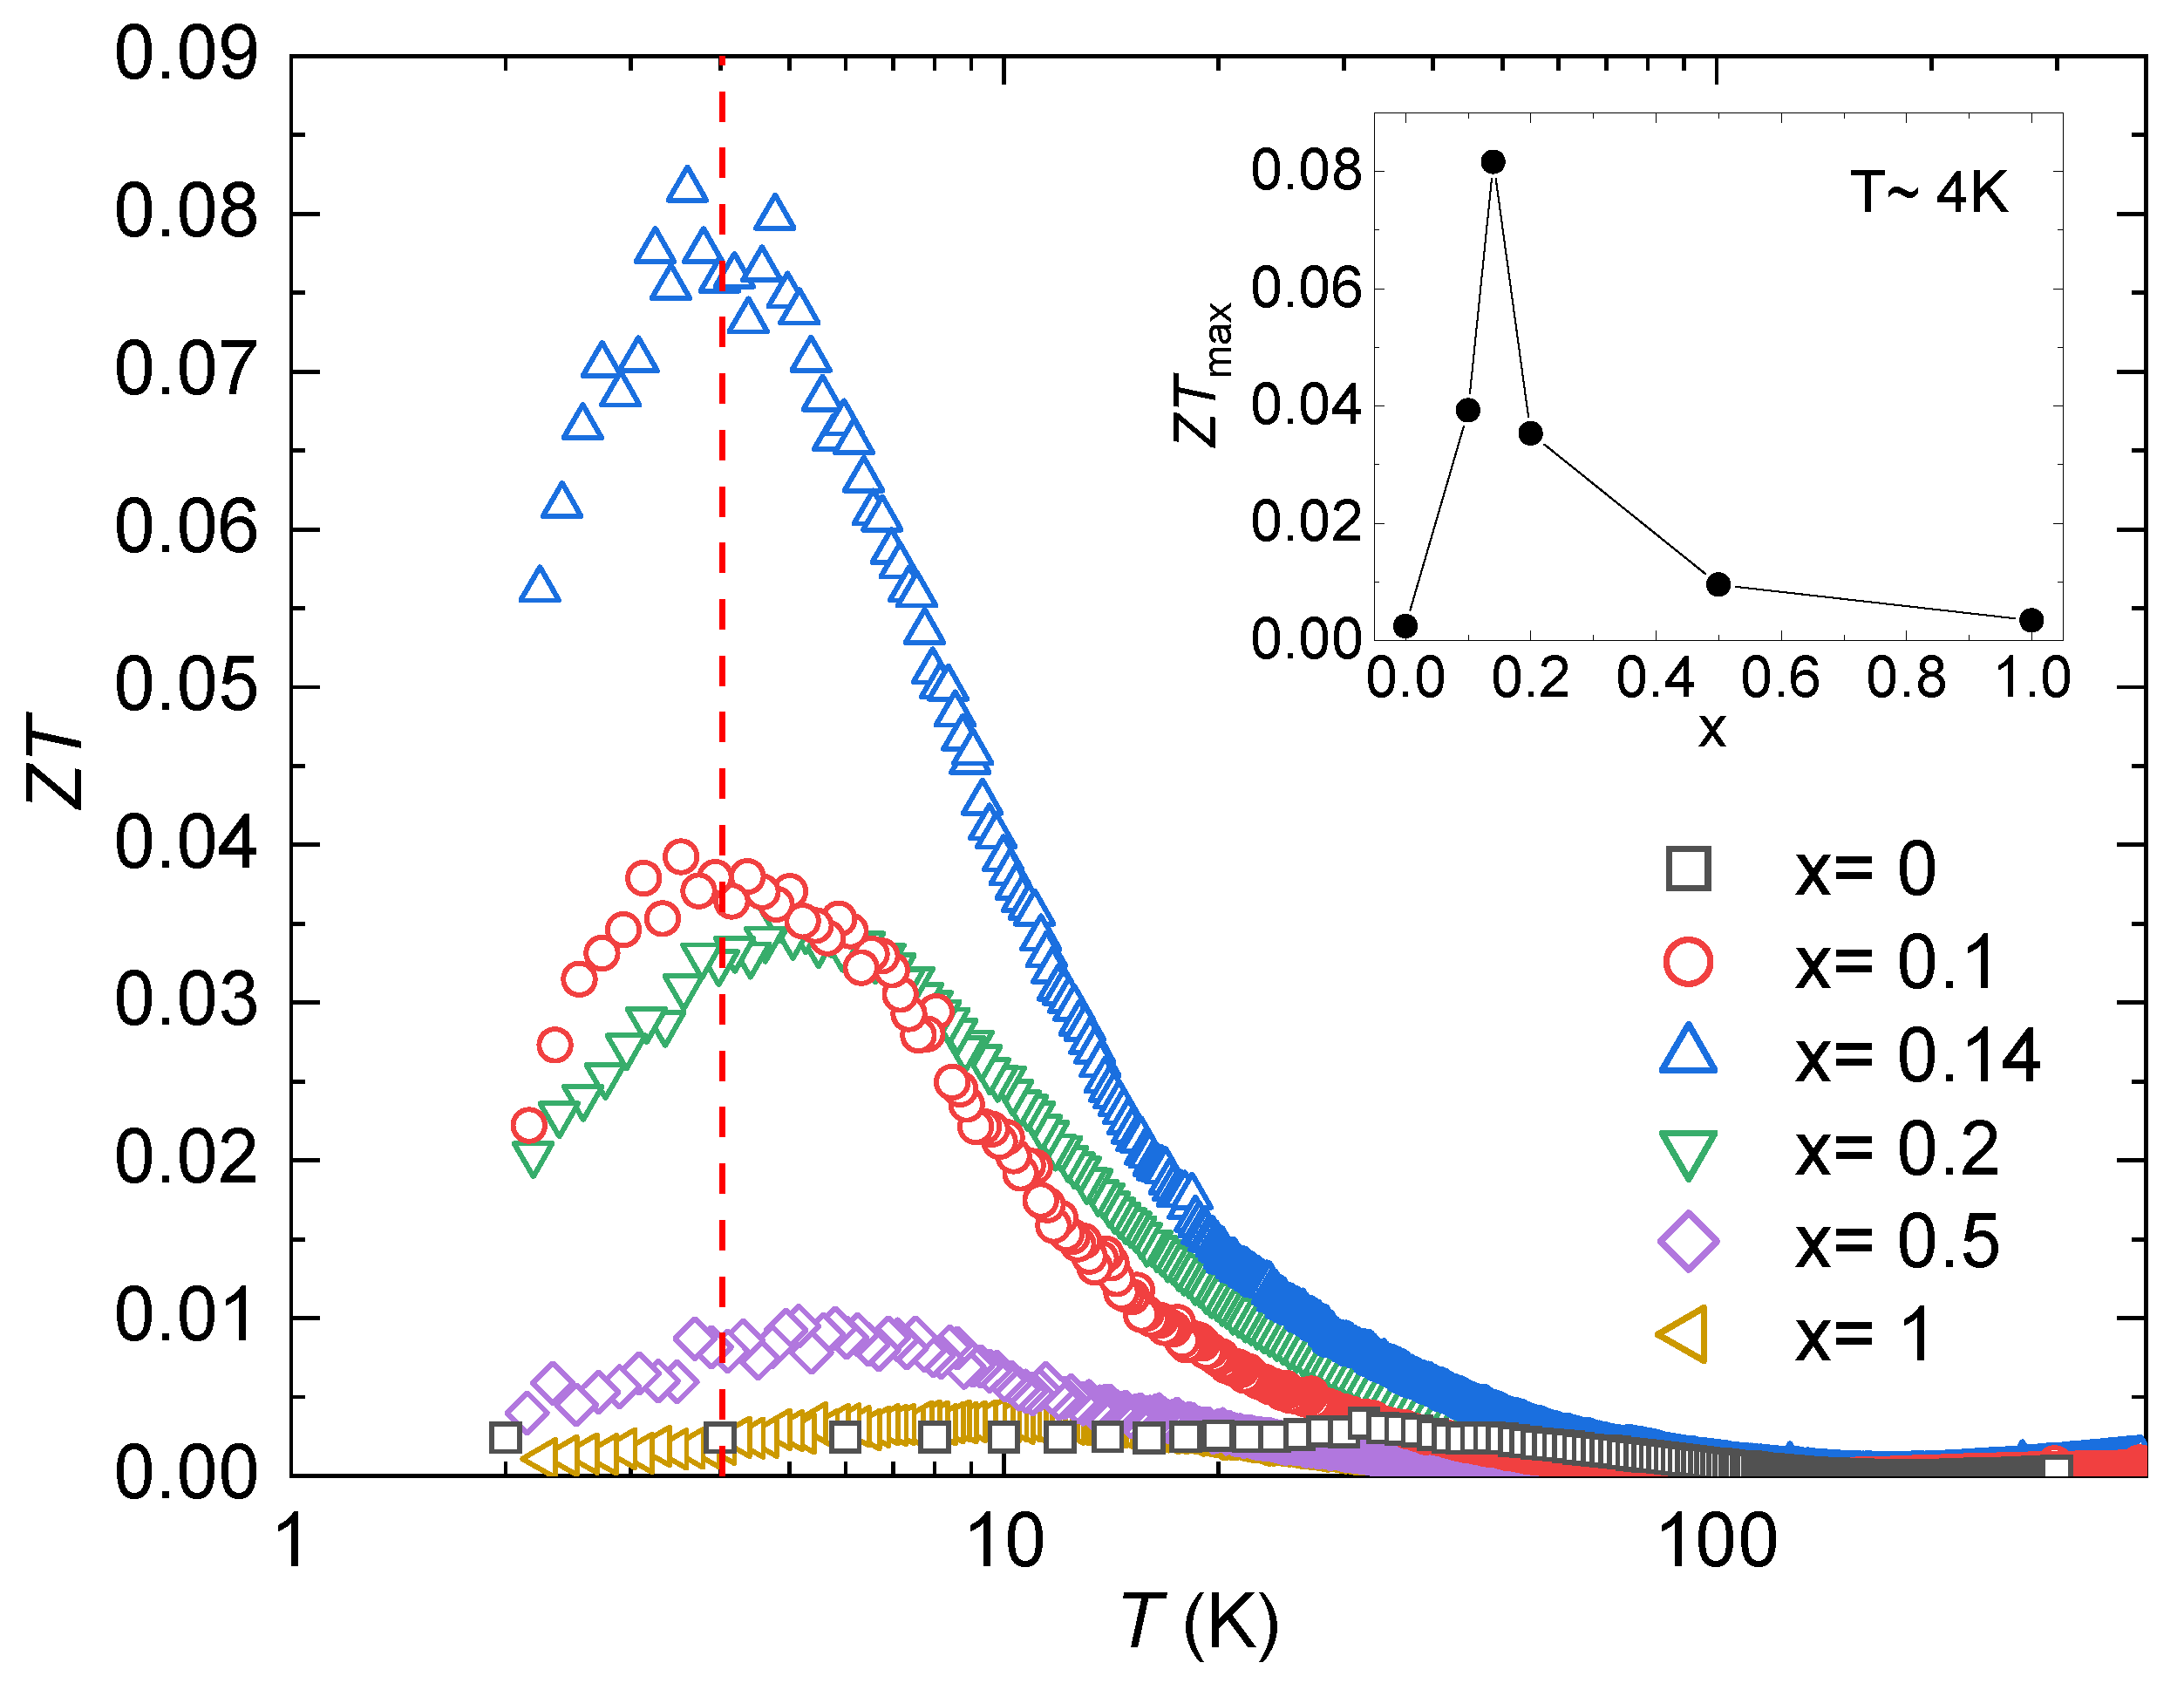
Figure 6 shows the dimensionless figure of merit, . Similar to S, all the samples present a peak at K, and an optimum Ni concentration can be observed (see inset in Figure 6). The values of the peaks are also listed in Table 1. The specimen that presents the highest value is YbCo1.86Ni0.14Zn20, with a maximum value of at 3.6 K. This value represents a remarkable enhancement compared to the parent compound YbCo2Zn20 with at 4 K and the highest value of at 35 K. Compared to the Ir analogs, it also represents an important improvement in since the highest reported value is 0.076 at 18.63 K for [33].
3.3. Magnetic and Heat Capacity Properties
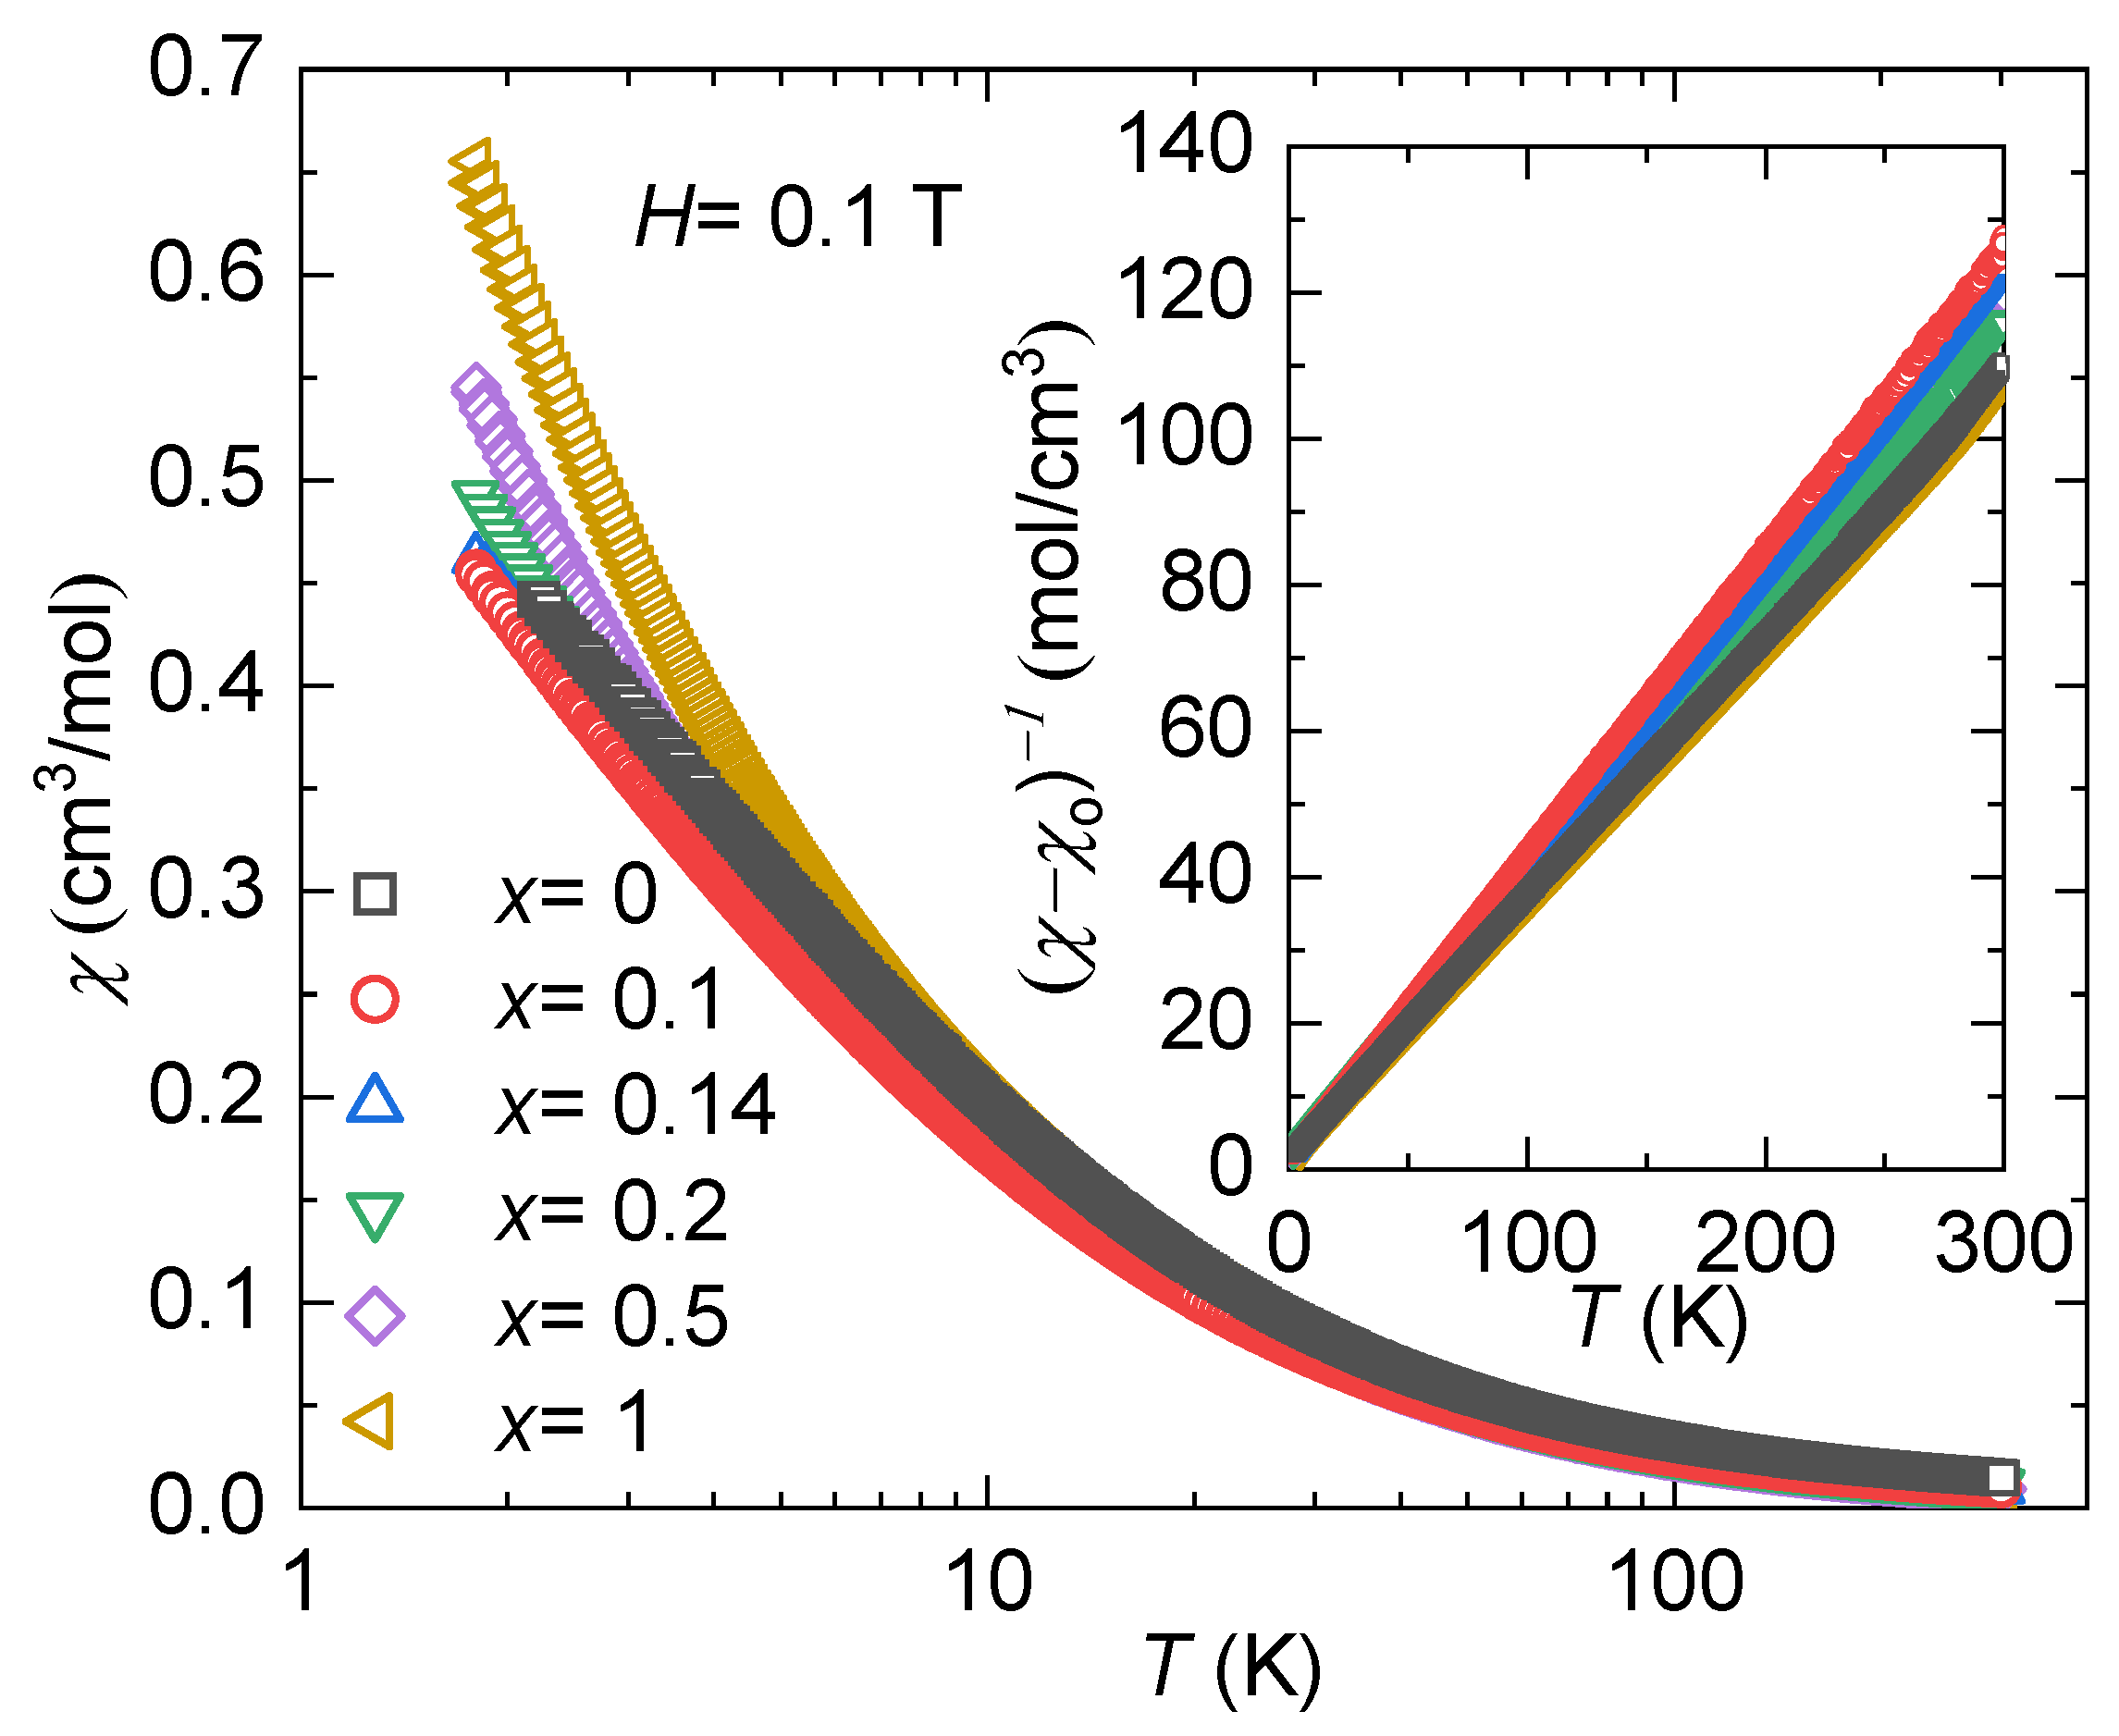
Introducing Ni into the system is a natural way to adjust the carrier concentration since we are changing the number of electrons in the system. However, this type of doping can also affect the hybridization strength by altering the interactions between the conduction electrons and the f-electrons from the Yb. To investigate this effect, temperature-dependent magnetic susceptibility was measured from 1.8 K to 300 K with an applied magnetic field of H = 0.1 T. Figure 7 shows the magnetic susceptibility, , for all specimens for 1.8 K < T < 300 K. At the base temperature, the strength of the magnetic exchange interaction follows the doping series. The inset in Figure 7 shows the inverse of the magnetic susceptibility (), where a temperature-independent contribution to the susceptibility, , is considered. This additional term could have originated from the sample holder core diamagnetism, Pauli paramagnetism, or van Vleck paramagnetism [54,55,56]. Table 1 shows the values used for all the samples. By taking this behavior into account, a modified form of the Curie–Weiss law (Equation (2)) is applied to fit the data at high temperatures (200 K < T < 300 K).
where C represents the Curie constant and represents the Curie–Weiss temperature. The Curie constant, C, correlates directly with the number of unpaired electrons, and it enables the calculation of the effective magnetic moment per ion, measured in units of Bohr magnetons, , through the expression , where n represents the number of magnetic elements per formula unit [57]. Table 1 shows the values of and for all the samples. It is seen that the values of are in agreement with the Hund’s rules moment of for Yb3+, with expected experimental values between 4.4 and 4.9 [58]. This indicates that the Yb remains trivalent for all substitutions. Regarding , the parent compound indicates ferromagnetic interactions, and adding a small amount of Ni () switches it to antiferromagnetic interactions. However, for and , , implying that the molecular field aligns again with the external field, similar to the parent compound. It is crucial to emphasize that in the majority of rare-earth magnets, tends to overestimate the interaction strength. This occurs because high-temperature fittings incorporate contributions from thermally populated crystal field levels, which are absent at the lower temperatures where interactions become significant [59].
Measurements of heat capacity (shown in Figure 8) offer additional understanding regarding the development of electronic hybridization and lattice behavior. For this purpose, the heat capacity data were fitted using a modified lattice-Debye model, where the electronic contribution is included, as expressed in Equation (3) [60]:
where , is the Debye frequency, ℏ is the Planck’s constant, is the Boltzmann constant, is the Debye temperature, represents the Sommerfeld coefficient, and is a constant containing the number of oscillators and degrees of freedom.
The electronic contribution to the heat capacity, denoted by , exhibits enhancement between and , followed by a subsequent decrease in value for higher concentrations of Ni (refer to Table 1). This suggests that the effective mass of the system is only enhanced for light doping. The contributions from the lattice dynamics to can be elucidated through , also provided in Table 1. It is notable that shows insensitivity to doping, maintaining an approximate overall value of K across all specimens, which aligns well with previously reported values for similar compounds [32,33].
3.4. Hall Effect
The doping range where displays enhancement coincides with improvements in S and . To delve deeper into this relationship, Hall-effect measurements and analysis were conducted to gain insight into the impact of the charge carrier density on the system and its role in enhancing . To obtain the density of the charge carriers, n, the voltage across a sample (Hall voltage ) with thickness t is measured, which is related to the current and the magnetic field through Equation (4), as follows [61]:
where q is the elementary charge in coulombs. Figure 9 illustrates the charge carrier concentration (n) for all specimens (black squares), with open symbols representing hole-dominant and filled symbols representing electron-dominant. Notably, it can be observed that n follows the doping series and saturates at . Additionally, there appears to be a competitive balance between electrons and holes across the specimens since for , the majority of the charge carriers are holes despite the introduction of more electrons into the system through the addition of Ni. Furthermore, these findings underscore the sensitivity of the system, particularly its thermoelectric properties, to Ni doping. It highlights the tunability of key thermoelectric parameters (, S, and ) through the strategic introduction of Ni as a dopant. Figure 9 also illustrates the relationship between (red circles) and n for comparative analysis, revealing a discernible correlation between the two variables. Remarkably, both variables exhibit critical points within the range of to , with tendencies toward saturation observed for .
Through Hall-effect measurements, our analysis of the electrical resistivity and Seebeck coefficient data unveils that the optimal charge carrier concentration for this material to attain its peak thermoelectric performance is approximately . Regarding heat capacity, we observe a subtle influence of Ni doping on the average lattice behavior, while the electronic contribution to heat capacity indicates an improvement of the Sommerfeld coefficient () within the same region where enhancements in the Seebeck coefficient (S) and the figure of merit () are observed (0.1 < x < 0.2). The Hall-effect data further highlight the correlation between optimizing the density of the charge carriers and achieving better thermoelectric properties. More specifically, there is a clear correlation between and , where the doping concentrations characterized with lower n values exhibit higher values, and vice versa (Figure 9).
4. Conclusions
We examined the effect of Ni doping on the thermoelectric properties of YbCo2Zn20 by synthesizing single crystals of Zn20 using the molten flux growth method. A thorough investigation was conducted on the electrical, magnetic, thermal, and thermoelectric properties of all six specimens. Our findings collectively suggest the potential for enhancing the thermoelectric properties of YbCo2Zn20 ( at 35 K) through slight Ni doping. Notably, the specimen YbCo1.86Ni0.14Zn20 exhibits the highest , reaching a value of 0.082 at 3.6 K. We want to emphasize that substituting just 7% Ni on the Co site significantly elevates , rendering it comparable to that of YbIr2Zn20, which is the specimen that presents the highest value of the figure of merit ( at 35 K) among the heavy-fermion compounds YbZn20 (T = Co, Rh, Ir) [32]. Additionally, the highest value of achieved in this study is above the reported value of ( = 0.076 at 18.63 K) [33], which has been reported to be the second-best thermoelectric material at T< 50 K among all known materials, trailing only behind the state-of-the-art solid solutions with 0.15 at 35 K [34,35]. These results underscore the feasibility of utilizing these low-temperature thermoelectric materials in practical device fabrication. One particularly promising application lies in cryogenic cooling, traditionally reliant on liquid nitrogen, which necessitates frequent and costly refilling. In contrast, leveraging thermoelectric coolers offers a compelling alternative, promising reduced costs and maintenance requirements [62,63]. This highlights a tangible advantage in transitioning toward thermoelectric-based solutions for cryogenic cooling applications.
Author Contributions
J.R.G.-C.: methodology, formal analysis, visualization, investigation, and writing—original draft preparation; B.S.: investigation and writing—review and editing; O.O.: methodology and visualization; K.F.: methodology and writing—review and editing; J.C.O.: supervision, writing—review and editing; R.E.B.: formal analysis, resources, and writing—review and editing; K.W.: conceptualization, methodology, supervision, resources, writing—review and editing, and funding acquisition. All authors have read and agreed to the published version of the manuscript.
Funding
This work was performed at the National High Magnetic Field Laboratory (NHMFL), which is supported by National Science Foundation Cooperative Agreement No. DMR-1644779, DMR-2128556, and the State of Florida. B.S. and K.W. acknowledge the support of the NHMFL User Collaboration Grant Program (UCGP).
Data Availability Statement
Data are contained within the article.
Conflicts of Interest
The authors declare no conflicts of interest.
References
- Galeano-Cabral, J.R.; Porto-Hernandez, L.; Vargas, J.; Ordonez, J. Exergetic Optimization of an Integrated Municipal Solid Waste Incinerator and Wastewater Treatment Plant. Int. J. Energy Clean Environ. 2022, 23, 95–108. [Google Scholar] [CrossRef]
- Porto-Hernandez, L.; Vargas, J.; Munoz, M.; Galeano-Cabral, J.; Ordonez, J.; Balmant, W.; Mariano, A. Fundamental optimization of steam Rankine cycle power plants. Energy Convers. Manag. 2023, 289, 117148. [Google Scholar] [CrossRef]
- Hsu, C.T.; Huang, G.Y.; Chu, H.S.; Yu, B.; Yao, D.J. Experiments and simulations on low-temperature waste heat harvesting system by thermoelectric power generators. Appl. Energy 2011, 88, 1291–1297. [Google Scholar] [CrossRef]
- Kumar, S.; Heister, S.D.; Xu, X.; Salvador, J.R. Optimization of thermoelectric components for automobile waste heat recovery systems. J. Electron. Mater. 2015, 44, 3627–3636. [Google Scholar] [CrossRef]
- Saqr, K.M.; Mansour, M.K.; Musa, M. Thermal design of automobile exhaust based thermoelectric generators: Objectives and challenges. Int. J. Automot. Technol. 2008, 9, 155–160. [Google Scholar] [CrossRef]
- Chein, R.; Huang, G. Thermoelectric cooler application in electronic cooling. Appl. Therm. Eng. 2004, 24, 2207–2217. [Google Scholar] [CrossRef]
- Simons, R.; Chu, R. Application of thermoelectric cooling to electronic equipment: A review and analysis. In Proceedings of the Sixteenth Annual IEEE Semiconductor Thermal Measurement and Management Symposium (Cat. No. 00CH37068), San Jose, CA, USA, 23 March 2000; pp. 1–9. [Google Scholar]
- Wang, P.; Bar-Cohen, A. On-chip hot spot cooling using silicon thermoelectric microcoolers. J. Appl. Phys. 2007, 102, 034503. [Google Scholar] [CrossRef]
- Hasan, M.N.; Nafea, M.; Nayan, N.; Mohamed Ali, M.S. Thermoelectric generator: Materials and applications in wearable health monitoring sensors and internet of things devices. Adv. Mater. Technol. 2022, 7, 2101203. [Google Scholar] [CrossRef]
- Parás-Hernández, F.; Fabián-Mijangos, A.; Cardona-Castro, M.; Alvarez-Quintana, J. Enhanced performance nanostructured thermoelectric converter for self-powering health sensors. Nano Energy 2020, 74, 104854. [Google Scholar] [CrossRef]
- Rowe, D. Applications of nuclear-powered thermoelectric generators in space. Appl. Energy 1991, 40, 241–271. [Google Scholar] [CrossRef]
- Dai, Z.; Wang, C.; Zhang, D.; Tian, W.; Qiu, S.; Su, G. Thermoelectric characteristics analysis of thermionic space nuclear power reactor. Int. J. Energy Res. 2020, 44, 855–868. [Google Scholar] [CrossRef]
- Ordonez, J.C.; Ordonez, C. Thermoelectric insulation for cold temperature vaccine storage. In Proceedings of the 2021 IEEE Conference on Technologies for Sustainability (SusTech), Virtual, 22–24 April 2021; pp. 1–5. [Google Scholar]
- Ohara, B.; Sitar, R.; Soares, J.; Novisoff, P.; Nunez-Perez, A.; Lee, H. Optimization strategies for a portable thermoelectric vaccine refrigeration system in developing communities. J. Electron. Mater. 2015, 44, 1614–1626. [Google Scholar] [CrossRef]
- Mahan, G.; Sofo, J. The best thermoelectric. Proc. Natl. Acad. Sci. USA 1996, 93, 7436–7439. [Google Scholar] [CrossRef] [PubMed]
- Nolas, G.S.; Sharp, J.; Goldsmid, J. Thermoelectrics: Basic Principles and New Materials Developments; Springer Science & Business Media: Berlin/Heidelberg, Germany, 2001; Volume 45. [Google Scholar]
- Morelli, D.T. Thermoelectric materials. In Springer Handbook of Electronic and Photonic Materials; Kasap, S., Capper, P., Eds.; Springer: Berlin/Heidelberg, Germany, 2017; p. 1. [Google Scholar]
- Chaikin, P. An introduction to thermopower for those who might want to use it to study organic conductors and superconductors. In Organic Superconductivity; Springer: Berlin/Heidelberg, Germany, 1990; pp. 101–115. [Google Scholar]
- Tritt, T. Thermoelectric materials: Principles, structure, properties, and applications. In Encyclopedia of Materials: Science and Technology; Elsevier: Amsterdam, The Netherlands, 2002; pp. 1–11. [Google Scholar]
- Bauer, E. Kondo Systems and Heavy Fermions: Transport Phenomena. In Encyclopedia of Materials: Science and Technology; Elsevier: Amsterdam, The Netherlands, 2001; pp. 4372–4381. [Google Scholar]
- Kittel, C.; McEuen, P.; McEuen, P. Introduction to Solid State Physics; Wiley: New York, NY, USA, 1996; Volume 8. [Google Scholar]
- Nowotny, H.; Gratz, E. Boltzmann Equation and Scattering Mechanisms. In Encyclopedia of Materials: Science and Technology; Elsevier: Amsterdam, The Netherlands, 2001. [Google Scholar]
- Snyder, G.J.; Toberer, E.S. Complex thermoelectric materials. Nat. Mater. 2008, 7, 105–114. [Google Scholar] [CrossRef] [PubMed]
- Ning, Y.T.; Zhou, X.M.; Zhen, Y.; Chen, N.Y.; Xu, H.; Zhu, J.Z. The prediction and synthesis of some new intermetallic compounds between transition metals and rare earth metals. J. Less Common Met. 1989, 147, 167–173. [Google Scholar] [CrossRef]
- Brooks, M.; Nordström, L.; Johansson, B. Rare-earth transition-metal intermetallics. Phys. B Condens. Matter 1991, 172, 95–100. [Google Scholar] [CrossRef]
- Gignoux, D.; Schmitt, D. Rare earth intermetallics. J. Magn. Magn. Mater. 1991, 100, 99–125. [Google Scholar] [CrossRef]
- Ahmad, S.; Ahmad, R.; Ahmad, I. Physical properties and possible applications of gold-based rare earth intermetallics (R-Au): A review. J. Magn. Magn. Mater. 2019, 490, 165477. [Google Scholar] [CrossRef]
- Zada, Z.; Khan, J.; Khan, A.A.; Reshak, A.H.; Ali, D.; Rehman, F.U.; Urrahman, I.; Saqib, M.; Irfan, M.; Ramli, M.M. Structural, Thermoelectric, Electronic, and Magnetic Properties of Pristine Intermetallic Rare-Earth-Based XMn2Si2 (X= Dy, Er) Compounds. ECS J. Solid State Sci. Technol. 2023, 12, 043012. [Google Scholar] [CrossRef]
- Pawar, H.; Aynyas, M.; Sanyal, S.P. Thermoelectric properties of rare-earth based RENi2 (RE= Dy, Ho and Er) Laves phase compounds. J. Magn. Magn. Mater. 2018, 468, 123–131. [Google Scholar] [CrossRef]
- Nasch, T.; Jeitschko, W.; Rodewald, U.C. Ternary rare earth transition metal zinc compounds RT2Zn20 with T= Fe, Ru, Co, Rh, and Ni. Z. Naturforsch. B 1997, 52, 1023–1030. [Google Scholar] [CrossRef]
- Mun, E.; Jia, S.; Bud’ko, S.L.; Canfield, P.C. Thermoelectric power of the YbT2Zn20 (T= Fe, Ru, Os, Ir, Rh, and Co) heavy fermions. Phys. Rev. B 2012, 86, 115110. [Google Scholar] [CrossRef]
- Wei, K.; Neu, J.N.; Lai, Y.; Chen, K.W.; Hobbis, D.; Nolas, G.S.; Graf, D.E.; Siegrist, T.; Baumbach, R.E. Enhanced thermoelectric performance of heavy-fermion compounds YbTM2Zn20 (TM= Co, Rh, Ir) at low temperatures. Sci. Adv. 2019, 5, eaaw6183. [Google Scholar] [CrossRef] [PubMed]
- Galeano-Cabral, J.R.; Karr, E.; Schundelmier, B.; Oladehin, O.; Choi, E.S.; Siegrist, T.; Ordonez, J.; Shastri, S.; Petkov, V.; Baumbach, R.E.; et al. Enhanced thermoelectric properties of heavy-fermion compounds YbxCeySmzIr2Zn20 (x + y + z = 1). Phys. Rev. Mater. 2023, 7, 025406. [Google Scholar] [CrossRef]
- Lenoir, B.; Cassart, M.; Michenaud, J.P.; Scherrer, H.; Scherrer, S. Transport properties of Bi-rich Bi-Sb alloys. J. Phys. Chem. Solids 1996, 57, 89–99. [Google Scholar] [CrossRef]
- Doroshenko, A.; Rogacheva, E.; Drozdova, A.; Martynova, K.; Men’shov, Y.V. Thermoelectric properties of polycrystalline Bi1−xSbx solid solutions in the concentration range x= 0–0.25. J. Thermoelectr. 2016, 4, 23–36. [Google Scholar]
- Saleemi, M.; Tafti, M.Y.; Jacquot, A.; Jägle, M.; Johnsson, M.; Toprak, M.S. Chemical synthesis of iron antimonide (FeSb2) and its thermoelectric properties. Inorg. Chem. 2016, 55, 1831–1836. [Google Scholar] [CrossRef] [PubMed]
- Chung, D.Y.; Hogan, T.P.; Rocci-Lane, M.; Brazis, P.; Ireland, J.R.; Kannewurf, C.R.; Bastea, M.; Uher, C.; Kanatzidis, M.G. A new thermoelectric material: CsBi4Te6. J. Am. Chem. Soc. 2004, 126, 6414–6428. [Google Scholar] [CrossRef]
- Rowe, D.; Kuznetsov, V.; Kuznetsova, L.; Min, G. Electrical and thermal transport properties of intermediate-valence YbAl3. J. Phys. D Appl. Phys. 2002, 35, 2183. [Google Scholar] [CrossRef]
- Greenwood, N.N.; Earnshaw, A. Chemistry of the Elements; Elsevier: Amsterdam, The Netherlands, 2012. [Google Scholar]
- US Geological Survey (USGS). Mineral Commodity Summaries 2020; US Geological Survey: Reston, VA, USA, 2020. [Google Scholar]
- Van den Brink, S.; Kleijn, R.; Sprecher, B.; Tukker, A. Identifying supply risks by mapping the cobalt supply chain. Resour. Conserv. Recycl. 2020, 156, 104743. [Google Scholar] [CrossRef]
- Al-Omari, I.; Skomski, R.; Thomas, R.; Leslie-Pelecky, D.; Sellmyer, D.J. High-temperature magnetic properties of mechanically alloyed SmCo5 and YCo5 magnets. IEEE Trans. Magn. 2001, 37, 2534–2536. [Google Scholar] [CrossRef]
- Torikachvili, M.; Jia, S.; Mun, E.; Hannahs, S.; Black, R.; Neils, W.; Martien, D.; Bud’Ko, S.; Canfield, P. Six closely related YbT2Zn20 (T= Fe, Co, Ru, Rh, Os, Ir) heavy fermion compounds with large local moment degeneracy. Proc. Natl. Acad. Sci. USA 2007, 104, 9960–9963. [Google Scholar] [CrossRef] [PubMed]
- Canfield, P.C.; Kong, T.; Kaluarachchi, U.S.; Jo, N.H. Use of frit-disc crucibles for routine and exploratory solution growth of single crystalline samples. Philos. Mag. Lett. 2016, 96, 84–92. [Google Scholar] [CrossRef]
- Florida State University. FSU: Biological Science Imaging Resource. Available online: https://bsir.bio.fsu.edu/fei-nova-400-nanosem (accessed on 12 April 2024).
- Swatek, P.; Daszkiewicz, M.; Kaczorowski, D. Crystal structure of the new compound UOs2Zn20. J. Alloys Compd. 2014, 586, 754–756. [Google Scholar] [CrossRef]
- Nakanishi, Y.; Fujino, T.; Ito, K.; Nakamura, M.; Yoshizawa, M.; Saiga, Y.; Kosaka, M.; Uwatoko, Y. Elastic constants of the single crystalline Yb based heavy-fermion compound YbCo2Zn20. Phys. Rev. B 2009, 80, 184418. [Google Scholar] [CrossRef]
- Burnett, V.; Yazici, D.; White, B.; Dilley, N.; Friedman, A.; Brandom, B.; Maple, M. Structure and physical properties of RT2Cd20 (R= rare earth, T= Ni, Pd) compounds with the CeCr2Al20-type structure. J. Solid State Chem. 2014, 215, 114–121. [Google Scholar] [CrossRef]
- Niemann, S.; Jeitschko, W. Ternary aluminides AT2Al20 (A= rare earth elements and uranium; T= Ti, Nb, Ta, Mo, and W) with CeCr2Al20-type structure. J. Solid State Chem. 1995, 114, 337–341. [Google Scholar] [CrossRef]
- Slater, J.C. Atomic radii in crystals. J. Chem. Phys. 1964, 41, 3199–3204. [Google Scholar] [CrossRef]
- Jang, S.; Denlinger, J.; Allen, J.; Zapf, V.; Maple, M.; Kim, J.N.; Jang, B.G.; Shim, J.H. Evolution of the Kondo lattice electronic structure above the transport coherence temperature. Proc. Natl. Acad. Sci. USA 2020, 117, 23467–23476. [Google Scholar] [CrossRef] [PubMed]
- Lavagna, M.; Lacroix, C.; Cyrot, M. Resistivity of the Kondo lattice. J. Phys. F Met. Phys. 1982, 12, 745. [Google Scholar] [CrossRef]
- Yang, Y.f.; Fisk, Z.; Lee, H.O.; Thompson, J.; Pines, D. Scaling the Kondo lattice. Nature 2008, 454, 611–613. [Google Scholar] [CrossRef] [PubMed]
- Mugiraneza, S.; Hallas, A.M. Tutorial: A beginner’s guide to interpreting magnetic susceptibility data with the Curie-Weiss law. Commun. Phys. 2022, 5, 95. [Google Scholar] [CrossRef]
- Batyev, E.G. Pauli paramagnetism and Landau diamagnetism. Physics-Uspekhi 2009, 52, 1245. [Google Scholar] [CrossRef]
- Van Den Handel, J. Paramagnetism. In Advances in Electronics and Electron Physics; Elsevier: Amsterdam, The Netherlands, 1954; Volume 6, pp. 463–518. [Google Scholar]
- Kittel, C. Introduction to Solid State Physics, 8th ed.; John Wiley & Sons: Hoboken, NJ. USA, 2004. [Google Scholar]
- Dalal, M. A Textbook of Inorganic Chemistry; Dalal Institute: Rohtak, India, 2017; Volume 1. [Google Scholar]
- Mitric, M.; Antic, B.; Balanda, M.; Rodic, D.; Napijalo, M.L. An X-ray diffraction and magnetic susceptibility study of YbxY2−xO3. J. Phys. Condens. Matter 1997, 9, 4103. [Google Scholar] [CrossRef]
- Besara, T.; Ramirez, D.; Sun, J.; Whalen, J.; Tokumoto, T.; McGill, S.; Singh, D.; Siegrist, T. Ba2TeO: A new layered oxytelluride. J. Solid State Chem. 2015, 222, 60–65. [Google Scholar] [CrossRef]
- Pengra, D.; Stoltenberg, J.; Van Dyck, R.; Vilches, O. The Hall Effect (Updated 19 June 2015). University of Washington. Available online: https://courses.washington.edu/phys431/hall_effect/hall_effect.pdf (accessed on 17 March 2024).
- Goswami, A.; Kanetkar, S. Thermoelectrics in cryogenic cooling. In Proceedings of the 2020 IEEE 22nd Electronics Packaging Technology Conference (EPTC), Singapore, 2–4 December 2020; pp. 355–358. [Google Scholar]
- Sidorenko, N.; Dashevsky, Z. Cryogenic thermoelectric cooler for operating temperatures below 90 K. Semiconductors 2019, 53, 752–755. [Google Scholar] [CrossRef]
Figure 1.
A single crystal of YbCo1.86Ni0.14Zn20 synthesized using the flux growth method.

Figure 2.
EDS spectrum of (a) x = 0.1, (b) x = 0.14, (c) x = 0.2, (d) x = 0.5, and (e) x = 1 for Zn20. The insets show the elemental mapping of Ni as an example and the atomic percentages of all elements detected in the selected spectrum.
Figure 2.
EDS spectrum of (a) x = 0.1, (b) x = 0.14, (c) x = 0.2, (d) x = 0.5, and (e) x = 1 for Zn20. The insets show the elemental mapping of Ni as an example and the atomic percentages of all elements detected in the selected spectrum.

Figure 3.
(a) X-ray diffraction peaks and (b) zoomed-in view of the highest intensity peak for Zn20. The data were obtained through powder X-ray diffraction. Miller indices are included for reference.
Figure 3.
(a) X-ray diffraction peaks and (b) zoomed-in view of the highest intensity peak for Zn20. The data were obtained through powder X-ray diffraction. Miller indices are included for reference.
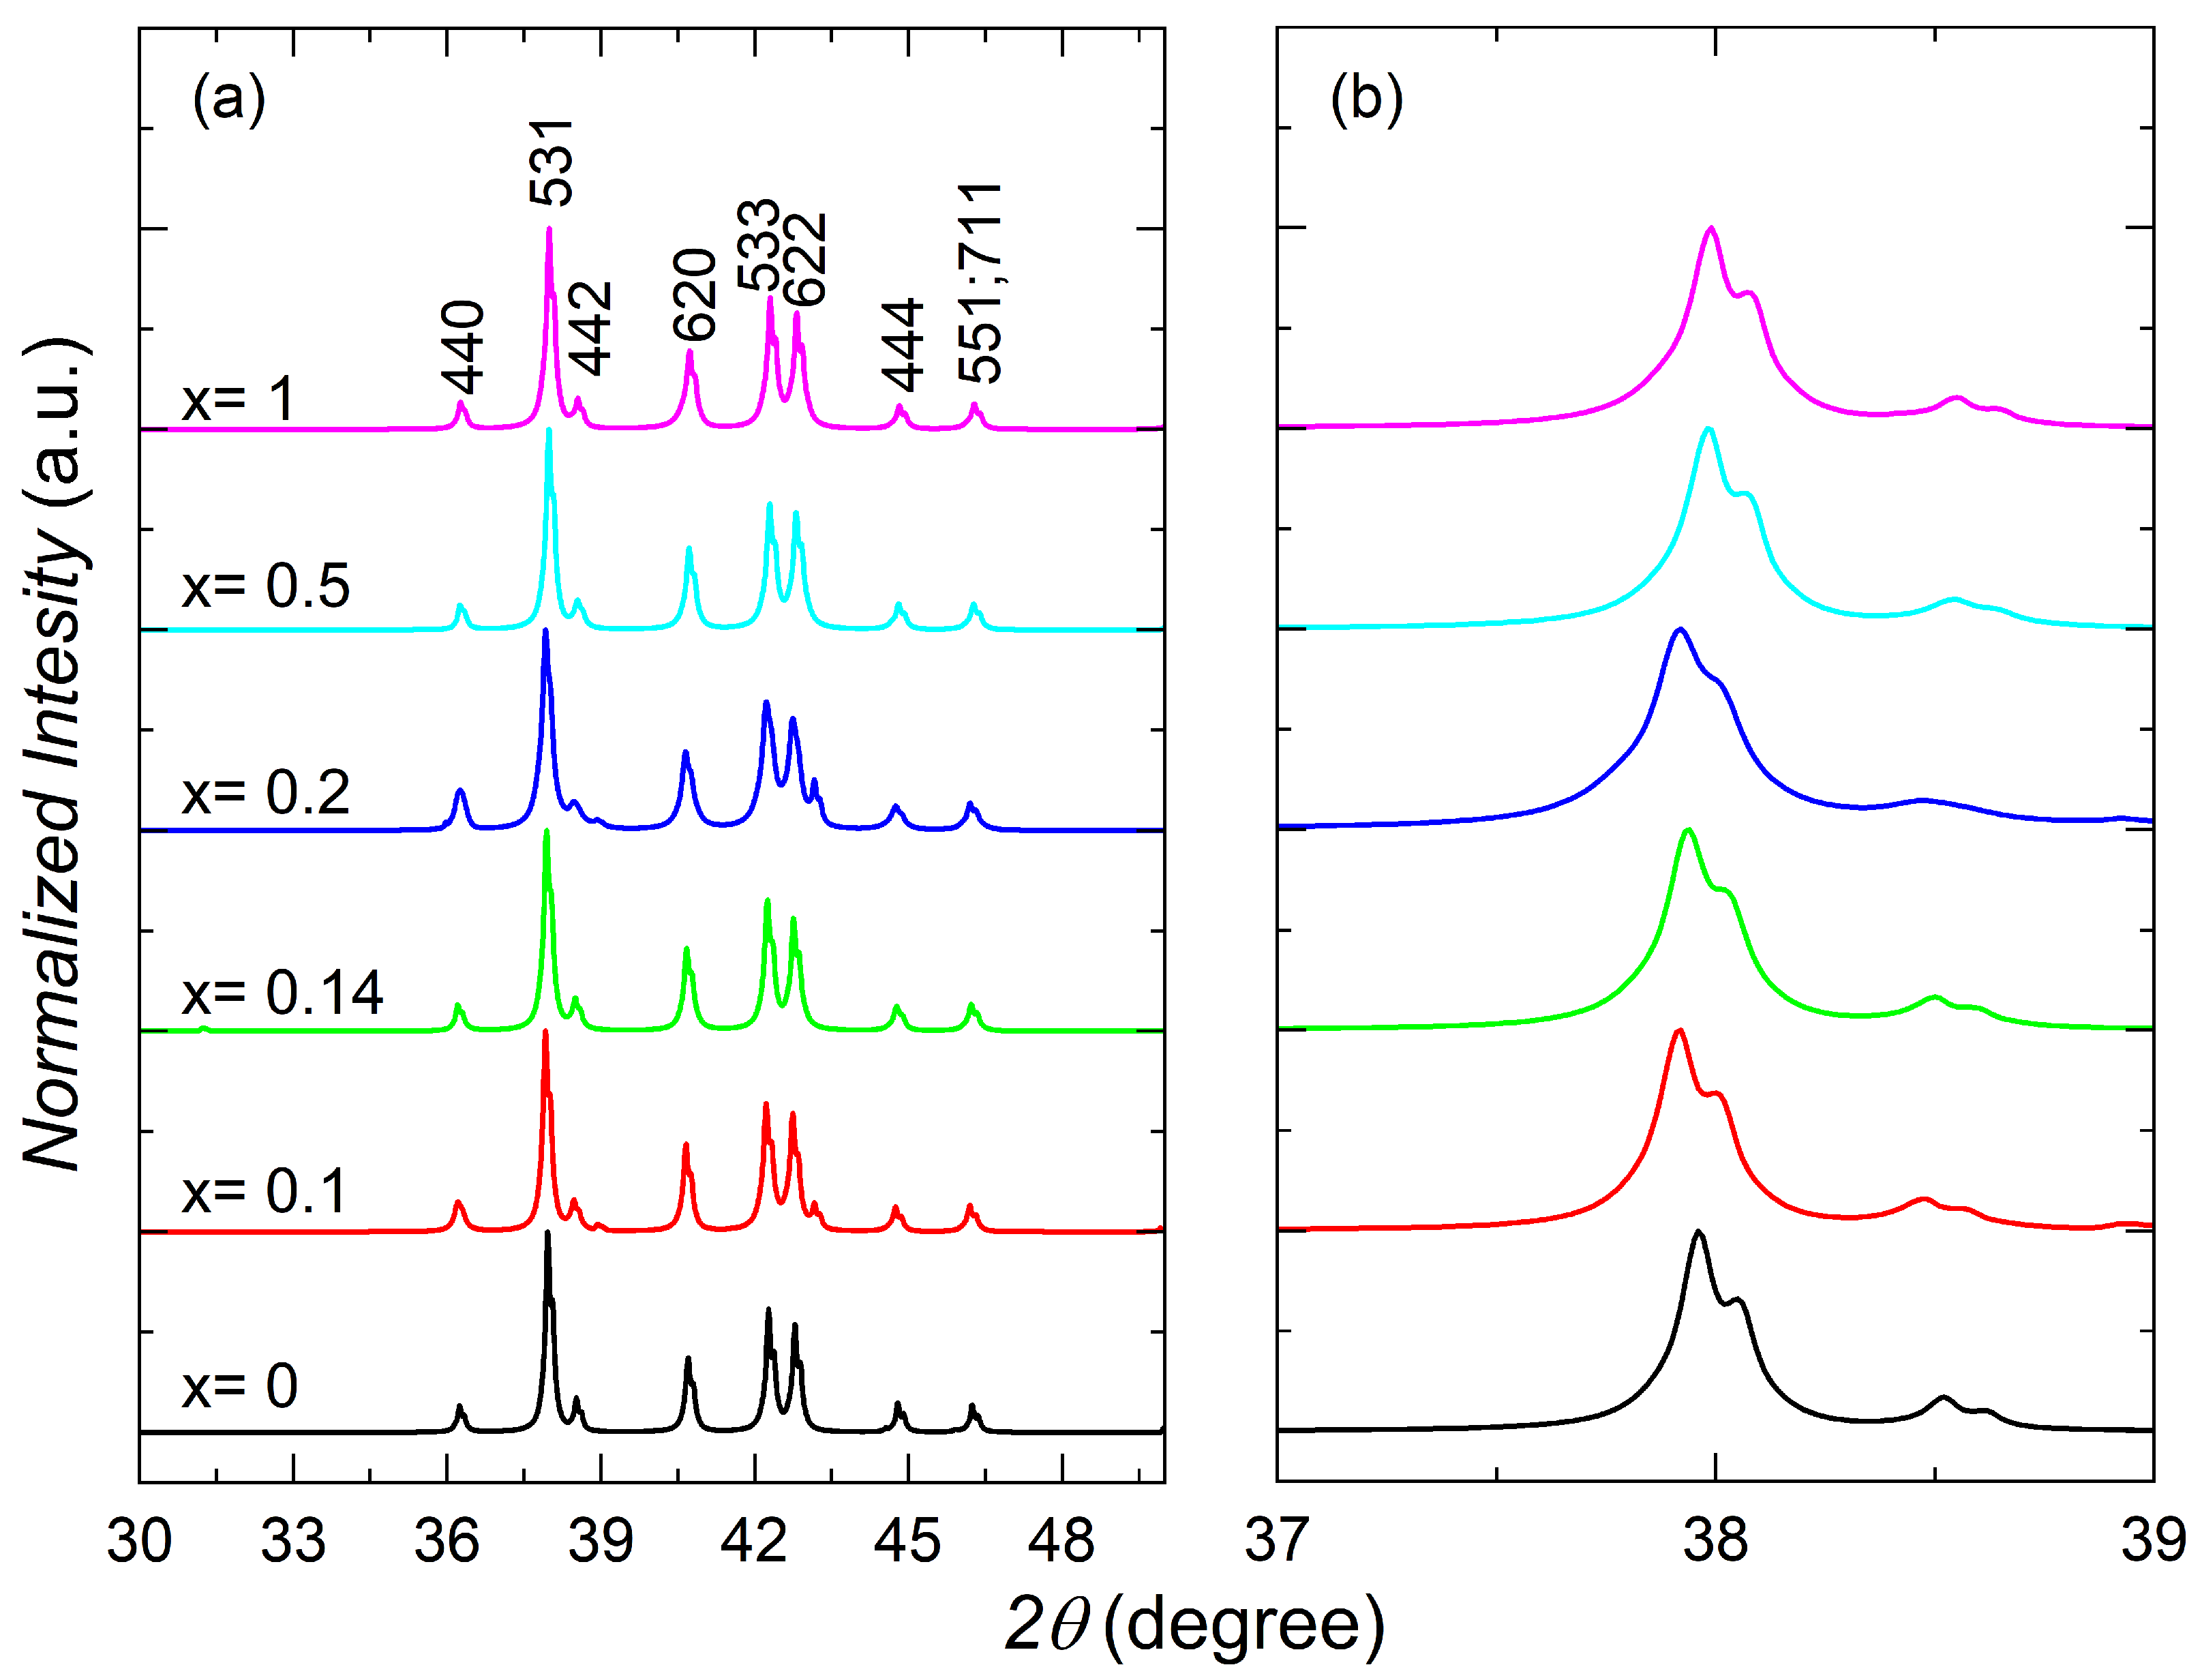
Figure 4.
(a) Temperature-dependent electrical resistivity, , and (b) thermal conductivity, , for Zn20.
Figure 4.
(a) Temperature-dependent electrical resistivity, , and (b) thermal conductivity, , for Zn20.

Figure 5.
Seebeck coefficient, , for Zn20. The dashed red line indicates K. The inset shows the absolute value of the Seebeck coefficient’s minima as a function of Ni concentration. Note a logarithmic temperature scale.
Figure 5.
Seebeck coefficient, , for Zn20. The dashed red line indicates K. The inset shows the absolute value of the Seebeck coefficient’s minima as a function of Ni concentration. Note a logarithmic temperature scale.

Figure 6.
Dimensionless figure of merit, , for Zn20. The dashed red line indicates K. The inset shows the value of the figure of merit’s maxima as a function of the Ni concentration. Note the logarithmic temperature scale.
Figure 6.
Dimensionless figure of merit, , for Zn20. The dashed red line indicates K. The inset shows the value of the figure of merit’s maxima as a function of the Ni concentration. Note the logarithmic temperature scale.

Figure 7.
Temperature-dependent magnetic susceptibility, , with an applied magnetic field of H = 0.1 T for Zn20. The inset shows the inverse of the magnetic susceptibility, where an additional term is needed for the Curie–Weiss fit. Note the logarithmic temperature scale for .
Figure 7.
Temperature-dependent magnetic susceptibility, , with an applied magnetic field of H = 0.1 T for Zn20. The inset shows the inverse of the magnetic susceptibility, where an additional term is needed for the Curie–Weiss fit. Note the logarithmic temperature scale for .

Figure 8.
Temperature-dependent heat capacity, , for Zn20. The inset shows the low-temperature behavior as vs. T.
Figure 8.
Temperature-dependent heat capacity, , for Zn20. The inset shows the low-temperature behavior as vs. T.

Figure 9.
Black squares represent the density of the charge carriers n as a function of the Ni concentration x at a temperature of T= 1.9 K (left y-axis). The open symbol () represents holes as the majority of charge carriers, and the filled symbols (x = 0, 0.14, 0.2, 0.5, and 1) represent electrons as the majority of charge carriers. Red circles represent the Sommerfeld coefficient as a function of x (right y-axis).


Table 1.
Minimum resistivity values, , absolute value of the Seebeck coefficient minima, , dimensionless figure of merit maxima, , magnetization parameters from Curie–Weiss fit (, , and ), and fitting parameters for ( and ) of Zn20.
Table 1.
Minimum resistivity values, , absolute value of the Seebeck coefficient minima, , dimensionless figure of merit maxima, , magnetization parameters from Curie–Weiss fit (, , and ), and fitting parameters for ( and ) of Zn20.
| x | [cm] | [V/K] | [] | [] | [K] | [] | [K] | |
|---|---|---|---|---|---|---|---|---|
| 0 | 33.09 | 14.15 | 0.0024 | 0.005 | 4.63 | 4.60 | 348 | 244 |
| 0.1 | 30.48 | 43.35 | 0.0392 | 0.002 | 4.39 | −5.74 | 358 | 237 |
| 0.14 | 36.93 | 54.77 | 0.0816 | 0.001 | 4.40 | 1.05 | 334 | 243 |
| 0.2 | 35.23 | 39.72 | 0.0353 | 0.003 | 4.57 | −2.59 | 245 | 246 |
| 0.5 | 49.29 | 19.62 | 0.0095 | 0.001 | 4.55 | −9.34 | 267 | 244 |
| 1 | 49.17 | 13.41 | 0.0034 | 0.001 | 4.69 | 2.34 | 275 | 243 |
Disclaimer/Publisher’s Note: The statements, opinions and data contained in all publications are solely those of the individual author(s) and contributor(s) and not of MDPI and/or the editor(s). MDPI and/or the editor(s) disclaim responsibility for any injury to people or property resulting from any ideas, methods, instructions or products referred to in the content. |
© 2024 by the authors. Licensee MDPI, Basel, Switzerland. This article is an open access article distributed under the terms and conditions of the Creative Commons Attribution (CC BY) license (https://creativecommons.org/licenses/by/4.0/).
Share and Cite
MDPI and ACS Style
Galeano-Cabral, J.R.; Schundelmier, B.; Oladehin, O.; Feng, K.; Ordonez, J.C.; Baumbach, R.E.; Wei, K. Effect of Ni Doping on the Thermoelectric Properties of YbCo2Zn20. Materials 2024, 17, 1906. https://doi.org/10.3390/ma17081906
AMA Style
Galeano-Cabral JR, Schundelmier B, Oladehin O, Feng K, Ordonez JC, Baumbach RE, Wei K. Effect of Ni Doping on the Thermoelectric Properties of YbCo2Zn20. Materials. 2024; 17(8):1906. https://doi.org/10.3390/ma17081906
Chicago/Turabian StyleGaleano-Cabral, Jorge R., Benny Schundelmier, Olatunde Oladehin, Keke Feng, Juan C. Ordonez, Ryan E. Baumbach, and Kaya Wei. 2024. "Effect of Ni Doping on the Thermoelectric Properties of YbCo2Zn20" Materials 17, no. 8: 1906. https://doi.org/10.3390/ma17081906
Note that from the first issue of 2016, this journal uses article numbers instead of page numbers. See further details here.