2.1. Amorphous Ribbons
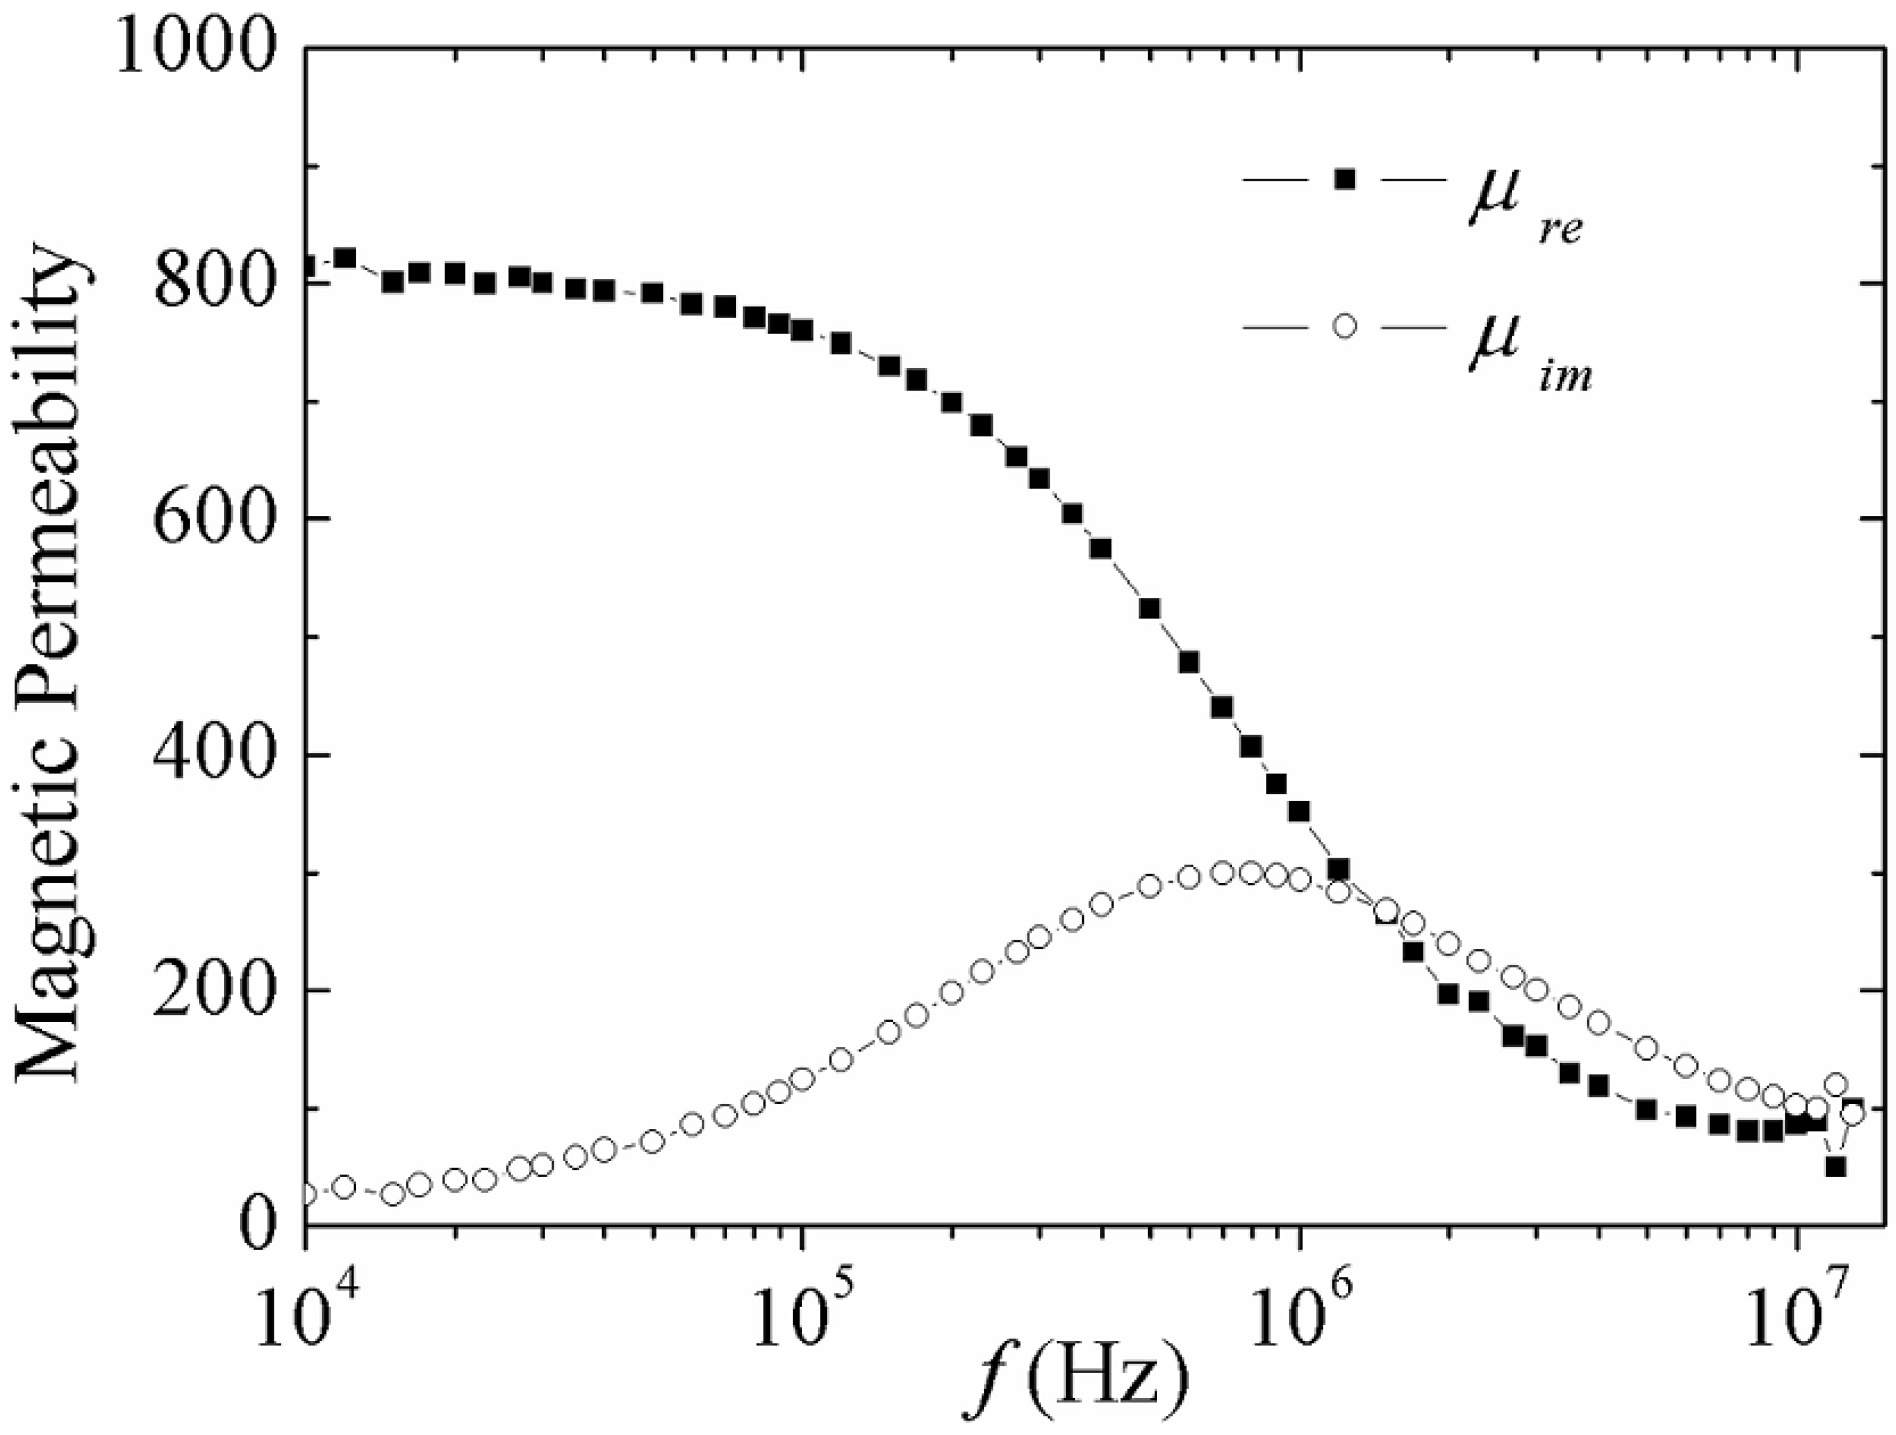
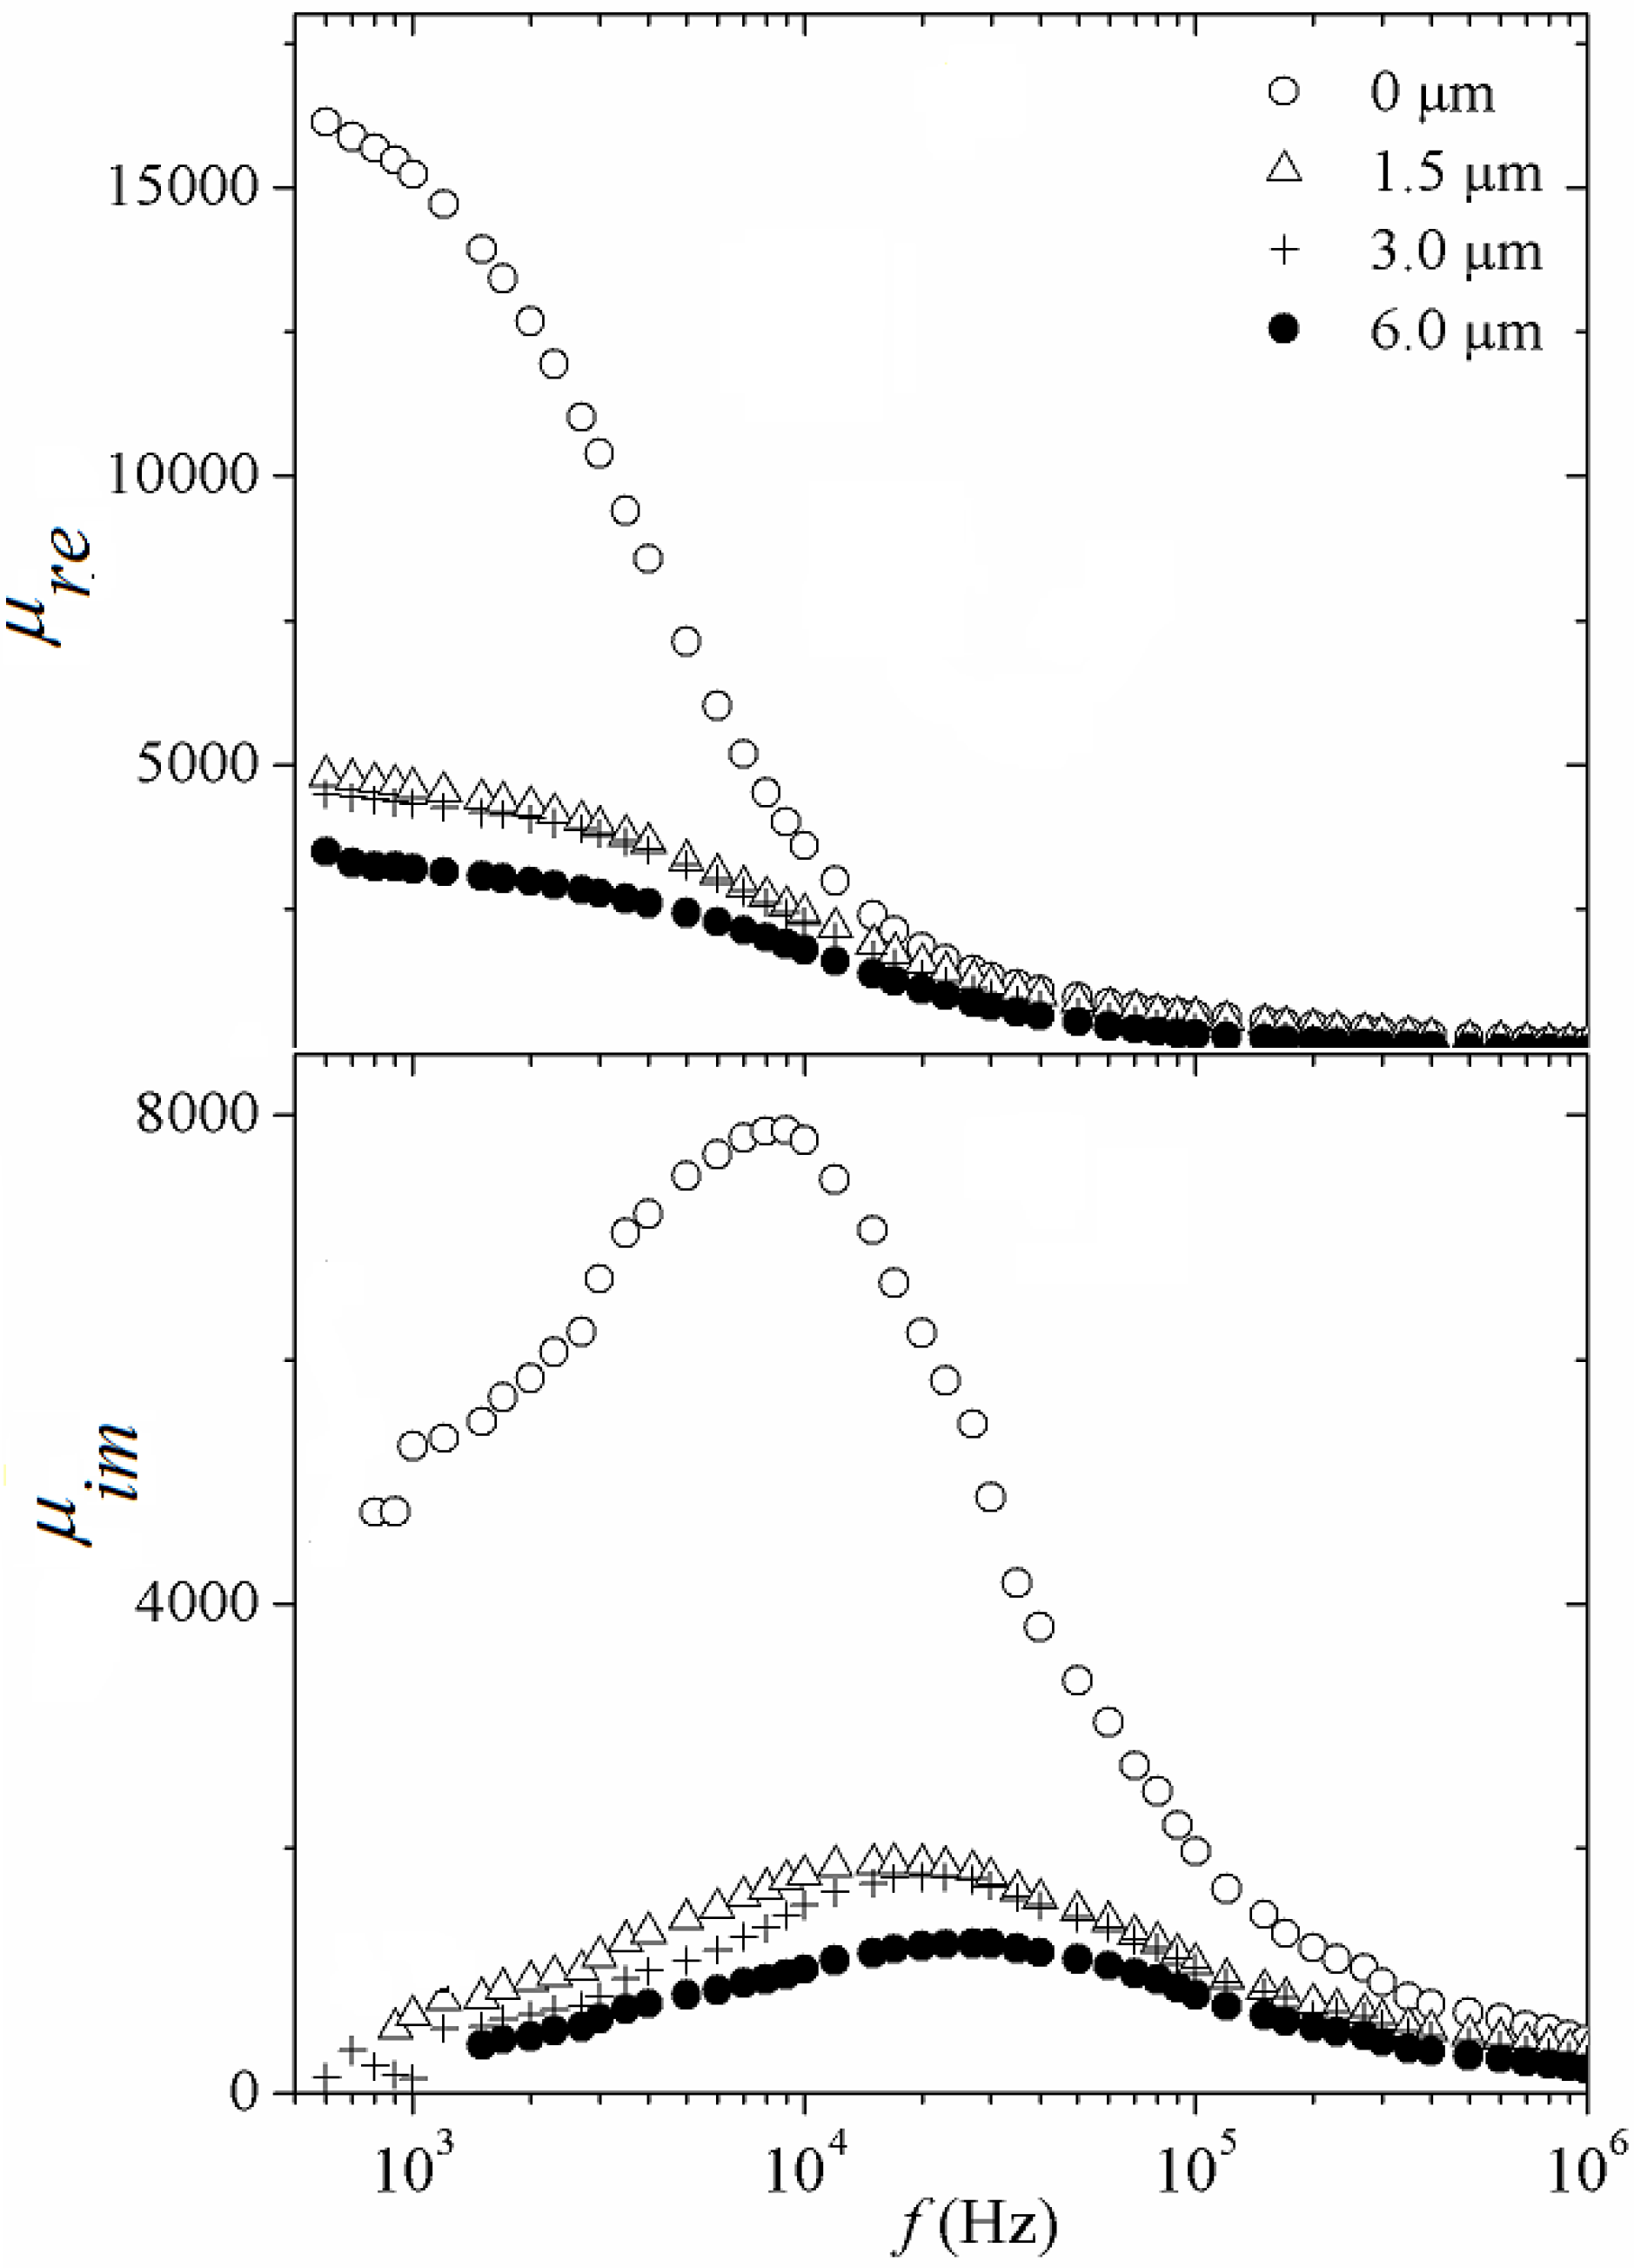
The spectroscopy behavior for real and imaginary components of complex permeability for amorphous Fe
80B
10Si
10 ribbons are shown in
Figure 1. These curves afford the resolution of the active magnetization mechanisms across the frequency range for a given
hac intensity [
22,
23]. For instance, the
μre(
f ) plot for an
hac = 0.42 A/m shows an initial plateau-like behavior for increasing frequency
f values up to 6 x10
4 Hz. This tendency of
μre can be attributed to the reversible bulging of the magnetic domain walls (DWs) pinned at the ribbon surface´s defects (such as voids, surface irregularities and the very surface itself). Hence,
μre at this part of the frequency is then associated with the initial permeability
μini of the material [
22,
24] Further, increase in
f causes a significant reduction in
μre(
f ), which can be ascribed to a relaxation-type dispersion of the reversible bulging mechanism for which the DWs are no longer able to follow the ac magnetic variations. Beyond a threshold frequency
fx (or relaxation frequency)
μre becomes very small, reflecting the contribution of the spin rotation as the only magnetization process active for
f >
fx [
22,
24]. Complementarily, the imaginary
μim component is attributed to the alloy magnetic losses (hysteresis, eddy current, power losses) [
25,
26]. The maximum in
μim corresponds to
fx.
Figure 1.
Spectroscopic plots of the complex permeability components for amorphous Fe80B10Si10 ribbon at hac = 0.42.
Figure 1.
Spectroscopic plots of the complex permeability components for amorphous Fe80B10Si10 ribbon at hac = 0.42.
On the other hand, for a higher
hac intensity of 1.69 A/m, it is possible to observe two sections of the
μre (
f) plot as is shown in
Figure 2 for the same FeBSi ribbons: The reversible bulging process, together with its corresponding relaxation for
f > 1 × 10
5 Hz, and a significant increase in
μre for the frequency interval 3 × 10
3 Hz <
f < 1 × 10
5 Hz, with a precedent constant tendency for
f < 3 × 10
3 Hz. This increment in
μre can be interpreted in terms of a magnetization mechanism involving the irreversible displacement of DWs caused by the higher
hac intensity [
22,
23,
24]. The DWs displacement leads to the hysteresis process within the material, which also presents a relaxation-type dispersion (
i.e., a change of process) for the aforementioned frequency interval (3 × 10
3 Hz <
f < 1 × 10
5 Hz), for which a progressive decrease in
μre is manifested for increasing
f up to a threshold frequency known as “hysteresis relaxation frequency”
fxh. Beyond this
fxh, the irreversible displacement of DWs becomes unable to follow the exciting
hac field, allowing the reversible bulging to be the active magnetization process because of its shorter time constant. Complementarily, the imaginary component
μim (
f ) exhibits a behavior consistent with the sequence of magnetization mechanisms described already, showing one maximum for each process,
i.e., irreversible displacement of DWs at
fxh and reversible bulging of DWs at
fx, respectively. For this case
fxh = 8 × 10
3 Hz and
fx = 8 × 10
5 Hz. The marked order of magnitude between both threshold frequencies (
fxh <<
fx) reflects the significant difference between the time constant for each magnetization mechanism (much larger for the hysteresis process compared with the reversible bulging of DWs). In addition, the magnetic losses (proportional to the area under the
μim curve) are also comparatively larger for the irreversible displacement of DWs than for the reversible bulging, due to the higher energy cost for the hysteresis process relative to the reversible deformation of the DWs.
Figure 2.
Spectroscopic plots of the complex permeability components for amorphous Fe80B10Si10 ribbon at hac = 1.69 A/m.
Figure 2.
Spectroscopic plots of the complex permeability components for amorphous Fe80B10Si10 ribbon at hac = 1.69 A/m.
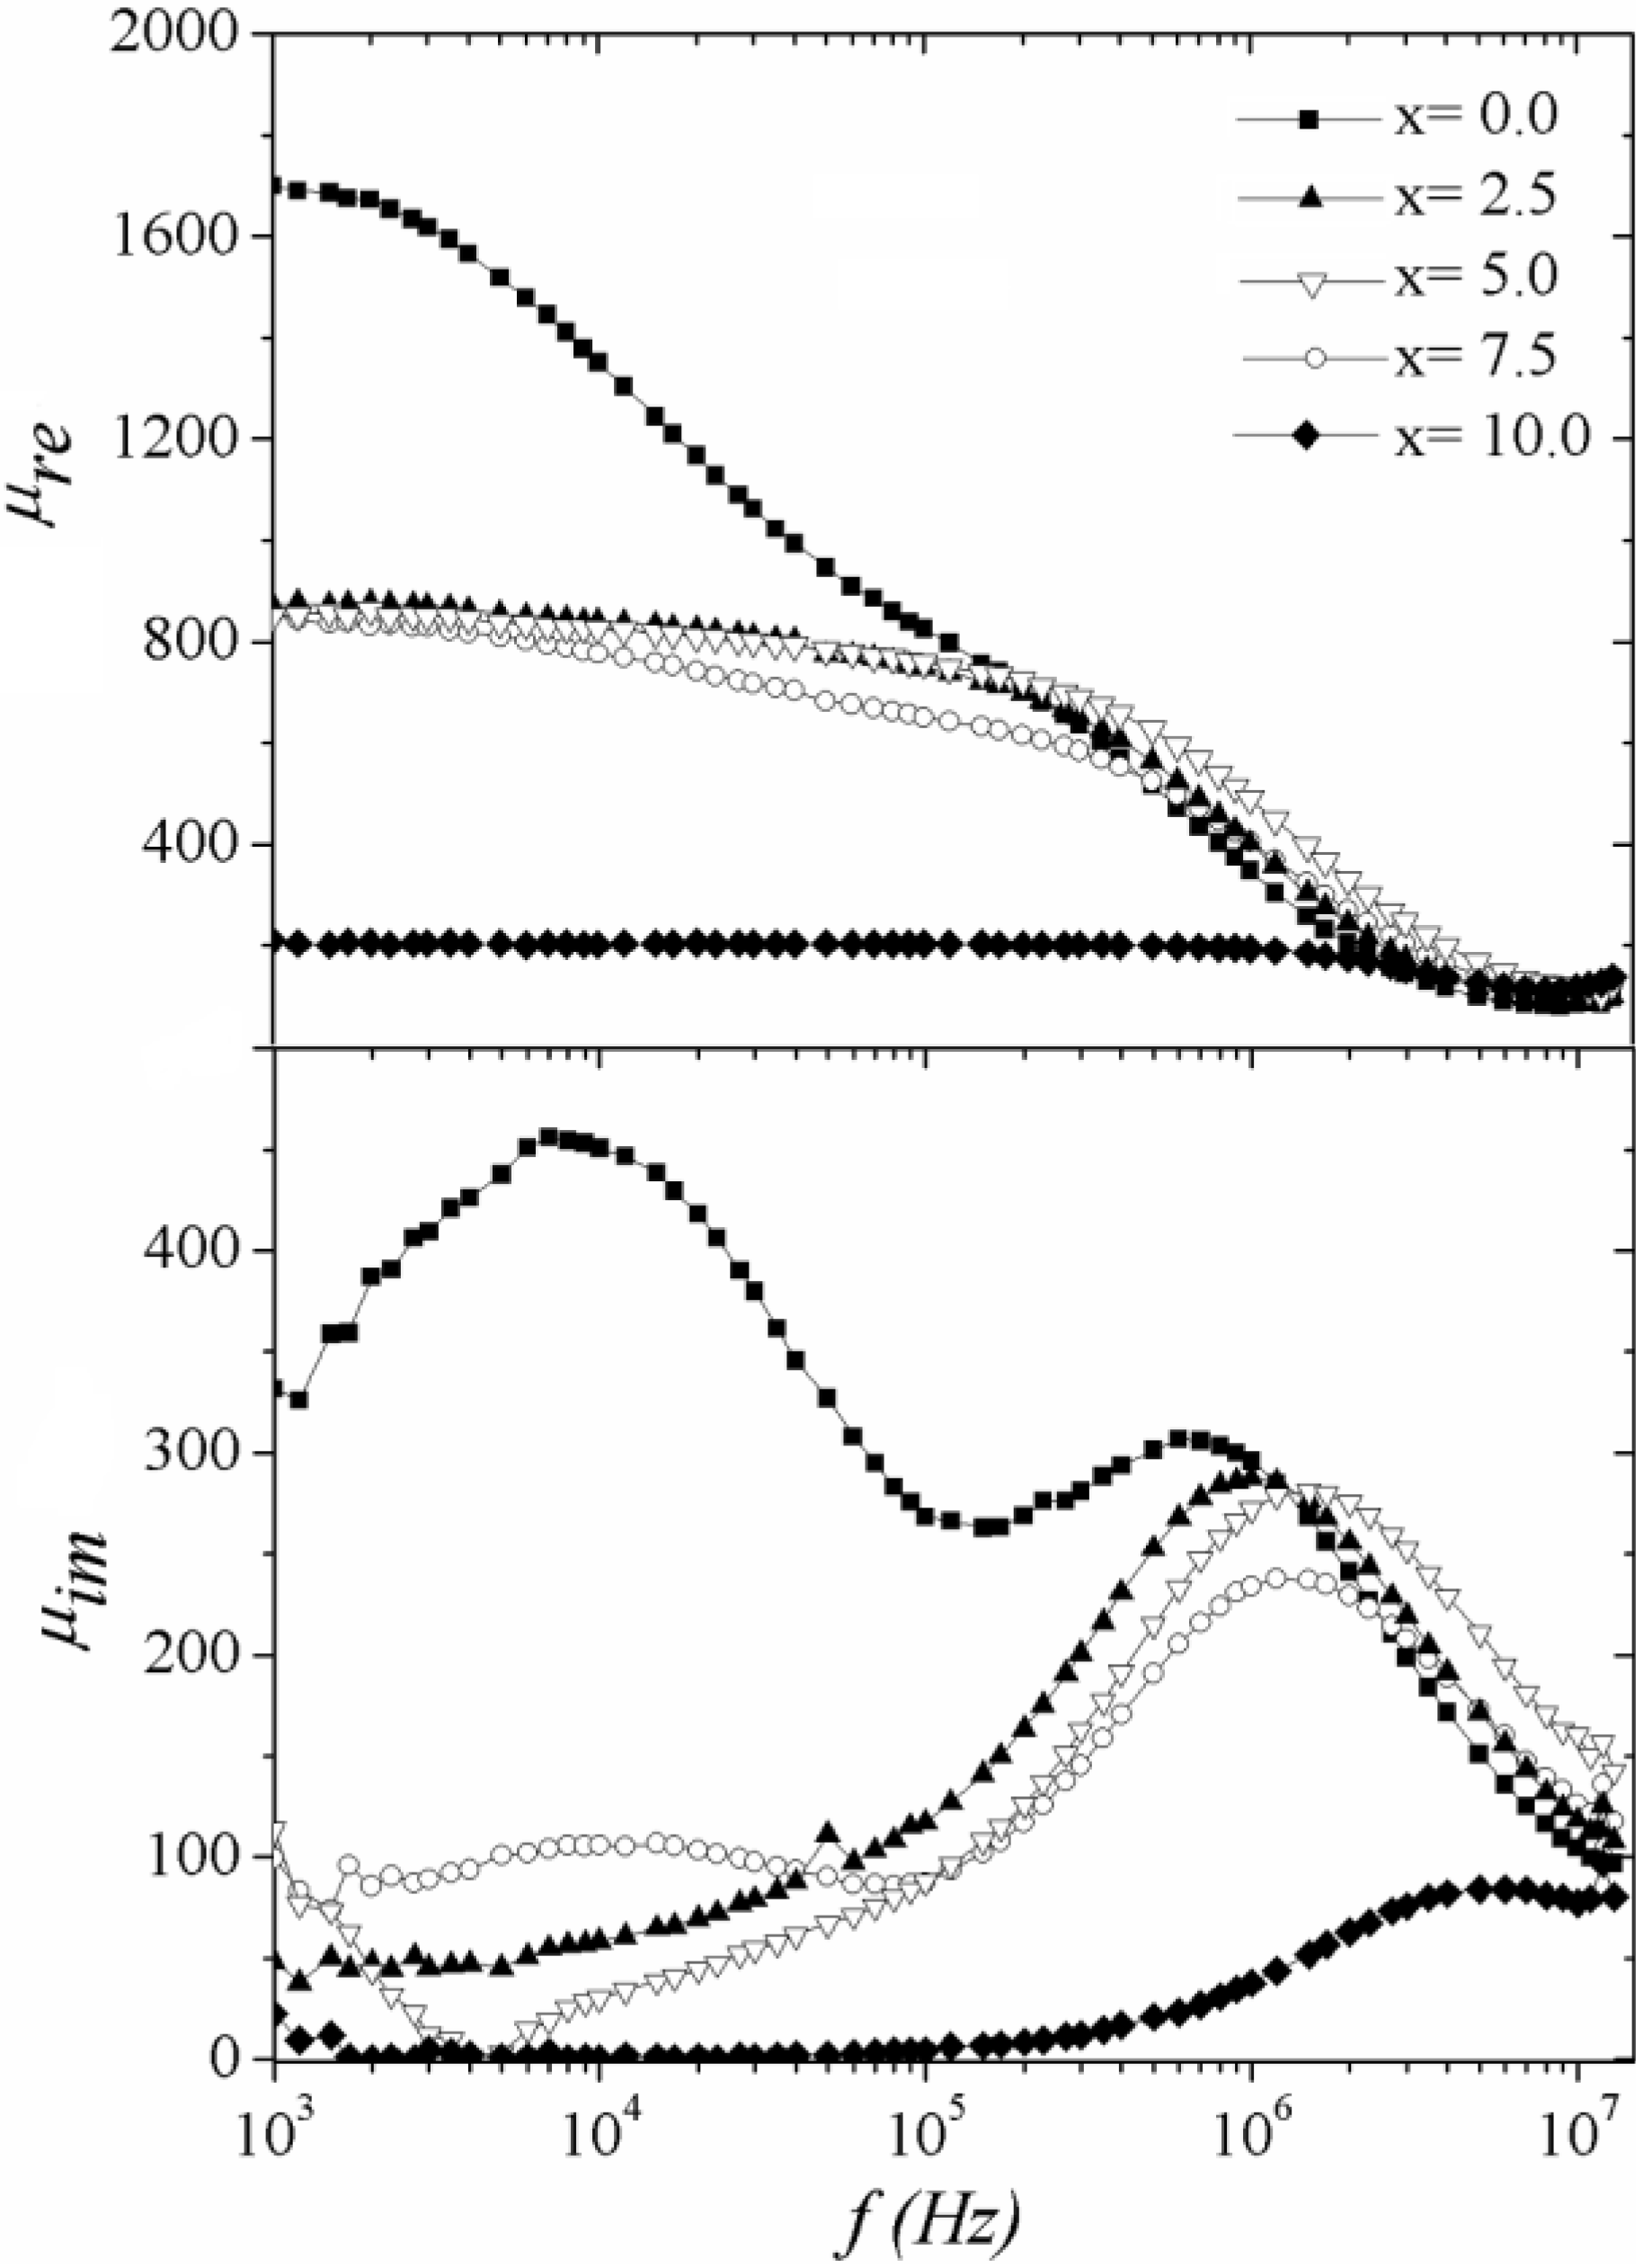
The magnetic permeability and thus, the magnetization processes, are highly sensitive to the chemical composition of the alloy ribbons because of the possible effect on the short-range atomic ordering introduced by variable atom species, which may affect the exchange interaction between magnetic moments as well as the formation of spin-up/spin down bands [
27,
28,
29]. In
Figure 3, the real permeability spectroscopic plots (
Figure 3a) for melt spun Fe
80B
10Si
10-xGe
x (x = 0.0–10.0) ribbons shows an initial behavior (x = 0.0) including irreversible DWs displacement for
f < 1 × 10
5 Hz and its further reversible bulging response for higher frequencies. Nevertheless, for increasing Ge concentration (x ≥ 2.5) the low time constant processes (
i.e., hysteresis) disappears, leaving the reversible bulging of DWs as the only active mechanism, for which a progressive deleterious tendency is observed with increasing Ge content. Complementarily, the imaginary component
μim(
f) (
Figure 3b) also exhibits a transition from a double-peak behavior corresponding to two magnetization processes, to a single maximum regime associated to the magnetization mechanism with higher time constant. Additionally, it is possible to observe that the relaxation frequency
fx increases in a monotonous manner with increasing x, as indicated by the maxima in
μim(
f) plots moving to higher frequency values. These results point to a significant compositional influence on the time constant response of amorphous alloys via the effective magnetic anisotropy, which has been observed also in amorphous wires [
30] and soft ferrites [
31].
Figure 3.
Spectroscopic plots of the complex permeability components for the amorphous ribbon Fe80B10Si10-xGex series at hac = 1.69 A/m.
Figure 3.
Spectroscopic plots of the complex permeability components for the amorphous ribbon Fe80B10Si10-xGex series at hac = 1.69 A/m.
As was mentioned in the “Introduction” section, the magnetoelastic coupling between the residual stresses and the alloy magnetostriction λ
s plays a major role in determining the magnetic domain configuration of ribbons and wires and, hence, of their magnetic properties. In order to monitor the magnetoelastic coupling for the ribbon series Fe
52−xCo
10+xNb
8B
30 (x = 0, 12, 24, 36),
μre plots as a function of an applied magnetic dc field H
dc and under the effect of variable longitudinal applied tension stress σ at a constant frequency
f = 13 MHz were determined for each composition.
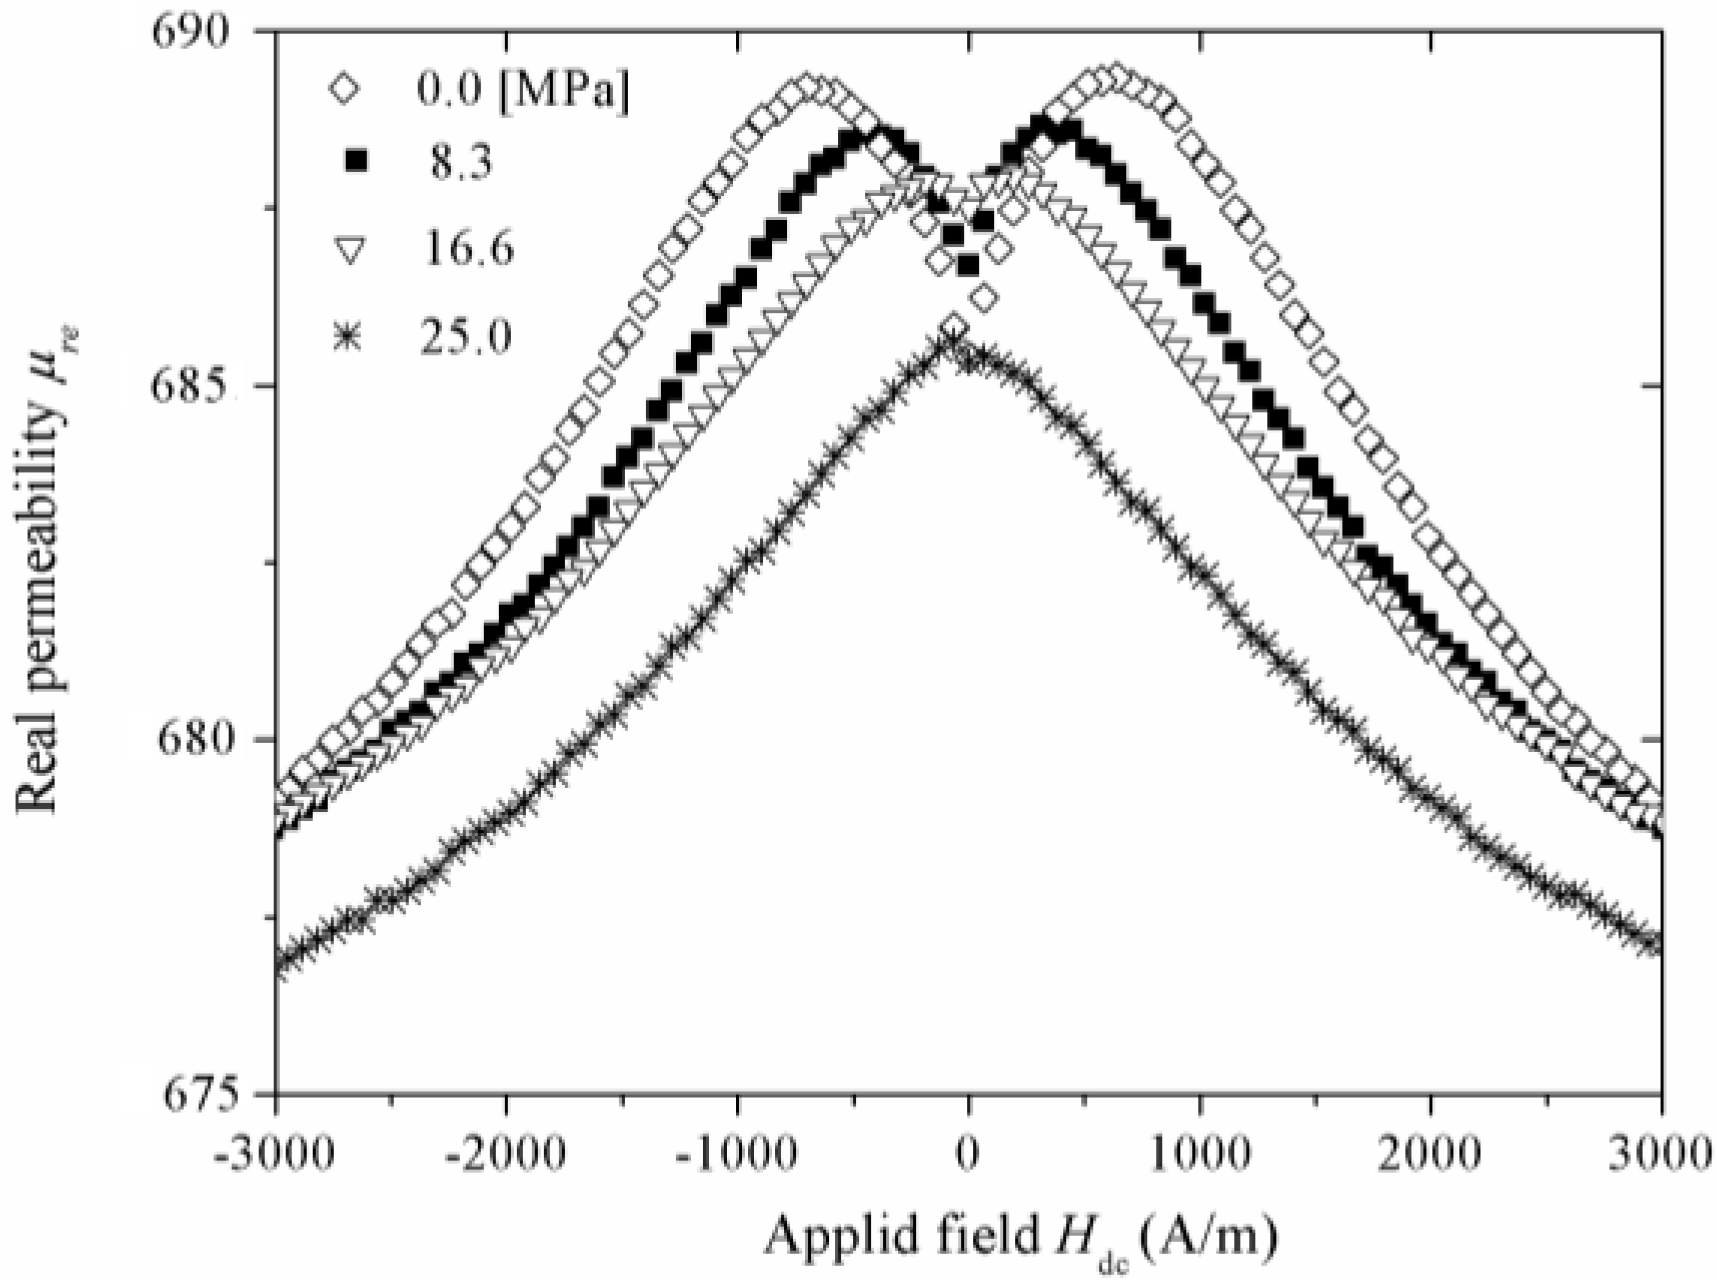
Figure 4 illustrates
μre (H
dc)-σ curves for the Fe
52Co
10Nb
8B
30 alloy (x = 0), for which at σ = 0,
μre initially increases for H
dc values between 0 and 800 A/m, followed by a monotonous decrease for H
dc > 800 A/m. This behavior is symmetrical for negative H
dc. For increasing σ, this original two-peak behavior progressively evolves to a reduced single-maximum
μre (H
dc) picture. Same tendencies were observed for the remaining alloy samples, except for the x = 36 alloy, which showed negligible magnetic permeability values as a consequence of its vanishing
λs constant.
Figure 4.
μre(Hdc) curves under the effect of variable tension stress σ for the Fe52Co10Nb8B30 ribbon.
Figure 4.
μre(Hdc) curves under the effect of variable tension stress σ for the Fe52Co10Nb8B30 ribbon.
The physical meaning of these
μre (H
dc) -σ plots can be explained as follows: At the frequency of measurement (
f = 13 MHz >>
fx), the spin rotation remains as the only active magnetization mechanism and thus, the real component of permeability corresponds to the rotational permeability
μrerot. For the stress-free curve, the initial increase of
μrerot up to H
dc = 800 A/m can be ascribed to an additional component (axially oriented) of
μrerot exerted by H
dc. The maximum in
μrerot is a consequence of a counterbalancing effect in the rotational magnetization process between the axial H
dc and the anisotropy field
Hk in the transverse direction induced during the ribbon fabrication. Thus, the maximum in
μrerot (H
dc) corresponds to H
k [
32,
33]. For H
dc beyond 800A/m, the rotational permeability decreases since the magnetic spins are mostly axially oriented after having overcome the original anisotropy. On the other hand, for the
μrerot (H
dc) curves with increasing σ (up to 16.6 MPa), a shifting of
Hk towards lower values is observed as a consequence of a progressively higher induced axial anisotropy, allowed by the increment of σ, which counterbalance the original transverse anisotropy and thus, the as-cast transverse magnetoelastic coupling. For σ = 25.0 MPa, the alloy transverse anisotropy is averaged out, which results in a single-peak regime with reduced
μrerot as a consequence of the predominant axial anisotropy induced by σ. This behavior is indicative of a positive
λs. The dependence of
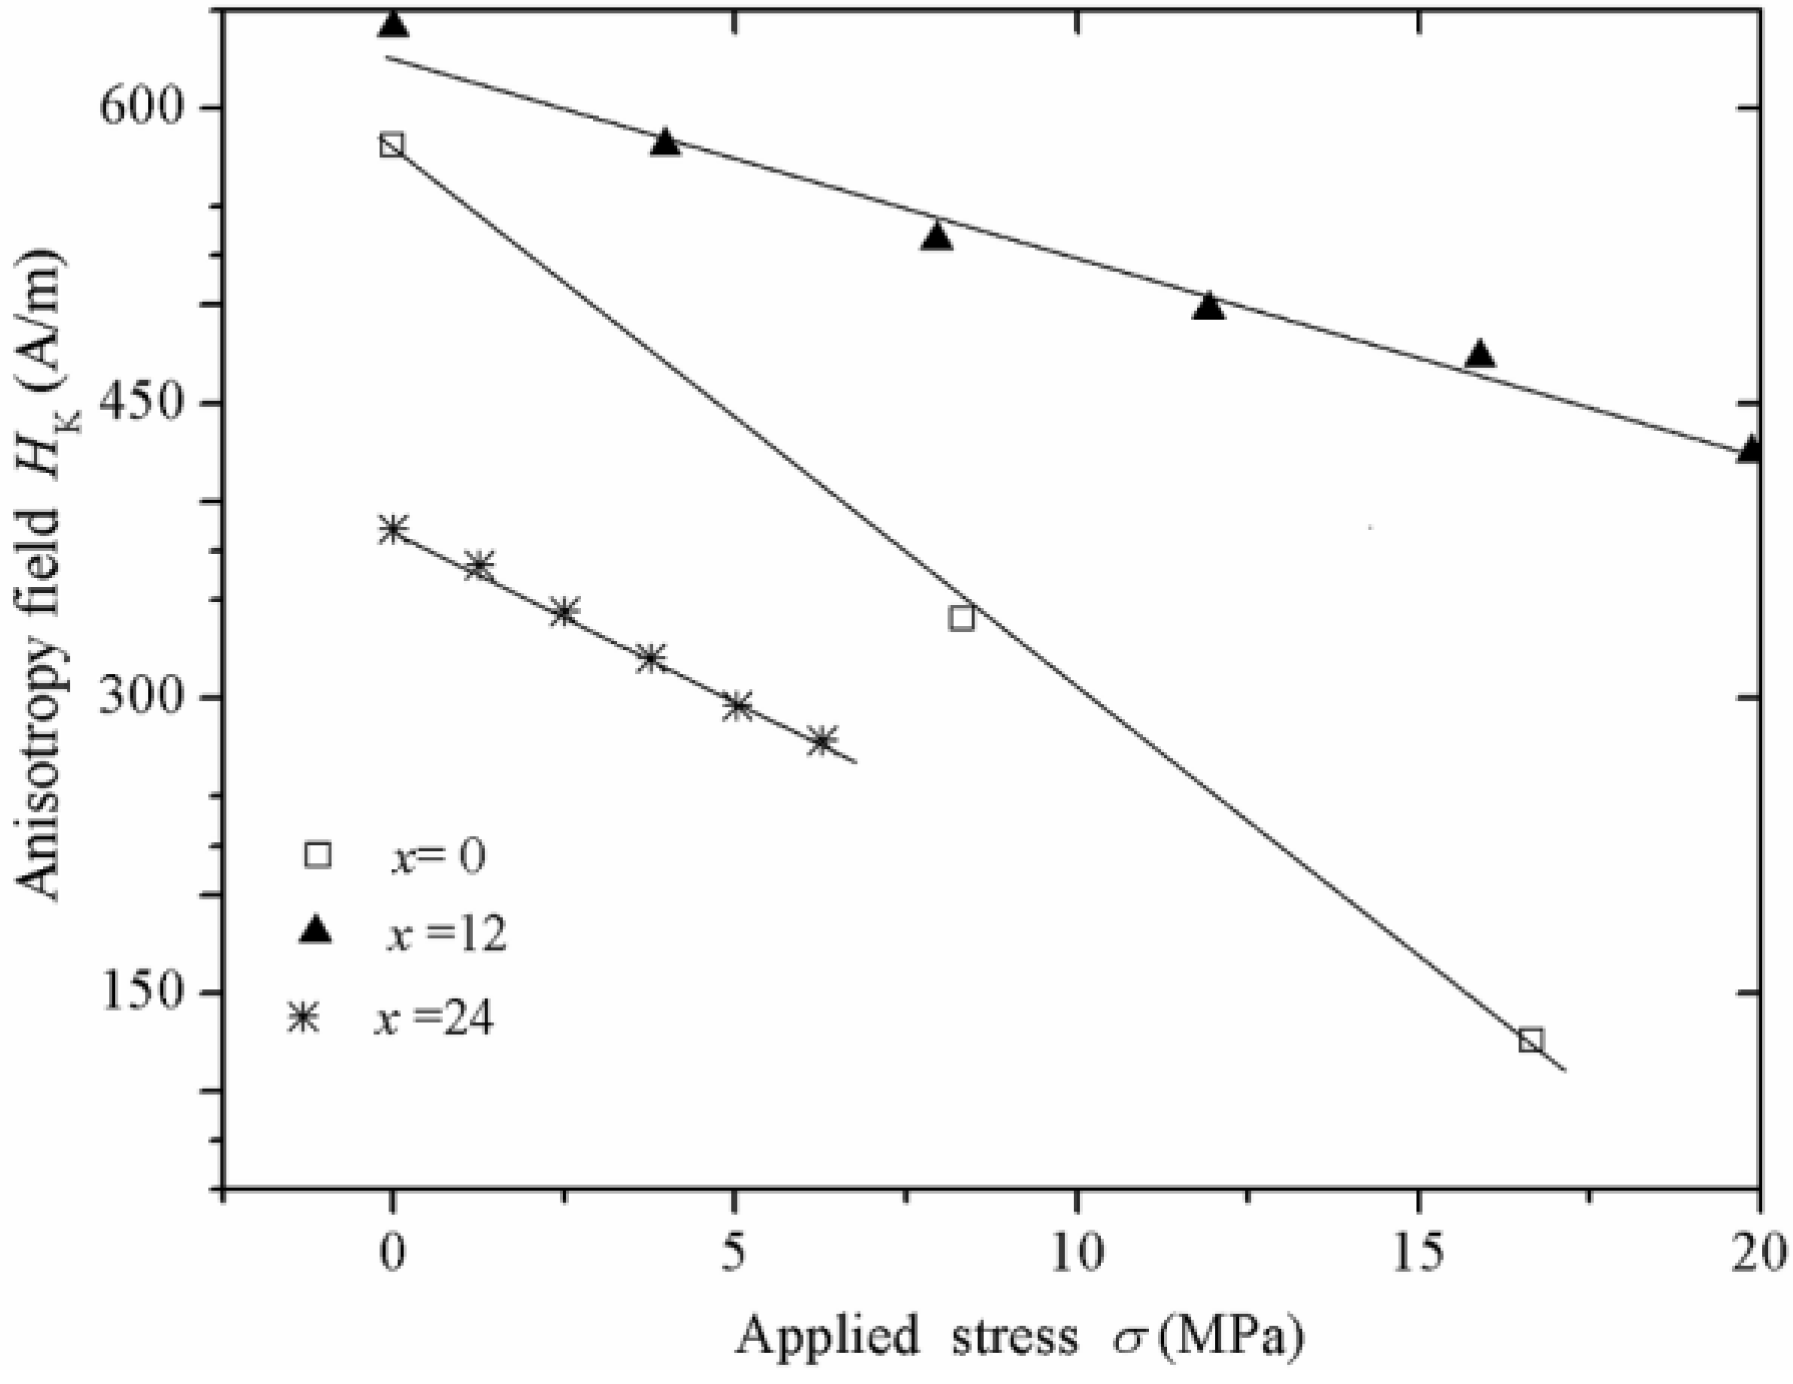
Hk on σ for alloy ribbons with x ≤ 36 is displayed in
Figure 5, for which the following linear trends are manifested (after appropriate linear fittings): H
k = 576 [A/m] –27.3 × 10
−6 [A/(mPa)] σ x = 0; H
k = 628 [A/m] –10.3 × 10
−6 [A/(mPa)] σ, x = 12; and H
k = 387 [A/m] –17.7 × 10
−6 [A/(mPa)] σ, x = 24.
Figure 5.
Anisotropy field Hk as a function of applied stress σ for the Fe52−xCo10+xNb8B30 alloy series. The straight lines correspond to linear fittings with at least R2 = 0.99.
Figure 5.
Anisotropy field Hk as a function of applied stress σ for the Fe52−xCo10+xNb8B30 alloy series. The straight lines correspond to linear fittings with at least R2 = 0.99.
From the functional relations stated above, it is possible to estimate the
λs constant for each alloy according to the following relationship [
33,
34]:
where μ
0Ms is the saturation magnetization and ΔH
z corresponds to the variations of the transverse field H
z necessary to compensate the magnetoelastic contribution induced by σ. This equation is proposed for positive and negative
λs values [
33,
34]. For present measurements, the compensating ΔH
z field corresponds to
Hk straightforward. Therefore, Equation (3) becomes:
Taking μ
o = 12.56 × 10
−7 H/m and the following μ
0Ms values determined from
M-H measurements in a VSM system: 1.24 T (x = 0), 1.09 T (x = 12), 0.86 T (x = 24), in addition to
Hk/Δσ as the slopes of the H
k(σ) plots (
Figure 5), we found a decreasing
λs tendency with increasing Co concentration as follows: λ
s = 10.7 ppm (x = 0), λ
s = 3.6 ppm (x = 12) and λ
s = 3.0 ppm (x = 24).
2.2. Amorphous Wires
An alternative representation of the spectroscopic μ
re (
f), μ
im (
f) plots (or alternatively
Lre (
f),
Lim (
f) plots) is the so-called Cole-Cole diagram in which both components are plotted simultaneously in the complex plane, with the frequency
f being now an implicit variable (the corresponding
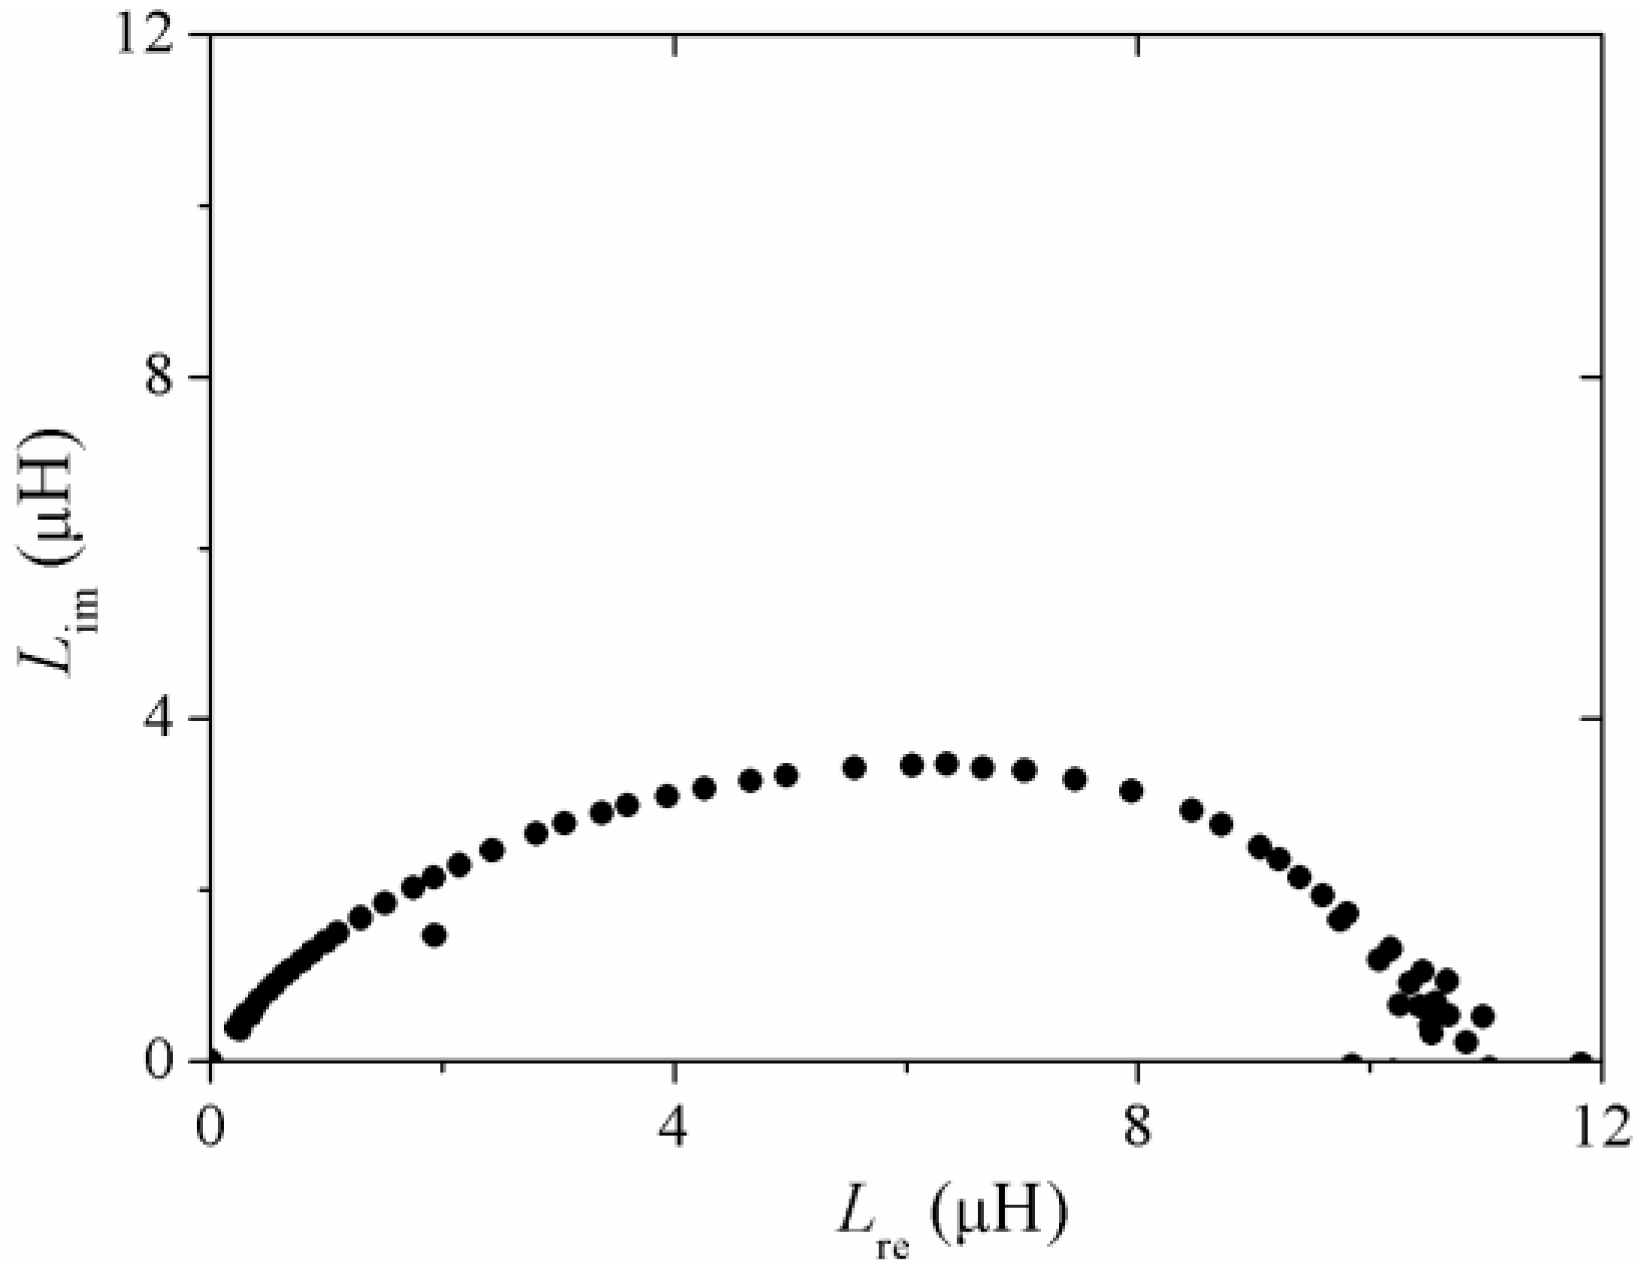
f for each data point increases from right to left in the plot) as is shown in
Figure 6 for an amorphous wire of composition (Co
94Fe
6)
72.5B
15Si
12.5 (120 μm diameter). For this representation, the formation of well defined semicircles is associated with a magnetization process [
23]. In the case of
Figure 6, a single semicircle, somehow distorted, reveals the reversible bulging of DWs within the wire as the active mechanism for the frequency range of measurements (10 Hz–13 MHz). The dispersion of the process for the Cole-Cole representation occurs at the middle point onto the semicircle. For this case,
fx = 88.5 kHz. The distortion of the semicircle reflects a distribution of time constants within the wire,
i.e., variations of the DWs pinning distance. For a homogenous DWs pinning distance, a perfect circular curvature is expected to occur in the Cole-Cole plane [
23].
Figure 6.
Cole-Cole representation for the complex inductance formalism of (Co0.94Fe0.6)72.5B15Si12.5 amorphous wire.
Figure 6.
Cole-Cole representation for the complex inductance formalism of (Co0.94Fe0.6)72.5B15Si12.5 amorphous wire.
A more physical insight into the magnetization processes involved in InS measurements can be attained by means of direct calculation of the circular magnetization Mφ of amorphous wires, which is afforded by the circular magnetic domains characteristic of these alloys. The Mφ determination is described as follows:
The magnetic permeability calculation of Equation (2) corresponds to circular permeability
μφ in amorphous wires, since the applied magnetic field
hac is also of circumferential character as described in the “Experimental Techniques” section. Once
μφ is known, the wire´s circular induction B
φ can be worked out from the permeability definition:
and from the general equation
with μ
o the vacuum’s permeability.
The calculation of the circular magnetization μ
oM
φ is straightforward according to:
Therefore, circular magnetization plots μ
oM
φ (
hac) can be calculated for various
hac amplitudes at fixed frequencies
f of
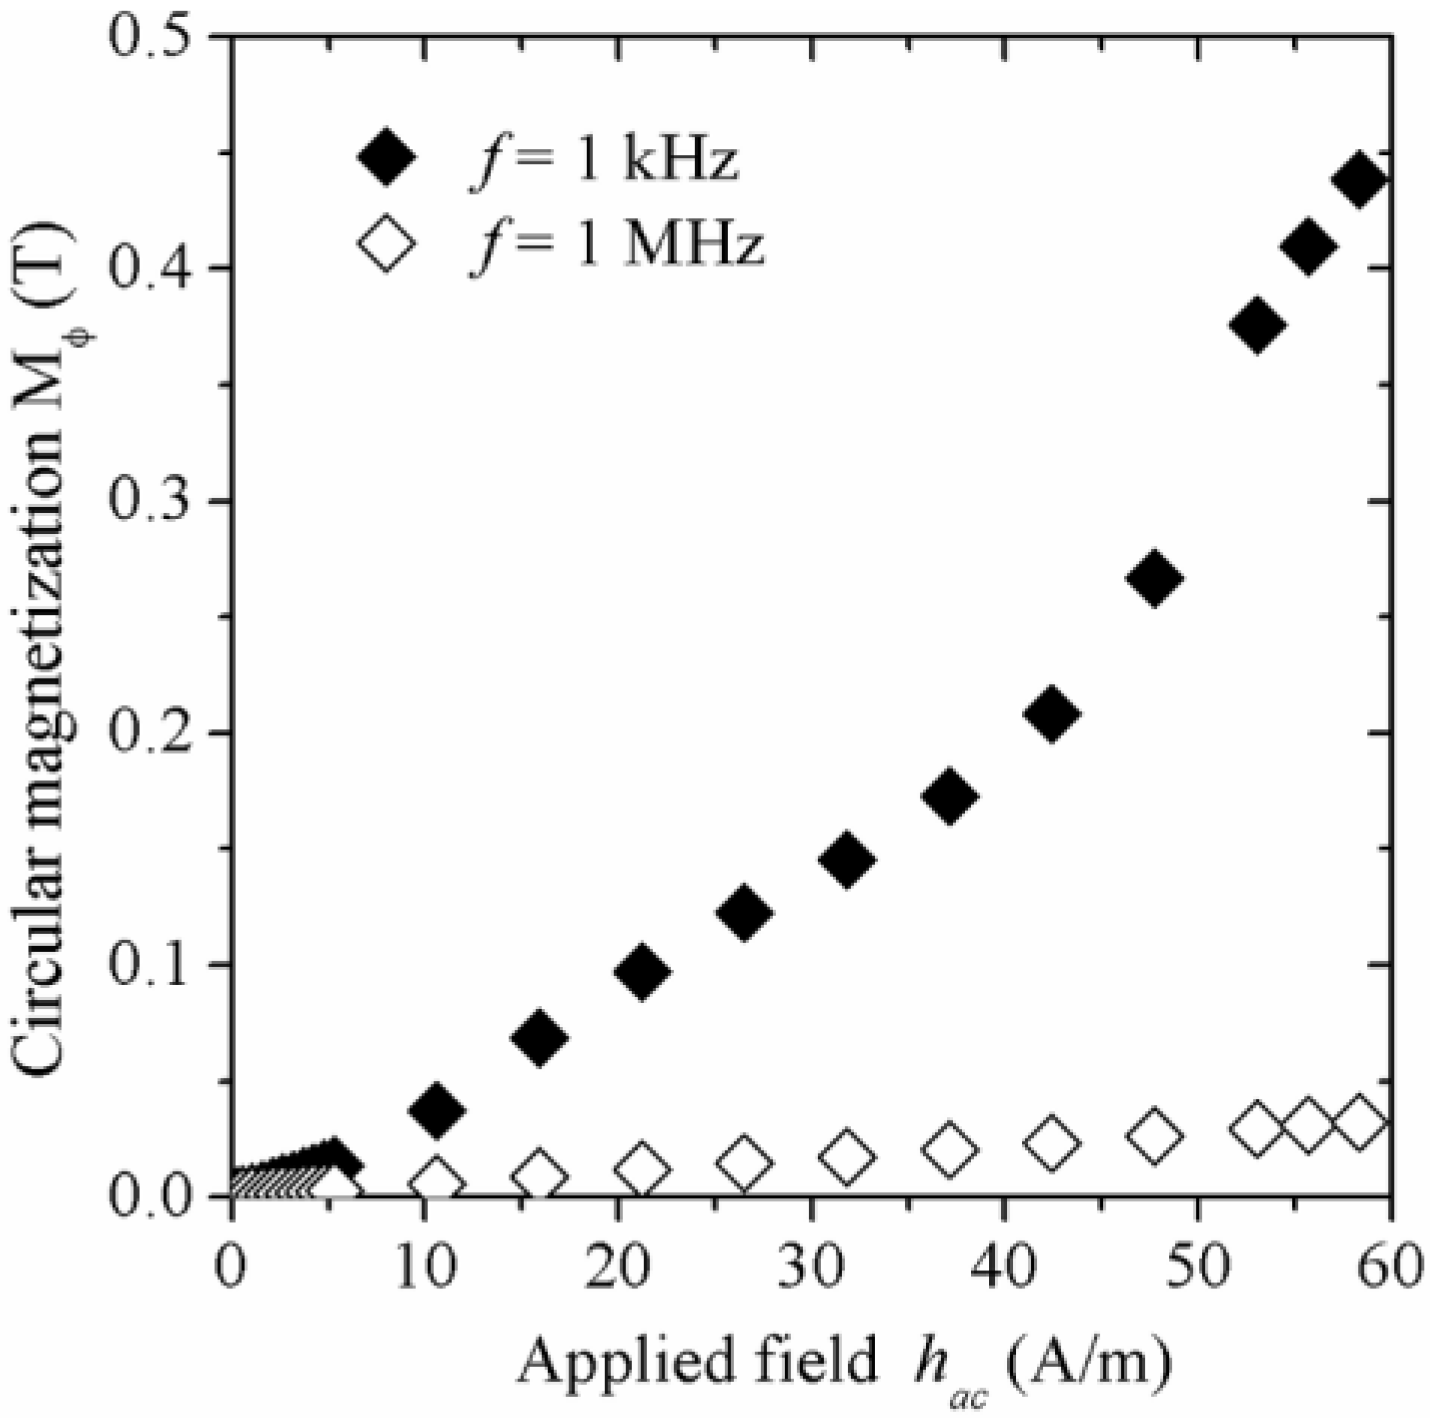
hac, as is shown in
Figure 7, for an amorphous (Co
94Fe
6)
72.5B
15Si
12.5 wire with vanishing λ
s. At low frequency (
i.e.,
f <<
fx ), a typical domain wall magnetization process is observed at the linear initial M
φ-
hac behavior, corresponding to reversible pinned domain wall bulging, followed by a sudden increase in μ
oM
φ at a particular
hac field value known as the propagation field
hp for which the irreversible wall displacement begins. Further increase in
hac amplitude should exhibit a μ
oM
φ trend to saturation, where the spin rotation will complete the magnetic moment alignment towards
hac orientation. On the other hand, for
f >>
fx, the linear character of the magnetization curve across the
hac amplitude variation, clearly reflects the spin rotation as the only magnetization mechanism remaining active at such a frequency.
Figure 7.
Circular magnetization plots Mφ (hac) for (Co0.94Fe0.6)72.5B15Si12.5 amorphous wire.
Figure 7.
Circular magnetization plots Mφ (hac) for (Co0.94Fe0.6)72.5B15Si12.5 amorphous wire.
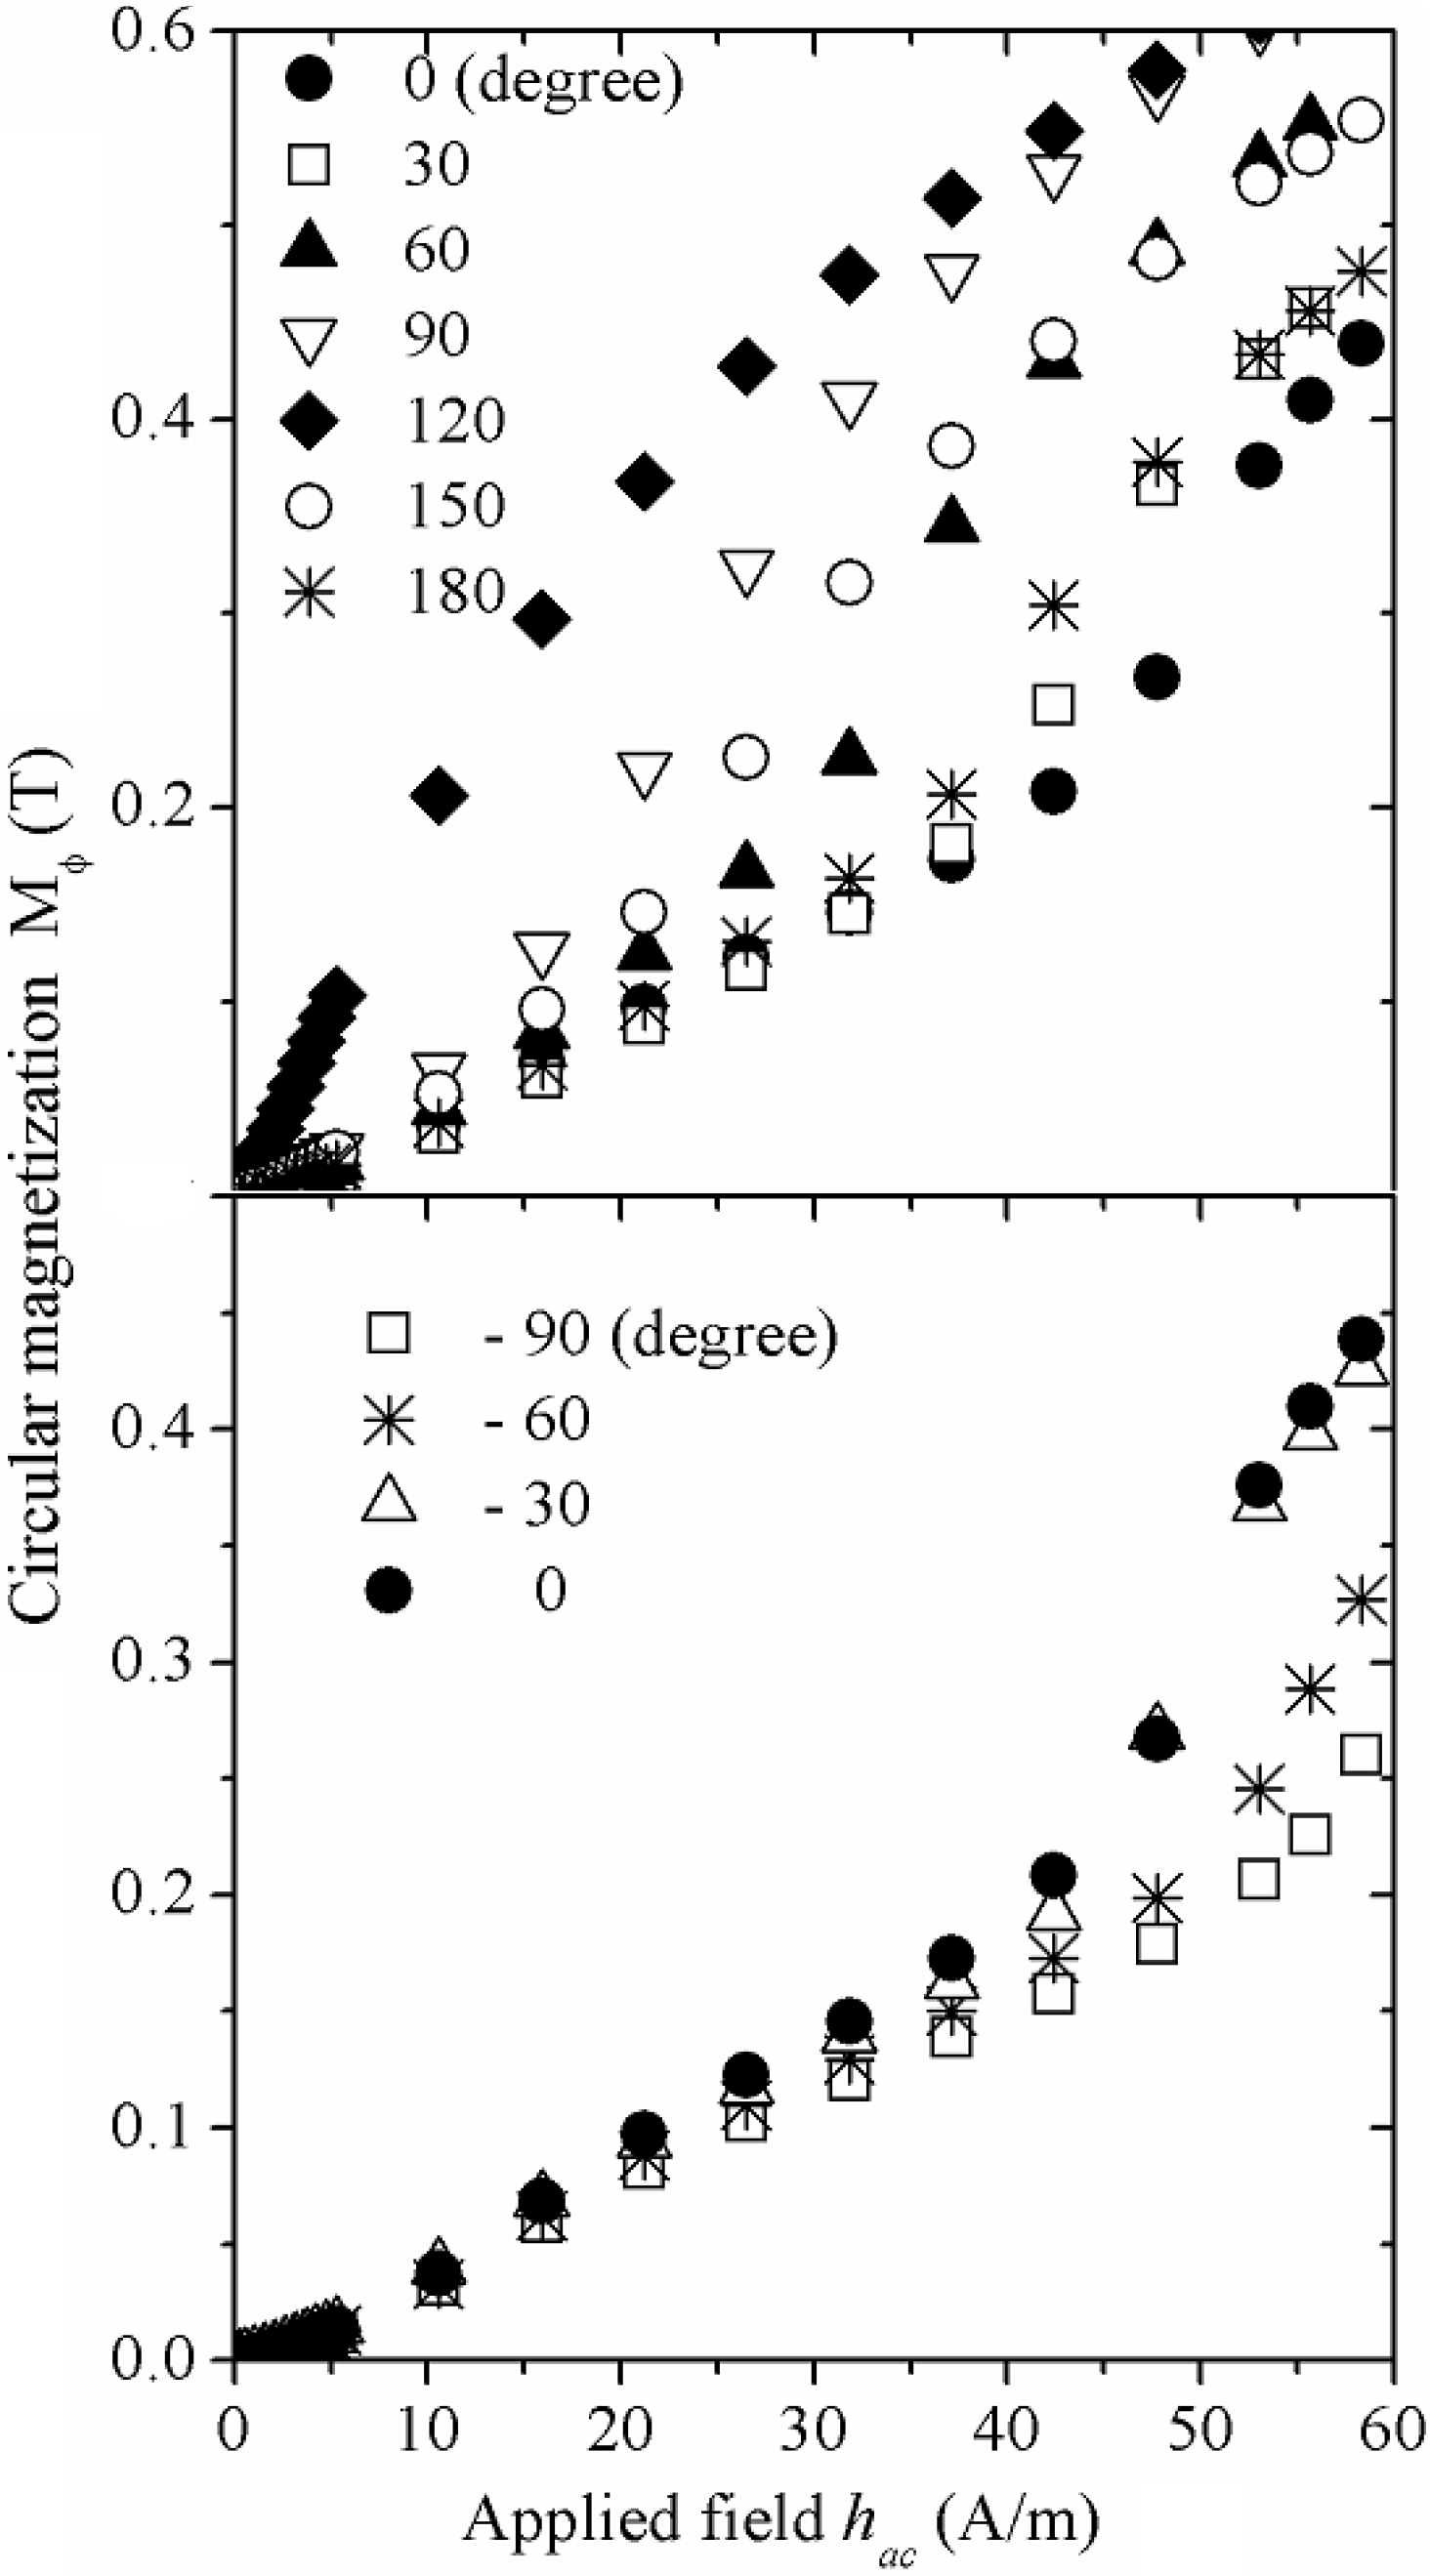
An interesting set of measurements aiming to determine the effect of torsion strain ζ on the wire´s circular magnetization at low frequency (
f = 1 kHz) is shown in
Figure 8. For positive ζ (clockwise rotation,
Figure 8a), μ
oM
φ versus hac, increases with the torsion angle up to a maximum of 120°. Further increase in ζ results in decreasing μ
oM
φ. Counterclockwise rotations (−ζ,
Figure 8b), on the other hand, resulted in decreasing μ
oM
φ as ζ increases.
Figure 8.
Mφ (hac) plots for (Co0.94Fe0.6)72.5B15Si12.5 amorphous wire at variable positive and negative torsion angles.
Figure 8.
Mφ (hac) plots for (Co0.94Fe0.6)72.5B15Si12.5 amorphous wire at variable positive and negative torsion angles.
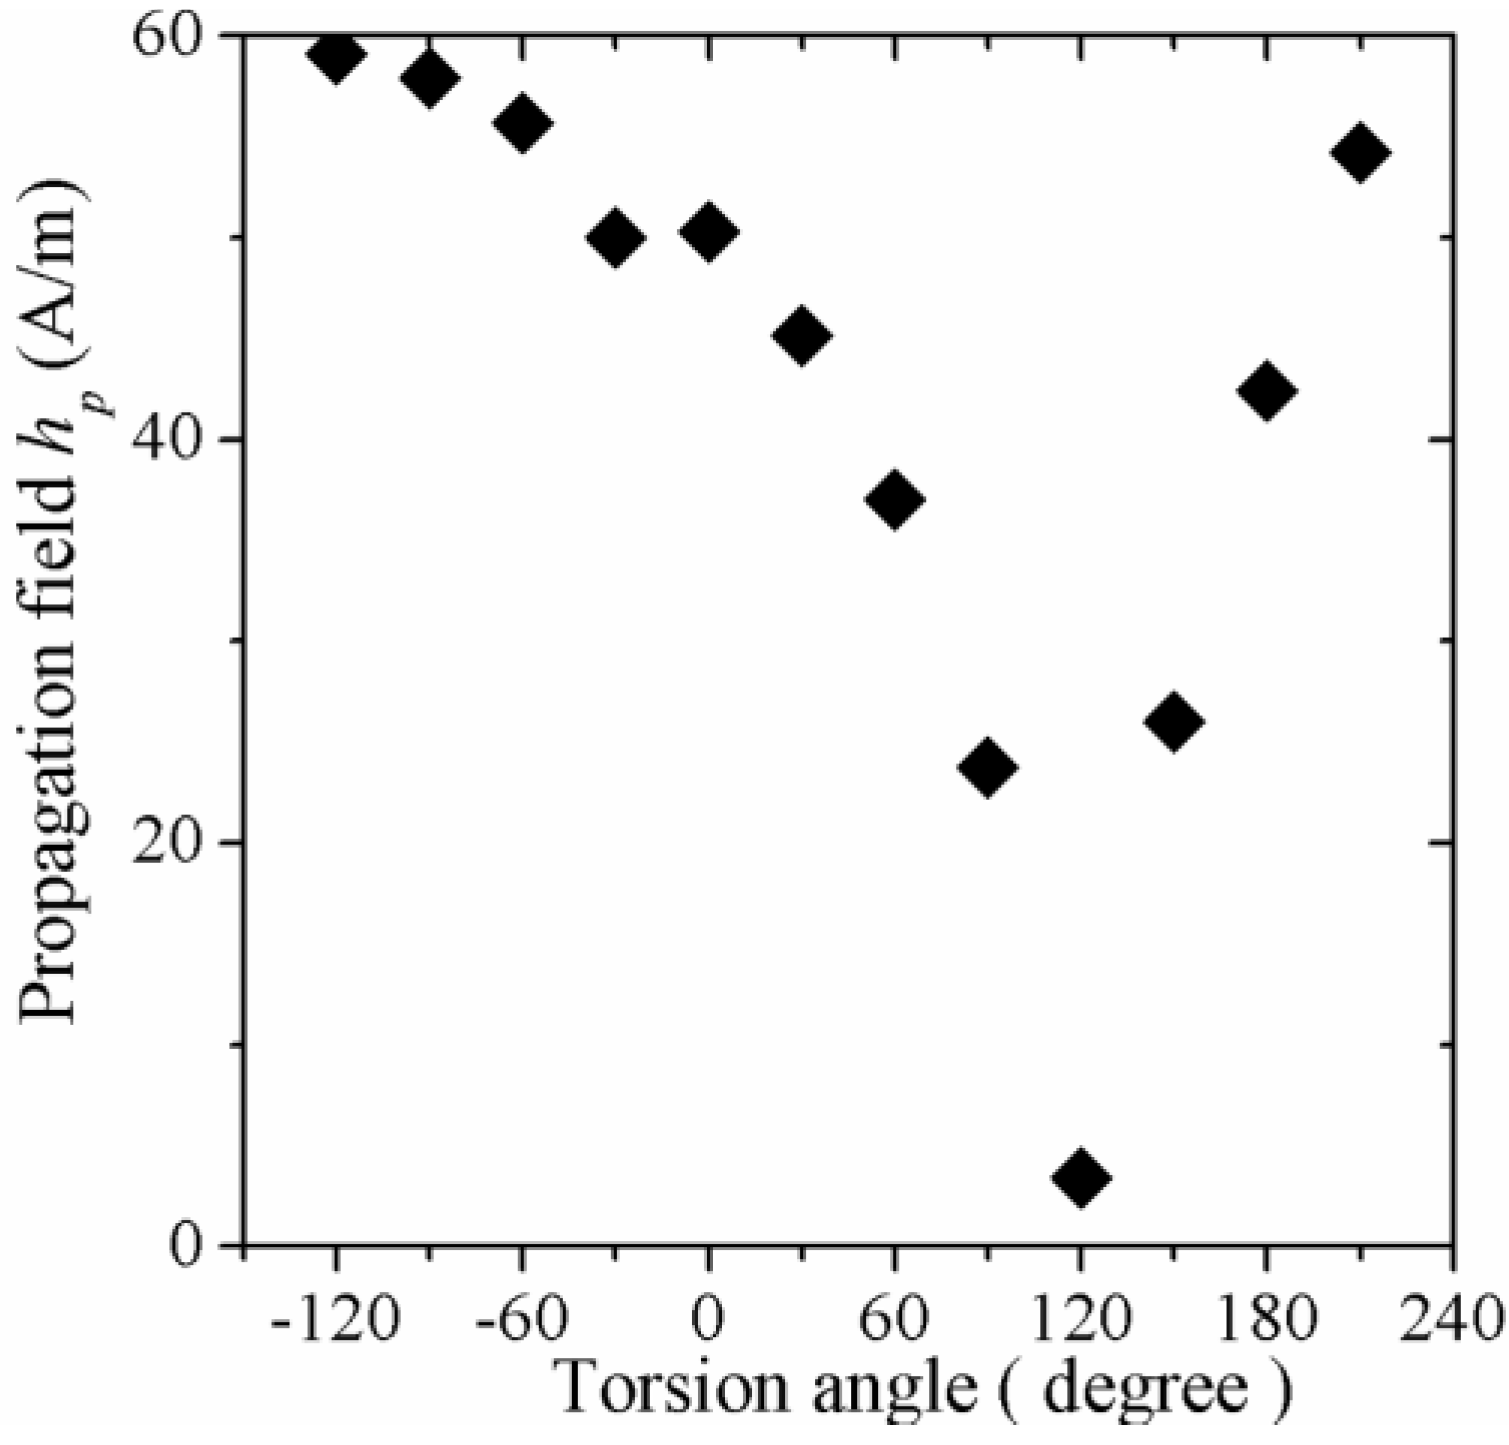
In addition,
hp (calculated at the inflexion point of each μ
oM
φ(
hac) plot), exhibits a sharp minimum (
Figure 9) at the same torsion angle. This particular μ
oM
φ,
hp behavior with varying torsion angles can be interpreted in terms of an intrinsic helical anisotropy induced during the fabrication process, which results in internal stresses τ, of about 60 MPa, according to theoretical predictions based on cylindrical layer solidification models [
35,
36]. Then, as +ζ increases, a counterbalance effect of this +ζ against the internal stress is evident, since the wire becomes magnetically softer, which affords higher μ
oM
φ values (due to higher
μφ) together with lower
hp values, as a consequence of an enhancement of the unpinning-displacement domain wall process. In contrast, for negative torsion angles, progressive increase in induced anisotropy due to −ζ results in decreasing
μφ and, hence, in lower μ
oM
φ values, is in agreement with recent reports [
37]. The corresponding applied torsion stress τ
appl, for a torsion angle of 120°, can be calculated as follows:
where K is the wire’s shear modulus, ζ = (torsion angle)/(wire length) is the torsion strain and r is the wire radius. Using K = 60 GPa [
38], we have τ
appl = 83 MPa, which is in good agreement with the expected internal τ induced during the wire fabrication (between 50 and 100 MPa [
39]). Similar τ
appl for enhanced
μφ at various ζ values has also been found in Fe-based wires [
40].
Figure 9.
Propagation field hp as a function of the torsion angle for amorphous (Co0.94Fe0.6)72.5B15Si12.5 wire.
Figure 9.
Propagation field hp as a function of the torsion angle for amorphous (Co0.94Fe0.6)72.5B15Si12.5 wire.
2.3. Amorphous Glass Coated Microwires
Spectroscopic plots of
μre (
f ) for amorphous Co
69.7Fe
3.8B
13Si
11Mo
1.5Ni
1 glass coated microwires (24 μm diameter, 10μm glass coating) at selected amplitudes of
hac, are shown in
Figure 10. At low fields (
hac < 127 A/m) and low frequencies (<1 MHz),
μre exhibits the same constant trend even for different
hac amplitudes, followed by its corresponding dispersion. The relaxation frequency
fx again represents the frequency for which the initial magnetization mechanism is no longer active. This
fx can be determined at the corresponding
μim maximum (
Figure 11). For the present case,
fx = 2.5 MHz. This
fx value is much higher than the typical
fx values of amorphous wires with larger diameters values (of about 100–140 μm) with characteristic
fx ~ 90 kHz. The substantial increase of
fx for amorphous glass coated microwires is a consequence of their reduced diameter, since the DWs lengths are smaller than those in larger amorphous wires, and therefore, the expected relaxation occurs at higher frequencies. For
hac > 127 A/m,
μre is no longer independent of
hac amplitude (at
f <
fx). For
f >
fx, all the plots converge into the low field plot exhibiting the same relaxation dispersion. Assuming a domain structure consisting of circumferential walls for these Co-based microwires, the magnetization process for
hac < 127 A/m is associated with reversible bulging of domain walls since these DWs are considered to be pinned to surface defects.
Figure 10.
Spectroscopic plots μre (f) for glass coated Co69.7Fe3.8B13Si11Mo1.5Ni1 microwire with hac amplitude as a parameter.
Figure 10.
Spectroscopic plots μre (f) for glass coated Co69.7Fe3.8B13Si11Mo1.5Ni1 microwire with hac amplitude as a parameter.
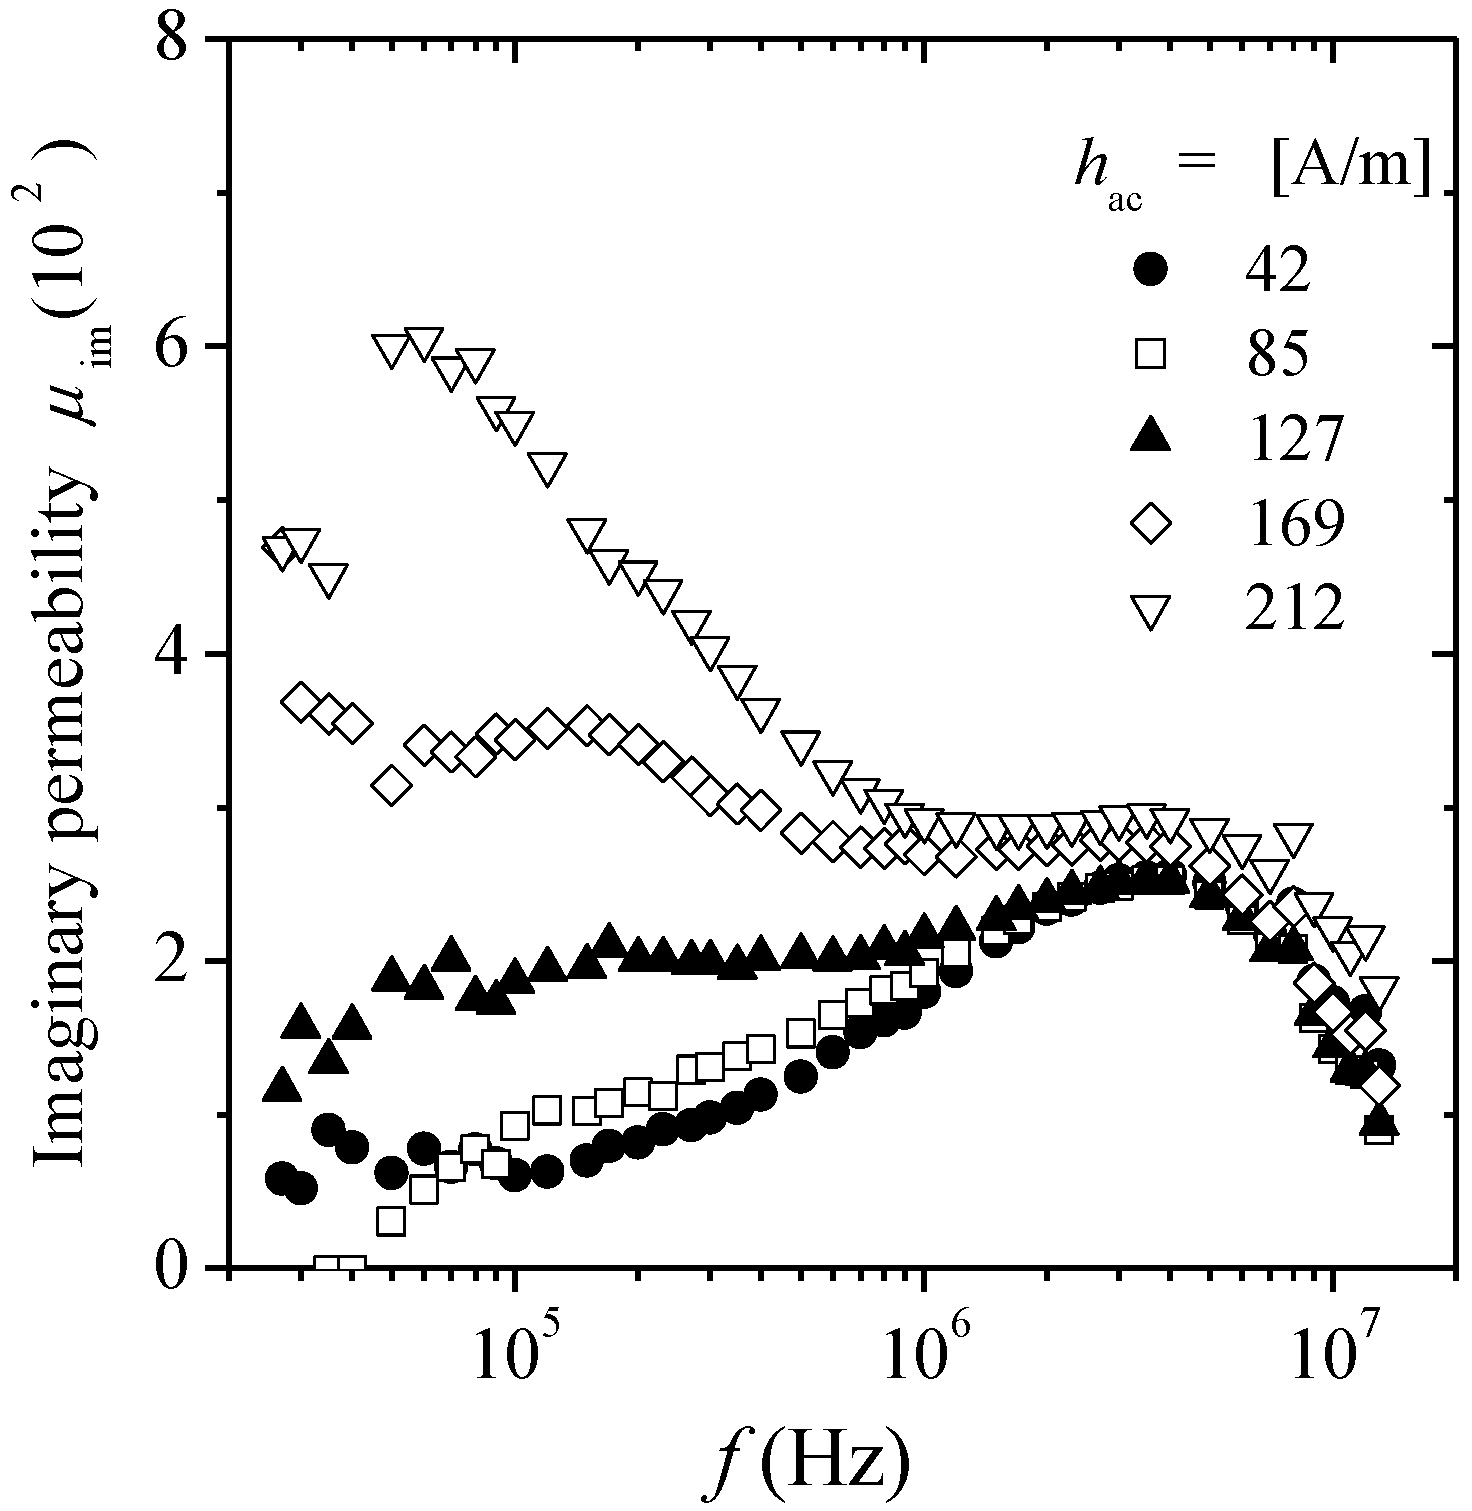
The frequency response of
μim for various
hac amplitudes is shown in
Figure 11. For
hac < 127 A/m, a single peak is observed, which is ascribed to the energy dissipated during the reversible domain wall bulging process, whereas for increasing
hac such peak remains, but the additional low-frequency peak corresponding to the hysteretic mechanism appears. The height of hysteretic peak increases as
hac increases, because the higher the field, the easier DWs displacement, for which larger energy dissipation occurs (compared with domain bulging) leading to the observed higher peaks for increasing
hac fields.
Figure 11.
Spectroscopic plots μim (f) for glass coated Co69.7Fe3.8B13Si11Mo1.5Ni1 microwire at various hac field values.
Figure 11.
Spectroscopic plots μim (f) for glass coated Co69.7Fe3.8B13Si11Mo1.5Ni1 microwire at various hac field values.
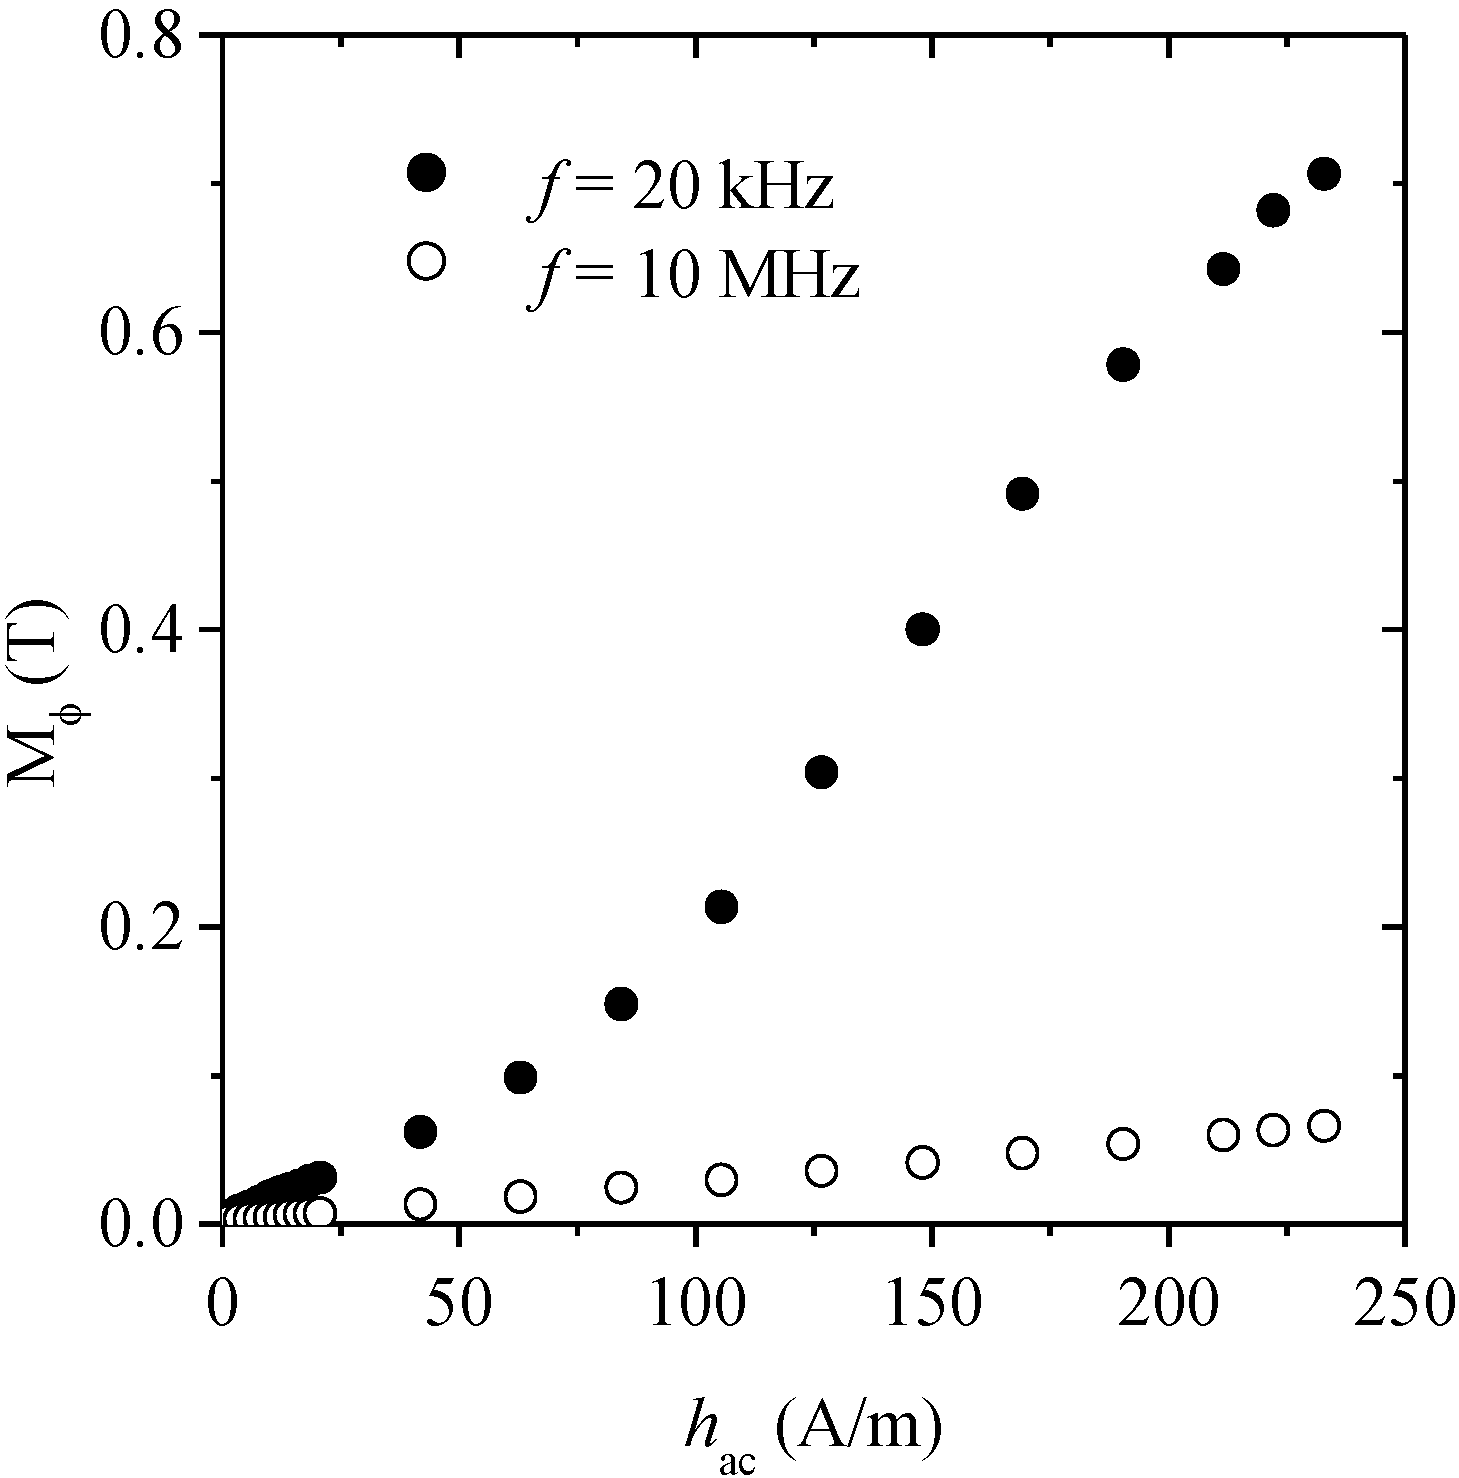
Circular magnetization curves M
φ (
hac) at two selected frequencies are shown in
Figure 12. The low frequency (
f = 20 kHz) curve exhibits the expected features of domain wall magnetization, such as a rather low initial susceptibility (for
hac below 100 A/m) followed by a marked increase in slope at about
hac = 100 A/m, together with a trend to saturation above 200 A/m. In contrast, the curve obtained at 10 MHz (high frequency) shows a linear tendency in agreement with a pure rotational magnetization process.
Figure 12.
Circular magnetization curves for glass coated Co69.7Fe3.8B13Si11Mo1.5Ni1 microwire at low (f << fx) and high (f >> fx) frequency values.
Figure 12.
Circular magnetization curves for glass coated Co69.7Fe3.8B13Si11Mo1.5Ni1 microwire at low (f << fx) and high (f >> fx) frequency values.
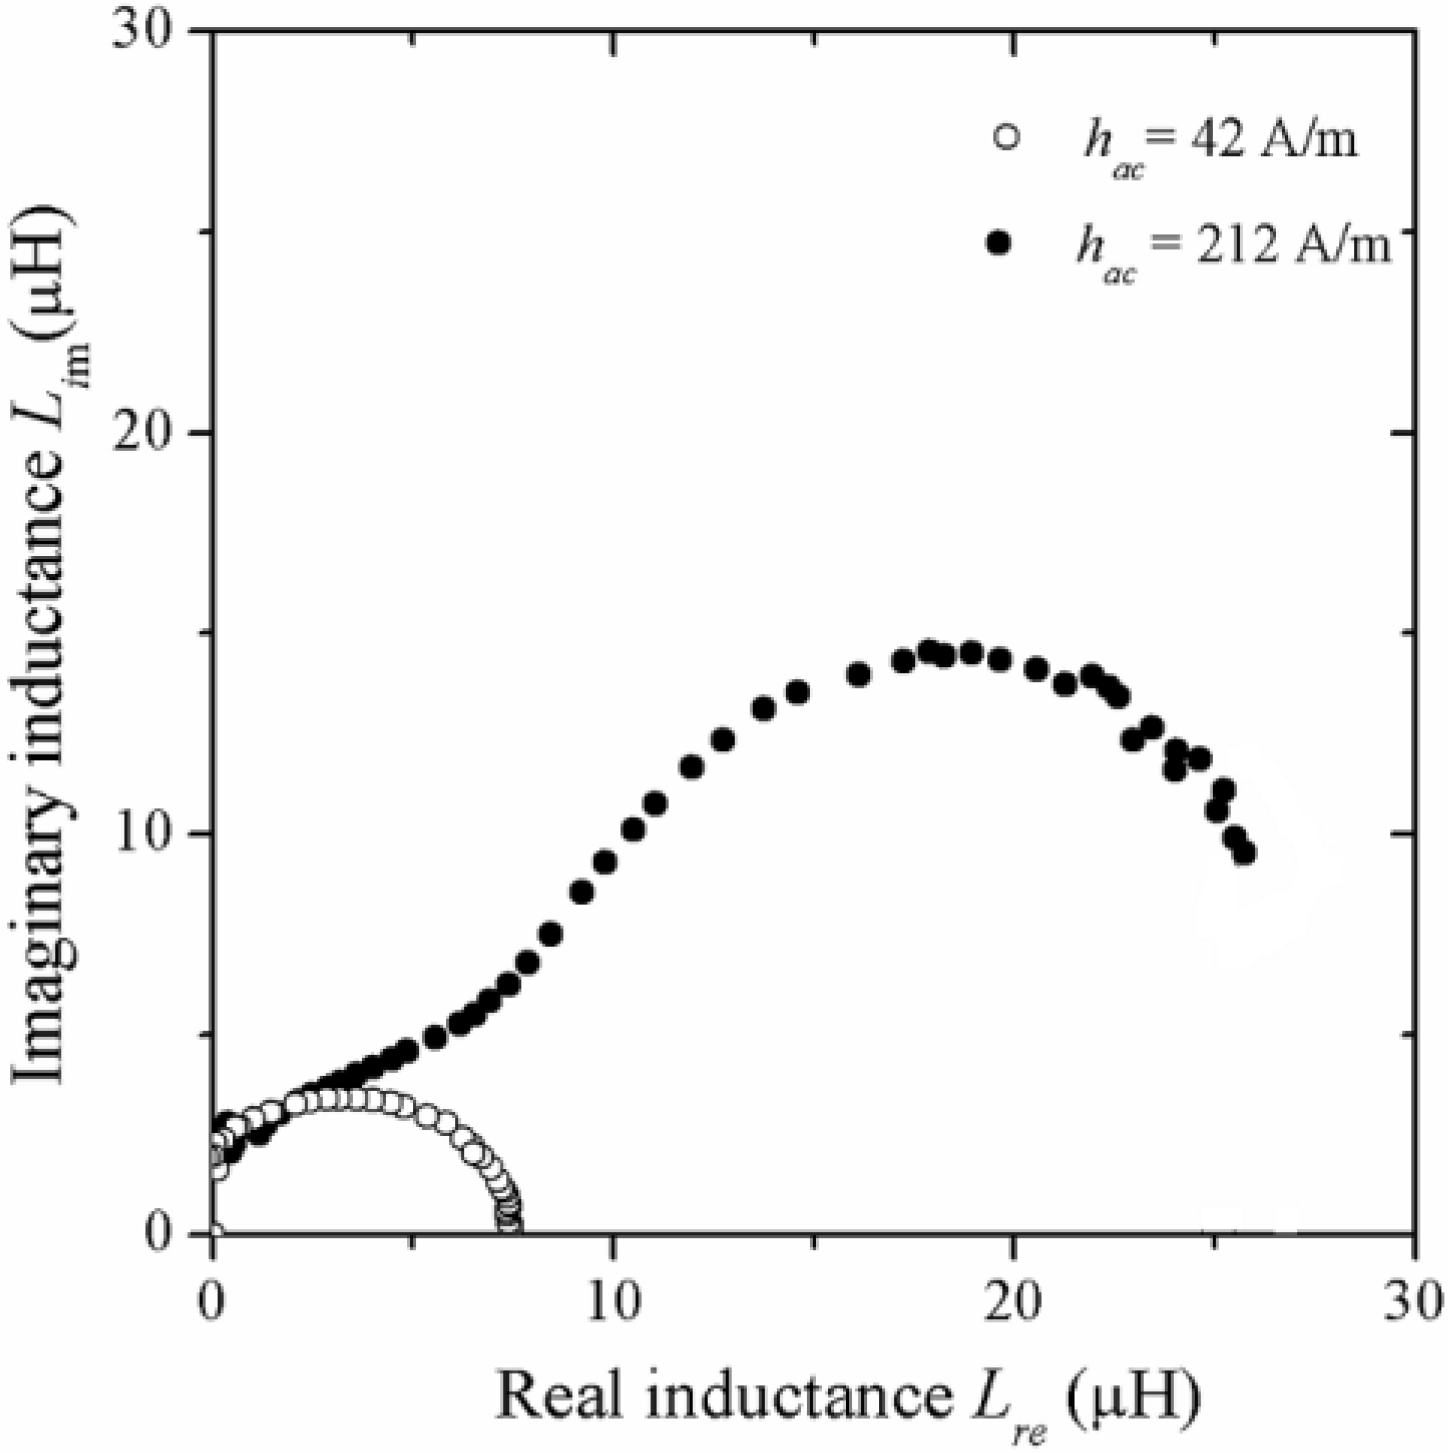
The Cole-Cole representation for the reversible bulging of DWs and the hysteresis process for the same glass coated Co
69.7Fe
3.8B
13Si
11Mo
1.5Ni
1 microwire is depicted in
Figure 13 for two distinct h
ac amplitudes of 42 A/m and 212 A/m. A well defined semicircle formation (each point obtained at a different frequency) is observed for
hac = 42 A/m with a diameter of 7.5 μH associated to the former magnetization mechanism, whilst for
hac = 212 A/m, two half-circles of different diameter are evident, the larger one being of 15 μH diameter and for which the irreversible displacement of DWs is attributed.
Figure 13.
Cole-Cole plots at different hac amplitudes for glass coated Co69.7Fe3.8B13Si11Mo1.5Ni1 microwire.
Figure 13.
Cole-Cole plots at different hac amplitudes for glass coated Co69.7Fe3.8B13Si11Mo1.5Ni1 microwire.
2.4. Biphase Wires
Recently, amorphous glass coated microwires have elicited considerable interest for the development of biphase microwires consisting of an amorphous soft magnetic metallic nucleus (obtained by Taylor-Ulitovsky technique) surrounded by a hard magnetic layer deposited by electrochemical process on the glass layer [
41]. This hard magnetic layer affords the control of the biphase microwires magnetic properties by means of its magnetic interaction with the soft magnetic nucleus through: (i) the modification of the amorphous wire easy axis of magnetization from radial to longitudinal orientation depending on the hard layer thickness, (
i.e., on the electrochemical deposition parameters, namely current density and electrochemical exposure time); (ii) the possibility for obtaining controllable magnetostatic or eventually exchange bias response (similar to the bias effect used in spin valves); and (iii) the tailoring of their magnetic domain formation and thus, their magnetic performance from non-hysteretic to bistable behavior [
42]. However, biphase systems entailing an amorphous wire nucleus (obtained by rotating water bath melt spinning method) have not yet been explored at all. The spectroscopy response for real and imaginary components of complex permeability for biphase wires composed of an amorphous wire nucleus of composition Fe
64Co
8B
19.2Si
4.8Ta
4 (140 μm diameter) and electrodeposited Co
90Ni
10 magnetic hard layers with variable thickness
t of 1.5 μm, 3 μm and 6 μm (attained by carefully control of exposure time to the electrodeposition process) is shown in
Figure 14. For the
μre(
f ) plot of
t = 0 μm (
Figure 14a), the reversible bulging of the magnetic DWs is manifested for increasing frequency
f values up to 10
3 Hz. This part of the real permeability curve corresponds to the initial permeability
μini of the soft magnetic amorphous wire core. Further increase in
f leads to relaxation of the reversible bulging mechanism at
f = 9 kHz , leaving the spin rotation as the only magnetization process active for
f >
fx. The hard layer thickness significantly affects the low-field reversible magnetization process of the soft core since
μini decreases from 16,738 (
t = 0) to 3,205 (
t = 6 μm). This marked reduction for
μini can be attributed to the increasing out-of-axis anisotropy, developed by the biphase wires with increasing hard layer thickness, as a consequence of the accumulation of mechanical stress appearing at the amorphous-wire/CoNi-layer interface, for which the thicker the layer, the higher the internal stress accumulated.
Alternatively , the imaginary
μim component (
Figure 14b) is associated with the magnetic losses (hysteresis, eddy current or power losses) [
25]. Consequently, the presence of the external hard layer significantly reduces the losses. The maximum in
μim is observed at frequency
fx for each biphase wire. The
fx exhibits an increasing tendency (
Figure 14b) from 9 kHz (
t = 0
μm) to 27 kHz (
t = 6
μm) and follows an inverse tendency with
t, which confirms the influence of the variable anisotropy on the spin rotation mechanism active for
f >
fx, for which the product
μrefx = constant is known as the Snoek’s limit [
26].
Figure 14.
Real and imaginary permeability spectra for biphase wires with hard layer thickness t (microns) as a parameter.
Figure 14.
Real and imaginary permeability spectra for biphase wires with hard layer thickness t (microns) as a parameter.
