Incremental Learning for Classification of Unstructured Data Using Extreme Learning Machine


1
Department of Computer Science and Engineering, SSN College of Engineering, Chennai 603110, India
2
Department of Computer Science and Engineering, PSG College of Technology, Coimbatore 641004, India
*
Author to whom correspondence should be addressed.
Algorithms 2018, 11(10), 158; https://doi.org/10.3390/a11100158
Submission received: 27 September 2018
/
Revised: 13 October 2018
/
Accepted: 16 October 2018
/
Published: 17 October 2018
(This article belongs to the Special Issue Algorithms for Decision Making)
Abstract
:Unstructured data are irregular information with no predefined data model. Streaming data which constantly arrives over time is unstructured, and classifying these data is a tedious task as they lack class labels and get accumulated over time. As the data keeps growing, it becomes difficult to train and create a model from scratch each time. Incremental learning, a self-adaptive algorithm uses the previously learned model information, then learns and accommodates new information from the newly arrived data providing a new model, which avoids the retraining. The incrementally learned knowledge helps to classify the unstructured data. In this paper, we propose a framework CUIL (Classification of Unstructured data using Incremental Learning) which clusters the metadata, assigns a label for each cluster and then creates a model using Extreme Learning Machine (ELM), a feed-forward neural network, incrementally for each batch of data arrived. The proposed framework trains the batches separately, reducing the memory resources, training time significantly and is tested with metadata created for the standard image datasets like MNIST, STL-10, CIFAR-10, Caltech101, and Caltech256. Based on the tabulated results, our proposed work proves to show greater accuracy and efficiency.
1. Introduction
Streaming data gets generated continuously in varied sizes from a wide variety of sources, which may include log files generated by customers using mobile or web applications, e-commerce purchases and information on social networks. These data are not well-organized like structured data, which has a predefined data model. The continuously arriving streaming data are rich in volume, variety, veracity, and velocity which must be processed over time incrementally. Classification of these data is a challenging task since they do not have class labels, but these data can be grouped to assign labels.
For the purpose of document classification, most of the existing algorithms consider only the distribution of the content words of the document. Seong-Bae Park and Byoung-Tak Zhang proposed the co-trained support vector machines [1,2] for unstructured document classification, which uses both the lexical and syntactic information for the classification of large-scale unstructured documents. A partially supervised learning algorithm, namely the co-training algorithm is used to create two separate views of the training data where a small number of labeled data is augmented by a large number of unlabeled data. The proposed co-training algorithm enhances the performance of document classification by making use of both the views and a large number of unlabeled documents. People express their emotions online using social media through tweets, questions and news headlines. These user emotions can be classified and used in applications such as sentiment retrieval and opinion summarization. Jun Li et al. [3] proposed an algorithm which introduces a multi-label maximum entropy (MME) model for emotion classification over short text. Rich features are generated by MME which models multiple emotion labels and valence scored by numerous users. L-BFGS (Limited-memory Broyden–Fletcher–Goldfarb–Shanno) algorithm is used along with MME to improve the robustness of the proposed method on varied-scale corpora. The user emotion classification results using MME shows an effective performance on real-world short text collections.
Clustering, also known as unsupervised learning [4], is the process of aligning objects into groups such that all similar data instances lie in the same group. Objects in the same cluster must have high intra-class similarity and low inter-class similarity.
All existing clustering algorithms use distance measures [5] to group the similar objects, these algorithms can cluster only numeric data and also the number of clusters must be known beforehand. Since the class labels of the online data are not known, and no prior knowledge about the clusters, the task of clustering becomes challenging.
Incremental Learning or online learning [6,7,8] aims to adapt the training models according to the arriving data without forgetting the acquired knowledge. Incremental Learning transfers the acquired knowledge from different batches to classify the test data. It helps to grow the network capacity by overcoming the problem of catastrophic interference [9] i.e., successive training of each batch of newly arrived data causes the network to forget the previously acquired knowledge partially or completely. This type of learning is applied to the data streams [10] to provide accurate results addressing the issues of, (1) limited computational resources such as memory and time and (2) the phenomenon of concept drift [11] (changes in the distribution of data which occurs in a stream over time). Figure 1 shows an example of incremental learning.
The existing clustering algorithms face a challenge in handling the requirements concurrently in the case of large, high-dimensional, unstructured data due to the time complexity involved. All these algorithms use the distance metric to compute the similarity between objects and produce an arbitrary clustering result depending on the initial setup. Since these algorithms can handle only structured data, a new clustering algorithm uCLUST [12] has been designed to overcome the above challenges and cluster unstructured big data.
Extreme Learning Machine(ELM) is a feedforward neural network [13,14] which randomly chooses input weights and creates a model for classifying test data samples using a single hidden layer. A discriminative clustering approach via ELM [15] is proposed by Gao Huant et al., which is an unsupervised learning framework and extends the classification rules into clustering. Three discriminative clustering approaches were designed, (1) weighted ELM (W-ELM) classifier which gradually maximizes the discrimination of the data and (2) the other two methods were based on Fisher’s Linear Discriminant Analysis (LDA). Among the two methods, one follows alternative optimization and the other adopts kernel k-means approach for clustering.
This paper proposes a framework CUIL which adopts Extreme Learning Machine (ELM) neural networks to implement the incremental learning. After clustering the unstructured data using uCLUST, the created clusters are fed into ELM to create a model for each subset arriving over time. Each model created incrementally is stored and using these models, the test data are classified. CUIL implements incremental learning avoiding the retraining of samples and reduces memory and training time by training samples in batches.
The rest of the paper is organized as follows. Section 2 discusses the works related to clustering of unstructured data and incremental learning. Section 3 introduces our proposed work CUIL under which the methodologies uCLUST and ELM++ are elaborated. The experimental analysis part is summarized in Section 4. The conclusion of the paper and the possible future work is discussed in Section 5.
2. Related Works
Many researchers have contributed their works in the area of classification of unstructured data and incremental learning [8]. This section highlights some works contributed in this area.
Bartosz Krawczyk, et al. conducted a research survey on the analysis of data streams using ensemble learning [16]. Data streams collected from the information system applications use learning algorithms which acts in dynamic environments. Ensemble learning plays an important role in data stream analysis, classification and regression tasks to handle the non-stationary environments. Various categories of ensemble learning [17] are available based on different criteria. For supervised learning task of classification, the available types of ensembles are, (1) stationary or non-stationary learning, (2) chunk or online ensembles, (3) active or passive ensembles addressing the drifts. Ensemble Learning also addresses advanced issues like class-imbalanced learning, novelty detection, active and semi-supervised learning and more complex data structures. Some of the open research problems not addressed are: (1) handling delayed information, (2) gradual drifts which are more complex to be detected than sudden changes, (3) considering background knowledge while classifying data streams, (4) ensemble pruning methods, and (5) handling big data and privacy issues.
Guo Haixiang, et al. contributed to a review paper which discusses the different methods of learning from class-imbalanced data [18] and their applications. Detection of rare events which potentially impact the society negatively is viewed as a prediction task in data mining and machine learning communities. Since these events occur rarely, they suffer from the problem of imbalanced data. Ensemble classifiers are used for the resampling of clinical data in the area of chemical and biomedical engineering, in case of high-dimensional data, feature selection techniques are adopted. The goal of the prediction in these tasks is basically profit-driven instead of accuracy-driven, which is known as cost-sensitive learning. Detection of rare events in the network log and unstructured data needs data cleaning and feature engineering processes, which are not addressed in this paper.
Sanjay Jain, et al. presented a study that gives insights on the natural requirements such as consistency and conservativeness [19] for incremental learning [20]. Learning from positive examples as well as from both positive and negative examples were analyzed to understand the natural requirements of incremental learning. A case study of regular pattern languages was analyzed to show how the learnability of the pattern languages gets affected by the conditions like consistency and conservativeness when using natural hypothesis spaces for learning. When considering the consistency, normalization of the iterative learners can be achieved in local consistency. In contrast, the capabilities of iterative learners get reduced in global consistency. The demands of the local and global conservativeness are equal when considering the iterative learners in case of learning from only positive examples. A global conservative learner can iteratively learn classes from positive and negative examples, whereas a local conservative learner cannot learn iteratively. The results got from the study helps to characterize the structure of typical classes which can be learned incrementally and also elaborates on uniform incremental learning methods [21].
K. Rajbabu, et al. proposed a novel method for extracting industrial information through multi-phase classification using ontology [22] of the unstructured documents. The efficiency of the existing information extraction approaches is unsuitable for domain-specific applications which demand semantic and contextual taxonomy. This proposed method performs a two-phase classification approach which extracts information based on feature weighting. The first phase performs a sentence classification followed by the phase of word classification. This converts the unstructured documents into enhanced directed acyclic graph (DAG)-based semi-structured text with enriched features. The categorical type of data features is transformed to handle heterogeneous textual features.
A novel algorithm named Pulce [23] was proposed by Dino Ienco and Ruggero G. Pensa for the positive and unlabeled (PU) learning in categorical data. An efficient classifier can be built by using both positive and negative examples, but this requirement is not satisfied in many domains. This paper proposes a new distance-based algorithm Pulce for Positive and Unlabeled learning of categorical data, which overcomes the availability of positive and negative examples. Pulce makes use of the intrinsic relationships between attribute values and overcomes the independence assumption used in Naive Bayes. Pulce uses the statistical properties of the data to learn a distance metric which is used in the classification task. Pulce achieves better prediction performances than the PU learning algorithms based on Naive Bayes.
Bhagat Singh Raghuwanshi and Sanyam Shukla proposed a class-specific extreme learning machine (CS-ELM) [24] which handles the imbalance problem in binary classes effectively. The class imbalance problem arises when the instances of the majority class are more in number than the minority class instances. The proposed method varies from the traditional methods like weighted ELM and class-specific cost regulation ELM (CCR-ELM). CS-ELM does not assigns weights to the training instances as done in weighted ELM. CCR-ELM computes the regularization parameters without considering class distribution and overlap, but in contrast, CS-ELM considers the above conditions to compute the same. CS-ELM shows a better performance than the traditional methods for binary class-imbalance with less computational overhead.
A meta-cognitive online sequential extreme learning machine (MOS-ELM) [25] was proposed by Bilal Mirza and Zhiping Lin which enables self-learning process by suitable learning strategies. This method was proposed for class imbalance and concept drift problems occuring in both binary and multi-class data streams. To unify various application specific OS-ELM (online sequential extreme learning machine) methods, a new adaptive window and single output update equation was designed. The performance of MOS-ELM outperforms the other available methods under the constraints of concept drifts and class imbalance.
3. Methodology
Unstructured data which constitutes 90% of the real-world data are difficult to classify since they do not have a predefined structure or labels. CUIL (Classification of Unstructured data using Incremental Learning) is an incremental model proposed for the classification of unstructured data.
3.1. Architecture Description
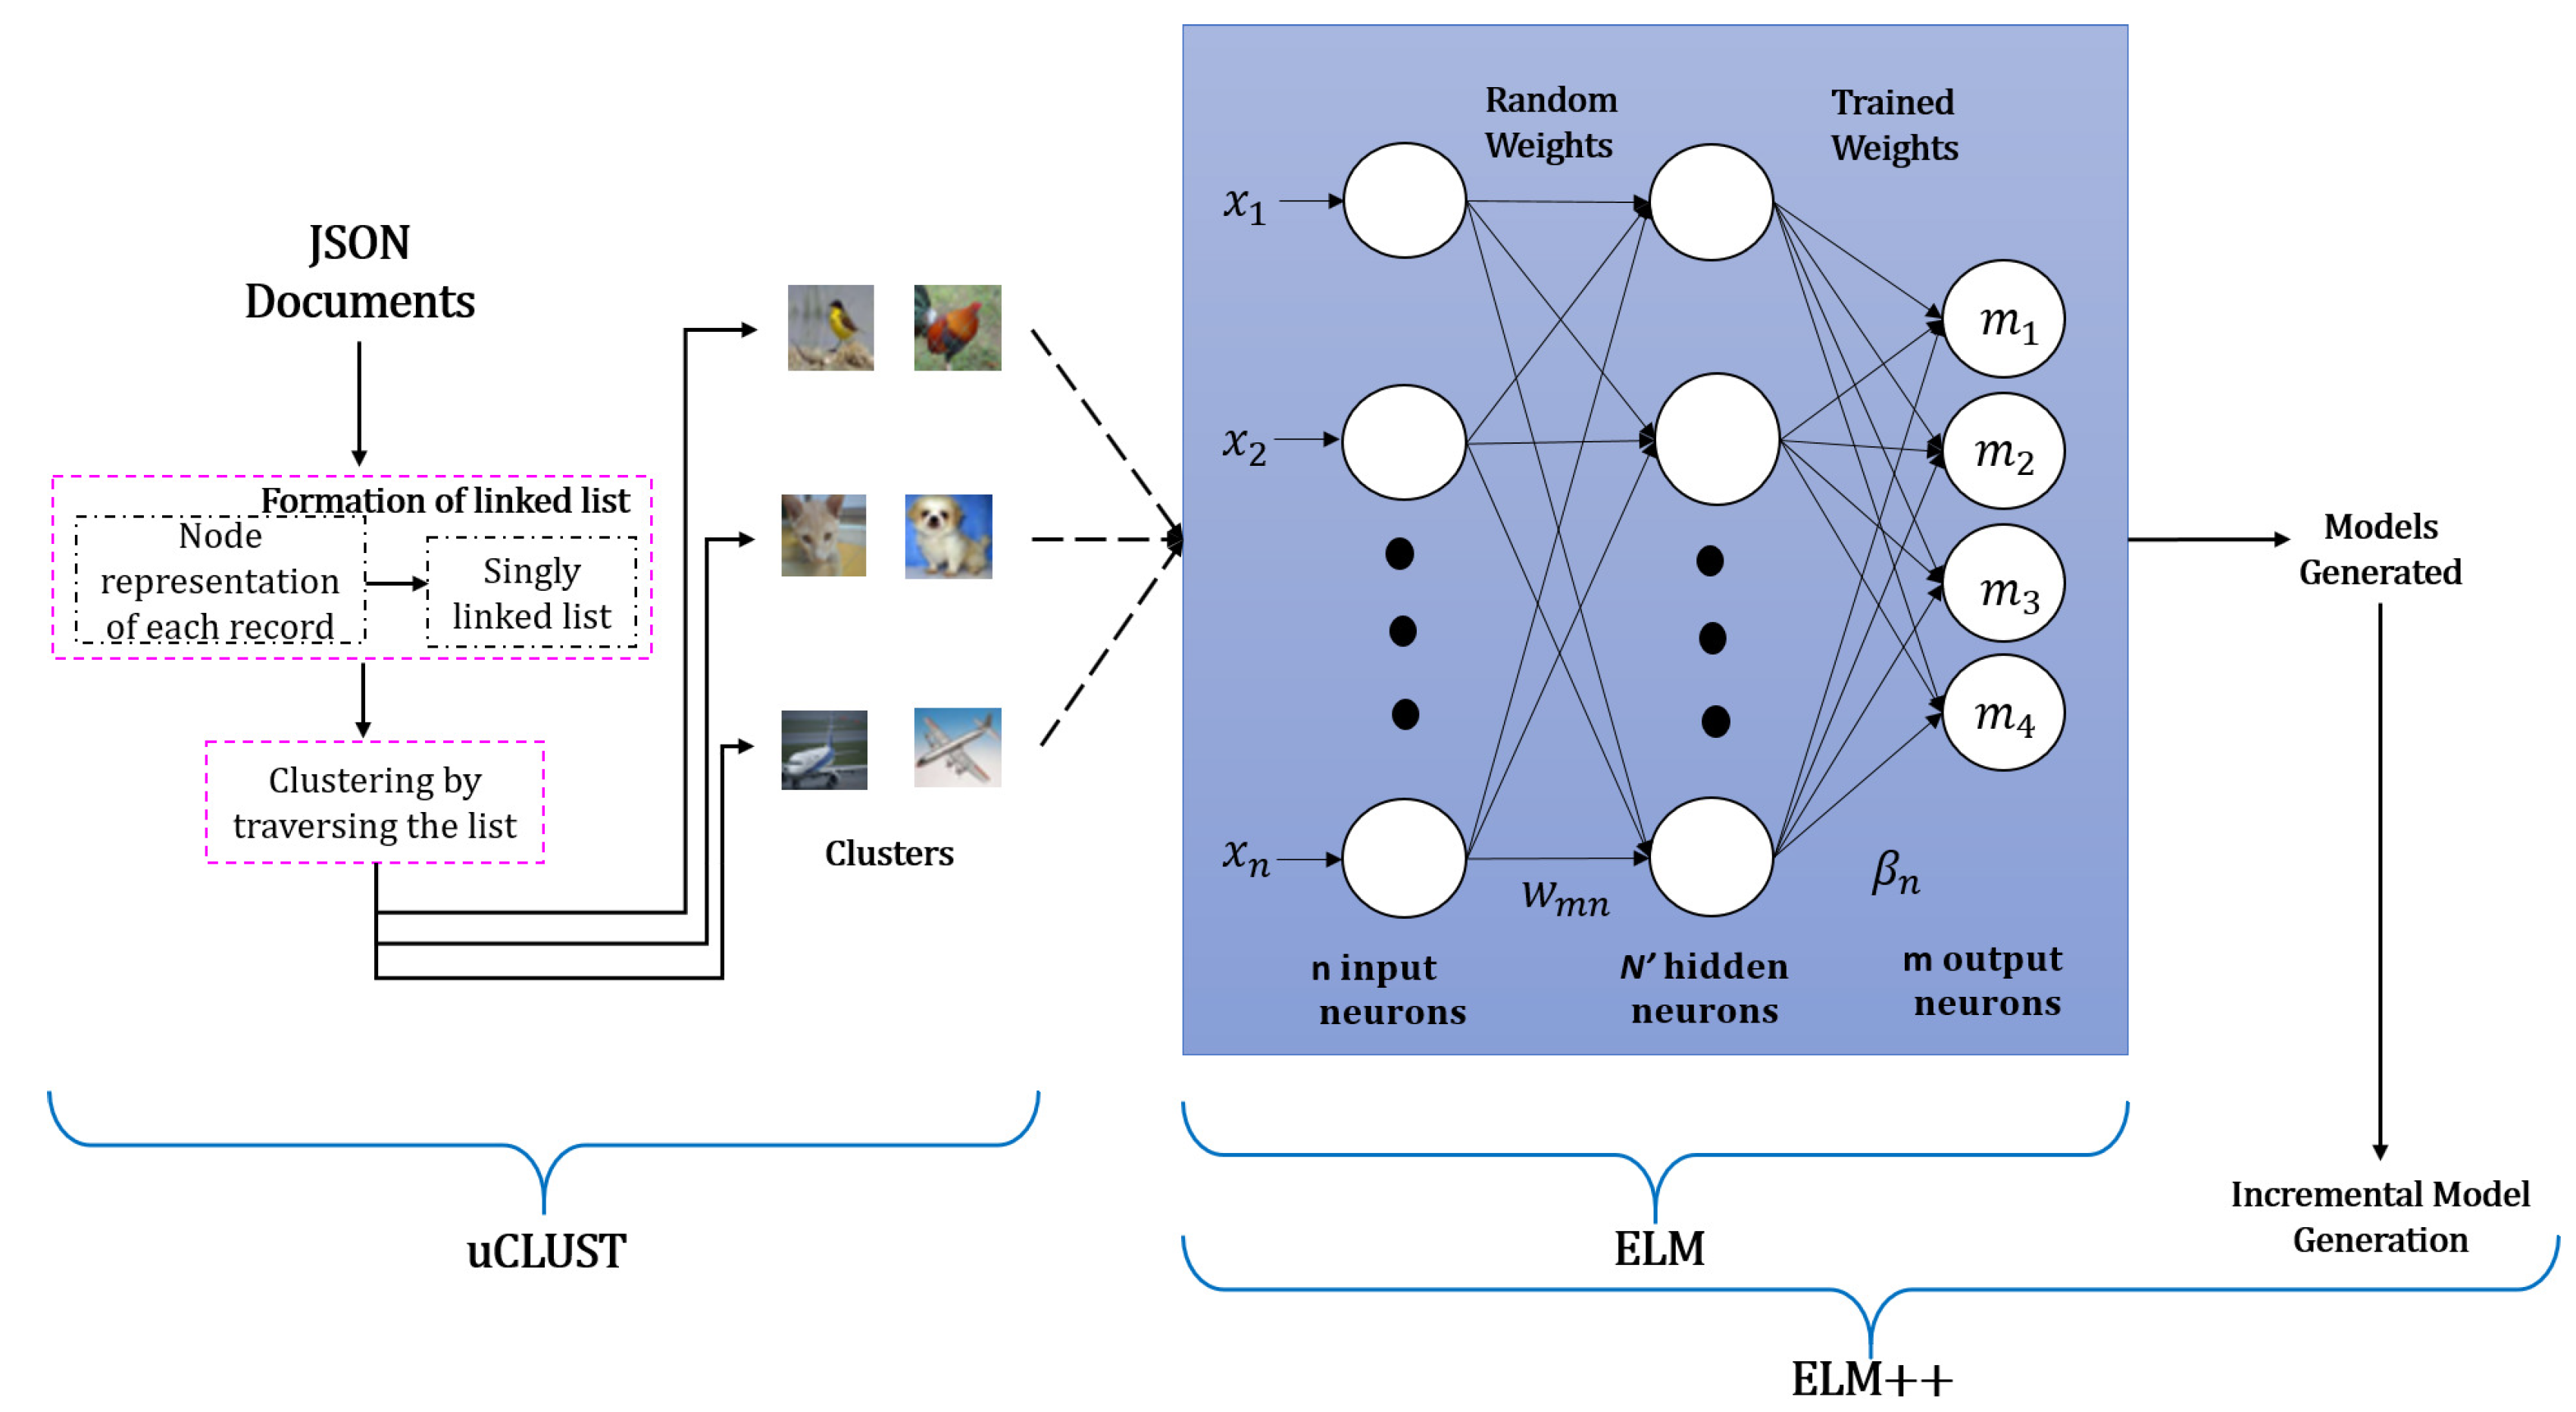
CUIL is designed in such a way that it classifies the unstructured data by combining two methods—uCLUST [12] and ELM++. CUIL provides uCLUST with the following inputs: clustering attributes and image metadata, which is in JSON format. This format is chosen over other formats like csv, xls as JSON supports unstructured format i.e., the fields of the records can be unordered. uCLUST segregates the unlabeled images into clusters by clustering the metadata based on the given attributes. Each image gets assigned to a cluster receiving a class label. These image metadata come in batches and images belonging to each batch gets clustered and assigned with a class label. The labeled images received from uCLUST is given as input to ELM++, which incrementally creates a model for each batch. For example, if they are n batches, then n models are created and these models are used for classifying the upcoming unlabeled test data. Figure 2 shows the architecture of CUIL, detailed explanation about uCLUST and ELM++ are available in Section 3.2 and Section 3.3 respectively.
3.2. uCLUST
Clustering is an unsupervised learning process which groups together similar objects in the same cluster. Most of the clustering algorithms require the user to specify the number of clusters to be formed priorly. These algorithms work well for numeric data by using the distance measures to compute the clusters i.e., group similar objects together in a cluster. In contrast, to cluster the categorical data, there exists uCLUST [12], an algorithm for clustering unstructured JSON documents. Metadata of images/audio/video/text available in the form of JSON documents is given as input to the uCLUST algorithm.
3.2.1. Algorithm of uCLUST
The clustering algorithm uCLUST does two tasks: (1) Formation of linked list, (2) Clustering by traversing the linked list.
(A) Formation of the Linked List
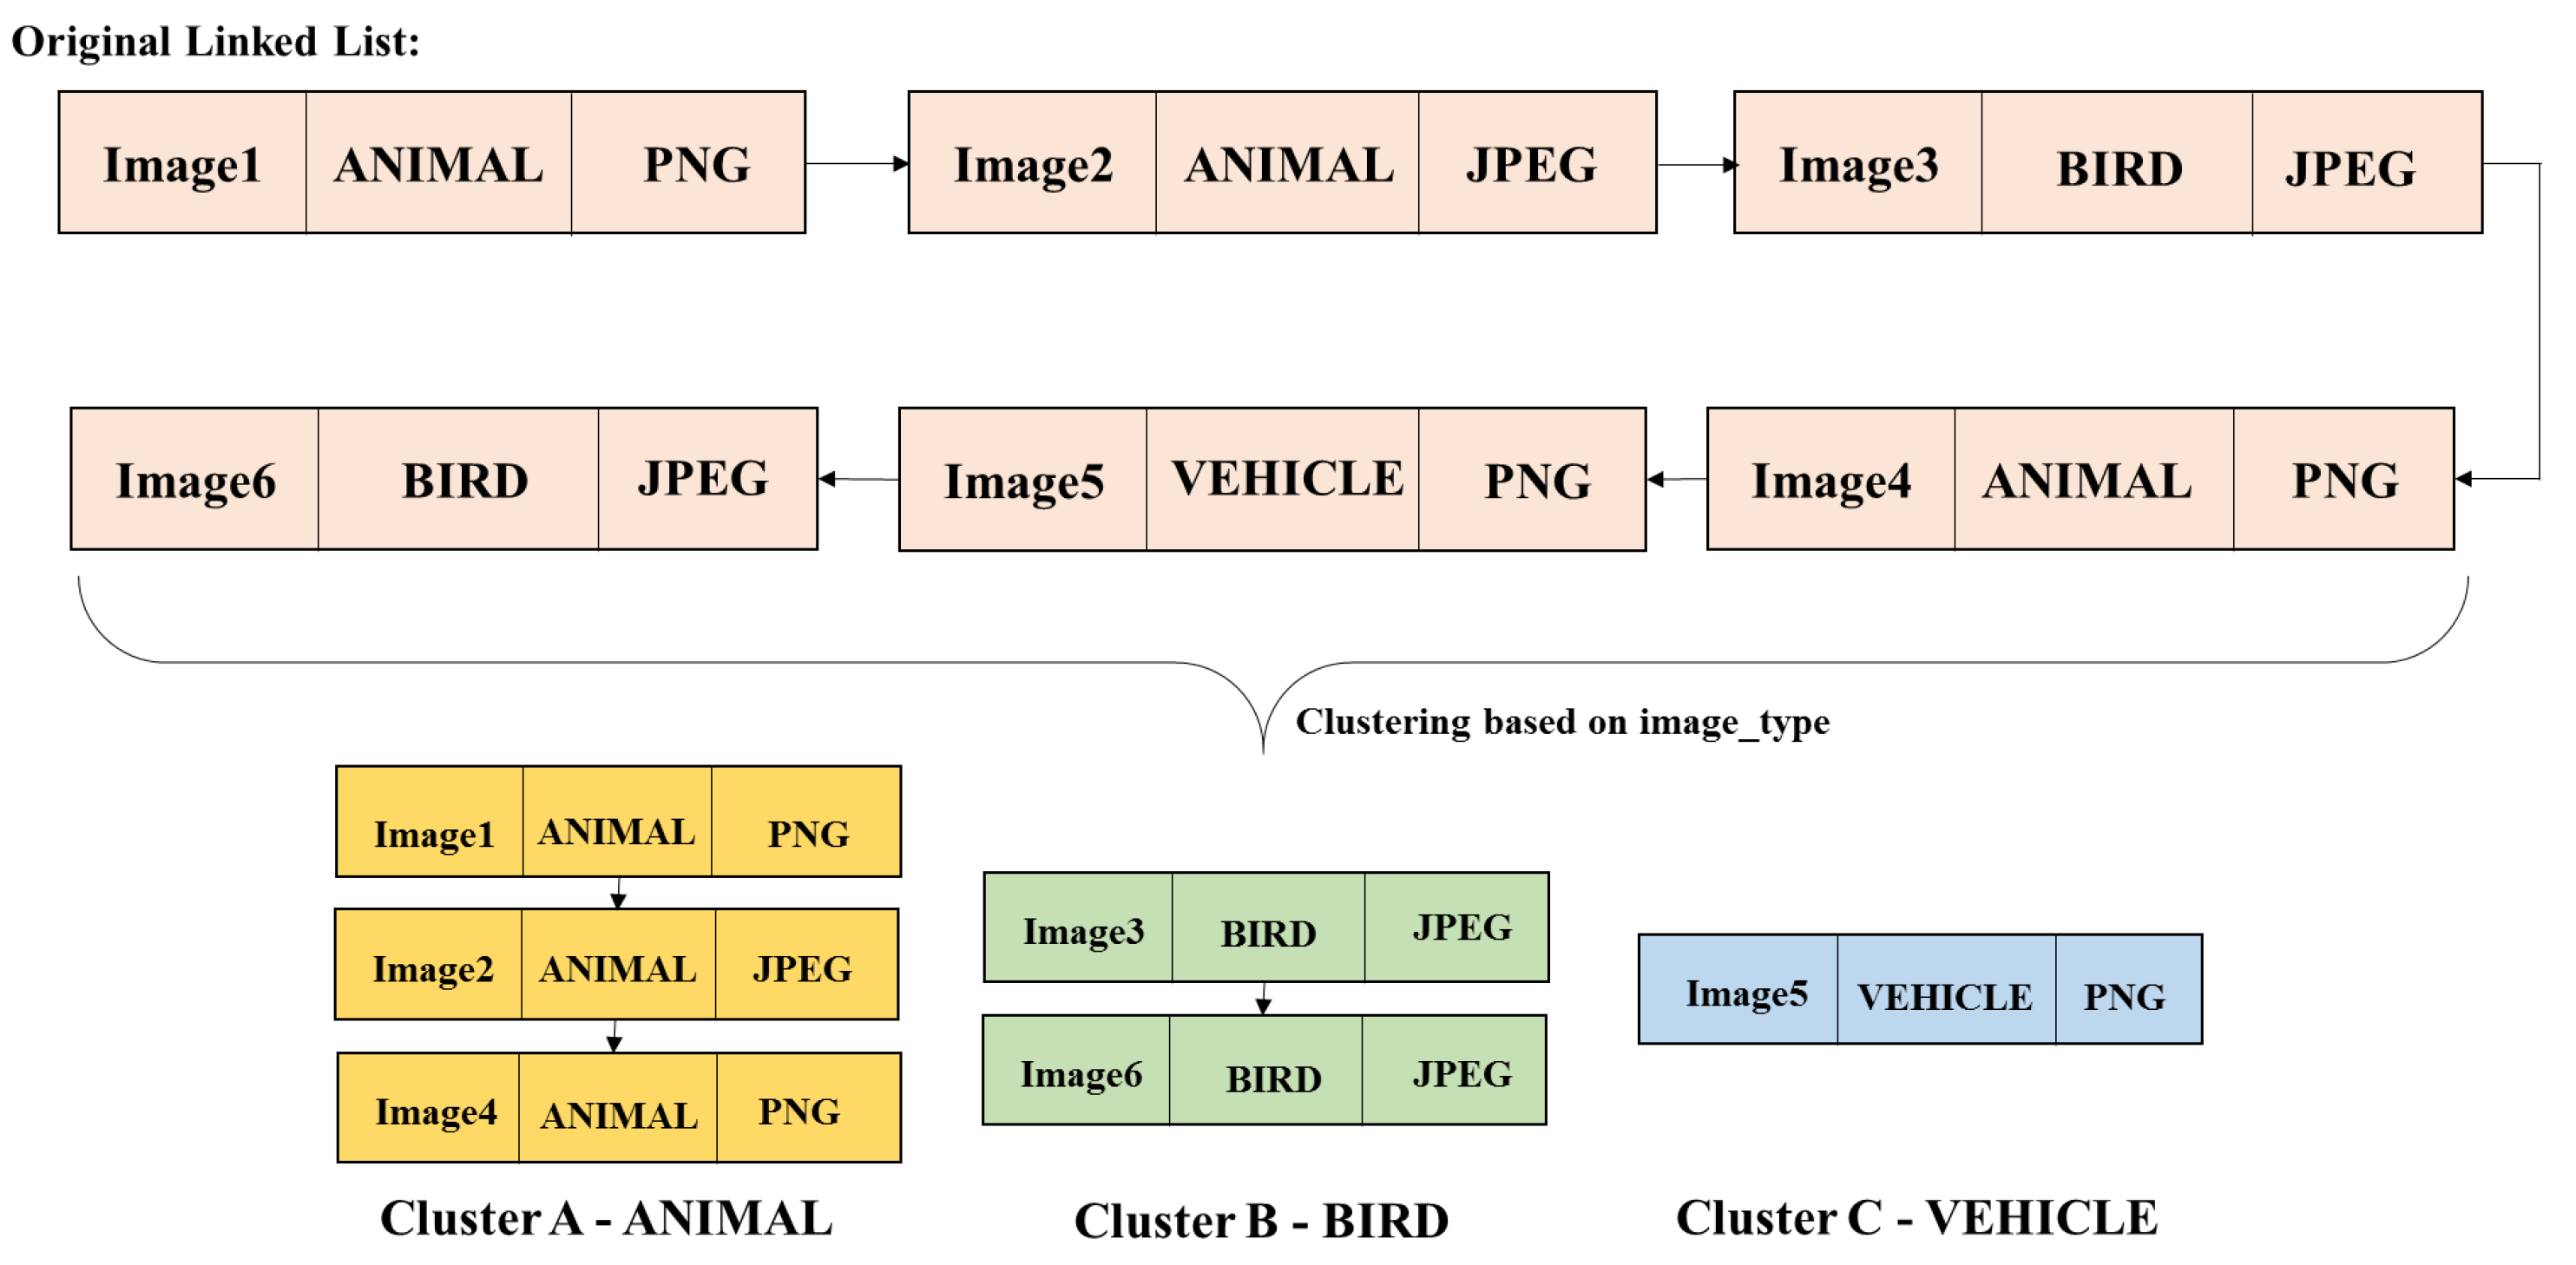
uCLUST clusters each record in JSON document based on the categorical attribute present in it, and uses the concept of linked lists to cluster the objects. The uCLUST algorithm gets the clustering attributes as input from the user, and searches the value of the clustering attributes in each record. For each record, it creates a node with fields recordID and the value of the clustering attributes. For example, if image metadata in JSON format is given as input with clustering attributes type (ANIMAL/ BIRD/ VEHICLE/ OTHERS) and format (PNG/ JPEG), the node for each record created is shown in Figure 3, which represents a record in the JSON document of the image metadata. In Figure 3, the node holds the unique ID of the record (Image1), the type of the image (ANIMAL) and the format of the image (PNG). If the clustering attribute of a record holds multiple values, then for each value a separate node is created for the same record.
After extracting the values of the clustering attributes from each record, the nodes formed is appended together to form a single linked list. Figure 4 shows the linked list for the JSON document of the image metadata. Algorithm 1 details the step for the formation of the linked list in uCLUST.
(B) Traversal of the Linked List
After the formation of the linked list, the clustering process is done by traversing the list. For each clustering attribute specified, traverse all the nodes in the created list. The first distinct value of the clustering attribute is retained as such in the linked list. Whenever a new distinct value for the clustering attribute is found, the corresponding node is deleted from the original list, and a new linked list is formed for that attribute value. If a value in the node does not occur for the very first time, then append the node to the linked list representing the corresponding attribute value. Each linked list formed after the traversal represents a distinct value of the clustering attribute thus forming the clusters. These clusters group the records with similar metadata. The steps carried out during the traversal of the linked list is shown in Algorithm 2.
| Algorithm 1: Formation of the linked list. |
 |
| Algorithm 2: Clustering by traversing the linked list. |
 |
3.2.2. Illustrative Example
A sample JSON document consisting of the image metadata is given as input, refer Figure 5 which has the following attributes: {image_type, image_name, size, depth, format, total_pixel, captured_date, captured_by}. The attributes image_type and format are accounted for clustering. The former attribute has four values: ’ANIMAL’ or ’BIRD’ or ’VEHICLE’ or ’OTHERS’ and the latter has two values: ’PNG’ or ’JPEG.’
Figure 6 shows the clustering result obtained for the above JSON document by using image_type as clustering attribute. uCLUST creates three clusters comprising of ’ANIMAL,’ ’BIRD’ and ’VEHICLE’ and Figure 7 shows the clusters formed further from uCLUST by using the clustering attribute format. The final clustering results show four clusters as follows: (1) image of type ’ANIMAL’ in ’PNG’ format, (2) image of type ’ANIMAL’ in ’JPEG’ format, (3) image of type ’BIRD’ in ’JPEG’ format and (4) image of type ’VEHICLE’ in ’PNG’ format.
3.3. ELM++
Incremental Learning [26] is a dynamic technique of supervised and unsupervised learning [27] where input data are trained to an individual model as and when it comes. The input data are used continuously to extend the knowledge of the existing model. The training of data in batches does not demand the retraining of the previous data, and also the previously acquired knowledge is never forgotten. Extreme Learning Machine (ELM) [28,29,30] uses single-hidden layer which is randomly assigned and never updated. ELM works at extremely fast, discovering the complex non-linear relationships between input and output. Algorithm 3 explains the working of ELM. When large volume of images come in batches, ELM expects to accumulate these images together and train them at once to create a model. When several batches arrive over time, it becomes a tedious task. On the other hand, ELM++ incrementally trains the images in batches and creates an individual model for each batch.
| Algorithm 3: Extreme Learning Machine (ELM). |
| Input: Training set X with N images; n input neurons-image size: height x width; hidden neurons; m output neurons; Output: Model generated with parameters (output matrix (), weight matrix (W), bias (b)) 1. Input N distinct samples and an activation function , where are the input features (pixel intensities), and . 2. Generate random weights based on the number of hidden neurons used, which connects the input and hidden layer. 3. Calculate the output of the hidden layer using: 4. Calculate the output matrix for the output layer using the formula: |
| where |
| , |
| and |
3.3.1. Algorithm of ELM++
ELM++ trains each batch incrementally to create individual models. Along with the model parameters, it also computes and stores the intensity mean of each class of images in the arrived batch. Algorithm 4 explains the working concept of ELM++ and also how the class intensity mean is computed and stored as an object, which are later used for the purpose of incremental learning.
After creating the trained models incrementally, ELM++ classifies the upcoming unlabeled test images by combining the generated models. Algorithm 5 explains the procedure of choosing the right model for classifying the test images. ELM++ chooses a model for finding out the class labels of the test images by comparing the intensity mean of the test image with the stored intensity mean of each trained class. If the difference in the intensity means of the test image and a class is less than a defined threshold, then the test image is classified with the model with which the corresponsing class was trained. Sometimes, an image may be classified using more than one model, i.e., the intensity mean of the test image may be less than the intensity mean of more than one trained class. In such cases, the test image is classified with all the models corresponding to the matched classes. The classified results of all the models are combined using Algorithm 6.
| Algorithm 4:ELM++: Incremental Model Generation. |
 |
| Algorithm 5:ELM++: Incremental testing. |
 |
3.3.2. Illustrative Example
Images belonging to batch A are trained using the ELM neural network using which model A is created. Similarly, images in batch B are trained to create model B. The mean of the images in a specific class is computed and stored. In ELM++, these models are combined. The mean of each test image is computed and matched against every class mean. The test image is classified using the model with which the class mean matches. If the mean of the test image matches with two models, then the image is tested using those two models, and the results are combined.
Figure 8 shows the individual model created by ELM for each batch. After learning and creating the models for two batches (batch A, batch B), ELM++ creates two objects which contains three attributes ’class, mean and model’ values. When a test image arrives, its intensity mean is calculated and is checked with the values available in stored objects. As in Figure 9, consider if the mean of the test image is 0.53209, ELM++ checks the attribute value (mean) of the objects and based on the threshold value (0.01), it chooses a model whose difference in intensity is ± threshold from the image intensity. So, for test image , it classifies the image with model M2 since the class intensity mean of the model is 0.54271, which lies between the range (0.53209 ± threshold). Similarly for test image , if the intensity mean is 0.44372 and threshold = 0.01, ELM++ classifies the image using both models M1 and M2 since they have a class intensity mean of 0.45627 and 0.46211 respectively, which lies within the range (0.44372 ± threshold). The classified results of by both the models M1 and M are combined using Algorithm 6.
| Algorithm 6:ELM++: Combining the classified results. |
 |
4. Results and Discussion
4.1. Dataset Description
Experiments were done under two scenarios to estimate the performance of CUIL. The standard datasets like MNIST, STL-10, CIFAR-10, Caltech101 and Caltech256 were used to conduct the experiments. Table 3 lists the details of the above-mentioned datasets.
4.2. Scenario 1
Scenario 1 creates a metadata for the standard dataset MNIST which is clustered using uCLUST and compares the performance of ELM++ with existing incremental learning algorithm Learn++ [31]. MNIST dataset contains 10 classes representing digits 0-9. Metadata is created for the dataset with attributes image_type, height, width, number. This metadata of images is given to the clustering algorithm uCLUST which clusters these images into 10 labeled clusters. Later, these labeled clusters were divided into 6 training sets (S1–S6) and 1 test set Each train set holds images belonging to classes 0 through 9, with 200 images in each class. Train set S2 will hold different images from S1. Train set S3 will hold images that are not present in S1 and S2, and so on. Test set contains images from all these 10 classes. Each train set was trained incrementally using ELM++ to create an individual model. When the test set is classified using the model creates by S1, an accuracy of 72% is obtained. When the test set is classified by combining models S1 and S2, the accuracy increases to 78.2%. By combining all these models S1–S6, the classification of the test images gets increased to 94%. The performance of ELM++ was compared with the existing algorithm Learn++. Table 4 and Figure 10 shows the performance comparison between Learn++ and ELM++ for MNIST dataset
4.3. Scenario 2
Scenario 2 applies CUIL to the standard image datasets like STL-10, CIFAR-10, Caltech101 and Caltech256 and computes the time taken to classify the test images. Using the above-mentioned datasets, 107,647 unlabeled images were collected. 95,000 images were separated for the training process, remaining for testing. The metadata information of the training images was accumulated into a JSON document and each record represents an image. The JSON document is given as input to uCLUST along with the clustering attributes image_type, format based on which eight clusters got formed. According to the clusters formed for the input metadata, the unlabeled images are grouped using the identity of each image (image_name). Then these grouped images are trained incrementally using ELM++ to create models. Then the test images are classified using the incremental models.
Table 5 lists out the accuracy obtained in testing images when incremental models are created for 2, 4 and 8 clusters using ELM++. When the JSON document is clustered with the clustering attribute format, 2 clusters are formed (PNG, JPEG) where model M1 trains one cluster(PNG) and model M2 trains one cluster (JPEG). Incremental testing is done on clusters 1 and 2 using the two models generated. When the clustering attribute image_type is used, four clusters are formed (ANIMALS, BIRDS, VEHICLES and OTHERS) where model M1 trains two clusters(ANIMALS and BIRDS), model M2 trains one cluster (VEHICLES) and model M3 trains one cluster (OTHERS). Similarly, when the clustering attributes image_type, format are used, eight clusters were formed, where model M1 trains four clusters, model M2 trains two clusters and model M3 trains two clusters.
Table 6 lists out the performance time of CUIL. The table lists the time taken by uCLUST for forming the clusters according to the specified attributes and the training, testing time of ELM++. uCLUST is first applied on the metadata to form clusters (number of records is 107,647), on which the training (95,000) is done by ELM++. Training time includes the time taken by ELM++ to create the training models. Testing of unlabeled images is done only using the generated models. So, testing time does not involve the usage of uCLUST and involves only the time taken to classify the labels of the images using the models generated. The table shows that the testing time reduces when compared to the training time irrespective of the number of clusters formed. The table lists the time taken by CUIL under three cases: (1) using the clustering attribute format in which two clusters were formed, (2) using the clustering attribute image_type in which four clusters were formed, (3) using the clustering attribute format, image_type in which eight clusters were formed.
4.4. Statistical Inference
The most popular statistical test for machine learning algorithms is resampled paired t-test and is used to measure the performance of CUIL over the algorithm Learn++. The total available samples is divided into train set and test set . The train set is trained using both the algorithms Learn++ and ELM++ and the test set is used to test. Six sets were conducted for both algorithms and the proportion of misclassified samples were calculated. The mean difference and standard deviation are calculated using the misclassified samples. Using the equations and , the value of T is calculated.
Let us test the null hypothesis that CUIL is equivalent to Learn++ against the alternative hypothesis that CUIL is better that Learn++. Using the Table 7, we calculated mean difference as , standard deviation as and T value as . Since the calculated T value is greater than t-tabled value at 5% level of significance (), we reject and accept , i.e., CUIL is better than Learn++.
4.5. Discussions
uCLUST algorithm is checked with the following comparative parameters: (1)Homogenity—defined as all of the clusters obtained, as a result of clustering that contain only data points which are members belonging to a single class, then the clustering algorithm is said to be homogeneous, (2) Completeness—defined as if all the data points of a given class belongs to the same cluster as a result of clustering, then the clustering algorithm is said to be complete, and (3) V-measure—defined as the harmonic mean between homogenity and completeness, calculated using . The values got for our model are, (1) homogenity(uCLUST) = 0.98, (2) completeness(uCLUST) = 0.99 and (3) V-measure(uCLUST) = 0.985.
The performance of uCLUST is compared with the clustering algorithm FDCA (Fast Density Clustering Algorithm) [32] for clustering unlabeled MNIST handwriting number images. FDCA uses symmetric complex wavelet transformation to evaluate the similarity among the unlabaled number images and segregate them as clusters. For MNIST dataset, FDCA gives a performance accuracy of 89.8% while uCLUST gives a clustering accuracy of 99%. The advantage of uCLUST over FDCA is the use of unstructured JSON metadata for representing the images, while FDCA uses complex wavelet functions which leads to complexity and more computational cost.
The key facts of using incremental algorithm ELM++ are, (1) the feedforward neural network ELM requires less time to train a model even in case of large number of hidden neurons when compared to other neural network algorithms like backpropagation, as ELM does not undergo any iterations for finding the trained weights. ELM is resistant to overfitting, except in case of very small datasets. As long as there is enough memory space to calculations, ELM provides good performance accuracy as the training sample increases and (2) since our experiments deal with very large dataset and to overcome the memory requirement of ELM, we have proposed and tested the incremental learning algorithm ELM++ which trains each batch of arriving data independently to create individual models, which avoids the retraining of previous batch data and remembers the previously learned information. To classify the test images, these generated models are combined overcoming the memory space requirement.
5. Conclusions
Classification of unsupervised data is a challenging due to their variability and missing of labels. The proposed work CUIL overcomes these challenges by combining the methods of uCLUST and ELM++. uCLUST clusters the unsupervised metadata of the images based on which the unlabeled images are grouped. The grouped images are incrementally trained using ELM++ to create individual models. The test images are then classified using the incrementally created models. CUIL shows better performance accuracy than individual testing results.
Our proposed work (CUIL) works better than the existing algorithm Learn++, because of these reasons, (1) CUIL supports classification of structured and unstructured data while Learn++ supports only structured data, (2) CUIL uses a single classifier ELM whereas Learn++ uses multiple classifiers and majority voting scheme to classify the data, (3) training time decreases in CUIL as it uses feed-forward ELM network which does not involve any iterations, whereas Learn++ uses neural networks which involves iterations for back propagating the errors, (4) testing time decreases in CUIL as uCLUST clusters unstructured data with minimal time and single classifier ELM is used, whereas Learn++ uses multiple classifiers.
Every model has some kind of limitation, as so ELM++ has these as the limitations, (1) difficulty in fixing the random weights by trial and error method until the desired accuracy is achieved for the training dataset and (2) difficulty in choosing the number of hidden neurons i.e., higher accuracy is achieved when the number of hidden neurons increases. Our proposed work addresses the problem of class-imbalance and the future work is to redesign the model removing the above said limitations, address the problem of concept drift and to test the performance of CUIL for unstructured text documents.
Author Contributions
Conceptualization, S.M. and S.J.; Formal analysis, S.M.; Methodology, S.M. and S.J.; Software, S.M.; Supervision, S.J. and J.L.S.; Writing—original draft, S.M.; Writing—review and editing, S.J.
Funding
This research received no external funding
Conflicts of Interest
The authors declare no conflict of interest.
References
- Park, S.B.; Zhang, B.T. Co-trained support vector machines for large scale unstructured document classification using unlabeled data and syntactic information. Inf. Process. Manag. 2004, 40, 421–439. [Google Scholar] [CrossRef] [Green Version]
- Orru, G.; Pettersson-Yeo, W.; Marquand, A.F.; Sartori, G.; Mechelli, A. Using Support Vector Machine to identify imaging biomarkers of neurological and psychiatric disease: A critical review. Neurosci. Biobehav. Rev. 2012, 36, 1140–1152. [Google Scholar] [CrossRef] [PubMed]
- Li, J.; Rao, Y.; Jin, F.; Chen, H.; Xiang, X. Multi-label maximum entropy model for social emotion classification over short text. Neurocomputing 2016, 210, 247–256. [Google Scholar] [CrossRef]
- Xu, D.; Tian, Y. A comprehensive survey of clustering algorithms. Ann. Data Sci. 2015, 2, 165–193. [Google Scholar] [CrossRef]
- Bora, D.J.; Gupta, D.A.K. Effect of different distance measures on the performance of k-means algorithm: An experimental study in matlab. Int. J. Comput. Sci. Inf. Technol. 2014, 5, 2501–2506. [Google Scholar]
- Gepperth, A.; Hammer, B. Incremental learning algorithms and applications. In Proceedings of the European Symposium on Artificial Neural Networks, Computational Intelligence, and Machine Learning, Bruges, Belgium, 27–29 April 2016. [Google Scholar]
- Joshi, P.; Kulkarni, P. Incremental learning: Areas and methods-a survey. Int. J. Data Min. Knowl. Manag. Process. 2012, 2, 43–51. [Google Scholar] [CrossRef]
- Losing, V.; Hammer, B.; Wersing, H. Incremental on-line learning: A review and comparison of state of the art algorithms. Neurocomputing 2018, 275, 1261–1274. [Google Scholar] [CrossRef] [Green Version]
- Sarwar, S.S.; Ankit, A.; Roy, K. Incremental learning in deep convolutional neural networks using partial network sharing. arXiv, 2017; arXiv:1712.02719. [Google Scholar]
- He, H.; Chen, S.; Li, K.; Xu, X. Incremental learning from stream data. IEEE Trans. Neural Netw. 2011, 22, 1901–1914. [Google Scholar] [CrossRef] [PubMed]
- Kim, Y.; Park, C.H. An efficient concept drift detection method for streaming data under limited labeling. IEICE Trans. Inf. Syst. 2017, 100, 2537–2546. [Google Scholar] [CrossRef]
- Prasad, D.V.; Madhusudhanan, S.; Jaganathan, S. uCLUST—A new algorithm for clustering unstructured data. ARPN J. Eng. Appl. Sci. 2015, 10, 2108–2117. [Google Scholar]
- Fontenla-Romero, O.; Perez-Sanchez, B.; Guijarro-Berdinas, B. An incremental non-iterative learning method for one-layer feedforward neural networks. Appl. Soft Comput. 2017, 70, 951–958. [Google Scholar] [CrossRef]
- Ding, S.; Zhao, H.; Zhang, Y.; Xu, X.; Nie, R. Extreme machine learning: Algorithm, theory and applications. Artif. Intell. Rev. 2013, 44, 103–115. [Google Scholar] [CrossRef]
- Huang, G.; Liu, T.; Yang, Y.; Lin, Z.; Song, S.; Wu, C. Discriminative clustering via extreme learning machine. Neural Netw. 2015, 70, 1–8. [Google Scholar] [CrossRef] [PubMed]
- Krawczyk, B.; Minku, L.L.; Gama, J.; Stefanowski, J.; Wozniak, M. Ensemble learning for data stream analysis: A survey. Inf. Fusion 2017, 37, 132–156. [Google Scholar] [CrossRef]
- Zang, W.; Zhang, P.; Zhou, C.; Guo, L. Comparative study between incremental and ensemble learning on data streams: Case study. J. Big Data 2014. [Google Scholar] [CrossRef]
- Haixiang, G.; Yijing, L.; Shang, J.; Mingyun, G.; Yuanyue, H.; Bing, G. Learning from class-imbalanced data: Review of methods and applications. Expert. Syst. Appl. 2017, 73, 220–239. [Google Scholar] [CrossRef]
- Jain, S.; Lange, S.; Zilles, S. Towards a better understanding of incremental learning. Algorithmic Learn. Theory 2006, 4264, 169–183. [Google Scholar]
- Liu, Y. Incremental Learning in Deep Neural Networks. Master of Science Thesis, Tampere University of Technology, Tampere, Finland, 2015. [Google Scholar]
- Ade, R.R.; Deshmukh, P.R. Methods for incremental learning: A survey. Int. J. Data Min. Know. Manag. Process. 2013, 3, 119–125. [Google Scholar] [CrossRef]
- Rajbabu, K.; Srinivas, H.; Sudha, S. Industrial information extraction through multi-phase classification using ontology for unstructured documents. Comput. Ind. 2018, 100, 137–147. [Google Scholar]
- Ienco, D.; Pensa, R.G. Positive and unlabeled learning in categorical data. Neurocomputing 2016, 96, 113–124. [Google Scholar] [CrossRef] [Green Version]
- Raghuwanshi, B.S.; Shukla, S. Class-specific extreme learning machine for handling binary class imbalance problem. Neural Netw. 2018, 105, 206–217. [Google Scholar] [CrossRef] [PubMed]
- Mirza, B.; Lin, Z. Meta-cognitive online sequential extreme learning machine for imbalanced and concept-drifting data classification. Neural Netw. 2016, 80, 79–94. [Google Scholar] [CrossRef] [PubMed]
- Zhong, J.; Liu, Z.; Zeng, Y.; Cui, L.; Ji, Z. A survey on incremental learning. In Proceedings of the 5th International Conference on Computer, Automation and Power Electronics, Colombo, Sri Lanka, 25–27 Feburary 2017. [Google Scholar]
- Wang, J.H.; Wang, H.Y.; Chen, Y.L.; Liu, C.M. A constructive algorithm for unsupervised learning with incremental neural network. J. Appl. Res. Technol. 2015, 13, 188–196. [Google Scholar] [CrossRef]
- Huang, G.; Huang, G.B.; Song, S.; You, K. Trends in extreme learning machines: A review. Neural Netw. 2014, 61, 32–48. [Google Scholar] [CrossRef] [PubMed]
- Chen, L.; Yang, L.; Du, J.; Sun, C.; Du, S.; Xi, H. An extreme learning machine architecture based on volterra filtering and pca. IEICE Trans. Inf. Syst. 2017, 100, 2690–2701. [Google Scholar] [CrossRef]
- Zhao, J.; Wang, Z.; Park, D.S. Online sequential extreme learning machine without forgetting mechanism. Neurocomputing 2012, 87, 79–89. [Google Scholar] [CrossRef]
- Polikar, R.; Udpa, L.; Udpa, S.S.; Honavar, V. Learn++: An incremental learning algorithm for supervised neural networks. IEEE Trans. Syst. Man Cybern. Part C Appl. Rev. 2001, 31, 497–508. [Google Scholar] [CrossRef]
- Jinyin, C.; Huihao, H.; Jungan, C.; Shanqing, Y.; Zhaoxia, S. Fast Density Clustering Algorithm for Numerical Data and Categorical Data. Math. Probl. Eng. 2017, 2017, 1–15. [Google Scholar] [CrossRef]
Figure 1.
Example of Incremental Learning.

Figure 2.
Architecture of CUIL.

Figure 3.
Node Representation of a record in uCLUST

Figure 4.
Linked list formed for the records in JSON document by uCLUST.

Figure 5.
Example JSON document for Image metdata.

Figure 6.
Clustering the image metadata using attribute-image_type.

Figure 7.
Clustering the image metadata using attribute-format.

Figure 8.
Models created for each train set - (a) creates a model M1 for batch A and (b) creates a model M2 for batch B.
Figure 8.
Models created for each train set - (a) creates a model M1 for batch A and (b) creates a model M2 for batch B.

Figure 9.
ELM++ to classify test images.

Figure 10.
Comparison of accuracy for MNIST Database.


Table 1.
Summary of the related works.
| S.No. | Title | Author | Year | Insights | Remarks |
|---|---|---|---|---|---|
| 1 | Ensemble learning for data stream analysis: A survey | Krawczyk B, et al. | 2017 | Provides a survey on different types of ensemble learning for the analysis of data streams. | Survey Paper in which some research problems like gradual drifts, handling delayed information and big data not addressed. |
| 2 | Learning from class-imbalanced data: Review of methods and applications | Haixiang G., et al. | 2017 | Survey paper about class-imbalanced methods. | Survey Paper |
| 3 | Towards a better understanding of incremental learning | Jain S, et al. | 2006 | Provides insights on requirements like consistency and conservativeness for incremental learning. | Survey Paper |
| 4 | Industrial information extraction through multi-phase classification using ontology for unstructured documents | Rajbabu K, et al. | 2018 |
| Some issues to be addressed are the precision loss and improvement in execution time. |
| 5 | Positive and unlabeled learning in categorical data | Ienco D., et al. | 2016 |
| Multi-class classification problems is yet to be addressed by Pulce. |
| 6 | Class-specific extreme learning machine for handling binary class imbalance problem | Raghuwanshi B S, et al. | 2018 |
| Multi-class classification problems is yet to be addressed. |
| 7 | Meta-cognitive online sequential extreme learning machine for imbalanced and concept-drifting data classification | Mirza B, et al. | 2016 | Algorithm proposed for learning muti-class imbalance and concept drift problems by using an adaptive window scheme. | Class imbalance problems in data streams is yet to be addressed by MOS-ELM when minority and majority classes gets added over time. |
Table 2.
Comparison between the related works and CUIL.
| Title | Method | Datasets Used | Supports Concept Drift | Parameters Considered | Issues (Future Work) |
|---|---|---|---|---|---|
| Industrial information extraction through multi-phase classification using ontology for unstructured documents | Decision Trees, Naive Bayes, SVM | Unstructured documents | NO | accuracy | precision loss, performance time |
| Positive and unlabeled learning in categorical data | k-NN | Categorical dataset (UCI Machine Learning Repository) | NO | accuracy | Multi-class |
| Class-specific extreme learning machine for handling binary class imbalance problem | ELM | Binary dataset (KEEL dataset) | NO | accuracy | Multi-class |
| Meta-cognitive online sequential extreme learning machine for imbalanced and concept-drifting data classification | ELM | Binary and multi-class datasets | YES | accuracy | Class imbalance over time. |
| Proposed work (CUIL) | ELM | Binary and multi-class datasets | NO | accuracy, performance time | Concept drift |
Table 3.
Standard Datasets.
| S. No. | Dataset | Number of Classes | Number of Images Per Class | Total Number |
|---|---|---|---|---|
| 1 | MNIST | 10 | 2000 | 20000 |
| 2 | STL-10 | 10 | 1300 | 13000 |
| 3 | CIFAR-10 | 10 | 6000 | 60000 |
| 4 | Caltech101 | 101 | 40 | 4040 |
| 5 | Caltech256 | 256 | 119 | 30607 |
Table 4.
Comparison of ELM++ and Learn++– MNIST Database.
| Set | Training | Incre. Testing | ||
|---|---|---|---|---|
| Accuracy (%) | ||||
| Learn++ | ELM++ | Learn++ | ELM++ | |
| S1 (0–9) | 94.2 | 92 | 82 | 72 |
| S2 (0–9) | 93.5 | 90 | 84.7 | 78.2 |
| S3 (0–9) | 95 | 90 | 89.7 | 85.3 |
| S4 (0–9) | 93.5 | 92 | 91.7 | 88 |
| S5 (0–9) | 95 | 96 | 92.2 | 90.8 |
| S6 (0–9) | 95 | 96 | 92.7 | 94 |
Table 5.
Performance Accuracy of ELM++.
| Attribute | No. of | Model No. | Test | Accuracy (%) | |
|---|---|---|---|---|---|
| Used for Clustering | Clusters Formed | (No. of Clusters) | Set | Training | Incre. Test |
| format | 2 | M1(1) | 1, 2 | 99 | 97.75 |
| M2(1) | 96.5 | ||||
| image_type | 4 | M1(2) | 1, 2, 3, 4 | 97 | 93.3 |
| M2(1) | 93 | ||||
| M3(1) | 90.75 | ||||
| image_type, format | 8 | M1(4) | 1, 2, 3, 4, 5, 6, 7, 8 | 95.75 | 94.2 |
| M2(2) | 98 | ||||
| M3(2) | 90.75 | ||||
Table 6.
Performance Time of CUIL.
| Attribute Used for Clustering | No. of Clusters Formed | Model No. (No. of Clusters) | Test Set | uCLUST— Clustering Time(secs) | Time Taken(secs) | |
|---|---|---|---|---|---|---|
| Training (ELM++) | Incre. Test | |||||
| format | 2 | M1(1) | 1,2 | 9 | 16.45 | 8.86 |
| M2(1) | 15.9 | |||||
| image_type | 4 | M1(2) | 1,2,3,4 | 13 | 12.78 | 6.35 |
| M2(1) | 11.89 | |||||
| M3(1) | 12.05 | |||||
| image_type, format | 8 | M1(4) | 1, 2, 3, 4, 5, 6, 7, 8 | 22 | 12.35 | 6.11 |
| M2(2) | 11.34 | |||||
| M3(2) | 11.96 | |||||
Table 7.
Statistical Test.
| Set No. | S1 | S2 | S3 | S4 | S5 | S6 |
|---|---|---|---|---|---|---|
| d | 8 | 2.75 | 0.1 | 2.07 | 3.4 | 0.7 |
© 2018 by the authors. Licensee MDPI, Basel, Switzerland. This article is an open access article distributed under the terms and conditions of the Creative Commons Attribution (CC BY) license (http://creativecommons.org/licenses/by/4.0/).
Share and Cite
MDPI and ACS Style
Madhusudhanan, S.; Jaganathan, S.; L S, J. Incremental Learning for Classification of Unstructured Data Using Extreme Learning Machine. Algorithms 2018, 11, 158. https://doi.org/10.3390/a11100158
AMA Style
Madhusudhanan S, Jaganathan S, L S J. Incremental Learning for Classification of Unstructured Data Using Extreme Learning Machine. Algorithms. 2018; 11(10):158. https://doi.org/10.3390/a11100158
Chicago/Turabian StyleMadhusudhanan, Sathya, Suresh Jaganathan, and Jayashree L S. 2018. "Incremental Learning for Classification of Unstructured Data Using Extreme Learning Machine" Algorithms 11, no. 10: 158. https://doi.org/10.3390/a11100158
Note that from the first issue of 2016, this journal uses article numbers instead of page numbers. See further details here.