Application of Data Science Technology on Research of Circulatory System Disease Prediction Based on a Prospective Cohort


School of Computer Science and Technology, Beijing Institute of Technology, Beijing 100081, China
*
Author to whom correspondence should be addressed.
Algorithms 2018, 11(10), 162; https://doi.org/10.3390/a11100162
Submission received: 11 September 2018
/
Revised: 8 October 2018
/
Accepted: 11 October 2018
/
Published: 20 October 2018
(This article belongs to the Special Issue Algorithms for Decision Making)
Abstract
:Chronic diseases represented by circulatory diseases have gradually become the main types of diseases affecting the health of our population. Establishing a circulatory system disease prediction model to predict the occurrence of diseases and controlling them is of great significance to the health of our population. This article is based on the prospective population cohort data of chronic diseases in China, based on the existing medical cohort studies, the Kaplan–Meier method was used for feature selection, and the traditional medical analysis model represented by the Cox proportional hazards model was used and introduced. Support vector machine research methods in machine learning establish circulatory system disease prediction models. This paper also attempts to introduce the proportion of the explanation variation (PEV) and the shrinkage factor to improve the Cox proportional hazards model; and the use of Particle Swarm Optimization (PSO) algorithm to optimize the parameters of SVM model. Finally, the experimental verification of the above prediction models is carried out. This paper uses the model training time, Accuracy rate(ACC), the area under curve (AUC)of the Receiver Operator Characteristic curve (ROC) and other forecasting indicators. The experimental results show that the PSO-SVM-CSDPC disease prediction model and the S-Cox-CSDPC circulation system disease prediction model have the advantages of fast model solving speed, accurate prediction results and strong generalization ability, which are helpful for the intervention and control of chronic diseases.
1. Introduction
Cohort research has great advantages in revealing the risks and trends of chronic diseases. Cohort research has been paid more and more attention by medical researchers all over the world. China has more than 60 years of experience in cohort research, and has achieved a series of original research results. However, due to a late start, follow-up methods are lagging behind the other countries or regions. The current population cohort data in China are relatively small, mainly clinical trial data, and the range of data collection is relatively narrow; such cohort data has caused a certain bottleneck in the universality of medicine. At the same time, because of individual differences, it is difficult to use foreign cohort data as research data to study medical problems involving Chinese ethnic groups.
The data used in this paper are from a large prospective Chinese chronic disease research project, (China Kadoorie Biobank, CKB [1,2]), initiated by the China Centers for Disease Control and Prevention in collaboration with the University of Oxford, UK. The data is the largest in the Chinese cohort study, the most widely related data (including age, occupation, region, environment, etc.), and the most reliable sample of local cohort data collected. It can provide basic data support for the study of etiology, disease trend and disease prediction of chronic diseases represented by circulatory system.
Chronic diseases represented by circulatory diseases are characterized by high morbidity, high mortality, complicated etiology, long course of disease, great health damage, serious harm to the state and society, and the economic burden of treating and curing chronic diseases. It is very heavy for individual families, society and the country. In addition, the degree of aging in China is increasing, and the development trend of chronic diseases is gradually accelerating, which brings great challenges to China’s medical and health care services. Therefore, the study of the etiology, pathogenesis and disease prediction of chronic diseases represented by the circulatory system is of great significance for disease intervention and control.
We conducted circulatory disease prediction studies based on data from China’s chronic disease prospective research project, to improve traditional algorithms used in medical research, and to use artificial intelligence machine learning algorithms to make the research algorithms better applicable to population cohorts. The field of disease prediction is to promote the discovery of new outcomes for more chronic disease predictions.
We obtained the correlation between exposure factors and outcomes in Chinese chronic disease prospective research project data based on the single factor analysis model in a population cohort study and survival analysis. We evaluated and predicted the disease outcome of the circulation system based on Cox regression prediction model and support vector regression prediction model respectively, and the Cox regression model traditionally used in medical research was optimized based on the contraction prediction theory. The PSO algorithm based on the group intelligence theory optimized the parameters of the support vector regression prediction model. Then, the multi-model was performed. The prediction results and effects are compared, and the advantages and disadvantages of various prediction models are discussed. Finally, according to the analysis, the model usage scenarios and further optimization schemes are given. The main research contents of the thesis are summarized as follows: (a) Analysis of the data characteristics of China’s chronic disease prospective research project. According to Cox proportional hazard theory and SVM theory, we constructed the Cox-CSDPC disease prediction model and SVM-CSDPC disease prediction model respectively; (b) By analyzing the results of Cox-CSDPC disease prediction model, a new prediction index is proposed. According to the contraction prediction theory, we constructed the optimization model which is S-Cox-CSDPC disease prediction model; (c) By analyzing the impact of various parameters in the training process of SVM-CSDPC disease prediction model, combined with particle swarm optimization algorithm, we constructed the optimization model PSO-SVM-CSDPC disease prediction model.
2. Background
2.1. CKB Data
In this paper, we use the China Kadoorie Biobank (CKB) [3] as our research data.
The China Kadoorie Biobank (CKB) [3] was a large-scale chronic disease initiated by the China Center for Disease Control and Prevention (project II to the Chinese Academy of Medical Sciences) in cooperation with the University of Oxford in the United Kingdom from 2004 to 2008. The data of this project is the largest sample of data in China’s cohort research, the most relevant data (age, occupation, geography, environment, etc.) and the highest reliability of data collection. The system provides basic data support for chronic disease etiology, morbidity trends and disease prediction studies.
The queue data size is 513,000, collected from five cities in China and fivw rural areas.
The follow-up subjects were permanent residents at the follow-up sites aged 35–74 years. The follow-up consists of two parts. The first part is about various exposure factors in eight aspects, including:
- Demographic parameters (date of birth, gender, etc.)
- Socioeconomic status (marriage, education, occupation, economic income). (Family composition, etc.)
- Daily activities (drinking, drinking tea, smoking, eating, physical activity, etc.)
- Personal and family health status (personal and family history of illness, medication, etc.)
- Passive exposure (air pollution in the city, passive smoking, etc.)
- Birth history (first menstruation and menopause, contraceptive use, gynecological surgery, etc.)
- Mental state of mind (sleep, anxiety or (depression status, etc.)
- Physical examination index status (height, weight, blood pressure, vital capacity, carbon monoxide hemoglobin ratio, body mass index, etc.).
The second part includes a number of outcomes under the ICD-10 agreement, including chronic diseases such as circulatory diseases, diabetes, and malignant tumors.
2.2. Basic Theory
2.2.1. Cox
Currently, the most commonly used research method in the field of chronic disease research is the Cox proportional hazards regression model. This model is mainly used in the multi-factor analysis of survival data that is the correlation analysis between various exposure factors and exposure factors and outcomes, but it is rarely used in the field of disease prediction.
2.2.2. Shrinkage Prediction Theory
Models built using training samples have poor predictive power when predicting test samples. The reason may be that the test samples have different inclusion criteria, different monitoring strategies, or different result criteria. There may be over-fitting problems. After a certain limit is exceeded, the more variables are included in the model, the better the model fits, but the worse the ability to predict future data. In response to the above problems, a shrinkage theory [4] is proposed to improve prediction by shrinkage factors. Details could be found in [4].
2.2.3. Support Vector Machine
SVM is a commonly used algorithm in machine learning. It is estimated according to a given training sample such as . The dependency between the input and the output, the purpose is to find the optimal function to make the unknown output as accurate as possible, and the method of evaluation is to minimize the expected risk. SVM can find the best compromise between learning ability and model complexity based on limited sample data, showing unique advantages in small sample learning, high dimensional problems and generalization capabilities.
2.2.4. Particle Swarm Optimization Algorithm
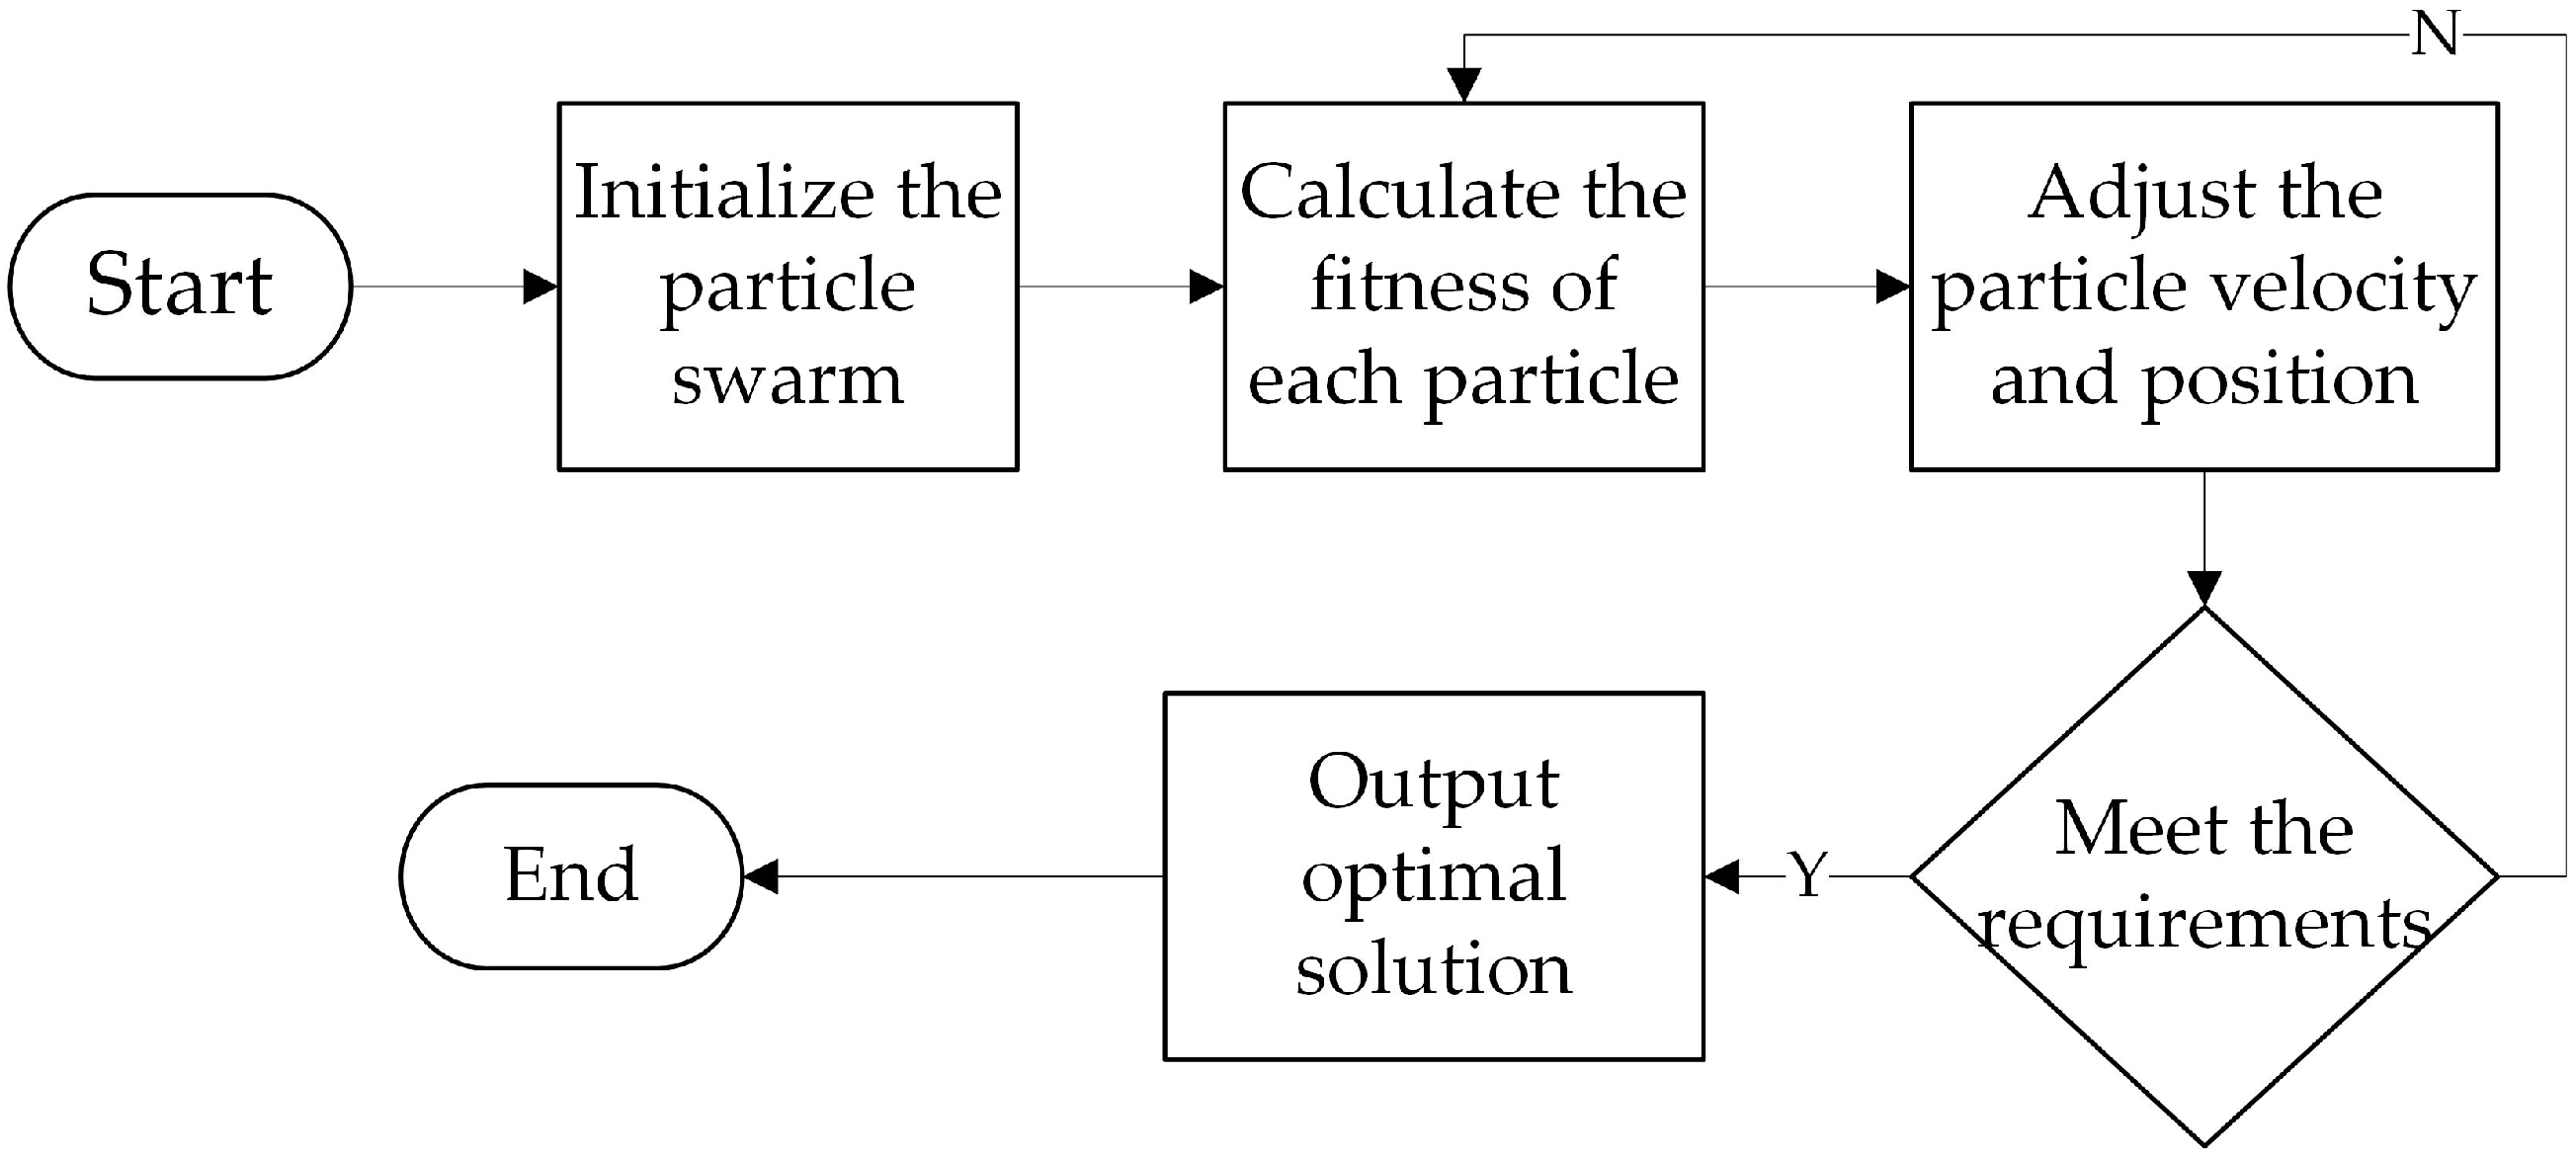
PSO originated from humans’ research on the group behavior of bird foraging. Its main idea is to use particles to simulate birds. Firstly, the particle group should be randomly initialized and then adapted. The degree function calculates the fitness value and the position of the next particle. At each iteration, the two positions are used to determine their position and velocity. One is its own historical optimal value, that is, the individual optimal value, and the other is the overall particle. The optimal value of the group is the global optimal value. Repeated iteration in this way, continuously learning and updating the position and speed to find the optimal value of the optimization problem [5].
Assume that the position and velocity of the i-th particle in the D-dimensional space are , , the individual extremum of the particle. It is denoted as , and the global extremum is recorded as . After calculating the fitness, the particle will adjust the position and velocity of the current time according to the position and velocity of the previous time t and , . The j-th velocity and position update equation of the particle is:
In Formula (4), is the inertia weight, which can be used to coordinate the local and global search ability. It can be seen from the formula that affects the current time by controlling the state of the previous time t. When is smaller, the local search ability is stronger and the global search ability is weaker; the larger the is, the weaker the local search ability is, and the stronger the global search ability is. Where and are acceleration constants, called learning factors, which are used to adjust the step size of the particle’s optimal and globally optimal position and direction motion respective-ly, reflects the individuals cognitive ability of the particle, reflects The cognitive ability of the group’s group experience, when the learning factor is small, the particles will be paralyzed away from the optimal region, and when the learning factor is large, the particles will quickly fly to the optimal region. Where rand1and rand2 are random numbers in the range [0, 1] generated to move the particles to the optimal position with an equal probability of acceleration. The selection of the above parameters greatly affects the optimization process and accuracy of the PSO algorithm.
The processing of the PSO algorithm is as follows:
- Initialize the particle group, set the population size of the population to m, and set the particle velocity and position parameters, including the inertia weight , the learning factor and , and the setting termination condition. The termination condition is generally the optimal fitness value meets the setting. The threshold or the maximum number of iterations.
- Using the adaptive function to calculate the fitness of each particle, and compare it with the individual optimal value and the global optimal value in turn, if the current position is better, then replace, otherwise unchanged;
- If the end condition is reached, the output parameter ends. If the end condition is not reached, go to 2.
The process of the PSO algorithm is shown in Figure 1.
2.3. Model Construction
2.3.1. Cox-CSDPC Disease Prediction Model
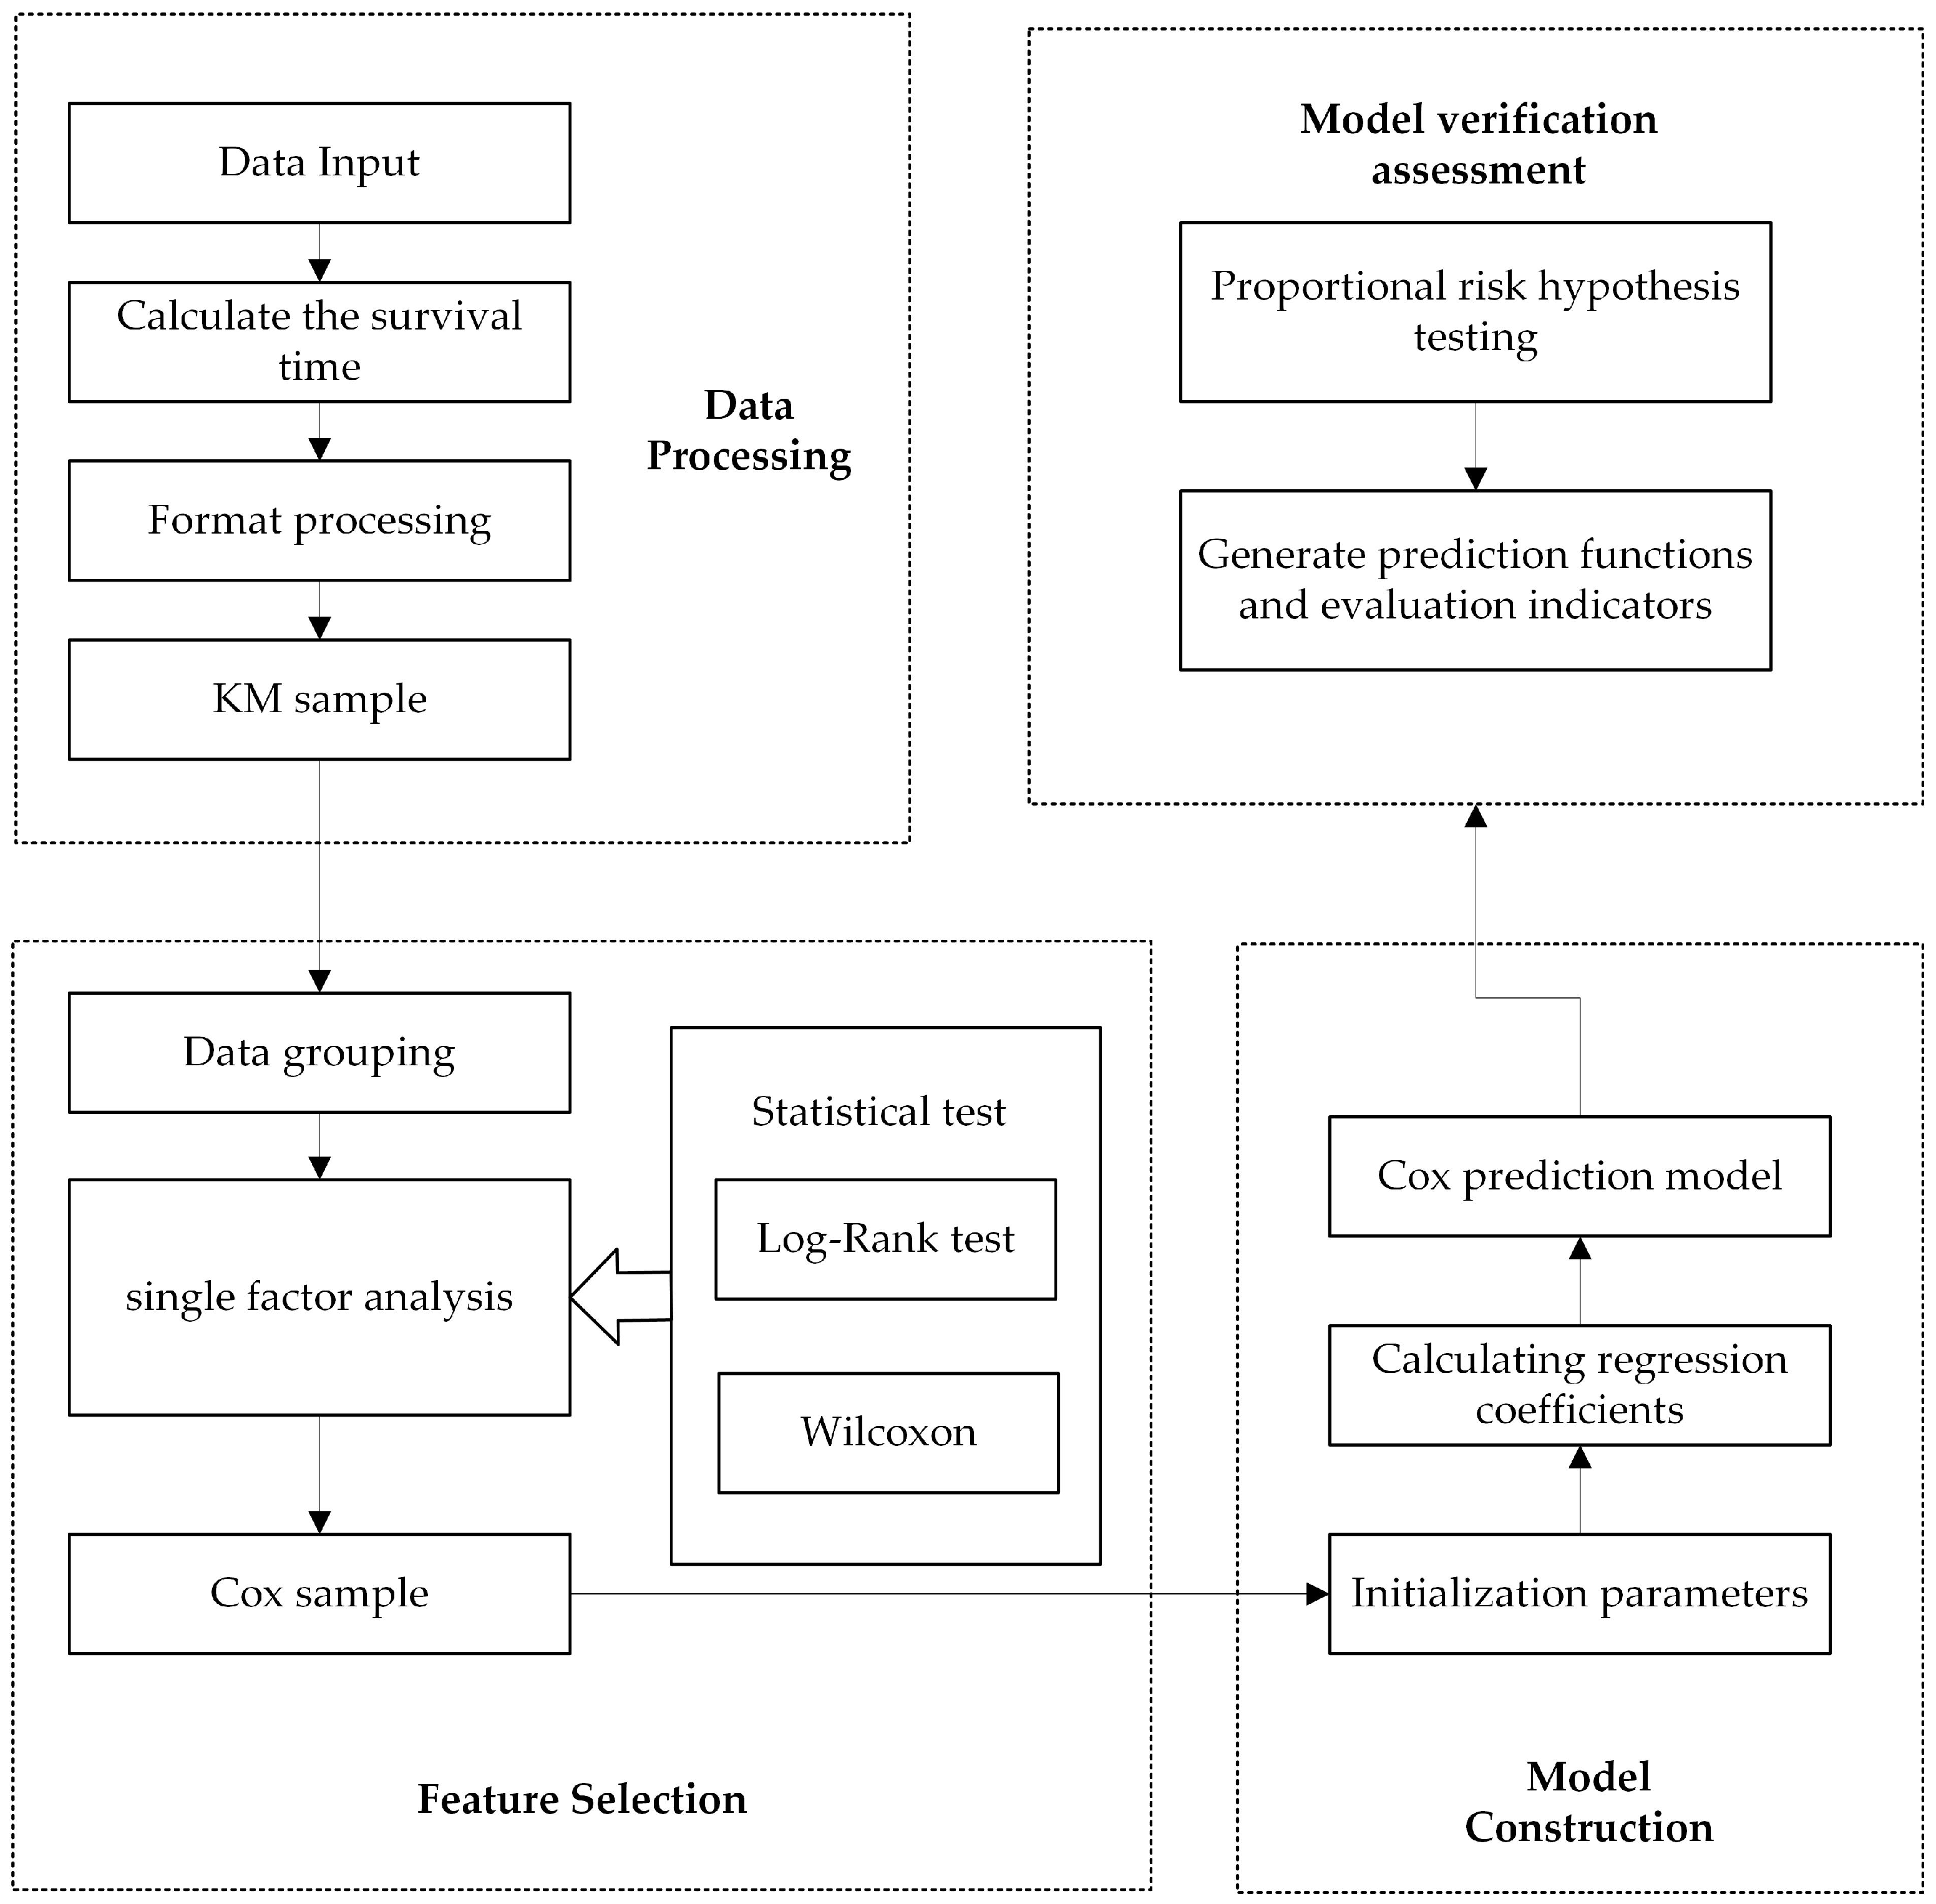
Based on Cox proportional hazard regression theory, we have constructed a Prospective cohort circulatory system disease prediction model, which is called as Cox-CSDPC in this paper. The main processes of the Cox-CSDPC disease prediction model are as follows:
- Data preprocessing. Input the CKB data, the survival time of the sample is calculated, and the exposure factors involved in the data and the relevant rules of the use are structured to obtain a feature selection sample set, that is, a KM sample set.
- Feature selection. The KM sample set was grouped according to the category of the data, and the Kaplan–Meier method was used for single factor analysis. The Kaplan–Meier single factor results were statistically tested using the Log-rank test and the Wilcoxon signed rank test to obtain the test results and generate a single factor. Kaplan–Meier method-Log-rank test-Wilcoxon signed rank test result table. Through statistical results, statistical analysis is performed to obtain relevant exposure factors for predicting model input.
- Model building. Analyze the characteristics of the data, initialize the confidence interval, input the data, and calculate the regression coefficient vector by means of the partial likelihood function to obtain the Cox proportional hazard regression prediction model.
- Model verification assessment. Proportional risk hypothesis testing is performed on the model, and predictive indicators and survival function curves are generated for evaluation.
The process of the Cox-CSDPC disease prediction model is shown in Figure 2.
2.3.2. S-Cox-CSDPC Disease Prediction Model
We used the shrinkage prediction theory to optimize the Cox-CSDPC disease prediction model to build S-Cox-CSDPC disease prediction model. The model process is as follows:
- Calculate the prognostic index PI according to the Cox-CSDPC disease prediction model.
- Fit the prediction model again with PI as the only covariate.
- Calculate the model parameter estimate to get .
- Calculate the corrected prognostic index API.
- Calculate the corrected predicted survival curve and ROC curve.
2.3.3. SVM-CSDPC Disease Prediction Model
Based on SVM, we have build SVM-CSDPC disease prediction model, which consists of several processing stages:
- Data preprocessing. Input the CKB data, and the data is subjected to missing value filling, data format processing and data normalization processing by relevant rules, thereby obtaining the training and test data sets of the model.
- Algorithm construction. Using the training data set, analyze its characteristics, select SVM parameters including positive penalty coefficient, negative penalty coefficient and kernel function parameters, and then solve the optimal problem to determine the optimal hyperplane.
- Model building. The test data set is input into the model for circulatory disease prediction, and then the prediction result is verified and evaluated according to the evaluation index.
The process of the SVM-CSDPC disease prediction model is shown in Figure 3:
2.3.4. PSO-SVM-CSDPC Disease Prediction Model
According to the description of the PSO optimization algorithm [6], the idea of the PSO algorithm is very simple, the overall process is clear and concise, and can be easily applied to practical problems, and the PSO actually optimizes the parameters of the model in the process of application. In this paper, we adopt PSO to optimize the three Key parameters of SVM: positive penalty factor, negative penalty factor, kernel function parameter, which determine the accuracy and generalization ability of SVM-CSDPC disease prediction model to a certain extent, and learn from PSO application in other predictions. The good results of problem parameter optimization, so this paper applies PSO optimization algorithm to SVM-CSDPC disease prediction model, optimizes parameters of SVM-CSDPC disease prediction model, and constructs SVM prospective population cohort system optimization prediction model based PSO, hereinafter referred to as the PSO-SVM-CSDPC disease prediction model. The model process is as follows:
- Input the CKB data, use the relevant rules to perform missing value filling, data format processing and data normalization processing on the data to obtain the training and test data sets of the model.
- Initialize the population. Set the initial population as 100. Each particle has three dimensions, representing the positive penalty factor , the negative penalty factor , the kernel function parameter , respectively. Then the particle parameters, such as velocity and position parameters are set, including inertia weight = 0.8. According to the problems studied in this paper, the velocity ranges of one dimension are [0.01, 0.1], [0.01, 0.1], [0, 0.1], and the position ranges of each dimension are [0, 10], [0, 10], [0, 1]. The learning factor [6], and setting the termination condition, the termination condition is generally that the optimal fitness value satisfies the set threshold or reaches the maximum number of iterations.
- Using cross-validation to calculate the group fitness, and sequentially updating the individual optimal value and the global optimal value .
- If the end condition is reached, the output parameter ends. If the end condition is not reached, go to 3.
- Input the optimal solution of the output into the model, input the test data set into the model for disease prediction of the circulatory system, and then verify the prediction result and evaluate it according to the evaluation index.
2.4. Model Evaluation Indicators
2.4.1. OR
OR is the odds ratio, which refers to the exposure ratio of the case group to the control group and its value is . If the OR > 1, it indicates that the odds ratio is positively correlated that is the risk of disease decreases with exposure, and the factor is determined as a risk factor for the disease. When OR < 1, it indicates that the odds ratio is negative, that is, the risk of disease increases with exposure, and the factor is not a risk factor for the disease, and it has a protective effect on the disease. When OR = 1, there is no correlation between exposure factors and disease.
2.4.2. ROC Curves
Receiver Operator Characteristic Curve is a comprehensive indicator of the continuous variable of sensitivity and specificity. It is used as a graph to show the relationship between two degrees. The vertical coordinate of the curve is the true positive rate, or so called sensitivity:
while the horizon coordinate of the curve is the false positive rate, or so called 1-specificity:
In medical research, the ROC curve can easily visualize the ability to recognize diseases at any threshold, and can select the optimal diagnostic threshold. It can be used to compare the ability of two or more different diagnostic tests to identify diseases. AUC (Area under Curve) is the area under the ROC curve, between 0.1 and 1. AUC as a numerical value can intuitively evaluate the quality of the prediction model, and the more the AUC value tends to 1 the better the prediction effect is.
2.4.3. Yoden Index
Yoden Index = Sensitivity + Specificity −1. It is an indicator for evaluating the authenticity of screening experiments. The larger the index, the better the effectiveness of the screening experiment and the greater the authenticity.
2.4.4. ACC
ACC is the accuracy rate, which indicates the prediction effect of the model. The value range is [0, 1], and the expression is a percentage. The value is closer to 1, indicating that the model prediction accuracy is higher, the better the effect. The calculation is expressed using the divisional use case in the ROC curve:
The disadvantage of using ACC as evaluation criterion is that when the proportion of positive cases in total samples and the proportion of negative cases in total samples are quite different, the value of ACC values will tend to the side with large proportion, so it can not reflect the overall accuracy rate. Therefore, both the ACC value and the AUC value of the ROC curve are used to evaluate the model.
2.4.5. PEV
The existing predictive indicators are more common in OR values, p-values and so on. Iif only the analysis is limited to these results, medical researchers may lose important information, so we introduces indicators that quantify the predictive power of Cox proportional hazard regression models, that is Proportion of explained variation (PEV) [7,8].
PEV is similar to the .
is the sample value, is the predicted value calculated from the model, is the average of the sample values.
We defined the PEV, according to estimating the Invariance of Time-Scale Monotone Transformation Based on Coefficients of Cox Proportional Risk Model.
is the expectation of log likelihood ratio , which is defined as:
If is closer to 1, then the stronger the correlation between predicted and exposure factors.
3. Results
3.1. Experimental Framework
We use the China Kadoorie Biobank (CKB) as our research data, and it is described in detail in Section 2.1. We follow the general principle and select 80% of the data as the training set and the remaining 20% as the test set for the model that needs to be trained. All models use the same training set and test set to ensure their comparability. For other models for comparison, the same training set and test set are used. In order to ensure the balance between the training set and the test set, we adopt the method of stratified sampling. In this way, the balance between the two can be maintained, and the two have similar diversity.
There are three data formats for CKB data, binary, hierarchical, and continuous. The binary data are 0 or 1, the rank data are natural numbers less than 10, and the continuous data are biological data, such as blood pressure, body mass index, blood test and so on. The numerical value is quite different. If the sample is directly sent into the training, the calculation process will be tortuous and time-consuming before finding the optimal solution, so it is necessary to normalize the data in the prediction model. In this paper, we use min-max normalization to preprocess the data in CKB.
3.2. Cox-CSDPC Disease Prediction Model Application and Results Analysis
We used Kaplan–Meier method to analyze the characteristics and screened 40 features. By establishing the Cox-CSDPC disease prediction model, we obtained prognostic index, ACC value, OR value, PEV value, ROC curve, AUC value and other indicators. The ROC curve of the Cox-CSDPC disease prediction model is shown in Figure 4. Among them, AUC = 0.807, ACC = 80.0%, training time is 29.5 h, with certain accuracy. The Yoden index is calculated from the ROC curve. The maximum value is 0.531, which is the cut-off point. The sensitivity at this time is 0.742 and the specificity is 0.789. According to the Formula (1), the prognostic index PI can be established. When PI > 0.531, the risk of circulatory diseases can be judged to be large. When PI < 0.531, the risk of circulatory diseases can be judged to be small. In this way, the individual’s prediction results are obtained. In addition, the interpretation of the variation = 0.911, approaching 1, shows a strong correlation between the predicted value and the exposure factor.
The indicator data perform relatively good, and it can be seen that the overall model has a good prediction effect, but the model prediction ability has a large space to develop. The Cox proportional hazard prediction model is essentially a survival analysis, using survival time as a covariate, and has a high utilization rate for large cohort data. This model can be used for predictive studies of other chronic diseases.
3.3. S-Cox-CSDPC Disease Prediction Model Application and Results Analysis
According to the Cox-CSDPC disease prediction model we constructed above, the estimated shrinkage factor = 0.898, and the standard error is 0.153. Calculate the corrected prediction survival curve and get the following figure. It can be seen that the prediction has obvious improvement. The ROC curve shows AUC = 0.856, and the accuracy is also improved. The ROC curve of the S-Cox-CSDPC disease prediction model is shown in Figure 5. In addition, the Proportion of explained variation = 0.901, approaching 1, shows a strong correlation between the predicted value and the exposure factor, ACC = 87.1%, and the training time is 34.5 h.
The Cox-CSDPC disease prediction model was corrected and improved by using the shrinkage factor. According to the S-Cox-CSDPC disease prediction model, the prognostic index, ACC value, OR value, ROC curve, AUC value and other indicators were found to be better than the Cox model. It is conducive to the prediction of other chronic diseases.
3.4. SVM-CSDPC Disease Prediction Model Application and Results Analysis
When we built the SVM-CSDPC model, we normalized the data. The initial value of in and the SVM method is set to the inverse of the number of samples. We use the relationship between the positive penalty coefficient and the negative penalty coefficient used in the libsvm package proposed by Lin Zhiren. The inverse of the number of samples. The Gaussian kernel function has strong learning ability, and its function parameter can be flexibly and freely set. Therefore, in the process of establishing the model, the kernel function defaults to a Gaussian kernel function. The ROC curve of the Cox-CSDPC disease prediction model is shown in Figure 6.
The number of model training iterations is 1,308,633, the training duration is about 84.0 h, the minimum value for the quadratic programming solution is −106,779.077, the kernel function parameter is 0.413, the support vector number is 307,073, and the number of support vectors on the boundary is 77,959, ACC = 82.3%, AUC = 0.880 and the Yoden index maximum is 0.618. The sensitivity is 0.808 and the specificity is 0.810.
The predictive index obtained by the SVM-CSDPC model performs well and reaches some expected standards. However, the training time of the whole model is longer, the model is greatly influenced by the choice of kernel function and penalty factor, and the prediction accuracy needs to be improved.
3.5. PSO-SVM-CSDPC Disease Prediction Model Application and Results Analysis
We constructed the PSO-SVM-CSDPC model according to PSO. The ROC curve of the PSO-SVM-CSDPC disease prediction model is shown in Figure 7. The number of model training iterations is 917,680 times, the training time is about 41.5 h, the minimum value for the quadratic programming solution is −132,392.357, the kernel function parameter is 0.465, and the support vector number is 277,172. The number of support vectors is 70,958, ACC = 90.3%, AUC = 0.899, the maximum value of the Jordan index is 0.635, the sensitivity is 0.811, and the specificity is 0.824.
Based on the experimental results of the SVM-CSDPC disease prediction model, the PSO-SVM-CSDPC model has a very good effect, the overall prediction of the original model is improved, the training time is greatly shortened, and the prediction accuracy is greatly improved, which is suitable for solving high dimensional complexity. Problems, and the ability of the model to generalize, will contribute to the prediction of other chronic diseases.
3.6. Compare with Existing Model Application Results
We validated the existing disease prediction model, logistic disease prediction model [9], decision tree disease prediction model [10] and GA-SVM-CSDPC disease prediction model [11] by using CKB data, and compared the experimental results with several models that we constructed. The ROC curve of the logistic-based prospective population cohort system prediction model is shown in Figure 8. The ROC curve of the prospective population cohort system prediction model based on decision tree is shown in Figure 9. The ROC curve of the GA-SVM-CSDPC disease prediction model is shown in Figure 10. We compared the training time, ACC value, AUC area of seven models and whether we need to use the survival time, as shown in the Table 1.
Under the premise of data utilization and focus on survival analysis, the S-Cox-CSDPC disease prediction model is more prominent, it needs to use the survival time, can make great use of the data, and the ACC and AUC are maintained at a high level. Under the premise of ACC value and AUC value, the effect of the seven models from high to low is: PSO-SVM-CSDPC model > S-Cox-CSDPC model > GA-SVM-CSDPC model > SVM-CSDPC model > Cox-CSDPC model > Logistic model > Decision tree model. PSO-SVM-CSDPC disease prediction model has the highest prediction accuracy and strong generalization ability, suitable for solving high-dimensional complex problems.
4. Conclusions
In this paper, we proposed our research concerning using data science technologies to perform circulatory system disease prediction based on a prospective cohort in China. Based on traditional methods, we proposed Cox-CSDPC and SVM-CSDPC. Then, according to analysis and exploration, we proposed S-Cox-CSDPC by applying shrinkage prediction theory on Cox-CSDPC, and proposed PSO-SVM-CSDPC by adopting PSO to optimize three kernel parameters of SVM. According to the results, both S-Cox-CSDPC and PSO-SVM-CSDPC gain higher ACC and AUC compared with other methods. However, there is still improvement potential for both methods. In the future, we plan to combine genetic methods to further improve our current method.
Cohort data research has received more and more attention in China these days, so our methods could be used to help improve the cohort data research in China.
Author Contributions
H.T., Y.K. and X.Y. conceived the idea and research theme. Y.K. designed and performed the experiments. Y.K. analyzed the experimental results. H.T., G.C. and X.Y. wrote and revised the paper.
Funding
This work is supported by the National Key R&D Program of China No. 2016YFC0904902, the National Natural Science Foundation of China under Grant No. 61502032.
Conflicts of Interest
The authors declare no conflict of interest.
References
- Chen, Z.M.; Lee, L.; Chen, J.S. The Kadoorie Study of Chronic Disease in China (KSCDC). Int. J. Epidemiol. 2005, 34, 1243–1249. [Google Scholar] [CrossRef] [PubMed]
- Chen, Z.M.; Chen, J.S.; Collins, R. China Kadoorie Biobank of 0.5 million people: Survey methods, baseline characteristics and long-term follow-up. Int. J. Epidemiol. 2011, 40, 1652–1666. [Google Scholar] [CrossRef] [PubMed]
- Li, L.M.; lv, J.; Guo, Y. The China Kadoorie Biobank: Related methodology and baseline characteristics of the participants. Chin. J. Epidemiol. 2012, 33, 249–255. [Google Scholar]
- Copas, J.B. Regression, Prediction and Shrinkage. J. R. Stat. Soc. 1983, 45, 311–354. [Google Scholar]
- Xiong, W.L.; Xu, B.G. Study on Optimization of SVR Parameters Selection Based on PSO. J. Syst. Simul. 2006, 18, 2442–2445. [Google Scholar]
- Kennedy, J.; Eberhart, R. Particle swarm optimization. In Proceedings of the IEEE International Conference on Neural Networks, Perth, Australia, 27 November–1 December 1995; pp. 1942–1948. [Google Scholar]
- Michael, S.; Janca, S. Explained variation in survival analysis. Stat. Med. 1996, 15, 1999–2012. [Google Scholar]
- Kent, J.T.; Quigley, J.O. Measures of Dependence for Censored Survival Data. Biometrika 1988, 75, 525–534. [Google Scholar] [CrossRef]
- Zhu, H.F. The Parameter Estimation and the Existent Problems Analysis of the Logistic Model. Sci. Inf. 2011, 1, 169–170. [Google Scholar]
- Wan, H.F.; Du, Y.P. Comparative Study of K Nearest Neighbor and Logistic Regression Classification Algorithms. J. Luoyang Inst. Sci. Technol. 2016, 26, 83–86. [Google Scholar]
- Lu, C.H.; Gu, X.F. An improved genetic algorithm-support vector machines scheme for coronary artery disease diagnosis. J. Biol. 2014, 4, 90–99. [Google Scholar]
Figure 1.
PSO algorithm process.

Figure 2.
Cox-CSDPC disease prediction model process.

Figure 3.
SVM-CSDPC disease prediction model process.

Figure 4.
Cox-CSDPC disease prediction model ROC curve.

Figure 5.
S-Cox-CSDPC disease prediction model ROC curve.

Figure 6.
SVM-CSDPC disease prediction model ROC curve.

Figure 7.
PSO-SVM-CSDPC disease prediction model ROC curve.

Figure 8.
Logistic disease prediction model ROC curve.

Figure 9.
Decision tree disease prediction model ROC curve.

Figure 10.
GA-SVM-CSDPC disease prediction model ROC curve.


Table 1.
Disease prediction model experimental results comparison table.
| Disease Prediction Model | Need to Survive | Training Time | ACC | AUC |
|---|---|---|---|---|
| Logistic model [9] | No | 19.0 h | 76.0% | 0.790 |
| Decision tree model [10] | No | 21.0 h | 77.6% | 0.762 |
| Cox-CSDPC model | Yes | 29.5 h | 80.0% | 0.807 |
| SVM-CSDPC model | No | 84.0 h | 82.3% | 0.880 |
| GA-SVM-CSDPC model [11] | No | 89.5 h | 84.9% | 0.888 |
| S-Cox-CSDPC model | Yes | 34.5 h | 87.1% | 0.856 |
| PSO-SVM-CSDPC model | No | 41.5 h | 90.3% | 0.899 |
© 2018 by the authors. Licensee MDPI, Basel, Switzerland. This article is an open access article distributed under the terms and conditions of the Creative Commons Attribution (CC BY) license (http://creativecommons.org/licenses/by/4.0/).
Share and Cite
MDPI and ACS Style
Tang, H.; Chen, G.; Kang, Y.; Yang, X. Application of Data Science Technology on Research of Circulatory System Disease Prediction Based on a Prospective Cohort. Algorithms 2018, 11, 162. https://doi.org/10.3390/a11100162
AMA Style
Tang H, Chen G, Kang Y, Yang X. Application of Data Science Technology on Research of Circulatory System Disease Prediction Based on a Prospective Cohort. Algorithms. 2018; 11(10):162. https://doi.org/10.3390/a11100162
Chicago/Turabian StyleTang, Haijing, Guo Chen, Yu Kang, and Xu Yang. 2018. "Application of Data Science Technology on Research of Circulatory System Disease Prediction Based on a Prospective Cohort" Algorithms 11, no. 10: 162. https://doi.org/10.3390/a11100162
Note that from the first issue of 2016, this journal uses article numbers instead of page numbers. See further details here.