Understanding Contrail Business Processes through Hierarchical Clustering: A Multi-Stage Framework
by
 , , and
Zeeshan Tariq
1,* ,
,
Naveed Khan
1,
Darryl Charles
1,
Sally McClean
1,
Ian McChesney
1 and
Paul Taylor
2 1
School of Computing, Ulster University, Newtownabbey BT37 0QB, UK
2
Applied Research, BT, Ipswich IP1 2AU, UK
*
Author to whom correspondence should be addressed.
Algorithms 2020, 13(10), 244; https://doi.org/10.3390/a13100244
Submission received: 23 July 2020
/
Revised: 14 September 2020
/
Accepted: 22 September 2020
/
Published: 27 September 2020
(This article belongs to the Special Issue Process Mining and Emerging Applications)
Abstract
:Real-world business processes are dynamic, with event logs that are generally unstructured and contain heterogeneous business classes. Process mining techniques derive useful knowledge from such logs but translating them into simplified and logical segments is crucial. Complexity is increased when dealing with business processes with a large number of events with no outcome labels. Techniques such as trace clustering and event clustering, tend to simplify the complex business logs but the resulting clusters are generally not understandable to the business users as the business aspects of the process are not considered while clustering the process log. In this paper, we provided a multi-stage hierarchical framework for business-logic driven clustering of highly variable process logs with extensively large number of events. Firstly, we introduced a term contrail processes for describing the characteristics of such complex real-world business processes and their logs presenting contrail-like models. Secondly, we proposed an algorithm Novel Hierarchical Clustering (NoHiC) to discover business-logic driven clusters from these contrail processes. For clustering, the raw event log is initially decomposed into high-level business classes, and later feature engineering is performed exclusively based on the business-context features, to support the discovery of meaningful business clusters. We used a hybrid approach which combines rule-based mining technique with a novel form of agglomerative hierarchical clustering for the experiments. A case-study of a CRM process of the UK’s renowned telecommunication firm is presented and the quality of the proposed framework is verified through several measures, such as cluster segregation, classification accuracy, and fitness of the log. We compared NoHiC technique with two trace clustering techniques using two real world process logs. The discovered clusters through NoHiC are found to have improved fitness as compared to the other techniques, and they also hold valuable information about the business context of the process log.
1. Introduction
Business processes in the real-world context typically consist of several information sources and various process flows. To execute these business processes, Process-Aware Information Systems (PAIS) [1], such as customer services, healthcare, education, and banking systems, operate in a constantly evolving business environment. Process mining techniques have been developed to analyse these logs and understand the behaviour of varied process flows. Analysis of complex business processes reveals that many business subcategories are integrated into the event log [1]. Real-world business processes also go through recursive improvement measures which bring change in the way a process executes, adding more uncertainty in the flow. Many techniques have been introduced by researchers that allow the exploration of process data to discover the underlying process model. Furthermore, conformance checking techniques, such as token replay and process alignments, are used to compare the discovered model with actual events. These techniques allow enhancement of the process by recommending the necessary changes [2].
Process discovery is the first step towards mining and improvement of a business process. For more than a decade, researchers have introduced several techniques for discovering underlying process models using an extracted log, termed as replay [3]. For so-called lasagna processes, where the number of events and tasks are not large and where the process is structured, process modelling is a reliable technique for process discovery [4]. However, for more complex processes, such as spaghetti processes, it is vital to first decompose the large heterogeneous process log into small, manageable, and meaningful classes. Once done, further exploration of the log is more straightforward and can follow traditional process mining steps [5]. Things become more complicated when the process operates in an established real-world business environment and adjustments towards achieving business goals tend to change the process regularly [6]. This change is normally brought about by human intervention and is mostly for specific cases, for example, changing the pre-requisites of a course for specific students in an academic environment, or allow students to apply for medical leave through an online portal where the process normally expects a hard copy of the doctor’s prescription.
Trace clustering [3] techniques discover similarities in the process flow by exploring the events data. Trace clustering helps to group similar cases within the given process and thus obtaining a deeper insight into each cluster of event data. Another approach used by researchers to explore event data is rule-based mining which discovers the sequential patterns between the events of the process. It helps to gain knowledge about the nature of the process and exploring possible similarities between the instances. The literature suggests that, so far, trace clustering and rule-based mining are not widely used in scenarios such as, (i) unlabelled process data, (ii) processes with highly integrated business classes, such as customer services in the telecoms sector,(iii) hybrid processes which present the characteristics of both lasagna and spaghetti processes at the same time, and (iv) processes with very large numbers of events in each process instance. For instance, studies such as [3,4,5] used process log with average event size of less than 10.
In this paper, process discovery is performed by using a multi-stage framework through a proposed algorithm Novel Hierarchical Clustering (NoHiC) (Algorithm 1) that combines the methodologies of both, process modelling and unsupervised machine learning. Techniques such as Rules-based mining [6] and hierarchical clustering of the process instances [6] are proposed for simplification of large and complex real-world business processes, which are described in this paper as contrail processes (Section 3.1). We used process modelling techniques, such as fuzzy mining and heuristic mining, for analysing the fitness criteria of an event log [7]. Our framework is generalised for real-world business processes showing contrail-like model, helping the organisations to understand the way their PAISs are executing documented business processes. To present the usefulness of the proposed framework, we are using heterogeneous business process data from BT, one of the leading telecom firms in the UK. The business process selected for this study contains more than 1300 unique cases, with an average of 250 events each. Events present hybrid data types such as integer data (Case_ID, duration of case execution), nominal data (customer’s answer to specific questions related to services), and text data (customer’s inquiry about the problem).
Our proposed framework provides solution for several existing issues in the business processes domain. Firstly, the real-world business processes are naturally complex and require non-traditional techniques to understand them. Single business process often contains several sub-business processes and comprises of data gathered from heterogeneous sources of information. The traditional machine learning techniques tend to solve the problem of decomposing the data into several small segments, but the biggest challenge in using such techniques is that the business perspective that is reflected inside the data is no longer considered. Secondly, process mining deals with such complex scenarios in process mining domain, the process discovery phase is helpful in analysing the log and converting the event data into a process model. This process model reflects the control-flows, business logic and other domain specific information. Process mining techniques tend to provide understanding of the business process through discovery phase, but they lack in capturing the evolving nature of real-world business processes.Lastly, business users gets the insights about the business processes through statistical techniques, but these techniques lack the business-context in their solution. In the proposed multi-stage framework, the first stage is to simplify the contrail processes by identifying the fundamental high-level business classes within the event log. One way of doing this is to use a segment of the log with similar attributes and classifying this as a subset [1]. Another simplification of the complex process log is to identify the common paths in the process model and make subsets based on the flow of process [8]. Trace clustering in this way is not always beneficial as it may classify less traversed paths in the model as outliers, also it is difficult to communicate the results to business users as they are always interested to know the reason behind clusters in the data. In contrast, our proposed work is focused primarily on the business aspect of the process instances. Initially, high-level business classes within the process log are segregated such that each class is handled separately. Information about business classes is generally available within the process log or can be identified through domain experts. As an example, consider an organisation’s human resource process log which contains events for the employee hiring processes. High-level business classes in the process log can be extracted through the segregation of data such as job applicant’s previous experience, qualification, job type, or hiring department. In a second stage, each of these business classes is considered for in-depth divisive hierarchical clustering. The clustering of the cases is purely based on business aspects identified from the process attributes that have a direct impact on the business objectives. At the leaf-nodes of the clustering tree, cases in the identified clusters are highly associated with each other in terms of the business logic they adopt to achieve the business goals. Our contributions in this paper are summarised as follows:
- We introduced a unique type of business process termed as contrail processes, which are the result of the complex business-oriented thought process of the organisations, detailed in Section 3.1. Contrail processes are difficult to analyse by applying general process mining techniques as they present a mixture of both simple and highly variable process models. Deeper insights of these processes allows better analysis and improvement in the considered business process.
- A multi-stage framework is proposed to identify business-logic driven clusters from unlabelled process log with contrail-type characteristics. We decomposed raw process log into smaller and understandable clusters of process instances that possess a common business logic. Thus, opening the door of further in-depth process analysis, such as identification of bottlenecks, deviated paths and outlier detection.
- We presented the experimental results of case-level clustering in the context of (i) machine learning: by illustrating an accuracy of the discovered clusters through classification results from several machine learning algorithms, and (ii) process mining: by revealing the impact on the fitness metric of process model generated for each discovered cluster.
The remainder of the paper is organised as follows: Section 2 discusses related work, Section 3 provides an overview of the proposed framework along with an introduction to Contrail processes, Section 4 demonstrates the implementation of the framework using real-world case study and Section 5 presents the outcome of the experiments performed. Finally, conclusions and future works are presented in Section 6.
2. Literature Review
In this section, we discuss several trace clustering techniques and their implementations in relation to the process mining. Process mining techniques focus on extracting knowledge from the event data [4]. Considering the complexity and level of divergence in the real-world business environment, process mining has emerged as a solution of several process analytic techniques [6], such as process discovery to explore the process data through modelling and analysing the behaviour of events in the log [7], monitor the process to analyse the conformance of the extracted process data with the models generated as a result of the process discovery and enhance the quality of original process through extracted knowledge [8]. In 2015, Hompes et al. proposed a generic framework for process discovery based on Markov Cluster algorithm [6]. Several other techniques, such as Alpha Mining (AM), Heuristic Mining (HM), and Inductive Mining (IM) are investigated in [9] to discover the process model offering the best fit for the Learning Management Systems (LMS) events log. The techniques discussed in [6,9] provided promising results when dealing with the process data where control flows are either static, or change in the flows have no impact on the business goals. When techniques such as Alpha Mining (AM) and Heuristic Mining (HM) are tested in [9] on the real-world business process data, these algorithms provided unstructured process models. Inductive Miner(IM) is suitable for discovering loops and bottlenecks in the logs but they have not yet tested for large event logs. In this paper, we have used the Heuristic Miner as a tool to discover the process model from the clustered set of process instances. In contrast to [9], we used an extensively large dataset with an average of around 2000 classes per log. This number is 3 times larger then the dataset used in [6,9].
Trace clustering is used by many researchers to reduce the complexity of the process log by decomposing it into several portions. Jagadeesh et al. used presented multiple feature set-based technique in [10] to cluster business process log for achieving trace alignment. Similarly, profiling of similar cases using trace clustering is done through a set of features describing the behaviour of cases in [11]. In 2015, a comprehensive literature review of trace clustering techniques was presented by Paul et al. in [12] in which several approaches for trace clustering were mentioned, such as feature vector representation by activity profile, transition profile, performance profile, maximal repeat feature set and super maximal repeat alphabet feature set. Sequence clustering approaches [13] and tree clustering approaches [14] are the most commonly used techniques for handling a variety of objectives. Active learning inspired ActiTrac [15] improved the performance of clustering by reducing the bias of traditional clustering approaches, increasing the F1 score of resultant process models and reducing the complexity of models measured through fitness metric. ActiTrac performed better result in comparison to seven other clustering techniques but it only supports the single objective trace clustering. In this paper, we compared ActiTrac with our proposed technique and evaluated the results based on the fitness of the identified clusters. In addition to the work performed in [15] we focused on the business perceptive of the clusters and verified the usefulness of the knowledge gained by clustering the raw process log. An adaptive version of ActiTrac is presented in [16] in the form of multi-objective trace clustering using balance fitness, generalisation, precision and simplicity. The authors of [16] used multi-objectives features related to the statistical analysis of the features, but this ignores the underlying business perspective of the business process. Other forms of clustering for process logs are using tree-based clustering and rule-based mining. Association rule mining was initially proposed by Agrawal et al. [17] with the focus of exploring customer’s shopping trends in markets. These trends were based on the set of frequent items purchased together by an individual customer during a market trip. Associations between the items purchased helps businesses to define strategies to increase sales through the improved placement of items in shops. An association rule mining technique using the Apriori algorithm is discussed in [18] to look for the most occurring sequences in the process data of a large telecommunication organisation. Awareness of the trends and sequences between the tasks allow an organisation to fine-tune its processes and produce more business opportunities. In extension to this, sequential rules (also known as sequential association rules) mentioned in [19] imply that every time the event A occurs, then it is always followed by an event B. On similar lines, authors of [20] used the TramineR package of the R tool to convert the event log into the form of an event sequence objects. Frequent sub-sequences are then extracted using several sequence objects, such as how an activity is linked with other activities. In another study [12], the sequence mining technique is used in combination of the traditional hashing technique.
A general framework is implemented in [21] for solving process mining issues regarding workflow schema with only local restrictions. The authors of [21] introduced a novel concept of clustering the workflows through hierarchical clustering into several smaller portions of logs which share common structured behaviours. Hierarchical clustering proposed by the authors of [21] is close to the framework presented in this paper, furthermore we are dealing with the global constraints of the business-related perspective in the raw process log. Another example of hierarchical clustering is considered for process mining in [4] for dealing with processes related to Intrusion Detection Systems (IDS). Alerts from the high-risk information systems are mined to analyse the behaviour of attackers. As in our work, the complex process model generated in the result of process discovery is further considered for clustering into understandable smaller segments. Results showed that process mining techniques in collaboration with clustering of logs made it useful for IT Administration team of an American University to identify, analyse and rectify the attacks on their network services. In a similar work Gabriel et al. [13] presented clustering through sequence clustering approach implemented in ProM tool but it only handles unstructured business process log. In contrast, we proposed a framework to support logs which are hybrid in nature with both structures and unstructured patterns. Alternatively, clustering in process mining can be driven by other techniques such as Disjunctive Workflow Schema (DWS) as presented in [13], where heuristic miner model of a process log is generated followed by an iterative approach of clustering using DWS mining.
3. Proposed Methodology
This paper develops a mechanism for the understanding and improvement of complex real-world business processes by analysing unlabelled event log data. The event log is generated during the execution of the business process in an enterprise environment typically across several heterogeneous platforms. To describe the features and related complexities of such real-world business processes, we are introducing the term Contrail process. The case described below will illustrate the features of the contrail processes.
3.1. Introducing the ‘Contrail Process’
By far, two of the most common terms used by data scientists in the process mining field to represent the life-cycle of a process instance are Lasagna Processes and Spaghetti Processes. Lasagna processes are structured, aligned, and have a very strong validity of the process model. Spaghetti processes are opposite to the former and are unstructured and contain a lot of variability [22]. Figure 1a,b shows an example of both Spaghetti and Lasagna processes. In Figure 1a, the process has several loops, multi-directional control flow paths and variable connections. In such models, it is difficult to understand the business flows in and special techniques are required to analyse the underlying structure of the process. In comparison Figure 1b is a structured process with a single starting and end point. It is also to be considered that wide spectrum of processes exist between these two extremes, referred as semi-structured processes in the literature [22].
One of the metrics for gauging the quality of the process model is fitness [7], which is a measure of events mismatch when the actual log is replayed with the discovered model. A process model is said to have perfect fitness if it allows replay of all the traces in the process log without any discrepancy [2]. Fitness (also referred as replay fitness) of a process model is the validity of the conformance of the log events when a replay of the events in the log is performed using tokens over its Petri Net model [23]. Equation (1) presents the fitness f of the process log on petri net model .
where m = missing tokens, c = number of consumed tokens, r = number of tokens remaining after replay, p = total number of tokens produced for a petrinet.
In Equation (1), presents the considered trace of the process log for replaying the log into the process model and presents the Petri Net model/ discovered through a miner algorithm. Number of missing tokens m, number of consumed tokens c, number of remaining tokens r and number of produced tokens p are all associated with the log . The first part represents the proportion of missing tokens relative to the number of tokens consumed. The second part calculates the remaining token fraction relative to the total tokens generated through the log. The closer the value of fitness f to 1, the higher the fitness of the model and the better the conformance related to the considered event log.
Most real-world business processes, such as the one we used in our research, exhibit features of both Spaghetti and Lasagna processes at the same time. This mixture of characteristics within the same process log is mainly due to the evolutionary nature of business in a real-world enterprise environment. The business process generally goes through repetitive practice of refinement and optimisation by the business teams. These updates result in deviations from the general flow of the process; thus, some portions of the process show characteristics of a Lasagna process whereas remaining part of the process depict highly variable and unstructured behaviour, just as Spaghetti process. We adopt the term contrail to describe such processes. (Inspired by contrail images such as Figure 2 showing mixtures of structured and unstructured cloud patterns in the sky).
A Contrail is made when vapours from the engine exhaust of an aircraft are condensed and presents a marking trail in the sky [25]. These trails are visible in the sky as the traces of the passing aircraft and each of them reflects a portion of a route followed by an aircraft. The collection of these individual traces makes a collection of contrails and it is very difficult to identify the overall flow of the air traffic.As these sky contrails are variable and highly unstructured, similarly the real-world corporate processes are mixture of structured and unstructured paths.
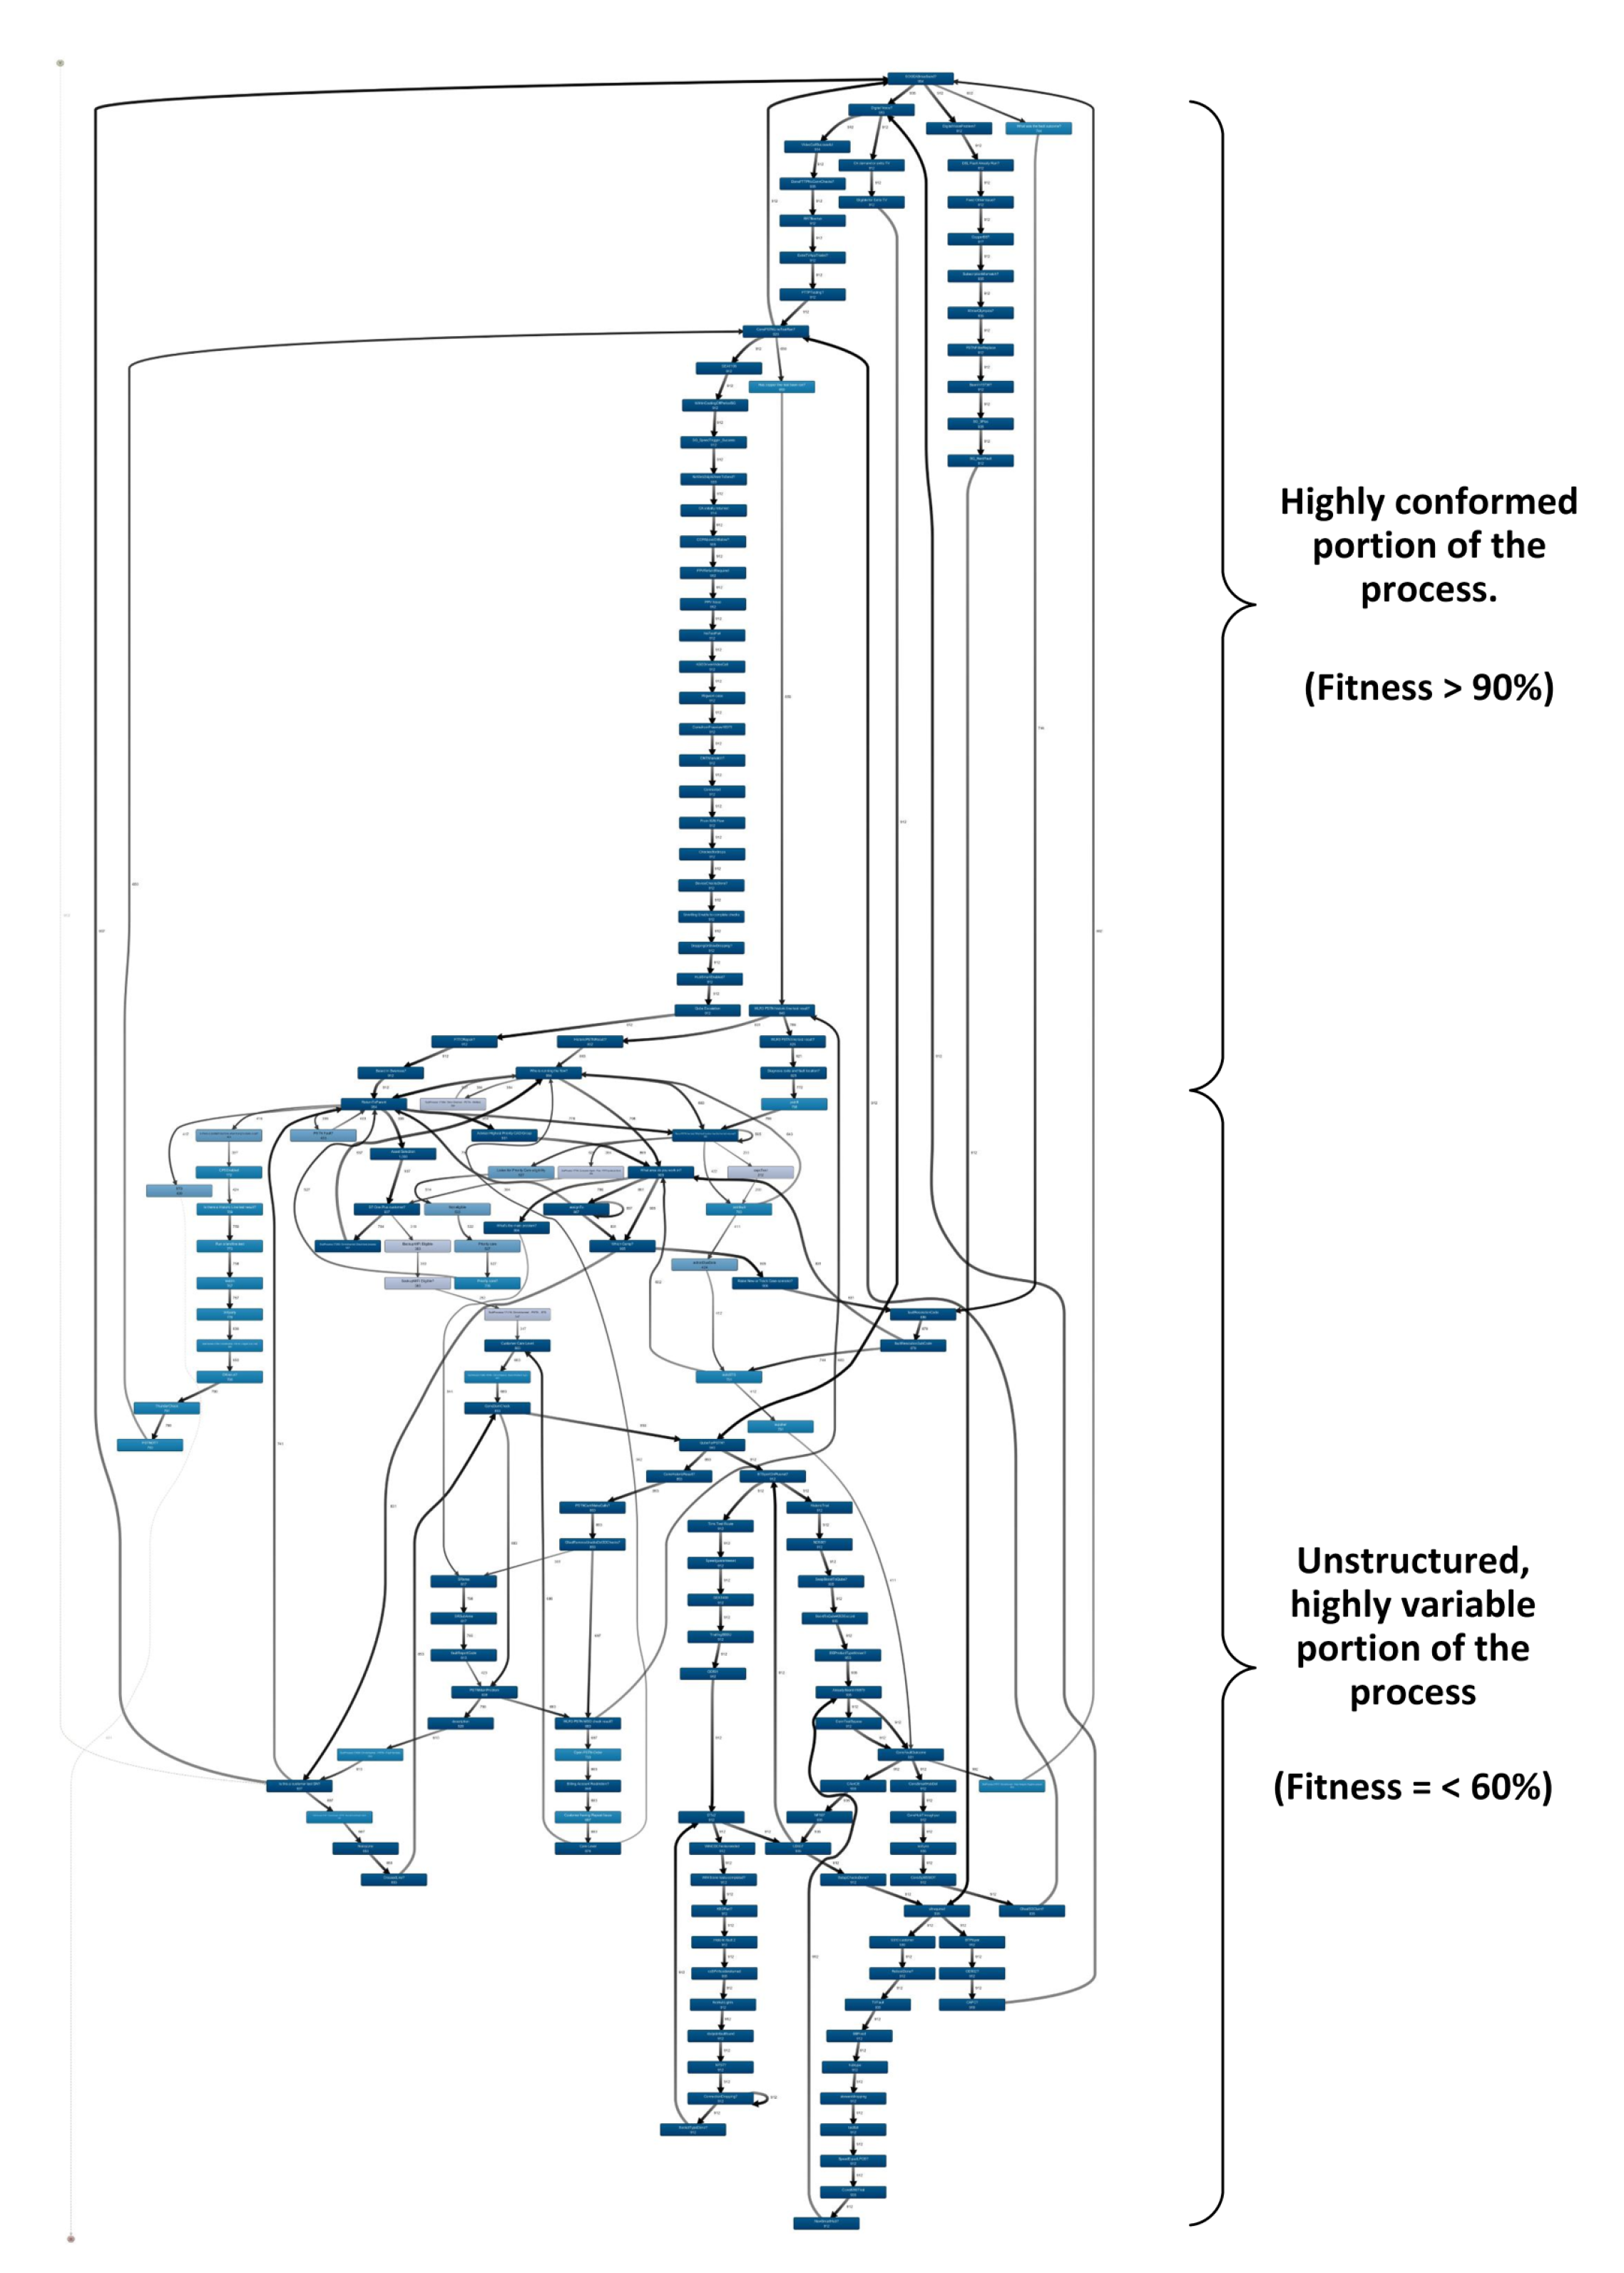
Figure 3 shows the heuristic miner process model, for an event log of a Customer Diagnostic Process (CDP) used as a case study in this paper, details mentioned in Section 4.1.1. We used heuristic miner to present fitness of log as it considers frequencies of the paths within the process and neglects the infrequent paths, as presented in [26]. The initial portion of the process is lasagna-type in nature and the fitness metric is greater than 90% for the events in that portion, whereas the remaining portion of the process shows a highly variable, spaghetti-type behaviour of the events and the case-level fitness metric is as low as 60%. Process logs in a real-world environment are generally Contrail processes, exhibiting a range of events and variable conformity within the process model. Figure 4 is another representation of the CDP using fuzzy miner [27] which presents the complexity of the process model when all the events and paths are considered. The initial portion of the process log shows the conformity to the documented process, this can be understood as a defined sequence of events taken for all the instances. Further events followed after initial process, process is handled by agents (human/machine) which produce runtime evolution in the process based on the instances. This portion appears to have deviations from the process path followed by earlier instances, this fitness showed downwards trend.
3.2. Multi-Stage Framework for Process Log Simplification
The framework proposed in this paper for understanding the contrail process, i.e., a complex, unlabelled real-world business process, is composed of two independent stages. Stage-1 is to identify the high-level business classes within the business process log through exploring the broad characteristics of process instances, with rule-based mining used to verify the correctness of the classification. Stage-2 is composed of a novel technique of hierarchical clustering of cases for each of the identified high-level business classes. Clustering is performed, based on business characteristics of the cases, through features extraction for each individual case. The feature set is the representation of the features extracted and their underlying attributes for each case. Figure 5 presents the proposed multi-stage framework for clustering of the business process log.
Our aim in stage-1 is to decompose the larger process log into manageable subsets which represent a specific business class. This decomposition allows high level segregation of the contrail processes consisting of events collected from heterogeneous sources. In the first step, high-level business classes are identified from the process log, the next step is to verify the accuracy of the identified business classes, for which all cases in the log are presented in the form of a task-list. Finally, rule-based mining is performed using CBA algorithm [19] to measure the accuracy of the classification.
In stage 2, the following are the steps involved in performing hierarchical clustering with identified high-level business classes:
- Case level feature extraction: Attributes of each individual case of the process log represented as a feature set.
- Feature selection: Feature selection in the unsupervised environment is a trade-off between several selected features and accuracy of the performed clustering [20]. We used selective set of features which can reveal the natural grouping of the cases among the process log. Approaches such as wrapper [28] and Multi-objective Feature Selection [20] resulted in the selection of most discriminating features for clustering but the focus of this work is to consider all those features which present a business perspective of grouping within the data. We concluded our feature selection based on several quality level parameters as proposed in [20], implemented through RapidMiner tool. These quality metrics are:
- Correlation: It is a Pearson correlation coefficient between the attributes and the labels of the feature set.
- ID-ness: It measures the unique attributes in the data. Higher the ID-ness, lower the quality of attribute for clustering.
- Stability: It is a measure of constant values in attributes. It is calculated as (2):where is the number of rows with the most frequent non-missing values divided by , the total number of data rows with non-missing values. Higher the stability, lower the quality of attribute for clustering.
- Missing values: It measure the percentage of attributes with missing values.
- Defining a distance matrix: The event log of the real-world business process may contain different data types, including logical, nominal, ordinal and numerical data. It is vital to identify the difference between selected features of the cases using a distance matrix. A Distance matrix helps to identify the centroid distance between selected features. In this paper we used Gower distance measure [29] which was introduced in 1971 and it is a measure of distances between pairs of variables and combining those distances to a single value for each of the pair.
- Identification of an optimal number of clusters: This step is to specify the optimal number of clusters k to be produced using the distance matrix. In this paper, we used a Silhouette average [30] for identification of the number of optimal clusters through Partitioning Around Medoids (PAM) algorithm. Each of the identified clusters is re-considered for further clustering using the same procedure, until stopping criteria of further clustering is achieved.
- Label process data: Once clusters are identified, cases that belong to each cluster are labelled with a meaningful business context that is exhibited in the cluster. The label of each cluster is derived from the collective business logic presented in the cases which belong to that specific cluster. For example, cases are labelled as ‘handled by agent’ if all cases in that cluster represent the trend that they are monitored and updated by an organisation’s employee agent handling the business process.
3.3. Stopping Criteria for Further Clustering
Stopping criteria used to achieve optimal clusters is an integral topic of research for all type of clustering techniques, including agglomerative hierarchical clustering [14]. As the focus of our proposed framework is to identify the clusters based on the characteristics of an underlying business perspective of process cases, so that no further clustering is performed if the newly identified clusters are discovered solely based on the statistical distribution of the data, such as duration, time, length. We used Gower technique to identify the distance of the features which make business sense for clustering.
4. Implementation
To present the implementation of our framework, we consider a highly variable real-world business process at BT, which is one of the leading telecommunication firms of the UK. As shown earlier in Figure 3, BT’s CDP represents the characteristics of a Contrail process. The initial part of the log shows events well conformed to the generated heuristic miner model. The remaining portion of the process log is highly variable depending on the business case scenario.
4.1. Stage-1: Identification of High-Level Business Classes
As mentioned earlier, stage-1 of our framework segregates the raw process log into business classes naturally reflected in the considered process. Implementation model including steps to be performed in stage-1 of this multi-stage framework is presented in Figure 6.
4.1.1. Data Collection
Customers interact with BT for after-sale service-related issues through a real-time chat service available. This process initially kicks-off by looking for the information that is recorded about the customer at BT servers. After that, a human agent at BT interacts with the customer for further online support. A possible outcome of this process can be a resolution of the customer’s issue through remote diagnostics and repair. Alternatively, the customer’s issue is registered and routed to the relevant team for resolution. This process is termed as a Customer Diagnostic Process (CDP), as presented in Section 3.1. Customer diagnostics are performed through a series of system generated questions. Customers respond to these queries and the system diagnoses and provide a solution to the customer’s concerns. In terms of the associated process log, questions referred to the customer are considered to be events and each end-to-end individual customer interaction is considered to be a case and is uniquely identified by a Case_ID.
4.1.2. Analyse the Event Log
This step involves an in-depth analysis of the process log. High-level business classes are identified, and the event log is arranged in task list form in order to be considered for rule-based mining. Information about the high-level business classes is acquired by analysing the event log in-depth for the subcategories of the business which defines business classes. Identified classes from the process log are Broadband customers (internet related services) and public switched telephone network (PSTN) customers (landline related services). Once classes are identified, domain experts authenticate the extracted classes based on their knowledge about the customers accessing CDP. Table 1 presents the business classes and their distribution across the process log. The dataset used in this paper is a collection of cases of 24 h duration. 1800 cases were collected in total out of which 1580 complete cases are used for the experiments. Number of events per case ranges from 128 to 378, with mean value of around 276 events per case. In the given business process, there are 1947 unique activities which are scattered in raw process log.
4.1.3. Rule Based Mining
To verify the accuracy of identified business classes, the CBA algorithm is used. Apriori algorithm is used by CBA which generates the association rules for the cases belonging to a specific business class [31]. It also measures the standard quality metrics of support and confidence for each resultant rule. Rules are learned in the form of , which identifies that every time X (event) appeared in the given instance then Y (event) appeared at least once in that instance such that X is always followed by Y.
To facilitate CBA, we created a task-list which is a tabular view of the cases from the process log. First value of the task list presents the unique Case_ID and the remaining columns show the events performed in sequential form. Each row of the task list represents a complete case, which is an end-to-end process execution by an individual customer. In Figure 8, a portion of the task list is shown created in ProM 6.9 using an XES [2] file of the CDP log. Apriori algorithm generates the association rules for each case using task list as input. To validate the performance of the rules generated for the purpose of sequence identification of tasks within a business process, the following metrics are used:
Support: Support is a measure of the applicability of a rule. Suppose X and Y are two tasks, support of a rule is the proportion of instances which holds for both X and Y. Higher support shows more applicability of the approach. Support of a rule is defined as (3), where is the number of instances which holds for both X and Y and N is the total number of instances.
Confidence: Confidence is the worth of the rule with respect to the reliability within the given dataset. Confidence of the rule is defined as (4).
Table 2 presents a sample of sequential rules with their corresponding support. Sequences are mentioned as (EventA > EventB) showing EventA is always followed by the EventB. Confidence for the rules is kept equal to 80% this will make sure that only rules with highest true value of target output are considered. In Table 2, rule#4 indicates that the event labelled with Question_ID 120 is followed by event 3913, whereas 3913 is also followed by 4172, which is followed by 2371. Support of this rule is 52% and confidence is 80%. Target business class presents the associated business case.
4.2. Stage-2: Novel Hierarchical Clustering
During this stage, the previously identified customer classes of Broadband and PSTN customers are further considered to identify in-depth clusters based on the business logic of the two process classes. It is important to identify the business classes in the process log before any further process exploration technique is used to make sure that any further clusters identified in each class are aligned with the existing business classes. A non-traditional hierarchical clustering method is used where selected features of the cases are used to identify the clusters.
4.2.1. Case Level Feature Extraction
A case in a CDP log represents a start-to-end execution of the events for a specific customer interacting with the system. The large process log is converted to a small set of features for each case to efficiently analyse the useful information from the complex process. These features represent the customer’s service diagnostic journey from start of the process to the end by analysing a subset of the information without detailed data from each event. The flow of cases in the process is based on many business perspectives such as geographic location of customer, rank of customer, severity of the complaint, availability of the hardware if required, how quickly the system diagnosed the problem, what is the next step after this interaction etc. As we are dealing with the unlabelled process data with hybrid data types, feature engineering is an added complexity. In contract to many well-known techniques such as PCA, ICA, or t-SNE, we initially selected all the data columns from the raw log, along with some generated features, and marked each attribute as either a statistical feature (i.e., which represent the range of certain characteristics of the case), or business feature (i.e., which presents the specific business perspective behind flow of each case). Sample of features and their related information is shown in Table 3, where business notion is representing the business link of this feature with the case.
4.2.2. Feature Selection
We only considered those features for clustering which provide good discrimination between cases of the process log. For instance, we ignored features with correlation higher than 95, Stability higher than 90% and Missing values greater than 70%. Table 4 presents the sample data from the selected features. We presented the selected features in the for of a set S which consist of features considered for the next step, presented as Equation (5).
4.2.3. Defining a Distance Matrix
As mentioned earlier, we used the Gower distance Matrix to handle the hybrid data types in the feature set. This works well for a mixture of data types by scaling the data values between 0 and 1. Table 5 and Table 6 presents the most similar and most dissimilar cases respectively by the virtue of the distance matrix. Results show that this technique is effectively handling the mixture of data types in the feature set. In Table 5, the considered cases have only differing feature value of duration which shows the high level of similarity between two cases. Table 6 presents the most-dissimilar cases where all features values are far apart from each other.
4.2.4. Identification of Optimal Clusters through Novel Hierarchical Clustering (NoHiC) Algorithm
Once the distance matrix is generated, the next step is to perform clustering based on the optimal number of clusters. Pseudocode of the Novel Hierarchical Clustering (NoHiC) is as Algorithm 1 follows:
| Algorithm 1 High-level pseudo-code description of Novel Hierarchical Clustering (NoHiC) |
 |
To find the optimal number of clusters, we used the Silhouette average calculation method implemented in R. The average value of silhouette is computed for several variations of K number of clusters given a set of cases at each node of the cluster tree. The highest average of silhouette determines the optimal number of clusters K. Figure 9, Figure 10 and Figure 11 show the samples of silhouette average computed at nodes of the divisive hierarchical cluster. The distance matrix is generated using Euclidean distance and clustering is performed using the PAM algorithm, using medoids of data points as a centre for clustering. We used the PAM algorithm as it provides the best compatibility with the hybrid data types in our case study. Each high-level business class in the process log is considered separately for clustering. First the optimal number of clusters is identified, and process log is divided into subsets. Cases from each of the resultant clusters are again reviewed for optimal clusters and this process continues until no further clustering is possible. We labelled the cases with the business logic exhibited in their respective clusters. We analysed that the business logic which results in clustering can be translated into meaningful business labels. Figure 12 presents the clustering tree along with the labels assigned to each cluster.
5. Results and Discussion
As mentioned in Section 4, we identified two high-level classes within the CDP log during Stage-1. In order to measure the accuracy of the classes identified, we used CBA to predict the output class of the given test cases. The quality of classification using CBA technique is measured as accuracy, sensitivity and F1 score metrics. High accuracy in Table 7 indicates that the Broadband and PSTN cluster groups are well-separated instances, so further clustering techniques for these classes are useful through stage-2 of our proposed framework. Accuracy with a varying percentage of minimum Support is presented ranging from 30% to 45% showing classification with different ranges of rule frequencies. Confidence of these rules is kept at minimum threshold of 80% which is a default for CBA algorithm [19]. With a training/testing ratio of 80/20%, the accuracy of the classification is around 95%. The sensitivity of 96% with the Support of 35% shows that 4 out of every 100 cases classified as a part of the class which are not correctly predicted. We can see some decrease in sensitivity with support of 40% and greater as more of the cases with highly deviated behaviour is considered for classification and are identified as incorrect. Overall high F1 score proves that both classes possess different sequence flows which were barely identifiable at the raw event log.
As a result of the classification performed in Stage-1, the CDP event log is decomposed into two classes, Broadband customers and PSTN customers. Figure 13a,b shows the cases of Broadband and PSTN customers presented in the form of a heuristic miner process model.
5.1. Measuring the Accuracy of the Clusters
We identified three major questions about the quality of the clusters identified as a result of Stage-2 of our framework. These questions are integral for measuring the quality of the clustering process and validating the objectives identified for this research.
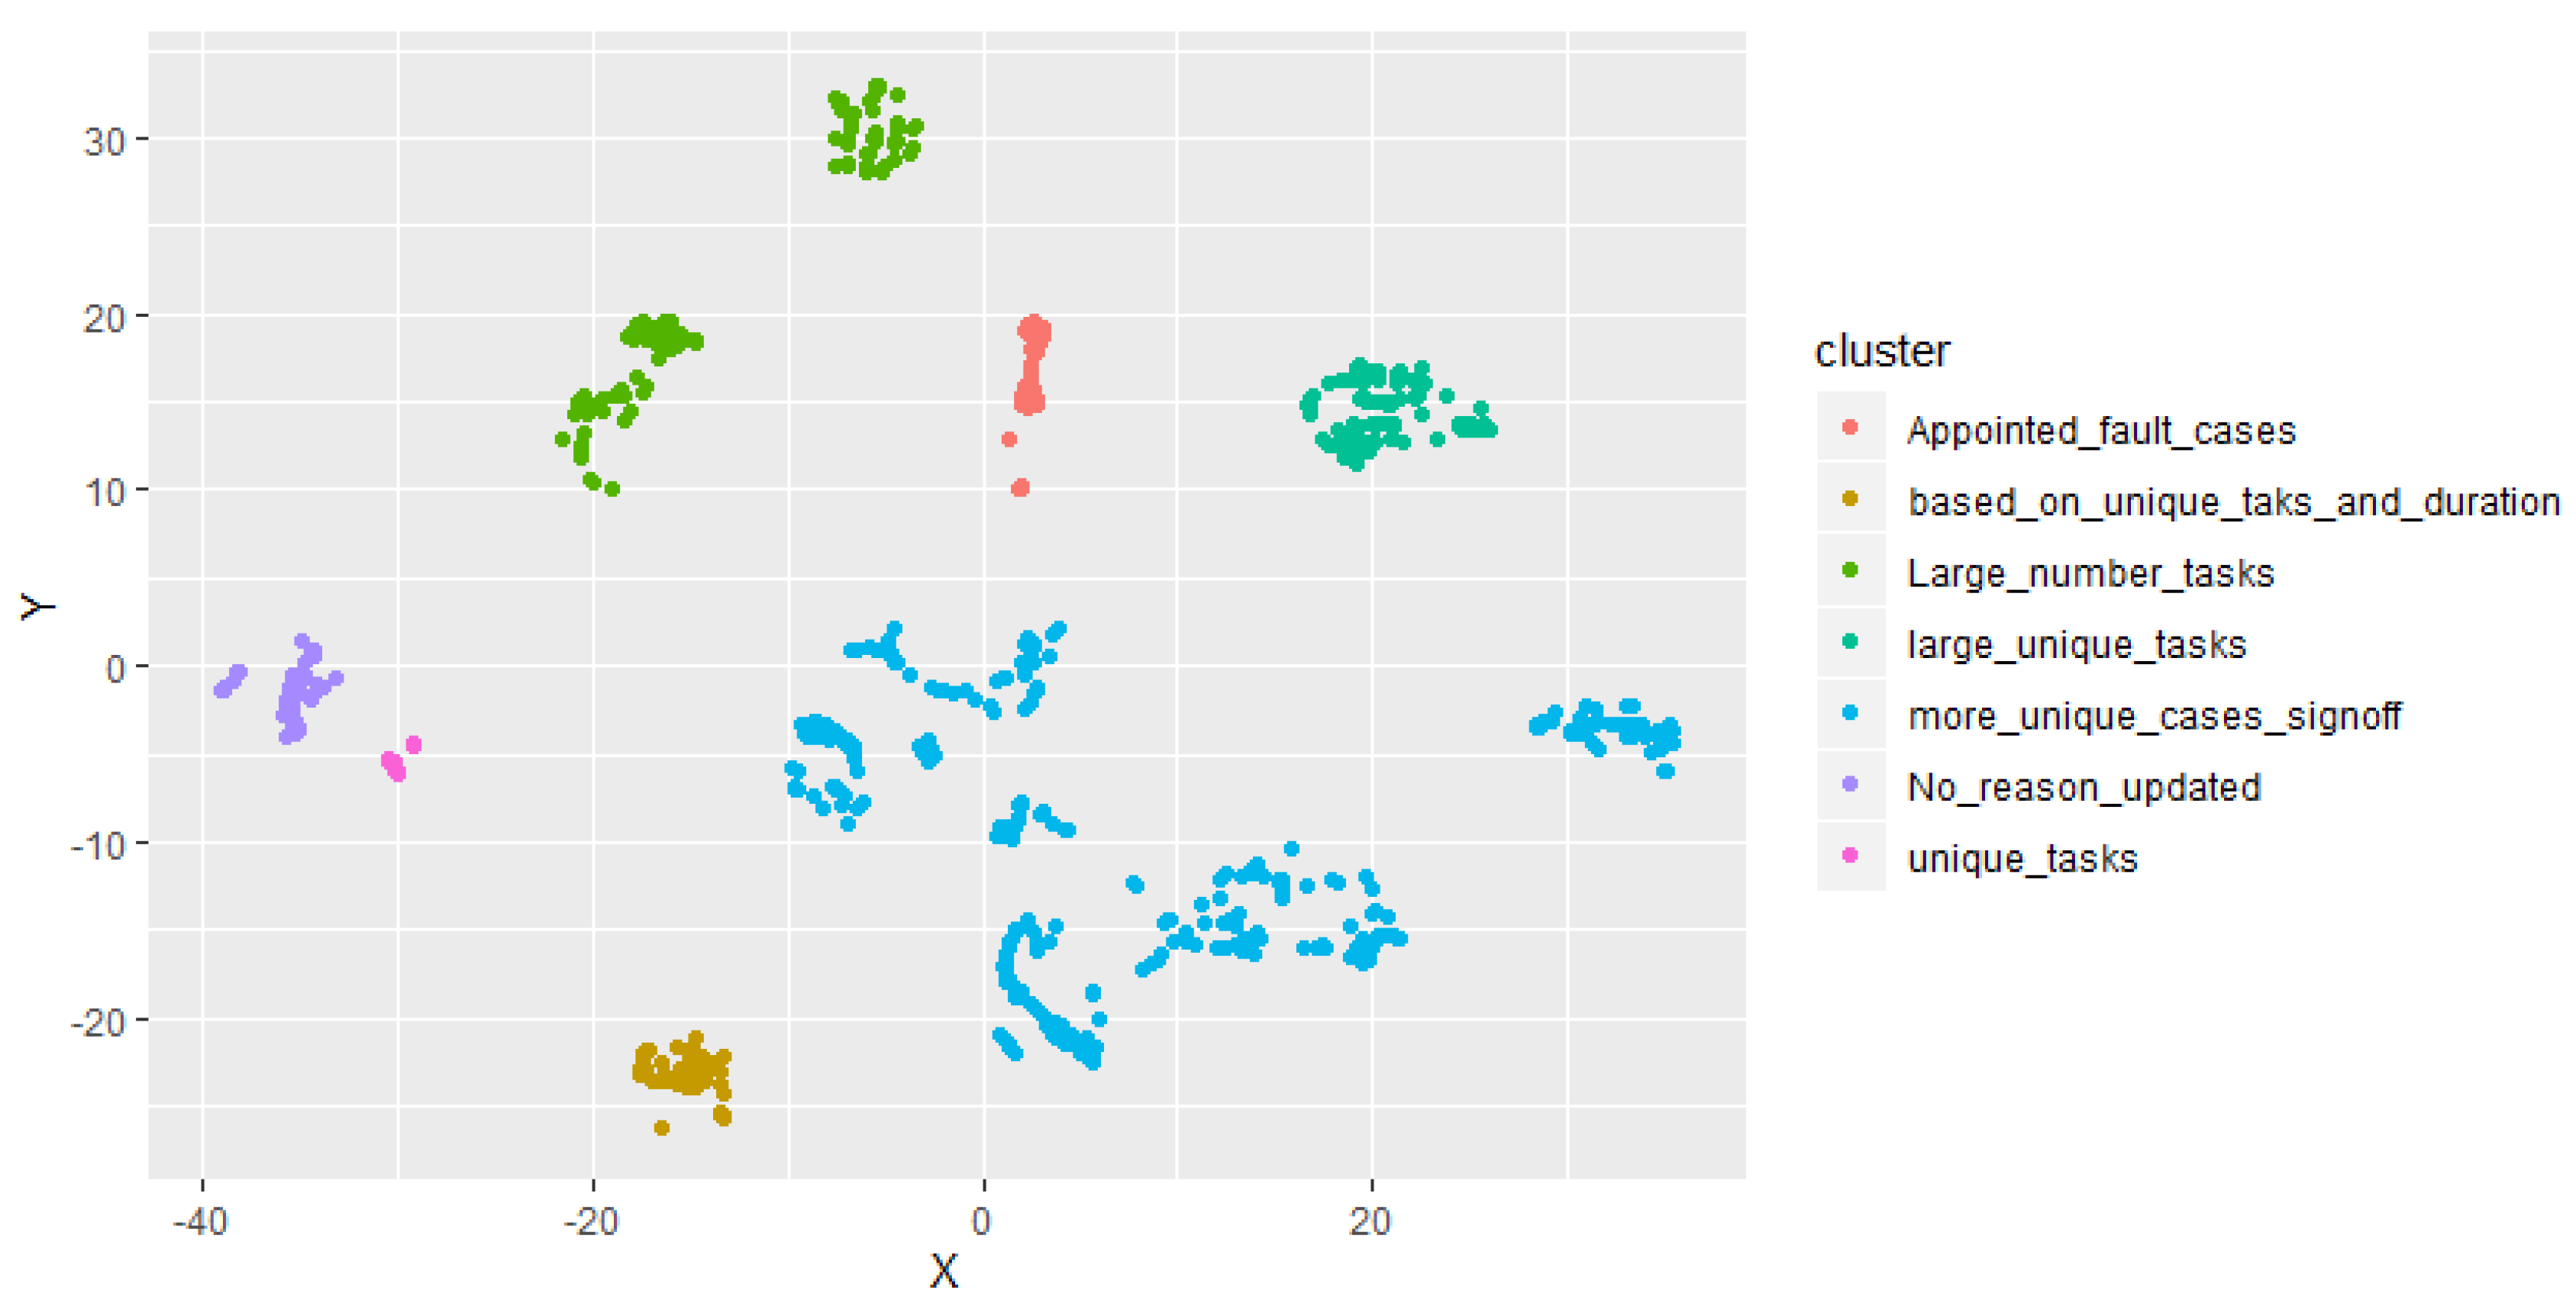
5.1.1. Are the Resultant Clusters Well Segregated?
We visualised the discovered clusters as a result of novel hierarchical clustering in a 2D plot to measure the segregation of the cases identified as a cluster. T-Distributed Stochastic Neighbour Embedding algorithm (t-SNE) is implemented in R Tool to reduce the dimension of the considered features. As shown in Figure 14 and Figure 15, data points of both Broadband and PSTN customers are plotted individually showing well-separated clusters. Colours in the plot represent the discovered clusters in each of the identified business class.
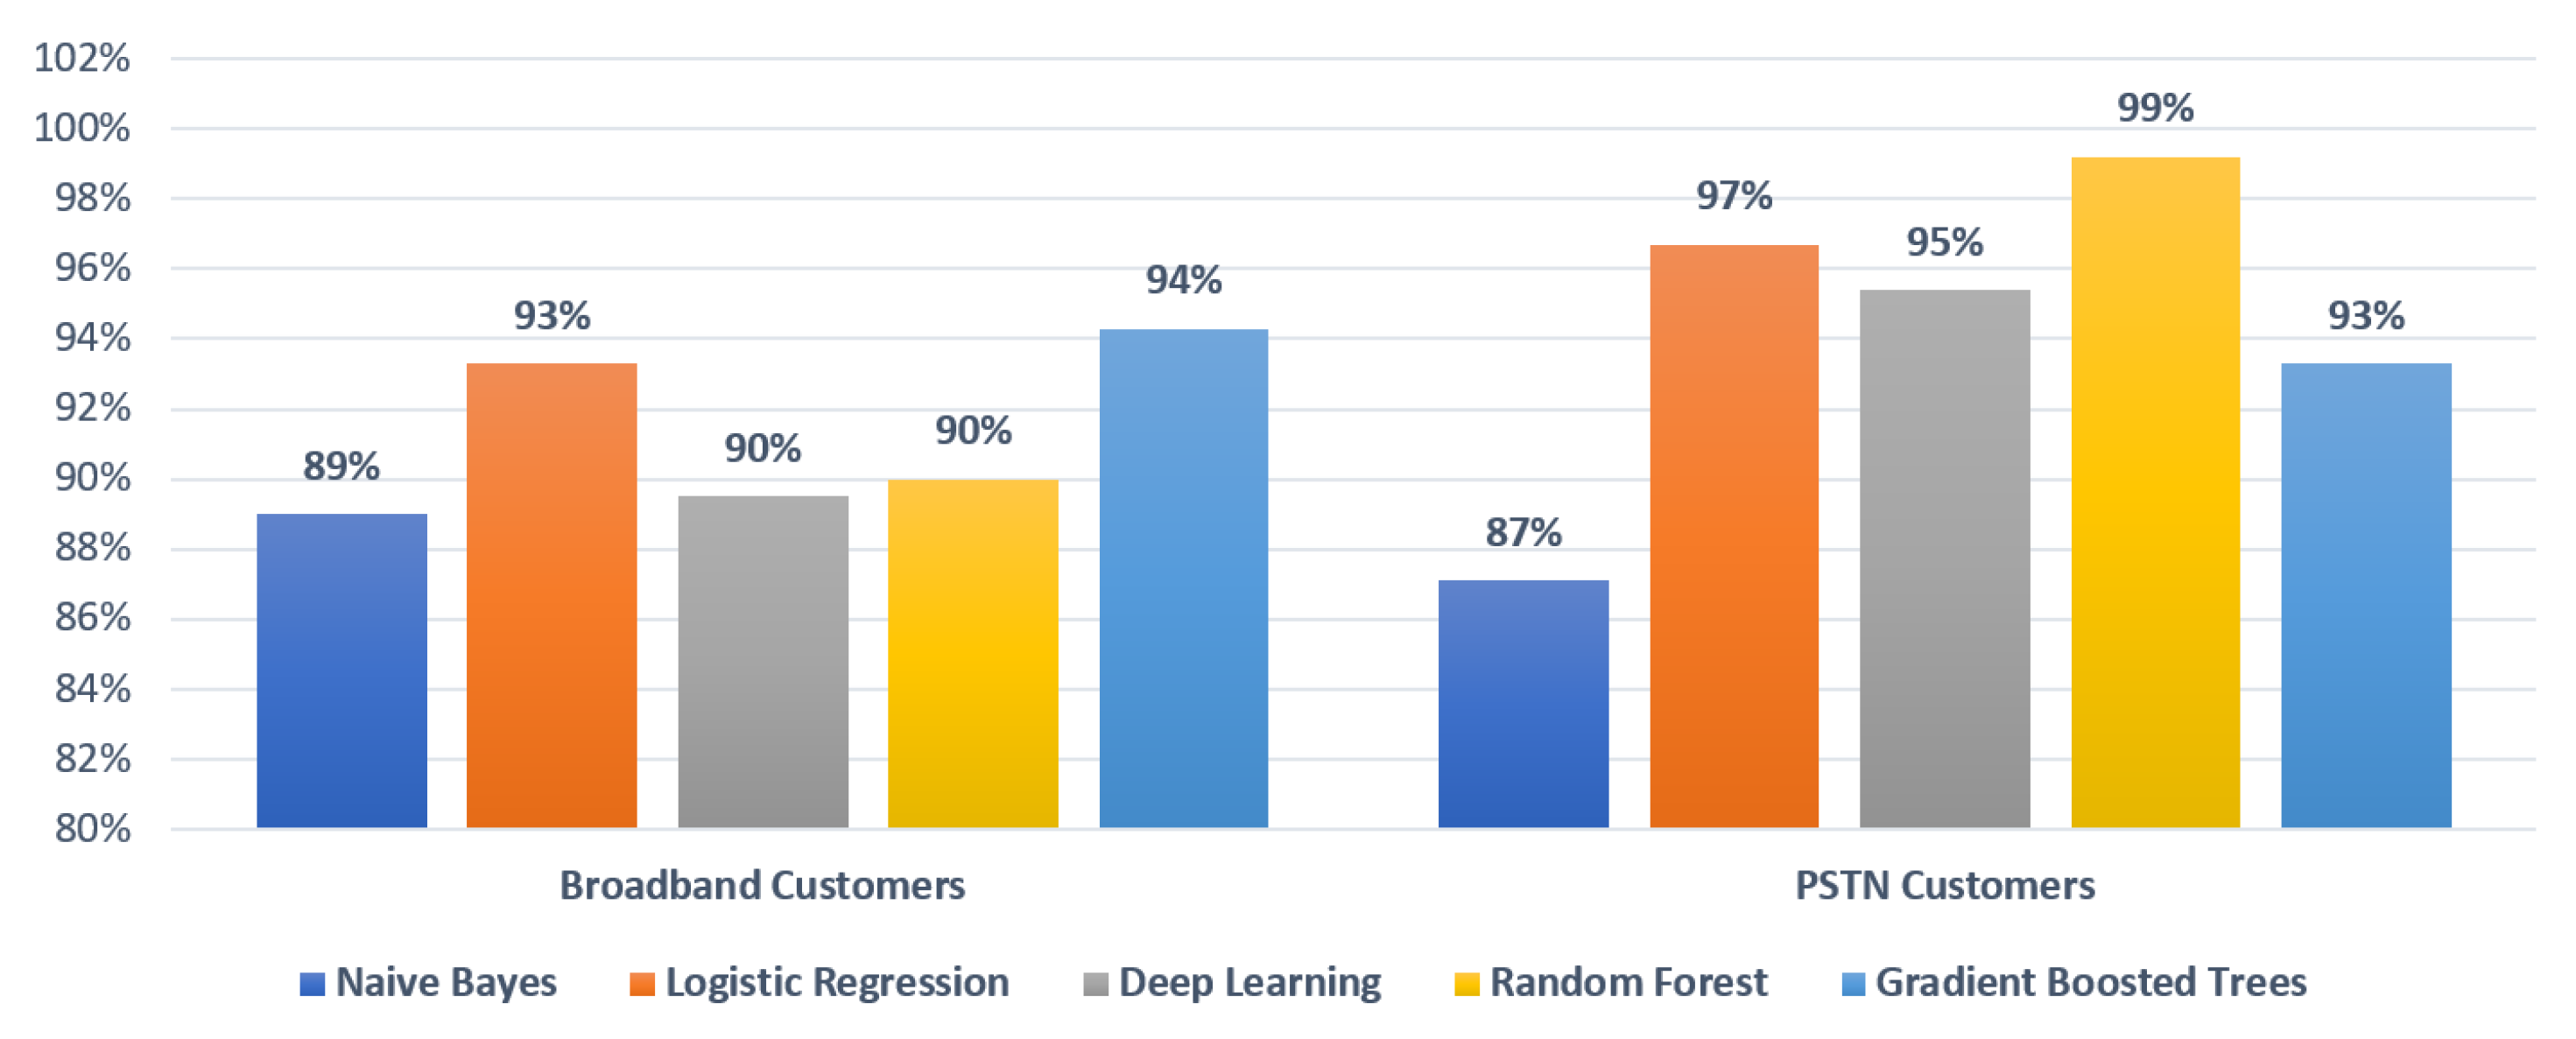
5.1.2. What Is the Classification Accuracy?
Results of clustering and labelled cases were presented to domain experts in BT and the business logic behind clusters are validated by their domain knowledge. We used traditional machine learning algorithms to measure the accuracy of the identified clusters by using the labels of the clusters. Using the output of our framework (see Figure 12), we added 6 class labels to the Broadband customers class and 7 class labels to the PSTN customers class. Results in Figure 16 show that the cases related to Broadband customers have an accuracy of 94% when classification accuracy is calculated using the Gradient Boosted Trees algorithm. 89% accuracy is achieved using Naïve Bayes algorithm and an average of 91% accuracy is achieved with Logistic Regression, Deep learning and Random Forest algorithms. Cases related to PSTN customers are predicted against 7 classes for which an average accuracy of classification is 94%. Random Forest is the most accurate with accuracy ranging 98% and Naïve Bayes produced an accuracy of 87%. Logistic regression, Deep Learning and Gradient boosted trees achieved an accuracy of 97%, 95% and 93% respectively.
5.1.3. What Is an Impact on Fitness of Log?
The overall CDP event log had a fitness value of 57.8% in the raw form which shows that conformity of the cases with process model is low when several heterogeneous classes of instances are managed together under the same process. With this low fitness it is not straightforward to understand the flows in the process log and thus identifying improvements in the business process is very complex. With our framework, we tend to minimise the complexity of the process log by reducing the size of the log through discovered meaningful clusters of cases. Though, fitness is not an ideal description of a business context as a best fitted process model may be neglecting less frequent but most important paths in a process yet. Figure 17 shows the heuristic miner process model for the cases, pre and post-implementation of our framework. At the end of stage 1, where process log is divided into two classes, the fitness of process log is increased from 57.7% to 69.7% for the broadband customer class and 73.3% for the PSTN customer class. Further improvement in fitness is achieved when hierarchical clustering is performed, and several smaller segments of the process log are created. At the end of the clustering, 13 segments of the process log are created in total with improved fitness. One of the 6 segments from Broadband customers class is presented in Figure 17 presenting fitness >90%. With this simplified portion of the process log, it is possible to implement further process mining techniques such as conformance checking and process enhancements.
5.2. Comparison with Other Trace Clustering Techniques
We compared the results of the proposed NoHiC technique (Algorithm 1) with two hierarchical clustering techniques from the literature, Agglomerative Hierarchical Clustering (AHC) proposed by Bose et al. [32] and Trace clustering (ActiTraC) proposed by Song et al. [15]. For ActiTraC we kept the default settings in the ProM 6.3 plugin ActiTrac except for the minimal and maximal cluster size. The maximum number of clusters is selected as 11 as NoHiC identified 11 clusters (as presented earlier in Section 5) and the minimum cluster size is kept to at least 20% of the log in order to avoid clusters with less than around 250 cases per cluster. For the AHC technique, we used several available settings in the ProM plugin Guide Tree Miner for features selection and distance metrics [32]. In our experiments, the Distance metric used is kept constant as a Euclidian distance and standard feature selection methods of trace clustering are used, such as MR (Maximal Repeat), TR (Tandem Repeat), SMR (Super Maximal Repeat), NSMR (Near Super Maximal Repeat) and K-Gram (k = 5). We refer to these variations in our results as MR_AHC, TR_AHC, SMR_AHC, NSMR_AHC and K-Gram_AHC.
To analyse the impact of our proposed technique we implemented ActiTraC and the five variations of AHC on two logs; the first is the CDP log as discussed throughout this paper and the other is a public process dataset available as BPI challenge 2012(BPI). A comparison of the CDP and BPI based on the characteristics of the logs is shown in Table 8. The difference in event classes and mean events per case is due to the nature of the process under consideration. In Table 9, a summary of the results is presented showing the total number of clusters generated as a result of running these experiments using both process logs. The NoHiC technique produced the highest number of clusters using CDP and only 2 less clusters using BPI, but the vital characteristic in this research is the business perspective of these clusters. As only NoHiC used business related features (presented in Section 4) none of the other technique produced the clusters which are widely meaningful and understandable for the business users. The clusters produced by AHC and ActiTraC are based on the statistical features such as MR, SMR and event sequence-based features. Values in bold show the best performance of clustering techniques against each metric for a respective dataset.
In addition to business relevance, the quality of a clustering technique is considered good if it generates clusters which are less complex and have higher fitness. Such clusters indicate that the clustering technique has discovered meaningful clusters which contain cases with similar characteristics. Fitness comparison of NoHiC with the other clustering techniques is shown in Figure 18. For both logs, NoHiC produced clusters with highest fitness average. The lowest fitness corresponds to the worst quality cluster and highest fitness represents the best quality cluster. Quality of the generated clusters should ideally remain consistent for a given technique. We also extended our comparison by measuring the complexity of the identified clusters, through NoHiC, AHC and ActiTraC using various complexity metrics [33], such as:
- Nodes per discovered cluster (N)
- Arcs per discovered cluster (A)
- Average connection degree ()
- Density (D):
- Cyclomatic number (): Number of the linearly independent cycles:
- Coefficient of connectivity ():
- Coefficient of network complexity ():
- Average number of event classes per cluster: Measure of partitioning of the traces based on functionality. Better clustering technique should have minimal event classes per cluster [32].
We used a standard configuration of Heuristic Miner [34] for the discovery of the process models from the clusters retrieved by these techniques. Table 10 shows the results of the experiments performed on two different logs. Values in bold show the best performance of clustering techniques against each metric for a respective dataset.
With the previously mentioned settings, our proposed technique produced clusters with quite similar, and often better, results when compared to the quality of the identified clusters using several complexity metrics. The average number of nodes per cluster is 580 (using CDP), which is slightly higher than the ActiTrac results but the worst cluster scenario of ActiTraC is 1947 which is very high as compared to the worst cluster scenario of NoHiC which is 760. This suggests that our technique produces clusters which are closest to the mean of feature values. However, in addition, NoHiC generated the clusters which are meaningful in the data and understandable to the business users because these clusters correspond to the business related features. The NoHiC technique also produced clusters with the best average number of classes per cluster, presented in Figure 19. K-gram feature selection using AHC and ActiTraC produced clusters with the highest number of classes, thus reinforcing the speghetti-type nature of the model generated. In contract, NSMR_AHC and NoHiC produced clusters with lowest variations in the number of classes per cluster, with averages of 580 and 697 respectively.
The above analysis suggests that our NoHiC technique is broadly consistent with the results produced by other algorithms in terms of the intrinsic characteristics of the CDP and BPI datasets such as Cyclomatic number(CN) and Coefficient of connectivity(CNC). However, NoHiC generates an overall lower number of clusters which are more aligned with the features of the business processes represented by each dataset. Also, the NoHiC technique is equally suitable for extremely large process logs exhibiting Contrail-like process.
6. Conclusions
Contrail-like models arise from real-world processes characterised by scrambled behaviour in the way events are executed to achieve organisational goals. This complexity of the event log makes it challenging to analyse the process and to propose improvements. We developed a multi-stage framework to handle large, unstructured and unlabelled process logs. Our technique is presented with an experiment conducted on the real-world case study of a telecom company’s fault diagnostic processes. Our work is a synthesis of techniques used by several researchers in the field of process mining. The significance of this research is that it analyses business process data in the context of the business logic behind the flow of events in the process, resulting in clusters of cases such that each cluster represents a unique business perspective. This allows the discovery of hidden patterns in the process and explores the possibilities of cluster-level improvement in the original process. We used R tool for preliminary pre-processing and RapidMiner tool for feature selection and hierarchical clustering. Furthermore, process models are generated and analysed for the fitness metric in the ProM tool using the heuristic miner plug-in. We tested the quality of our framework using three main questions which business users considers for assessing the usefulness of the identified clusters in the business data. We got the promising results of up to 95% with classification performed using well-known algorithms. Fitness of the clustered log is increased more than 40% and highly segregated clusters are observed when analysed in 2D plot. We compared our results with two of the well-known trace clustering techniques using BT’s process log and a public log. Results showed high fitness when our proposed technique was used to identify clusters in the raw log. In future, we will compare our results with experiments conducted on separate business processes, ideally in a different business domain such as healthcare, or banking systems. Another aspect that can be strengthened in our framework is to include real-time identification of the clusters.
Author Contributions
Conceptualization, Z.T.; methodology, Z.T., N.K.; software, Z.T.; validation, Z.T., N.K., D.C. and S.M.; formal analysis, Z.T., S.M.; investigation, Z.T.; resources, Z.T., N.K.; data curation, Z.T. and P.T.; writing—original draft preparation, Z.T.; writing—review and editing, Z.T., N.K., D.C., S.M., I.M. and P.T.; visualization, Z.T.; supervision, N.K., D.C., S.M., I.M. and P.T.; project administration, S.M. and P.T.; funding acquisition, S.M. and P.T. All authors have read and agreed to the published version of the manuscript.
Funding
This research was funded by BT and Invest Northern Ireland.
Acknowledgments
This research is supported by the BTIIC (BT Ireland Innovation Centre) project, funded by BT and Invest Northern Ireland.
Conflicts of Interest
The authors declare no conflict of interest.
Abbreviations
The following abbreviations are used in this manuscript:
| PAIS | Process-Aware Information Systems |
| BTIIC | BT Ireland Innovation Centre |
| BT | British Telecom |
| CDP | Customer Diagnostic Process |
| CBA | Classification Based on Association |
| CRD | Customer Relationship Department |
| PSTN | Public Switched Telephone Network |
| BPI | Business Process Intelligence |
References
- De Leoni, M.; van der Aalst, W.M.; Dees, M. A general process mining framework for correlating, predicting and clustering dynamic behavior based on event logs. Inf. Syst. 2016, 56, 235–257. [Google Scholar] [CrossRef]
- Van Der Aalst, W. Process Mining: Data Science in Action; Springer: Berlin/Heidelberg, Germany, 2016; pp. 243–297. [Google Scholar]
- Lingitz, L.; Gallina, V.; Ansari, F.; Gyulai, D.; Pfeiffer, A.; Monostori, L. Lead time prediction using machine learning algorithms: A case study by a semiconductor manufacturer. Procedia Cirp 2018, 72, 1051–1056. [Google Scholar] [CrossRef]
- De Alvarenga, S.C.; Barbon, S., Jr.; Miani, R.S.; Cukier, M.; Zarpelão, B.B. Process mining and hierarchical clustering to help intrusion alert visualization. Comput. Secur. 2018, 73, 474–491. [Google Scholar] [CrossRef]
- Rojas, E.; Munoz-Gama, J.; Sepúlveda, M.; Capurro, D. Process mining in healthcare: A literature review. J. Biomed. Inform. 2016, 61, 224–236. [Google Scholar] [CrossRef] [PubMed]
- Le, M.; Gabrys, B.; Nauck, D. A hybrid model for business process event and outcome prediction. Expert Syst. 2017, 34, e12079. [Google Scholar] [CrossRef] [Green Version]
- Buijs, J.C.; Van Dongen, B.F.; van Der Aalst, W.M. On the role of fitness, precision, generalization and simplicity in process discovery. In OTM Confederated International Conferences “on the Move to Meaningful Internet Systems”; Springer: Berlin/Heidelberg, Germany, 2012; pp. 305–322. [Google Scholar]
- Van Der Aalst, W.; Adriansyah, A.; De Medeiros, A.K.A.; Arcieri, F.; Baier, T.; Blickle, T.; Bose, J.C.; Van Den Brand, P.; Brandtjen, R.; Buijs, J.; et al. Process mining manifesto. In International Conference on Business Process Management, Proceedings of the BPM 2011: Business Process Management Workshops, Clermont-Ferrand, France, 30 August–2 September 2011; Springer: Berlin/Heidelberg, Germany, 2011; pp. 169–194. [Google Scholar]
- Bogarín Vega, A.; Cerezo Menéndez, R.; Romero, C. Discovering learning processes using inductive miner: A case study with learning management systems (LMSs). Psicothema 2018, 30, 322–329. [Google Scholar]
- Bose, R.J.C.; van der Aalst, W.M. Process diagnostics using trace alignment: Opportunities, issues, and challenges. Inf. Syst. 2012, 37, 117–141. [Google Scholar] [CrossRef]
- Song, M.; Günther, C.W.; Van der Aalst, W.M. Trace clustering in process mining. In International Conference on Business Process Management, Proceedings of the BPM 2008: Business Process Management Workshops, Milan, Italy, 2–4 September 2008; Springer: Berlin/Heidelberg, Germany, 2008; pp. 109–120. [Google Scholar]
- Thaler, T.; Ternis, S.F.; Fettke, P.; Loos, P. A Comparative Analysis of Process Instance Cluster Techniques. Wirtschaftsinformatik 2015, 2015, 423–437. [Google Scholar]
- Veiga, G.M.; Ferreira, D.R. Understanding spaghetti models with sequence clustering for ProM. In International Conference on Business Process Management, Proceedings of the BPM 2009: Business Process Management Workshops, Ulm, Germany, 8–10 September 2009; Springer: Berlin/Heidelberg, Germany, 2009; pp. 92–103. [Google Scholar]
- Han, K.J.; Narayanan, S.S. A robust stopping criterion for agglomerative hierarchical clustering in a speaker diarization system. In Proceedings of the Eighth Annual Conference of the International Speech Communication Association, Antwerp, Belgium, 27–31 August 2007. [Google Scholar]
- De Weerdt, J.; Vanden Broucke, S.; Vanthienen, J.; Baesens, B. Active trace clustering for improved process discovery. IEEE Trans. Knowl. Data Eng. 2013, 25, 2708–2720. [Google Scholar] [CrossRef]
- De Koninck, P.; De Weerdt, J. Multi-objective trace clustering: Finding more balanced solutions. In International Conference on Business Process Management, Proceedings of the BPM 2016: Business Process Management Workshops Rio de Janeiro, Brazil, 18–22 September 2016; Springer: Berlin/Heidelberg, Germany, 2016; pp. 49–60. [Google Scholar]
- Agrawal, R.; Imieliński, T.; Swami, A. Mining association rules between sets of items in large databases. In Proceedings of the 1993 ACM SIGMOD International Conference on Management of Data, Washington, DC, USA, 26–28 May 1993; pp. 207–216. [Google Scholar]
- Taylor, P.N.; Kiss, S. Rule-mining and clustering in business process analysis. In International Conference on Innovative Techniques and Applications of Artificial Intelligence, Proceedings of the SGAI 2018: Artificial Intelligence XXXV, Cambridge, UK, 11–13 December 2018; Springer: Cham, Switzerland, 2018; pp. 237–249. [Google Scholar]
- Thabtah, F.; Mahmood, Q.; McCluskey, L.; Abdel-Jaber, H. A new Classification based on Association Algorithm. In Journal of Information & Knowledge Management; World Scientific: Washington, DC, USA, 2010; pp. 55–64. [Google Scholar]
- Mierswa, I.; Wurst, M. Information preserving multi-objective feature selection for unsupervised learning. In Proceedings of the 8th Annual Conference on Genetic and Evolutionary Computation, Seattle, WA, USA, 8–12 July 2006; pp. 1545–1552. [Google Scholar]
- Greco, G.; Guzzo, A.; Pontieri, L.; Sacca, D. Mining expressive process models by clustering workflow traces. In Pacific-Asia Conference on Knowledge Discovery and Data Mining, Proceedings of the PAKDD 2004: Advances in Knowledge Discovery and Data Mining, Sydney, Australia, 26–28 May 2004; Springer: Berlin/Heidelberg, Germany, 2004; pp. 52–62. [Google Scholar]
- Van der Aalst, W.M.; Rubin, V.; Verbeek, H.; van Dongen, B.F.; Kindler, E.; Günther, C.W. Process mining: A two-step approach to balance between underfitting and overfitting. Softw. Syst. Model. 2010, 9, 87. [Google Scholar] [CrossRef] [Green Version]
- Rozinat, A.; Van der Aalst, W.M. Conformance checking of processes based on monitoring real behavior. Inf. Syst. 2008, 33, 64–95. [Google Scholar] [CrossRef]
- Contrail Shots. 2020. Available online: https://www.flickr.com/groups/contrails/pool/with/50114576393/ (accessed on 25 September 2020).
- Unterstrasser, S.; Stephan, A. Far field wake vortex evolution of two aircraft formation flight and implications on young contrails. Aeronaut. J. 2020, 124, 667–702. [Google Scholar] [CrossRef] [Green Version]
- Abd Ellatif, M.; Shaaban, E.M.; Amin, M.A. Detecting Deviations in Business Processes Using Process Mining. In Proceedings of the 2019 14th International Conference on Computer Engineering and Systems (ICCES), Cairo, Egypt, 17 December 2019; pp. 49–54. [Google Scholar]
- Aguwa, C.; Olya, M.H.; Monplaisir, L. Modeling of fuzzy-based voice of customer for business decision analytics. Knowl.-Based Syst. 2017, 125, 136–145. [Google Scholar] [CrossRef]
- Solorio-Fernández, S.; Carrasco-Ochoa, J.A.; Martínez-Trinidad, J.F. A review of unsupervised feature selection methods. Artif. Intell. Rev. 2020, 53, 907–948. [Google Scholar] [CrossRef]
- Gower, J.C. A general coefficient of similarity and some of its properties. Biometrics 1971, 27, 857–871. [Google Scholar] [CrossRef]
- Park, H.S.; Jun, C.H. A simple and fast algorithm for K-medoids clustering. Expert Syst. Appl. 2009, 36, 3336–3341. [Google Scholar]
- Hahsler, M.; Johnson, I.; Kliegr, T.; Kucha, J. Associative Classification in R: Arc, arulesCBA, and rCBA. R J. 2019, 9, 254–267. [Google Scholar] [CrossRef]
- Bose, R.J.C.; van der Aalst, W.M. Trace clustering based on conserved patterns: Towards achieving better process models. In International Conference on Business Process Management, Proceedings of the BPM 2009: Business Process Management Workshops, Ulm, Germany, 8–10 September 2009; Springer: Berlin/Heidelberg, Germany, 2009; pp. 170–181. [Google Scholar]
- Delias, P.; Doumpos, M.; Grigoroudis, E.; Matsatsinis, N. A non-compensatory approach for trace clustering. Int. Trans. Oper. Res. 2019, 26, 1828–1846. [Google Scholar] [CrossRef]
- Van der Aalst, W.M.; Weijters, A.J. Process mining: A research agenda. Comput. Ind. 2004, 53, 231–244. [Google Scholar] [CrossRef]
Figure 1.
Samples of Spaghetti and Lasagna processes. (a) Example of Spaghetti Process; (b) Example of Lasagna Process.
Figure 1.
Samples of Spaghetti and Lasagna processes. (a) Example of Spaghetti Process; (b) Example of Lasagna Process.

Figure 2.
Example of contrails in the sky–forming mixture of structured and unstructured patterns [24].
Figure 2.
Example of contrails in the sky–forming mixture of structured and unstructured patterns [24].

Figure 3.
Heuristic miner model for customer diagnostic process.

Figure 4.
Fuzzy miner model of the BT’s Customer Diagnostic Process.

Figure 5.
Multi-stage framework for business process log clustering.

Figure 6.
Implementation model for the stage-1.

Figure 7.
Sample flow of events in CDP.

Figure 8.
Sample task list with unique identifier and events-Explorer view ProM tool.

Figure 9.
Data considered is Level-1 of the clustering tree, all cases belong to class-A (Broadband customers). (a) Curve of average silhouette width to identify optimal number of clusters; (b) Plot showing separation of cases with optimal number of clusters identified, two in this case.
Figure 9.
Data considered is Level-1 of the clustering tree, all cases belong to class-A (Broadband customers). (a) Curve of average silhouette width to identify optimal number of clusters; (b) Plot showing separation of cases with optimal number of clusters identified, two in this case.

Figure 10.
Data considered is Level-1 of the clustering tree, all cases belong to class-B (PSTN customers). (a) Curve of average silhouette width to identify optimal number of clusters; (b) Plot showing separation of cases with optimal number of clusters identified, four in this case.
Figure 10.
Data considered is Level-1 of the clustering tree, all cases belong to class-B (PSTN customers). (a) Curve of average silhouette width to identify optimal number of clusters; (b) Plot showing separation of cases with optimal number of clusters identified, four in this case.

Figure 11.
Data considered is Level-3 of the clustering tree, all cases belong to class-B (PSTN customers). (a) Curve of average silhouette width to identify optimal number of clusters; (b) Plot showing separation of cases with optimal number of clusters identified, two in this case.
Figure 11.
Data considered is Level-3 of the clustering tree, all cases belong to class-B (PSTN customers). (a) Curve of average silhouette width to identify optimal number of clusters; (b) Plot showing separation of cases with optimal number of clusters identified, two in this case.

Figure 12.
Resultant clustering tree with labels.

Figure 13.
Separate Heuristic miner models of high level categories in the process log. (a) Heuristic miner model of the cases related to Class-A (Broadband customers); (b) Heuristic miner model of the cases related to Class-B (PSTN customers).
Figure 13.
Separate Heuristic miner models of high level categories in the process log. (a) Heuristic miner model of the cases related to Class-A (Broadband customers); (b) Heuristic miner model of the cases related to Class-B (PSTN customers).

Figure 14.
Broadband customer’s identified clusters among 736 cases.

Figure 15.
PSTN customer’s identified clusters among 844 cases.

Figure 16.
Prediction accuracy with five classification algorithms.

Figure 17.
Impact of model fitness at each stage of the framework.

Figure 18.
Comparison of lowest, average and highest fitness of the clusters generated by three trace clustering techniques.
Figure 18.
Comparison of lowest, average and highest fitness of the clusters generated by three trace clustering techniques.

Figure 19.
Comparison of techniques for the best average number of events classes per cluster.


Table 1.
Summary of the Customer Diagnostic Process log.
| Subcategory | Related Cases | Complete | Number of Cases |
|---|---|---|---|
| in Process Log | Cases | Used in Study | |
| Broadband | 47% | 89% | 736 |
| PSTN | 53% | 90% | 844 |
Table 2.
Sample results of sequential rules mining.
| # | Sequences | Support | Target Business Class |
|---|---|---|---|
| 1 | (120>3913) | 0.63 | Broadband customers |
| 2 | (3913>4172) | 0.52 | Broadband customers |
| 3 | (120>3913) & (3913>4172) | 0.52 | Broadband customers |
| 4 | (120>3913) & (3913>4172) & (4172>2372) | 0.52 | Broadband customers |
| 5 | (120>3913) & (4172>2372) | 0.52 | PSTN customers |
| 6 | (3913>4172) & (4172>2372) | 0.52 | PSTN customers |
| 7 | (4172>2372) | 0.52 | PSTN customers |
| 8 | (2486>120) | 0.49 | PSTN customers |
Table 3.
Initial feature set before the selection of discriminating features.
| Feature_ID | Feature Details | Denoted by | Feature Type | Correlation | ID-Ness | Stability | Missing |
|---|---|---|---|---|---|---|---|
| Duration | Duration of task | Statistical | Weak | No | No | No | |
| Num_tasks | total number of appeared tasks within the process | aT | Statistical | Weak | No | No | No |
| Num_unique | total number of unique tasks | uT | Statistical | Weak | No | No | No |
| Num_rep | total number of tasks which are repeated | rT | Statistical | Strong | No | No | No |
| Department | Department handling the case | dH | Business | No | No | Strong | Yes |
| End progress | Case conclusion remarks | cR | Business | No | No | Strong | No |
| Exit-1 | Exit comment #1 entered by agent | eC1 | Business | Strong | No | Weak | Yes |
| Exit-2 | Exit comment #2 entered by agent | eC2 | Business | No | No | No | No |
| Exit-3 | Exit comment #3 entered by agent | eC3 | Business | No | No | No | No |
Table 4.
Table representing sample values of features for each individual case.
| Case_ID | Duration | Num_TASKS | Num_UNIQUE | End Progress | Exit 2 | Exit 3 |
|---|---|---|---|---|---|---|
| C_01 | 404 | 511 | 292 | End Call | Not selected | appointedFault |
| C_02 | 146 | 377 | 233 | End Call | Sent to WS for ENG | nonAppointedFault |
| C_03 | 366 | 314 | 204 | Progress Saved | 0 | Service Outage |
| C_04 | 333 | 317 | 204 | End Call | 0 | Service Outage |
| C_05 | 367 | 351 | 218 | End Call | No reason given | No reason given |
| C_06 | 754 | 353 | 223 | Progress Saved | Fixed by restarting Hub | 0 |
| C_07 | 169 | 298 | 187 | End Call | No reason given | nonAppointedFault |
| C_08 | 231 | 285 | 184 | End Call | No reason given | nonAppointedFault |
Table 5.
Most similar cases identified by the Gower Distance Matrix.
| Case_ID | Duration | # of Tasks | # of Unique Tasks | End Progress | Exit 2 | Exit 3 |
|---|---|---|---|---|---|---|
| C_722 | 5 | 143 | 123 | End Call | Outcome | Refer to legacy No Connection |
| C_1221 | 4 | 143 | 123 | End Call | Outcome | Refer to legacy No Connection |
Table 6.
Most dissimilar cases identified by the Gower Distance Matrix.
| Case_ID | Duration | # of Tasks | # of Unique Tasks | End Progress | Exit 2 | Exit 3 |
|---|---|---|---|---|---|---|
| C_131 | 14358 | 186 | 154 | Progress Saved | 0 | 0 |
| C_982 | 503 | 443 | 271 | End Call | Outcome | Booked_appointment |
Table 7.
Classification results at the end of Stage-1.
| Minimum Support | Accuracy | Sensitivity | F1 Score |
|---|---|---|---|
| 30% | 97.22% | 94.00% | 97.14% |
| 35% | 98.12% | 96.20% | 98.00% |
| 40% | 94.40% | 88.80% | 94.11% |
| 45% | 94.40% | 88.80% | 94.11% |
Table 8.
Comparison of CDP and BPI logs.
| Number of Events | Event Classes | Mean Events Per Case | Mean Classes Per Case | Start Event Classes | End Event Classes | |
|---|---|---|---|---|---|---|
| CDP | 276635 | 1947 | 277 | 178 | 9 | 74 |
| BPI | 262200 | 36 | 20 | 12 | 1 | 13 |
Table 9.
Summary of the discovered clusters through NoHiC, ActiTraC and AHC trace clustering techniques.
Table 9.
Summary of the discovered clusters through NoHiC, ActiTraC and AHC trace clustering techniques.
| CDP | BPI | |||||
|---|---|---|---|---|---|---|
| Identified clusters | Business Perspective | Avg. Fitness Per Cluster | Identified Clusters | Business Perspective | Avg. Fitness Per Cluster | |
| NoHiC | 11 | Yes | 0.87 | 6 | Yes | 0.75 |
| ActiTraC | 9 | No | 0.81 | 9 | No | 0.66 |
| K-Gram_AHC | 4 | No | 0.8 | 4 | No | 0.63 |
| TR_AHC | 4 | No | 0.77 | 4 | No | 0.63 |
| MR_AHC | 4 | No | 0.78 | 4 | No | 0.63 |
| SMR_AHC | 4 | No | 0.82 | 4 | No | 0.74 |
| NSMR_AHC | 4 | No | 0.77 | 4 | No | 0.37 |
Table 10.
Comparison of the complexity metrics for discovered clusters through NoHiC, ActiTraC and AHC trace clustering techniques.
Table 10.
Comparison of the complexity metrics for discovered clusters through NoHiC, ActiTraC and AHC trace clustering techniques.
| Avg.N | Avg.A | D | Avg. | Avg. | Avg. | |||
|---|---|---|---|---|---|---|---|---|
| CDP | NoHiC | 580 | 915.67 | 3.06 | 0.003 | 336.67 | 1.58 | 0.05 |
| ActiTraC | 571.18 | 993.36 | 2.85 | 0.01 | 423.18 | 1.74 | 0.06 | |
| K-Gram_AHC | 707.25 | 1311.75 | 2.93 | 0.004 | 425.5 | 1.6 | 0.05 | |
| TR_AHC | 816.25 | 1311.25 | 3.22 | 0.001 | 496 | 1.61 | 0.04 | |
| MR_AHC | 789.25 | 1255.75 | 3.19 | 0.002 | 467.5 | 1.59 | 0.04 | |
| SMR_AHC | 814.75 | 1293 | 3.14 | 0.001 | 479.25 | 1.59 | 0.04 | |
| NSMR_AHC) | 697 | 1121.5 | 3.11 | 0.003 | 425.5 | 1.61 | 0.05 | |
| BPI | NoHiC | 24 | 41.75 | 3.47 | 0.06 | 18.75 | 1.74 | 0.27 |
| ActiTraC | 32.73 | 59.91 | 3.6 | 0.05 | 28.18 | 1.83 | 0.24 | |
| K-Gram_AHC | 26.75 | 50.75 | 3.47 | 0.06 | 25 | 1.9 | 0.27 | |
| TR_AHC | 29.5 | 57.75 | 3.74 | 0.06 | 29.25 | 1.96 | 0.26 | |
| MR_AHC | 28.5 | 50.75 | 3.47 | 0.06 | 25 | 1.9 | 0.27 | |
| SMR_AHC | 26.25 | 47 | 3.59 | 0.06 | 23.5 | 1.92 | 0.28 | |
| NSMR_AHC) | 35 | 71.25 | 4.05 | 0.05 | 37.25 | 2.04 | 0.24 | |
© 2020 by the authors. Licensee MDPI, Basel, Switzerland. This article is an open access article distributed under the terms and conditions of the Creative Commons Attribution (CC BY) license (http://creativecommons.org/licenses/by/4.0/).
Share and Cite
MDPI and ACS Style
Tariq, Z.; Khan, N.; Charles, D.; McClean, S.; McChesney, I.; Taylor, P. Understanding Contrail Business Processes through Hierarchical Clustering: A Multi-Stage Framework. Algorithms 2020, 13, 244. https://doi.org/10.3390/a13100244
AMA Style
Tariq Z, Khan N, Charles D, McClean S, McChesney I, Taylor P. Understanding Contrail Business Processes through Hierarchical Clustering: A Multi-Stage Framework. Algorithms. 2020; 13(10):244. https://doi.org/10.3390/a13100244
Chicago/Turabian StyleTariq, Zeeshan, Naveed Khan, Darryl Charles, Sally McClean, Ian McChesney, and Paul Taylor. 2020. "Understanding Contrail Business Processes through Hierarchical Clustering: A Multi-Stage Framework" Algorithms 13, no. 10: 244. https://doi.org/10.3390/a13100244
Note that from the first issue of 2016, this journal uses article numbers instead of page numbers. See further details here.