

Effective Heart Disease Prediction Using Machine Learning Techniques

1
Department of Computer Science and Engineering, School of Technology, Pandit Deendayal Energy University, Gandhinagar 382007, India
2
Institute of Applied Sciences and Intelligent Systems, National Research Council of Italy, 73100 Lecce, Italy
*
Authors to whom correspondence should be addressed.
Algorithms 2023, 16(2), 88; https://doi.org/10.3390/a16020088
Submission received: 27 December 2022
/
Revised: 1 February 2023
/
Accepted: 1 February 2023
/
Published: 6 February 2023
(This article belongs to the Special Issue Artificial Intelligence Algorithms for Healthcare)
Abstract
:The diagnosis and prognosis of cardiovascular disease are crucial medical tasks to ensure correct classification, which helps cardiologists provide proper treatment to the patient. Machine learning applications in the medical niche have increased as they can recognize patterns from data. Using machine learning to classify cardiovascular disease occurrence can help diagnosticians reduce misdiagnosis. This research develops a model that can correctly predict cardiovascular diseases to reduce the fatality caused by cardiovascular diseases. This paper proposes a method of k-modes clustering with Huang starting that can improve classification accuracy. Models such as random forest (RF), decision tree classifier (DT), multilayer perceptron (MP), and XGBoost (XGB) are used. GridSearchCV was used to hypertune the parameters of the applied model to optimize the result. The proposed model is applied to a real-world dataset of 70,000 instances from Kaggle. Models were trained on data that were split in 80:20 and achieved accuracy as follows: decision tree: 86.37% (with cross-validation) and 86.53% (without cross-validation), XGBoost: 86.87% (with cross-validation) and 87.02% (without cross-validation), random forest: 87.05% (with cross-validation) and 86.92% (without cross-validation), multilayer perceptron: 87.28% (with cross-validation) and 86.94% (without cross-validation). The proposed models have AUC (area under the curve) values: decision tree: 0.94, XGBoost: 0.95, random forest: 0.95, multilayer perceptron: 0.95. The conclusion drawn from this underlying research is that multilayer perceptron with cross-validation has outperformed all other algorithms in terms of accuracy. It achieved the highest accuracy of 87.28%.
1. Introduction
Globally, cardiovascular disease (CVDs) is the primary cause of morbidity and mortality, accounting for more than 70% of all fatalities. According to the 2017 Global Burden of Disease research, cardiovascular disease is responsible for about 43% of all fatalities [1,2]. Common risk factors for heart disease in high-income nations include lousy diet, cigarette use, excessive sugar consumption, and obesity or excess body fat [3,4]. However, low- and middle-income nations also see a rise in chronic illness prevalence [5]. Between 2010 and 2015, the global economic burden of cardiovascular diseases was expected to reach roughly USD 3.7 trillion [6,7] (Mozaffarian et al., 2015; Maiga et al., 2019).
In addition, technologies such as electrocardiograms and CT scans, critical for diagnosing coronary heart disease, are sometimes too costly and impractical for consumers. The reason mentioned above alone has resulted in the deaths of 17 million people [5]. Twenty-five to thirty percent of firms’ annual medical expenses were attributable to employees with cardiovascular disease [8]. Therefore, early detection of heart disease is essential to lessen its physical and monetary cost to people and institutions. According to the WHO estimate, the overall number of deaths from CVDs would rise to 23.6 million by 2030, with heart disease and stroke being the leading causes [9]. To save lives and decrease the cost burden on society, it is vital to apply data mining and machine learning methods to anticipate the chance of having heart disease.
Heart disease, specifically cardiovascular disease (CVDs), is a leading cause of morbidity and mortality worldwide, accounting for over 70% of all global deaths. According to the Global Burden of Disease Study 2017, CVD accounts for more than 43% of all deaths. Common risk factors associated with heart disease include unhealthy food, tobacco, excessive sugar, and overweight or extra body fat, often found in high-income countries. However, low- and middle-income countries are also seeing an increase in the prevalence of chronic diseases. The economic burden of CVDs worldwide has been estimated to be approximately USD 3.7 trillion between 2010 and 2015.
Furthermore, devices such as electrocardiograms and CT scans, essential for detecting coronary heart disease, are often too expensive and infeasible for many low- and middle-income countries. Therefore, early determination of heart disease is crucial to decrease its physical and financial burden on individuals and organizations. According to a WHO report, by 2030, the total number of deaths due to CVDs will increase to 23.6 million, mainly from heart disease and stroke. Therefore, it is crucial to use data mining and machine learning techniques to predict the likelihood of developing heart disease in order to save lives and reduce the economic burden on society.
In the medical field, a vast amount of data is generated daily using data mining techniques, and we can find hidden patterns that can be used for clinical diagnosis [10]. Therefore, data mining plays a vital role in the medical field, which can be proved by the work conducted in the past few decades. Many factors, such as diabetes, high blood pressure, high cholesterol, and abnormal pulse rate, need to be considered when predicting heart disease [11]. Often, the medical data available need to be completed, affecting the results in predicting heart disease.
Machine learning plays a crucial role in the medical field. Using machine learning, we can diagnose, detect, and predict various diseases. Recently, there has been a growing interest in using data mining and machine learning techniques to predict the likelihood of developing certain diseases. The already-existing work contains applications of data mining techniques for predicting the disease. Although some studies have attempted to predict the future risk of the progression of the disease, they have yet to find accurate results [12]. The main goal of this paper is to accurately predict the possibility of heart disease in the human body.
In this research, we aim to investigate the effectiveness of various machine learning algorithms in predicting heart disease. To achieve this goal, we employed a variety of techniques, including random forest [13], decision tree classifier, multilayer perceptron, and XGBoost [14], to build predictive models. In order to improve the convergence of the models, we applied k-modes clustering to preprocess the dataset and scale it. The dataset used in this study is publicly available on Kaggle. All the computation, preprocessing, and visualization were conducted on Google Colab using Python. Previous studies have reported accuracy rates of up to 94% [15] using machine learning techniques for heart disease prediction. However, these studies have often used small sample sizes, and the results may not be generalizable to larger populations. Our study aims to address this limitation by using a larger and more diverse dataset, which is expected to increase the generalizability of the results.
2. Literature Survey
In recent years, the healthcare industry has seen a significant advancement in the field of data mining and machine learning. These techniques have been widely adopted and have demonstrated efficacy in various healthcare applications, particularly in the field of medical cardiology. The rapid accumulation of medical data has presented researchers with an unprecedented opportunity to develop and test new algorithms in this field. Heart disease remains a leading cause of mortality in developing nations [12,13,14,15,16], and identifying risk factors and early signs of the disease has become an important area of research. The utilization of data mining and machine learning techniques in this field can potentially aid in the early detection and prevention of heart disease.
The purpose of the study described by Narain et al. (2016) [17] is to create an innovative machine-learning-based cardiovascular disease (CVD) prediction system in order to increase the precision of the widely used Framingham risk score (FRS). With the help of data from 689 individuals who had symptoms of CVD and a validation dataset from the Framingham research, the proposed system—which uses a quantum neural network to learn and recognize patterns of CVD—was experimentally validated and compared with the FRS. The suggested system’s accuracy in forecasting CVD risk was determined to be 98.57%, which is much greater than the FRS’s accuracy of 19.22% and other existing techniques. According to the study’s findings, the suggested approach could be a useful tool for doctors in forecasting CVD risk, assisting in the creation of better treatment plans, and facilitating early diagnosis.
In a study conducted by Shah et al. (2020) [18], the authors aimed to develop a model for predicting cardiovascular disease using machine learning techniques. The data used for this purpose were obtained from the Cleveland heart disease dataset, which consisted of 303 instances and 17 attributes, and were sourced from the UCI machine learning repository. The authors employed a variety of supervised classification methods, including naive Bayes, decision tree, random forest, and k-nearest neighbor (KKN). The results of the study indicated that the KKN model exhibited the highest level of accuracy, at 90.8%. The study highlights the potential utility of machine learning techniques in predicting cardiovascular disease, and emphasizes the importance of selecting appropriate models and techniques to achieve optimal results.
In a study by Drod et al. (2022) [2], the objective was to use machine learning (ML) techniques to identify the most significant risk variables for cardiovascular disease (CVD) in patients with metabolic-associated fatty liver disease (MAFLD). Blood biochemical analysis and subclinical atherosclerosis assessment were performed on 191 MAFLD patients. A model to identify those with the highest risk of CVD was built using ML approaches, such as multiple logistic regression classifier, univariate feature ranking, and principal component analysis (PCA). According to the study, hypercholesterolemia, plaque scores, and duration of diabetes were the most crucial clinical characteristics. The ML technique performed well, correctly identifying 40/47 (85.11%) high-risk patients and 114/144 (79.17%) low-risk patients with an AUC of 0.87. According to the study’s findings, an ML method is useful for detecting MAFLD patients with widespread CVD based on simple patient criteria.
In a study published by Alotalibi (2019) [19], the author aimed to investigate the utility of machine learning (ML) techniques for predicting heart failure disease. The study utilized a dataset from the Cleveland Clinic Foundation, and implemented various ML algorithms, such as decision tree, logistic regression, random forest, naive Bayes, and support vector machine (SVM), to develop prediction models. A 10-fold cross-validation approach was employed during the model development process. The results indicated that the decision tree algorithm achieved the highest accuracy in predicting heart disease, with a rate of 93.19%, followed by the SVM algorithm at 92.30%. This study provides insight into the potential of ML techniques as an effective tool for predicting heart failure disease and highlights the decision tree algorithm as a potential option for future research.
Through a comparison of multiple algorithms, Hasan and Bao (2020) [20] carried out a study with the main objective of identifying the most efficient feature selection approach for anticipating cardiovascular illness. The three well-known feature selection methods (filter, wrapper, and embedding) were first taken into account, and then a feature subset was recovered from these three algorithms using a Boolean process-based common “True” condition. This technique involved retrieving feature subsets in two stages. A number of models, including random forest, support vector classifier, k-nearest neighbors, naive Bayes, and XGBoost, were taken into account in order to justify the comparative accuracy and identify the best predictive analytics. As a standard for comparison with all features, the artificial neural network (ANN) was used. The findings demonstrated that the most accurate prediction results for cardiovascular illness were provided by the XGBoost classifier coupled with the wrapper technique. XGBoost delivered an accuracy of 73.74%, followed by SVC with 73.18% and ANN with 73.20%.
The primary drawback of the prior research is its limited dataset, resulting in a high risk of overfitting. The models developed may not be appropriate for large datasets. In contrast, we utilized a cardiovascular disease dataset consisting of 70,000 patients and 11 features, thereby reducing the chance of overfitting. Table 1 presents a concise review of cardiovascular disease prediction studies performed on large datasets, further reinforcing the effectiveness of using a substantial dataset.
3. Methodology
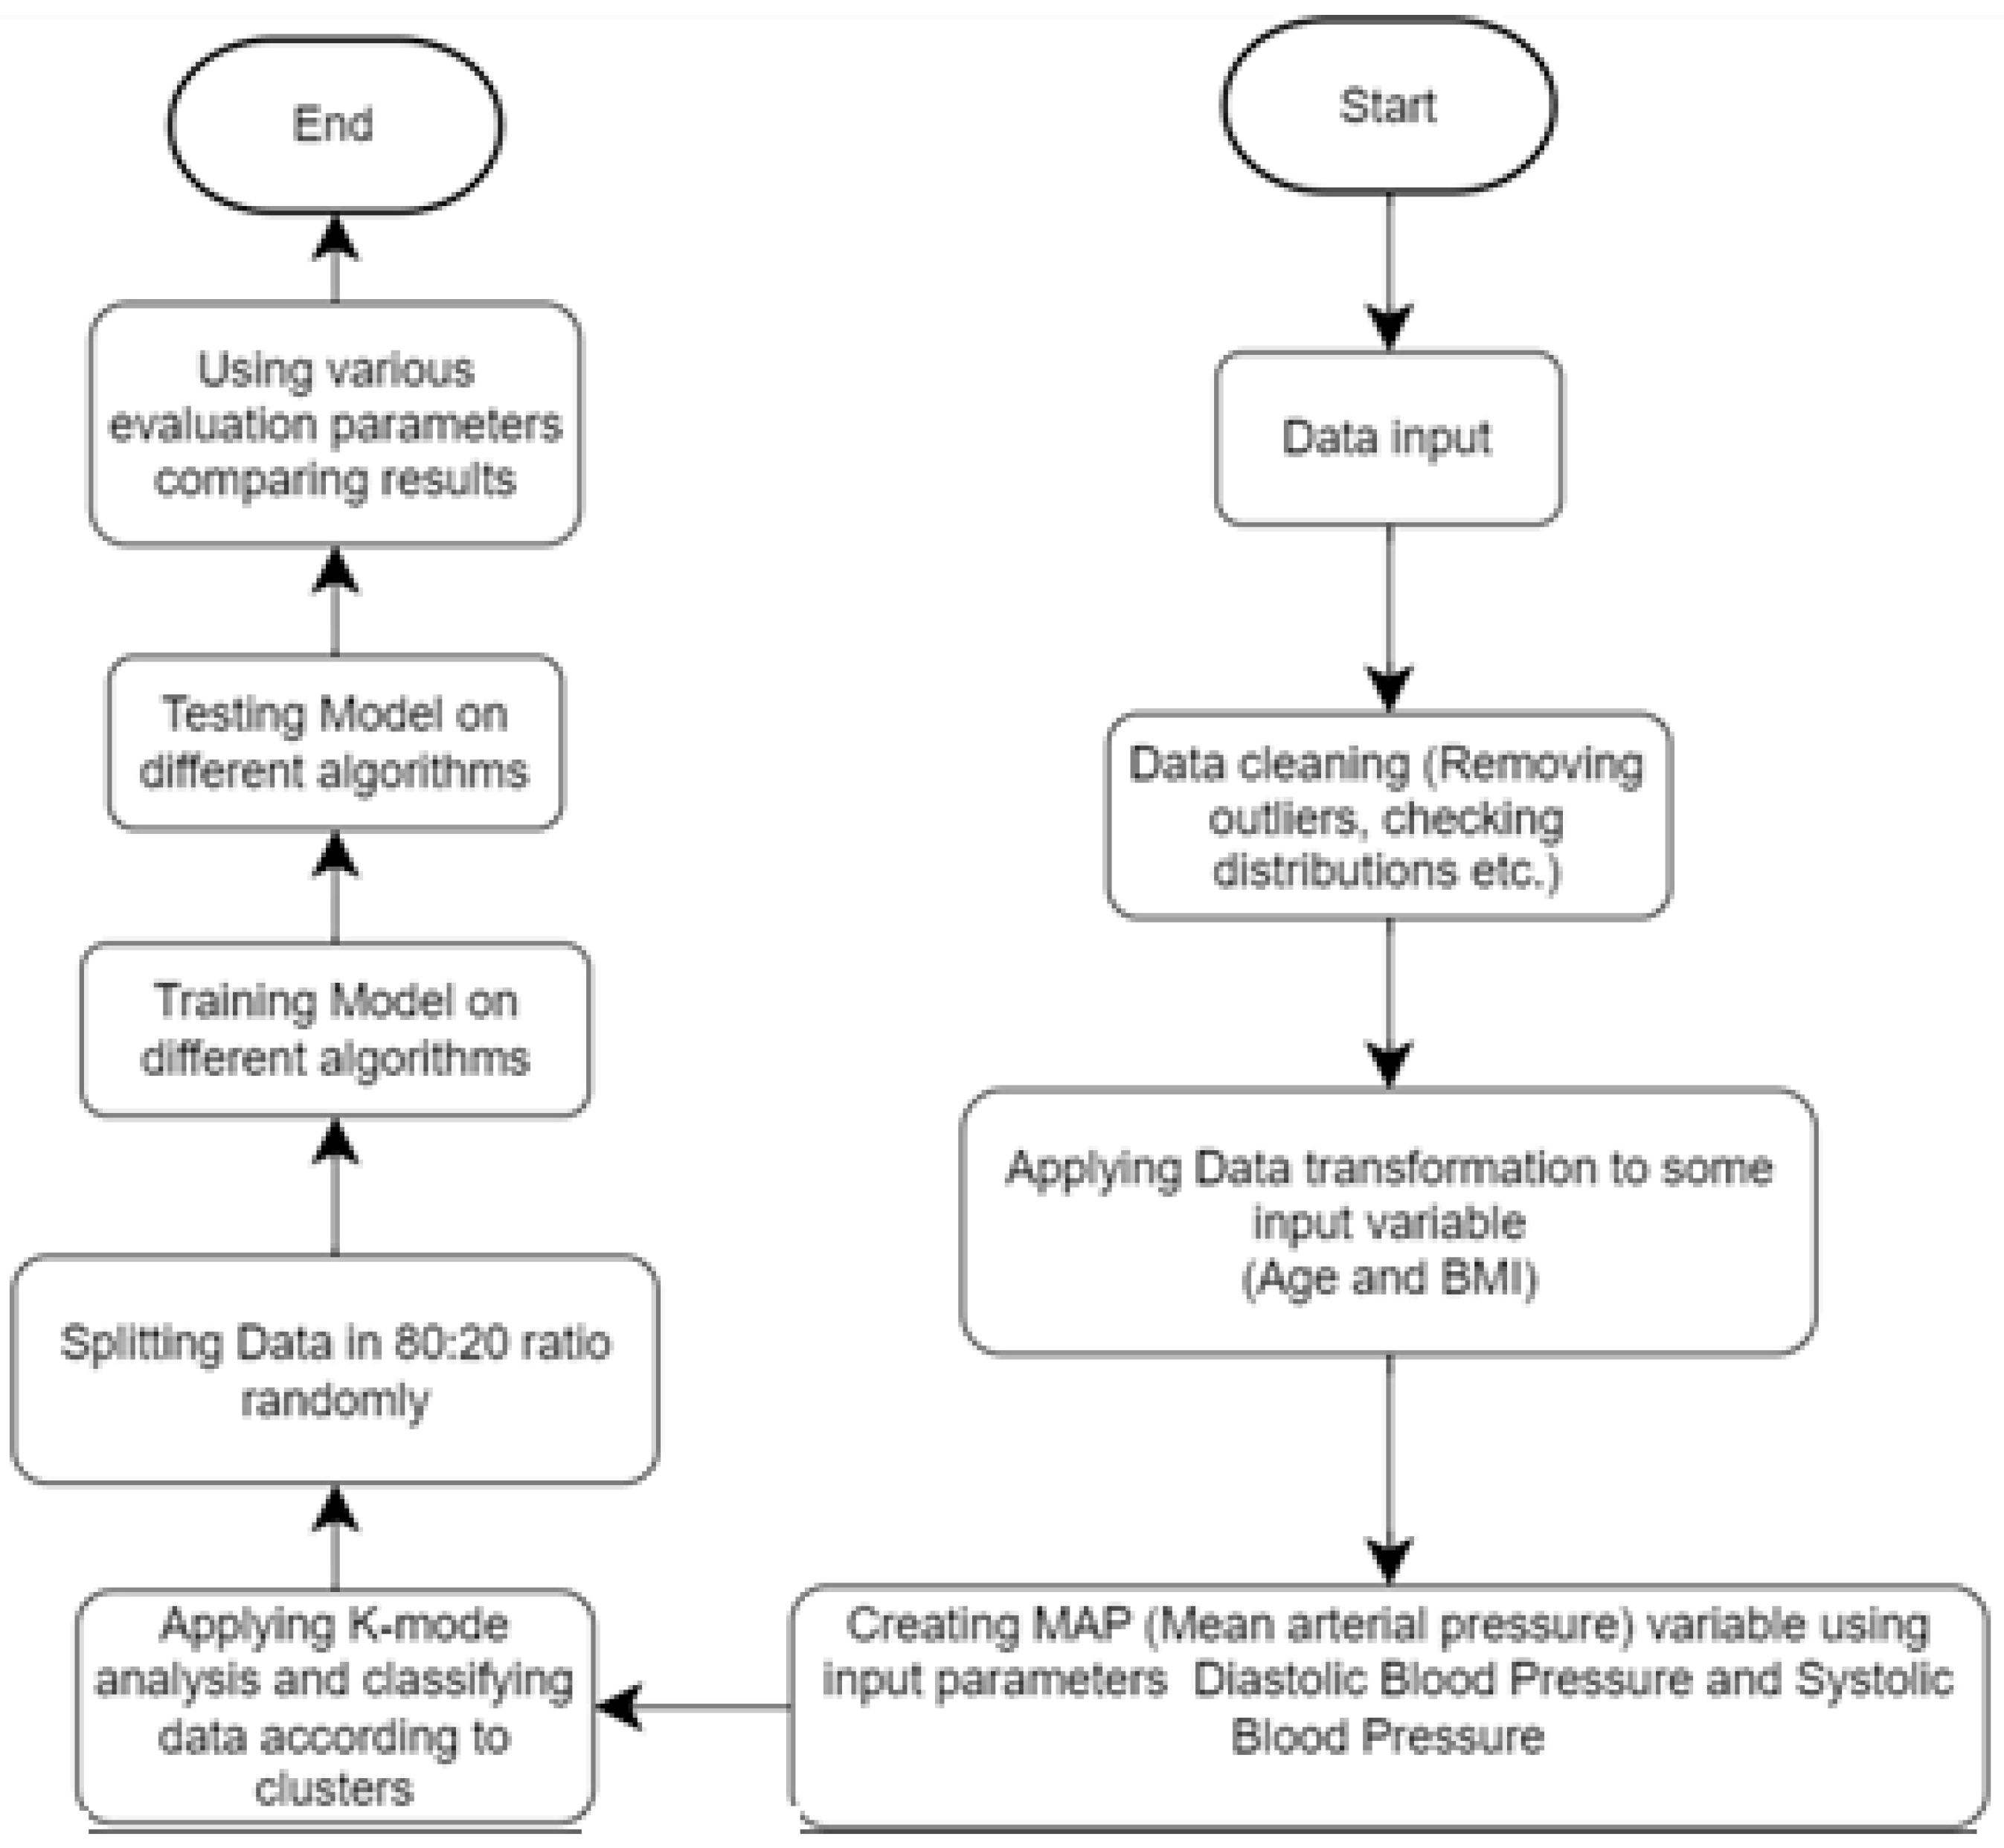
This study aims to predict the probability of heart disease through computerized heart disease prediction, which can be beneficial for medical professionals and patients. To achieve this objective, we employed various machine learning algorithms on a dataset and present the results in this study report. To enhance the methodology, we plan to clean the data, eliminate irrelevant information, and incorporate additional features such as MAP and BMI. Next, we will separate the dataset based on gender and implement k-modes clustering. Finally, we will train the model with the processed data. The improved methodology will produce more accurate results and superior model performance, as demonstrated in Figure 1.
3.1. Data Source
The dataset utilized in this study, as described in [23], comprises 70,000 patient records with 12 distinct features, as listed in Table 2. These features include age, gender, systolic blood pressure, and diastolic blood pressure. The target class, “cardio,” indicates whether a patient has cardiovascular disease (represented as 1) or is healthy (represented as 0).
3.2. Removing Outliers
As shown in Figure 2, the presence of outliers in the dataset is evident. These outliers may have been the result of errors in data entry. The removal of these outliers has the potential to improve the performance of our predictive model. In order to address this issue, we removed all instances of ap_hi, ap_lo, weight, and height that fell outside of the range of 2.5% to 97.5%. This process of identifying and eliminating outliers was performed manually. As a result of this data cleaning process, the number of rows was reduced from 70,000 to 57,155.
3.3. Feature Selection and Reduction
We propose the use of binning as a method for converting continuous input, such as age, into categorical input in order to improve the performance and interpretability of classification algorithms. By categorizing continuous input into distinct groups or bins, the algorithm is able to make distinctions between different classes of data based on specific values of the input variables. For instance, if the input variable is “Age Group” and the possible values are “Young”, “Middle-aged”, and “Elderly”, a classification algorithm can use this information to separate the data into different classes or categories based on the age group of the individuals in the dataset [24].
Additionally, converting continuous input into categorical input through binning can also aid in the interpretability of the results, as it is easier to understand and interpret the relationship between the input variables and the output classes. On the other hand, continuous input, such as numerical values, can be more difficult to use in classification algorithms as the algorithm may have to make assumptions about where to draw boundaries between different classes or categories [25].
In this study, we applied the method of binning to the attribute of age in a dataset of patients. The age of patients was initially given in days, but for better analysis and prediction, it was converted to years by dividing it by 365. The age data were then divided into bins of 5-year intervals, ranging from 0–20 to 95–100. The minimum age in the dataset is 30 years, and the maximum is 65, so the bin 30–35 is labeled as 0, while the last bin 60–65 is marked as 6.
Furthermore, other attributes with continuous values, such as height, weight, ap_hi, and ap_lo, were also converted into categorical values. The results of this study demonstrate that converting continuous input into categorical input through binning can improve the performance and interpretability of classification algorithms.
In this comprehensive study of US individuals who were unencumbered by clinical CVD at the outset, the participants had a high lifetime risk for developing CVD, and even higher for those who were overweight or obese. In comparison with those with a normal BMI, obese people were shown to have an earlier beginning of incident CVD, a larger percentage of life spent with CVD morbidity (unhealthy life years), and a lower overall survival rate [26]. This suggests that the attributes of height and weight can be converted to body mass index (BMI), which could improve the performance of our heart disease prediction model. The BMI values are then converted into categorical values for further analysis.
The average blood pressure a person has during a single cardiac cycle is known as mean arterial pressure (MAP) in medicine. MAP is a measure of peripheral resistance and cardiac output, and has been shown to be linked to significant CVD events in the ADVANCE study [27,28]. In a research including people with type 2 diabetes, it was shown that for every 13 mmHg rise in MAP, the risk of CVD rose by 13%. Additionally, if MAP raises the risk of CVD in people with type 2 diabetes, it should also result in a higher number of CVD hospitalizations [28]. These findings suggest a direct relationship between MAP and CVD.
We calculated the mean arterial pressure (MAP) from the diastolic blood pressure (ap_lo) and systolic blood pressure (ap_hi) data for each instance. Similar to the age attribute, the MAP data were divided into bins of 10 intervals, ranging from 70–80 to 110–120, and each bin was labeled with a categorical number, as shown in Table 3.
As can be observed from Table 4, all the attribute values were converted to categorical values. This breakdown of the data facilitated the model to generate more precise predictions.
3.4. Clustering
Clustering is a machine learning technique where a group of instances is grouped based on similarity measures. One common algorithm used for clustering is the k-means algorithm, but it is not effective when working with categorical data. To overcome this limitation, the k-modes algorithm was developed. The k-modes algorithm, introduced by Huang [29] in 1997, is similar to the k-means algorithm but utilizes dissimilarity measures for categorical data and replaces the means of the clusters with modes. This allows the algorithm to work effectively with categorical data.
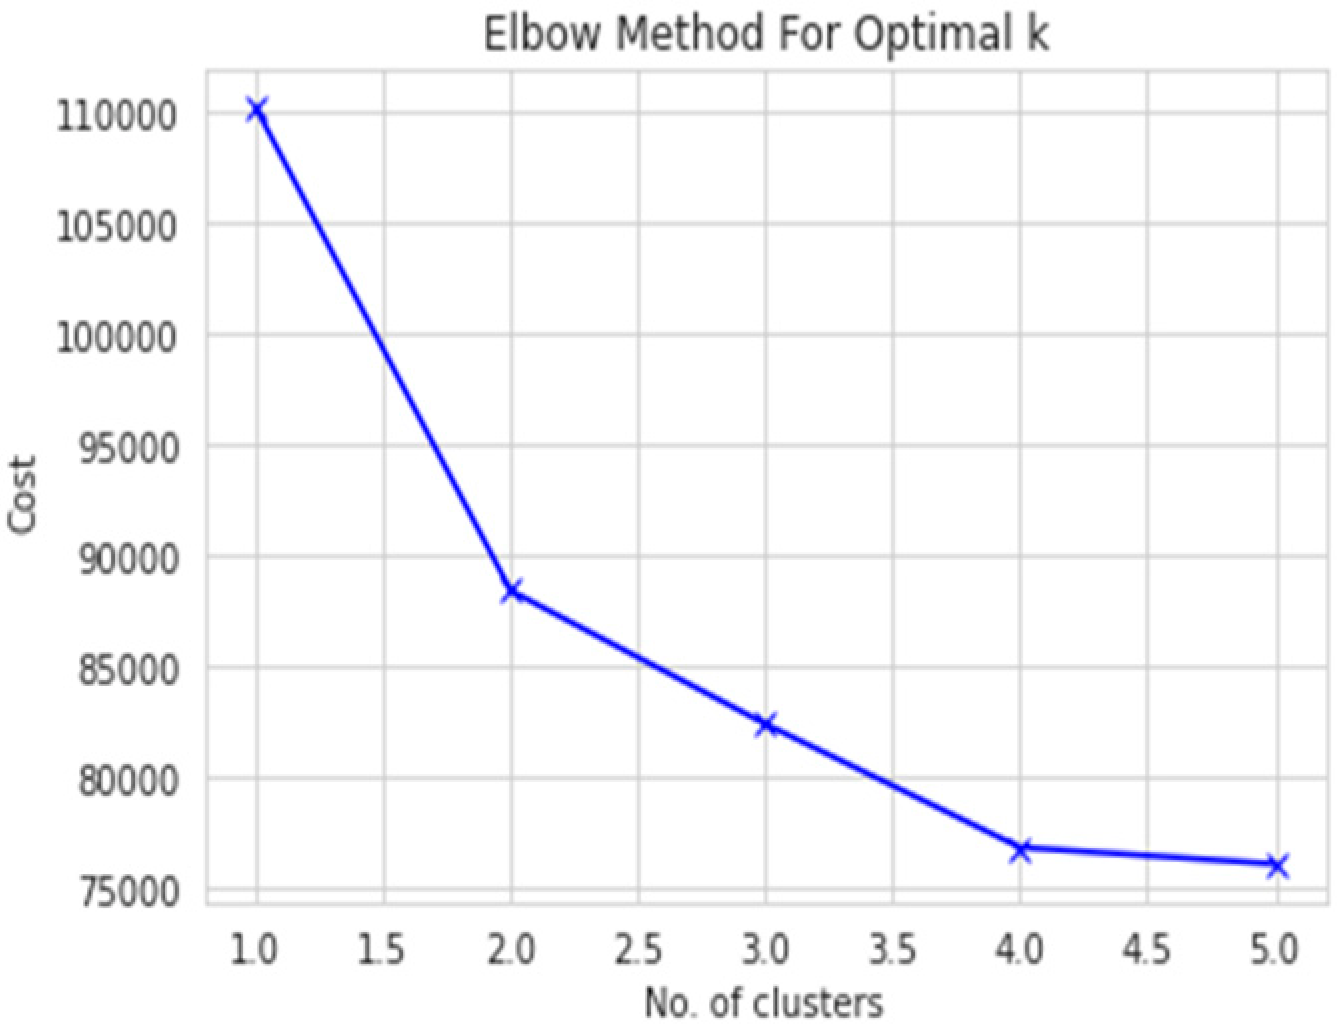
Since our data have been converted to categorical data, we will use k-modes analysis. To find the optimal number of clusters, we will first use the elbow curve with Huang initialization. An elbow curve creates a k-modes model with that number of clusters, fits the model to the data, and then calculates the cost (distance between the attribute modes of each cluster and the data points assigned to the cluster). The costs are then plotted on a graph using the “elbow method” to determine the optimal number of clusters. The elbow method looks for a “knee” or inflection point in the plot of costs, which is often interpreted as the point where the addition of more clusters is not significantly improving the fit of the model.
Splitting the dataset on the basis of gender can be advantageous for prediction due to the existence of significant biological disparities between men and women that can impact the manifestation and progression of diseases. For instance, men tend to develop heart disease at an earlier age than women, and their symptoms and risk factors may differ. Studies have shown that men have a higher risk of coronary artery disease (CAD) compared with women, and that the CAD risk factors and presentations may differ between the sexes [30]. By analyzing the data separately for men and women, it is possible to identify unique risk factors and patterns of disease progression that may not be discernible when the data are consolidated. Additionally, heart disease has a varying prevalence rate among men and women.
Subsequently, we utilized the elbow curve method to determine the optimal number of clusters for both the male and female datasets. As depicted in Figure 3 and Figure 4, the knee point was located at 2.0 in both cases, indicating that 2 was the optimal number of clusters for both the male and female datasets.
3.5. Correlation Table
Further, a correlation table is prepared to determine the correlation between different categories. From Figure 5, mean arterial pressure (MAP_Class), cholesterol, and age were highly correlated factors. Intra-feature dependency can also be looked upon with the help of this matrix.
3.6. Modeling
A training dataset (80%) and a testing dataset (20%) are created from the dataset. A model is trained using the training dataset, and its performance is assessed using the testing dataset. Different classifiers, such as decision tree classifier, random forest classifier, multilayer perceptron, and XGBoost, are applied to the clustered dataset to assess their performance. The performance of each classifier is then evaluated using accuracy, precision, recall, and F-measure scores.
3.6.1. Decision Tree Classifier
Decision trees are treelike structures that are used to manage large datasets. They are often depicted as flowcharts, with outer branches representing the results and inner nodes representing the properties of the dataset. Decision trees are popular because they are efficient, reliable, and easy to understand. The projected class label for a decision tree originates from the tree’s root. The following steps in the tree are decided by comparing the value of the root attribute with the information in the record. Following a jump on the next node, the matching branch is followed to the value shown by the comparison result. Entropy changes when training examples are divided into smaller groups using a decision tree node. The measurement of this change in entropy is information gain.
3.6.2. Random Forest
The random forest [13] algorithm belongs to a category of supervised classification technique that consists of multiple decision trees working together as a group. The class with the most votes become the prediction made by our model. Each tree in the random forest makes a class prediction, which eliminates the limitations of the decision tree algorithm. This improves accuracy and reduces overfitting of the dataset. When used on large datasets, the random forest approach may still provide the same results even if a significant portion of record values are missing. The samples produced by the decision tree may be saved and used with various data types [31]. In the research in [7], random forest achieved a test accuracy of 73% and a validation accuracy of 72% with 500 estimators, 4 maximum depths, and 1 random state.
3.6.3. Multilayer Perceptron
The multilayer perceptron (MLP) is a type of artificial neural network that consists of multiple layers. Single perceptron can only solve linear problems, but MLP is better suited for nonlinear examples. MLP is used to tackle complex issues. A feedforward neural network with many layers is an example of an MLP [32].
Other activation functions beyond the step function are usually used by MLP. The buried layer neurons often perform sigmoid functions. As with step functions, smooth transitions rather than rigid decision limits are produced using sigmoid functions [33]. In MLPs, learning also comprises adjusting the perceptron’s weights to obtain the lowest possible error. This is accomplished via the backpropagation technique, which reduces the MSE.
3.6.4. XGBoost
XGBoost [14] is a version of gradient boosted decision trees. This algorithm involves creating decision trees in a sequential manner. All the independent variables are allocated weights, which are subsequently used to produce predictions by the decision tree. If the tree makes a wrong prediction, the importance of the relevant variables is increased and used in the next decision tree. The output of each of these classifiers/predictors is then merged to produce a more robust and accurate model. In a study by [34], the XGBoost model achieved 73% accuracy with the parameters ‘learning_rate’: 0.1, ‘max_depth’: 4, ‘n_estimators’: 100, ‘cross-validation’: 10 folds including 49,000 training and 21,000 testing data instances on 70,000 CVD dataset.
4. Results
This research utilized Google Colab on a Ryzen 7 computer with a 4800-H processor and 16 GB of RAM. The dataset consisted of 70,000 rows and 12 attributes, but after cleaning and preprocessing, it was reduced to approximately 59,000 rows and 11 attributes. Since all attributes were categorical, outliers were removed to improve the model efficiency. The algorithms used in this study were random forest, decision tree, multilayer perception, and XGBoost classifier. This study used several measures of performance, namely, precision, recall, accuracy, F1 score, and area under the ROC curve. The dataset was split into two parts: 80% of the data used to train model and 20% used to test the model.
We employed an automated approach for hyperparameter tuning by utilizing the GridSearchCV method. GridSearchCV takes in an estimator, a set of hyperparameters to be searched over, and a scoring method, and returns the best set of hyperparameters that maximizes the scoring method. This method is implemented in the scikit-learn library, and it uses k-fold cross-validation to evaluate the performance of different sets of hyperparameters.
As shown in Table 5, various machine learning classifiers, such as MLP, RF, decision tree, and XGBoost, were applied on the cardiovascular disease dataset to identify the presence of cardiovascular disease after hyperparameter tuning. The results indicate that the multilayer perceptron (MLP) algorithm obtained the highest cross-validation accuracy of 87.28%, along with high recall, precision, F1 score, and AUC scores of 84.85, 88.70, 86.71, and 0.95, respectively. All classifiers had an accuracy above 86.5%. The random forest algorithm’s accuracy was increased by 0.5% from 86.48% to 86.90% through hyperparameter tuning with GridSearchCV. Similarly, the accuracy of the XGBoost algorithm increased by 0.6% from 86.4% to 87.02% through hyperparameter tuning.
A binary classifier’s performance is graphically represented by the receiver operating characteristic (ROC) curve. At different categorization criteria, it shows the true positive rate (TPR) vs. the false positive rate (FPR). The area under the ROC curve (AUC) is a scalar metric that measures both the classifier’s sensitivity and specificity while also reflecting the classifier’s overall performance. As depicted in Figure 6a–d, all models exhibit a high AUC of above 0.9. The multilayer perceptron (MLP), random forest (RF), and XGBoost models have a joint highest AUC of 0.95.
5. Conclusions
The primary objective of this study was to classify heart disease using different models and a real-world dataset. The k-modes clustering algorithm was applied to a dataset of patients with heart disease to predict the presence of the disease. The dataset was preprocessed by converting the age attribute to years and dividing it into bins of 5-year intervals, as well as dividing the diastolic and systolic blood pressure data into bins of 10 intervals. The dataset was also split on the basis of gender to take into account the unique characteristics and progression of heart disease in men and women.
The elbow curve method was utilized to determine the optimal number of clusters for both the male and female datasets. The results indicated that the MLP model had the highest accuracy of 87.23%. These findings demonstrate the potential of k-modes clustering to accurately predict heart disease and suggest that the algorithm could be a valuable tool in the development of targeted diagnostic and treatment strategies for the disease. The study utilized the Kaggle cardiovascular disease dataset with 70,000 instances, and all algorithms were implemented on Google Colab. The accuracies of all algorithms were above 86% with the lowest accuracy of 86.37% given by decision trees and the highest accuracy given by multilayer perceptron, as previously mentioned.
Limitations. Despite the promising results, there are several limitations that should be noted. First, the study was based on a single dataset and may not be generalizable to other populations or patient groups. Furthermore, the study only considered a limited set of demographic and clinical variables and did not take into account other potential risk factors for heart disease, such as lifestyle factors or genetic predispositions. Additionally, the performance of the model on a held-out test dataset was not evaluated, which would have provided insight on how well the model generalizes to new, unseen data. Lastly, the interpretability of the results and the ability to explain the clusters formed by the algorithm was not evaluated. In light of these limitations, it is recommended to conduct further research to address these issues and to better understand the potential of k-modes clustering for heart disease prediction.
Future research. Future research could focus on addressing the limitations of this study by comparing the performance of the k-modes clustering algorithm with other commonly used clustering algorithms, such as k-means [35] or hierarchical clustering [36], to gain a more comprehensive understanding of its performance. Additionally, it would be valuable to evaluate the impact of missing data and outliers on the accuracy of the model and develop strategies for handling these cases. Furthermore, it would be beneficial to evaluate the performance of the model on a held-out test dataset in order to establish its generalizability to new, unseen data. Ultimately, future research should aim to establish the robustness and generalizability of the results and the interpretability of the clusters formed by the algorithm, which could aid in understanding the results and support decision making based on the study’s findings.
Author Contributions
P.P., conceptualization, data curation, methodology, software, validation, visualization, writing—original draft; C.M.B., conceptualization, supervision, project administration, writing—review and editing; T.G., conceptualization, data curation, methodology, software, validation, visualization, writing—original draft; P.L.M., funding acquisition, supervision, writing—review and editing. All authors have read and agreed to the published version of the manuscript.
Funding
This research received no external funding.
Conflicts of Interest
The authors declare no conflict of interest.
References
- Estes, C.; Anstee, Q.M.; Arias-Loste, M.T.; Bantel, H.; Bellentani, S.; Caballeria, J.; Colombo, M.; Craxi, A.; Crespo, J.; Day, C.P.; et al. Modeling NAFLD disease burden in China, France, Germany, Italy, Japan, Spain, United Kingdom, and United States for the period 2016–2030. J. Hepatol. 2018, 69, 896–904. [Google Scholar] [CrossRef] [PubMed]
- Drożdż, K.; Nabrdalik, K.; Kwiendacz, H.; Hendel, M.; Olejarz, A.; Tomasik, A.; Bartman, W.; Nalepa, J.; Gumprecht, J.; Lip, G.Y.H. Risk factors for cardiovascular disease in patients with metabolic-associated fatty liver disease: A machine learning approach. Cardiovasc. Diabetol. 2022, 21, 240. [Google Scholar] [CrossRef] [PubMed]
- Murthy, H.S.N.; Meenakshi, M. Dimensionality reduction using neuro-genetic approach for early prediction of coronary heart disease. In Proceedings of the International Conference on Circuits, Communication, Control and Computing, Bangalore, India, 21–22 November 2014; pp. 329–332. [Google Scholar] [CrossRef]
- Benjamin, E.J.; Muntner, P.; Alonso, A.; Bittencourt, M.S.; Callaway, C.W.; Carson, A.P.; Chamberlain, A.M.; Chang, A.R.; Cheng, S.; Das, S.R.; et al. Heart disease and stroke statistics—2019 update: A report from the American heart association. Circulation 2019, 139, e56–e528. [Google Scholar] [CrossRef] [PubMed]
- Shorewala, V. Early detection of coronary heart disease using ensemble techniques. Inform. Med. Unlocked 2021, 26, 100655. [Google Scholar] [CrossRef]
- Mozaffarian, D.; Benjamin, E.J.; Go, A.S.; Arnett, D.K.; Blaha, M.J.; Cushman, M.; de Ferranti, S.; Després, J.-P.; Fullerton, H.J.; Howard, V.J.; et al. Heart disease and stroke statistics—2015 update: A report from the American Heart Association. Circulation 2015, 131, e29–e322. [Google Scholar] [CrossRef]
- Maiga, J.; Hungilo, G.G.; Pranowo. Comparison of Machine Learning Models in Prediction of Cardiovascular Disease Using Health Record Data. In Proceedings of the 2019 International Conference on Informatics, Multimedia, Cyber and Information System (ICIMCIS), Jakarta, Indonesia, 24–25 October 2019; pp. 45–48. [Google Scholar] [CrossRef]
- Li, J.; Loerbroks, A.; Bosma, H.; Angerer, P. Work stress and cardiovascular disease: A life course perspective. J. Occup. Health 2016, 58, 216–219. [Google Scholar] [CrossRef]
- Purushottam; Saxena, K.; Sharma, R. Efficient Heart Disease Prediction System. Procedia Comput. Sci. 2016, 85, 962–969. [Google Scholar] [CrossRef]
- Soni, J.; Ansari, U.; Sharma, D.; Soni, S. Predictive Data Mining for Medical Diagnosis: An Overview of Heart Disease Prediction. Int. J. Comput. Appl. 2011, 17, 43–48. [Google Scholar] [CrossRef]
- Mohan, S.; Thirumalai, C.; Srivastava, G. Effective Heart Disease Prediction Using Hybrid Machine Learning Techniques. IEEE Access 2019, 7, 81542–81554. [Google Scholar] [CrossRef]
- Waigi, R.; Choudhary, S.; Fulzele, P.; Mishra, G. Predicting the risk of heart disease using advanced machine learning approach. Eur. J. Mol. Clin. Med. 2020, 7, 1638–1645. [Google Scholar]
- Breiman, L. Random forests. Mach. Learn. 2001, 45, 5–32. [Google Scholar] [CrossRef]
- Chen, T.; Guestrin, C. XGBoost: A Scalable Tree Boosting System. In Proceedings of the KDD ’16: 22nd ACM SIGKDD International Conference on Knowledge Discovery and Data Mining, San Francisco, CA, USA, 13–17 August 2016; Association for Computing Machinery: New York, NY, USA, 2016; pp. 785–794. [Google Scholar] [CrossRef]
- Gietzelt, M.; Wolf, K.-H.; Marschollek, M.; Haux, R. Performance comparison of accelerometer calibration algorithms based on 3D-ellipsoid fitting methods. Comput. Methods Programs Biomed. 2013, 111, 62–71. [Google Scholar] [CrossRef]
- K, V.; Singaraju, J. Decision Support System for Congenital Heart Disease Diagnosis based on Signs and Symptoms using Neural Networks. Int. J. Comput. Appl. 2011, 19, 6–12. [Google Scholar] [CrossRef]
- Narin, A.; Isler, Y.; Ozer, M. Early prediction of Paroxysmal Atrial Fibrillation using frequency domain measures of heart rate variability. In Proceedings of the 2016 Medical Technologies National Congress (TIPTEKNO), Antalya, Turkey, 27–29 October 2016. [Google Scholar] [CrossRef]
- Shah, D.; Patel, S.; Bharti, S.K. Heart Disease Prediction using Machine Learning Techniques. SN Comput. Sci. 2020, 1, 345. [Google Scholar] [CrossRef]
- Alotaibi, F.S. Implementation of Machine Learning Model to Predict Heart Failure Disease. Int. J. Adv. Comput. Sci. Appl. 2019, 10, 261–268. [Google Scholar] [CrossRef]
- Hasan, N.; Bao, Y. Comparing different feature selection algorithms for cardiovascular disease prediction. Health Technol. 2020, 11, 49–62. [Google Scholar] [CrossRef]
- Ouf, S.; ElSeddawy, A.I.B. A proposed paradigm for intelligent heart disease prediction system using data mining techniques. J. Southwest Jiaotong Univ. 2021, 56, 220–240. [Google Scholar] [CrossRef]
- Khan, I.H.; Mondal, M.R.H. Data-Driven Diagnosis of Heart Disease. Int. J. Comput. Appl. 2020, 176, 46–54. [Google Scholar] [CrossRef]
- Kaggle Cardiovascular Disease Dataset. Available online: https://www.kaggle.com/datasets/sulianova/cardiovascular-disease-dataset (accessed on 1 November 2022).
- Han, J.A.; Kamber, M. Data Mining: Concepts and Techniques, 3rd ed.; Morgan Kaufmann Publishers: San Francisco, CA, USA, 2011. [Google Scholar]
- Rivero, R.; Garcia, P. A Comparative Study of Discretization Techniques for Naive Bayes Classifiers. IEEE Trans. Knowl. Data Eng. 2009, 21, 674–688. [Google Scholar]
- Khan, S.S.; Ning, H.; Wilkins, J.T.; Allen, N.; Carnethon, M.; Berry, J.D.; Sweis, R.N.; Lloyd-Jones, D.M. Association of body mass index with lifetime risk of cardiovascular disease and compression of morbidity. JAMA Cardiol. 2018, 3, 280–287. [Google Scholar] [CrossRef]
- Kengne, A.-P.; Czernichow, S.; Huxley, R.; Grobbee, D.; Woodward, M.; Neal, B.; Zoungas, S.; Cooper, M.; Glasziou, P.; Hamet, P.; et al. Blood Pressure Variables and Cardiovascular Risk. Hypertension 2009, 54, 399–404. [Google Scholar] [CrossRef] [PubMed]
- Yu, D.; Zhao, Z.; Simmons, D. Interaction between Mean Arterial Pressure and HbA1c in Prediction of Cardiovascular Disease Hospitalisation: A Population-Based Case-Control Study. J. Diabetes Res. 2016, 2016, 8714745. [Google Scholar] [CrossRef] [PubMed]
- Huang, Z. A Fast Clustering Algorithm to Cluster Very Large Categorical Data Sets in Data Mining. DMKD 1997, 3, 34–39. [Google Scholar]
- Maas, A.H.; Appelman, Y.E. Gender differences in coronary heart disease. Neth. Heart J. 2010, 18, 598–602. [Google Scholar] [CrossRef]
- Bhunia, P.K.; Debnath, A.; Mondal, P.; D E, M.; Ganguly, K.; Rakshit, P. Heart Disease Prediction using Machine Learning. Int. J. Eng. Res. Technol. 2021, 9. [Google Scholar]
- Mohanty, M.D.; Mohanty, M.N. Verbal sentiment analysis and detection using recurrent neural network. In Advanced Data Mining Tools and Methods for Social Computing; Academic Press: Cambridge, MA, USA, 2022; pp. 85–106. [Google Scholar] [CrossRef]
- Menzies, T.; Kocagüneli, E.; Minku, L.; Peters, F.; Turhan, B. Using Goals in Model-Based Reasoning. In Sharing Data and Models in Software Engineering; Morgan Kaufmann: San Francisco, CA, USA, 2015; pp. 321–353. [Google Scholar] [CrossRef]
- Fayez, M.; Kurnaz, S. Novel method for diagnosis diseases using advanced high-performance machine learning system. Appl. Nanosci. 2021. [Google Scholar] [CrossRef]
- Hassan, C.A.U.; Iqbal, J.; Irfan, R.; Hussain, S.; Algarni, A.D.; Bukhari, S.S.H.; Alturki, N.; Ullah, S.S. Effectively Predicting the Presence of Coronary Heart Disease Using Machine Learning Classifiers. Sensors 2022, 22, 7227. [Google Scholar] [CrossRef]
- Subahi, A.F.; Khalaf, O.I.; Alotaibi, Y.; Natarajan, R.; Mahadev, N.; Ramesh, T. Modified Self-Adaptive Bayesian Algorithm for Smart Heart Disease Prediction in IoT System. Sustainability 2022, 14, 14208. [Google Scholar] [CrossRef]
Figure 1.
Flow diagram of Model.
Figure 2.
Boxplots of all attributes.

Figure 3.
Male dataset.

Figure 4.
Female dataset.

Figure 5.
Correlation heatmap.

Figure 6.
ROC–area under curve of (a) MLP, (b) RF, (c) DT, and (d) XGB.


Table 1.
Related work on heart disease prediction using large datasets.
| Authors | Novel Approach | Best Accuracy | Dataset |
|---|---|---|---|
| Shorewall, 2021 [5] | Stacking of KNN, random forest, and SVM outputs with logistic regression as the metaclassifier | 75.1% (stacked model) | Kaggle cardiovascular disease dataset (70,000 patients, 12 attributes) |
| Maiga et al., 2019 [7] | -Random forest -Naive Bayes -Logistic regression -KNN | 70% | Kaggle cardiovascular disease dataset (70,000 patients, 12 attributes) |
| Waigi at el., 2020 [12] | Decision tree | 72.77% (decision tree) | Kaggle cardiovascular disease dataset (70,000 patients, 12 attributes) |
| Our and ElSeddawy, 2021 [21] | Repeated random with random forest | 89.01%(random forest classifier) | UCI cardiovascular dataset (303 patients, 14 attributes) |
| Khan and Mondal, 2020 [22] | Holdout cross-validation with the neural network for Kaggle dataset | 71.82% (neural networks) | Kaggle cardiovascular disease dataset (70,000 patients, 12 attributes) |
| Cross-validation method with logistic regression (solver: lbfgs) where k = 30 | 72.72% | Kaggle cardiovascular disease dataset 1 (462 patients, 12 attributes) | |
| Cross-validation method with linear SVM where k = 10 | 72.22% | Kaggle cardiovascular disease dataset (70,000 patients, 12 attributes) |
Table 2.
Datasets attributes.
| Feature | Variable | Min and Max Values |
|---|---|---|
| Age | Age | Min: 10,798 and max: 23,713 |
| Height | Height | Min: 55 and max: 250 |
| Weight | Weight | Min: 10 and max: 200 |
| Gender | Gender | 1: female, 2: male |
| Systolic blood pressure | ap_hi | Min: −150 and max: 16,020 |
| Diastolic blood pressure | ap_lo | Min: −70 and max: 11,000 |
| Cholesterol | Chol | Categorical value = 1(min) to 3(max) |
| Glucose | Gluc | Categorical value = 1(min) to 3(max) |
| Smoking | Smoke | 1: yes, 0: no |
| Alcohol intake | Alco | 1: yes, 0: no |
| Physical activity | Active | 1: yes, 0: no |
| Presence or absence of cardiovascular disease | Cardio | 1: yes, 0: no |
Table 3.
MAP categorical values.
| MAP Values | Category |
|---|---|
| ≥70 and <80 | 1 |
| ≥80 and <90 | 2 |
| ≥100 and <110 | 3 |
| ≥100 and <110 | 4 |
| ≥110 and <120 | 5 |
Table 4.
Final attributes after feature selection and reduction.
| Feature | Variable | Min and Max Values |
|---|---|---|
| Gender | gender | 1: male, 2: female |
| Age | Age | Categorical values = 0(min) to 6(max) |
| BMI | BMI_Class | Categorical values = 0(min) to 5(max) |
| Mean arterial pressure | MAP_Class | Categorical values = 0(min) to 5(max) |
| Cholesterol | Cholesterol | Categorical values = 1(min) to 3(max) |
| Glucose | Gluc | Categorical values = 1(min) to 3(max) |
| Smoking | Smoke | 1: yes, 0: no |
| Alcohol intake | Alco | 1: yes, 0: no |
| Physical activity | Active | 1: yes, 0: no |
| Presence or absence of cardiovascular disease | Cardio | 1: yes, 0: no |
Table 5.
The evaluation metrics resulting from different classifiers.
| Model | Accuracy | Precision | Recall | F1-Score | AUC | ||||
|---|---|---|---|---|---|---|---|---|---|
| Without CV | CV | Without CV | CV | Without CV | CV | Without CV | CV | ||
| MLP | 86.94 | 87.28 | 89.03 | 88.70 | 82.95 | 84.85 | 85.88 | 86.71 | 0.95 |
| RF | 86.92 | 87.05 | 88.52 | 89.42 | 83.46 | 83.43 | 85.91 | 86.32 | 0.95 |
| DT | 86.53 | 86.37 | 90.10 | 89.58 | 81.17 | 81.61 | 85.40 | 85.42 | 0.94 |
| XGB | 87.02 | 86.87 | 89.62 | 88.93 | 82.11 | 83.57 | 86.30 | 86.16 | 0.95 |
Disclaimer/Publisher’s Note: The statements, opinions and data contained in all publications are solely those of the individual author(s) and contributor(s) and not of MDPI and/or the editor(s). MDPI and/or the editor(s) disclaim responsibility for any injury to people or property resulting from any ideas, methods, instructions or products referred to in the content. |
© 2023 by the authors. Licensee MDPI, Basel, Switzerland. This article is an open access article distributed under the terms and conditions of the Creative Commons Attribution (CC BY) license (https://creativecommons.org/licenses/by/4.0/).
Share and Cite
MDPI and ACS Style
Bhatt, C.M.; Patel, P.; Ghetia, T.; Mazzeo, P.L. Effective Heart Disease Prediction Using Machine Learning Techniques. Algorithms 2023, 16, 88. https://doi.org/10.3390/a16020088
AMA Style
Bhatt CM, Patel P, Ghetia T, Mazzeo PL. Effective Heart Disease Prediction Using Machine Learning Techniques. Algorithms. 2023; 16(2):88. https://doi.org/10.3390/a16020088
Chicago/Turabian StyleBhatt, Chintan M., Parth Patel, Tarang Ghetia, and Pier Luigi Mazzeo. 2023. "Effective Heart Disease Prediction Using Machine Learning Techniques" Algorithms 16, no. 2: 88. https://doi.org/10.3390/a16020088
Note that from the first issue of 2016, this journal uses article numbers instead of page numbers. See further details here.