
Application of Split Coordinate Channel Attention Embedding U2Net in Salient Object Detection

School of Science, Wuhan University of Technology, Wuhan 430074, China
*
Author to whom correspondence should be addressed.
Algorithms 2024, 17(3), 109; https://doi.org/10.3390/a17030109
Submission received: 27 January 2024
/
Revised: 29 February 2024
/
Accepted: 4 March 2024
/
Published: 6 March 2024
Abstract
:Salient object detection (SOD) aims to identify the most visually striking objects in a scene, simulating the function of the biological visual attention system. The attention mechanism in deep learning is commonly used as an enhancement strategy which enables the neural network to concentrate on the relevant parts when processing input data, effectively improving the model’s learning and prediction abilities. Existing saliency object detection methods based on RGB deep learning typically treat all regions equally by using the extracted features, overlooking the fact that different regions have varying contributions to the final predictions. Based on the U2Net algorithm, this paper incorporates the split coordinate channel attention (SCCA) mechanism into the feature extraction stage. SCCA conducts spatial transformation in width and height dimensions to efficiently extract the location information of the target to be detected. While pixel-level semantic segmentation based on annotation has been successful, it assigns the same weight to each pixel which leads to poor performance in detecting the boundary of objects. In this paper, the Canny edge detection loss is incorporated into the loss calculation stage to improve the model’s ability to detect object edges. Based on the DUTS and HKU-IS datasets, experiments confirm that the proposed strategies effectively enhance the model’s detection performance, resulting in a 0.8% and 0.7% increase in the F1-score of U2Net. This paper also compares the traditional attention modules with the newly proposed attention, and the SCCA attention module achieves a top-three performance in prediction time, mean absolute error (MAE), F1-score, and model size on both experimental datasets.
1. Introduction
In an era of rapidly increasing data volume and diverse application scenarios, traditional machine learning methods have exhibited significant limitations in processing image data. As a result, deep learning, which relies on massive data, has gradually become the mainstream approach. Over the past few years, deep learning methods have consistently outperformed previous state-of-the-art machine learning techniques in various domains, with computer vision being one of the most prominent examples [1,2,3]. Computer vision is a crucial field within artificial intelligence which studies how computers acquire, process, analyze, and understand digital images [4,5]. The primary research areas in computer vision include image classification, object detection, image segmentation, object tracking, scene understanding, image retrieval, image matching, and image registration.
Inspired by the human biological system, an attention mechanism tends to focus on individual parts when processing large amounts of information. In cases of limited computing power, an attention mechanism can be used as a resource allocation scheme to prioritize the processing of more important information [6,7]. Furthermore, attention introduces a form of explanation to neural network models, which are often considered highly complex [8]. Attention mechanisms in neural networks have been utilized in a wide range of tasks, such as image caption generation, text classification, machine translation, action recognition, and speech recognition. The channel attention mechanism learns the weight relationship of each pixel within a single channel dimension and applies it to all pixel regions [9]. Attention mechanisms can adaptively focus on important regions by weighting image features at different locations and channels. However, typically only a single attention mechanism is utilized.
Salient object detection simulates the visual attention and aims to extract the most informative objects and regions in the scene, and then combines this local information to effectively understand the whole scene. Normally, the main approaches can be summarized as locating salient objects and drawing the outline. Salient object detection has been widely used in various computer vision tasks, such as stereo matching, image understanding, co-saliency detection, action recognition, video detection and segmentation, etc. In recent years, FCN-based encoder–decoder models have achieved success in pixel-level dense prediction tasks, but many challenges still remain. (1) The contribution of different features to salient objects is not considered, and redundant information such as noise from low layers and fuzzy boundaries from high layers will lead to accuracy degradation. (2) In the saliency detection task, the binary cross-entropy (BCE) loss is usually used as the loss function to train the relationship between the supervised saliency map and the ground truth. However, the BCE loss treats each pixel equally and often has low confidence. (3) The importance of context information for extracting salient regions is ignored, resulting in the omission of part of the object. The current strategies for improving salient object detection algorithms include fusion models, single-stream/multi-stream models, attention modules, and more. In order to effectively learn the features of RGB images and depth images simultaneously and explore the correlation between RGB images and depth maps, various models fuse RGB images and depth maps using different strategies [10,11,12].
This paper proposes a split coordinate channel attention (SCCA) that divides the input feature map channels in half. SCCA performs convolution operation and width and height pooling aggregation, effectively extracting feature information from the image and determining the position information of the target. This paper introduces the Canny edge detection loss [13] to redefine the loss function in salient object detection. It accurately calculates the pixel loss of the object boundary, addressing the issues of missing edges and difficulty in distinguishing salient objects in cluttered backgrounds.
The main contributions of this paper are as follows:
- This paper proposes an attention module called split coordinate channel attention (SCCA), which splits input channels to capture high-level semantic information and location information simultaneously.
- This paper replaces the encoder and decoder of U2Net [14] with SCCA and devises a novel loss function C2 loss to prioritize edges and objects. By implementing these improvement strategies, this paper presents SCCA-U2Net for salient object detection.
- SCCA-U2Net achieves top-three results on four metrics in salient object detection tasks on the DUTS and HKU-IS datasets and outperforms nine other advanced attention modules. Ablation studies demonstrate the superiority of SCCA-U2Net, and this paper provides visualizations of comparing detection results.
2. Related Work
2.1. Salient Object Detection Research
In recent years, salient object detection (SOD) methods utilizing encoder–decoder and feature aggregation architecture have achieved high performance. Below, we will briefly review models related to this work.
PAGE-Net [15] exploits an essential pyramid attention structure for emphasizing salient object detection while focusing on the importance of salient edges and attributes the unclear boundary to the smoothness of convolution kernel and downsampling. F3Net [16] proposes a cross feature module (CFM) to refine both high-level features and low-level features and consists of a cascaded feedback decoder (CFD) to correct the output features before the final output. BASNet [17] designs a refinement module (RM) and a hybrid loss function which consists of BCE loss, SSIM loss, and IoU loss. Introducing the calculation of similarity and intersection, BASNet better localizes the boundary of salient object detection. GateNet [18] contains multilevel gate units to address the issue of interference control between the encoder and decoder during information exchange. To deal with the separate extraction of RGB and thermal features, CFIDNet [19] designs a feature-enhanced module to extract informative depth cues and leverage multiscale complementary information, avoiding the noise-degraded saliency map result from simple element-wise addition or multiplication. CCFENet [20] proposes an essential cross-collaboration enhancement strategy (CCE), which facilitates the interactions when encoding. HFANet [21] jointly models boundary learning to salient object detection, addressing the issue of cluttered backgrounds, scale invariance, complicated edges, and irregular topology. It extracts abundant context in the deep semantic features using Gated Fold-ASPP, integrating adjacent features with an unparameterized alignment strategy by AFAM. ERPNet [22] is delivered into two parallel decoders for edge extraction and feature fusion, respectively. ERPNet addresses the challenges posed by diverse object types, various object scales, numerous object orientations, and cluttered backgrounds in optical remote sensing images. EDN [23] employs an extreme downsampling technique to enhance high-level features and recovers object details with an elegant decoder. CASNet [24] trains a baseline encoder–decoder model using the Lovász softmax loss function, which outperforms 19 state-of-the-art image-and-video-based algorithms.
The research above mainly focuses on extracting semantic information and feature fusion between early and deeper levels. It explores the boundaries of salient objects, studies more realistic loss functions during training, and designs a more efficient network. These studies have improved the detection performance of the model to varying degrees. However, current models still encounter issues such as poor baseline model performance, inaccurate localization of salient objects, and failure in edge detection, among others.
2.2. U2net Algorithm
U2Net is used for salient object detection (SOD), which aims to segment the most prominent object in an image. Unlike image recognition, SOD focuses more on local detail information and global contrast information, rather than deep semantic information. Therefore, the primary research focuses on extracting features at multiple levels and scales. The network structure of U2Net is shown in Figure 1. The overall structure is an encoder–decoder architecture known as U-Net, in which each stage consists of a residual U-block (RSU). This module consists of a two-layer nested U-structure. The U2Net is designed to support deep architectures with rich multiscale features while incurring relatively low computational and memory costs. The architecture is built exclusively using RSU blocks and does not depend on any pretrained backbone network for feature classification. This makes it flexible and adaptable to various work environments with a minimal loss of performance.
3. Proposed Method
3.1. Split Channel Coordinate Attention
The split channel coordinate attention (SCCA) module in this paper is used to process the feature maps extracted by U2Net. The attention module can guide the network to process information selectively, focusing on the more meaningful spatial parts.
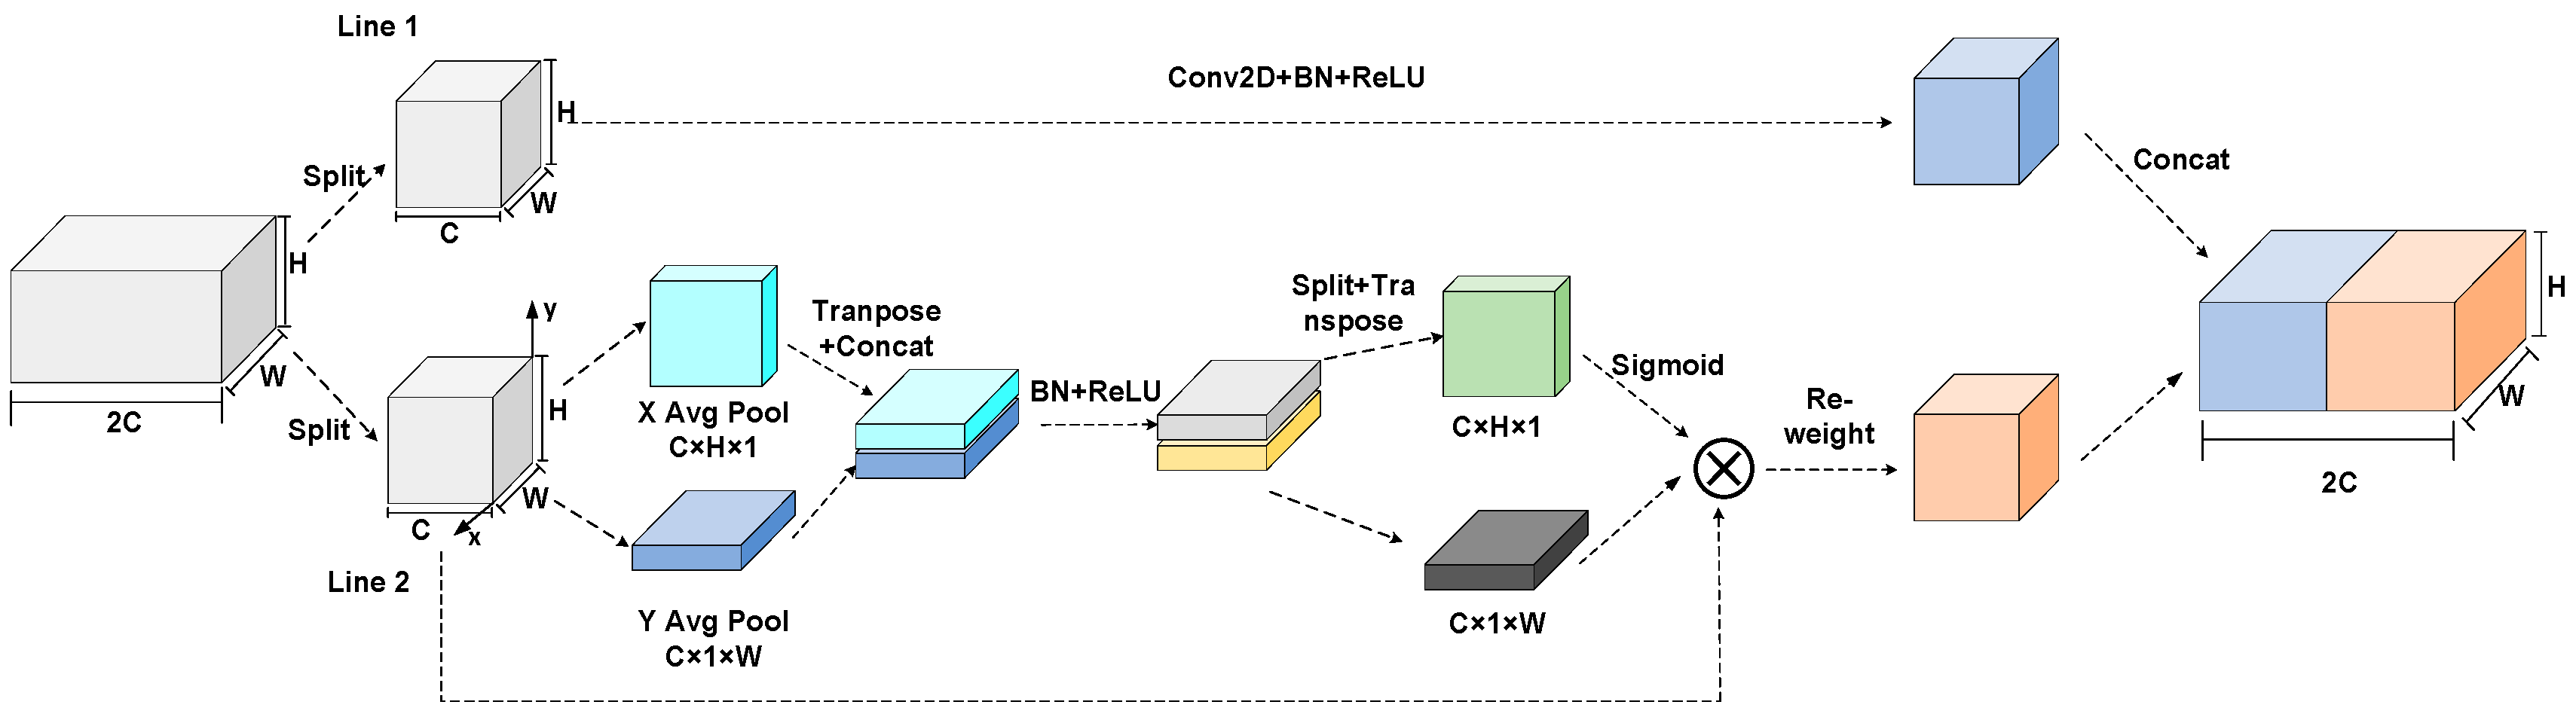
Given an intermediate feature map , SCCA divides the feature map into halves along the channels, which is performed in different ways—line 1 and line 2, respectively. For line 1, is operated by convolution, normalization, and activation to obtain the high-level semantic information. For line 2, is operated by two transformations along the height and width direction to obtain the location of salient objects. The overall attention mechanism can be summarized as
where denotes the element-wise multiplication, is the output of , and denotes line 1, line 2, respectively. Figure 2 depicts the whole computation process of SCCA.
is processed on each channel by an average pooling transformation along the height and width, where denotes the height and width of , is the pixel value at the location in the channel equal to , and is the output along two directions, respectively.
The above two transformations aggregate feature maps along the channels, respectively, to obtain a pair of direction-aware feature matrices . Then, is transposed and concatenated by , and is operated by convolution, normalization, and a non-linear activation function. Where [ ] is the concatenate operation along the channels, denotes a series convolution, batch normalization, denotes the activation function, and denotes the output.
Then, SCCA repeats the transformation along the height and width to obtain and performs convolution and regularization in two dimensions to obtain , respectively. To avoid the problem of gradient explosion and gradient disappearance, is element-wise multiplied by the matrices . denotes the pixel value of , and denotes the pixel value of the final output on every channel of line 2. Then, SCCA concatenates both outputs to aggregate the semantic information and location information. denotes the output from the different line 1 and line 2s, and is the final output of SCCA.
3.2. C2 Loss
Edge detection is a common method for image segmentation based on grayscale variation. Its purpose is to extract the features of discontinuous parts of the image. The Canny operator is an edge detection technique introduced by John F. Canny in 1986 [25]. It involves five main steps: Gaussian filtering, pixel gradient calculation, non-maximum suppression, hysteresis thresholding, and isolated weak edge suppression.
The Gaussian kernel used in Gaussian filtering is a two-dimensional Gaussian function with dimensions x and y, which is typically used to remove the noise. The standard deviation in the two dimensions can be expressed in the form
The Sobel operator calculates the gradient magnitude and direction , and the formula is as follows, where denotes the convolution kernel in the and directions.
Non-maximum suppression retains the maximum gradient value at each pixel and filters out other values to make boundaries clear. The Canny operator sets an upper and lower bound: if the pixel value is greater than the upper threshold, it is considered as the boundary; if the pixel value is less than the lower threshold, it is considered not the boundary. If a weak boundary connected to a strong boundary at a pixel is considered as the boundary, the other weak boundaries are deleted.
U2Net utilizes the BCE loss function to calculate the pixel-level loss between the ground truth and predicted maps, like semantic segmentation tasks, where denotes the pixel value at the location of the ground truth and predicted maps, respectively. But, in this way, U2Net treats all pixels equally and has no focus, which may lead to the failure of edge detection.
This paper utilizes the Canny detector to obtain the boundary of the objects in the ground truth and predicted maps and sums up the number of pixels where the true edge and predicted edge are not equal. The Canny loss formula is as follows:
Overall, combining BCE loss and Canny edge detection loss, this paper proposes a novel loss function, namely, C2 loss. While U2Net effectively detects the salient objects, the edges of objects of predicted pictures are clearer. Figure 3 depicts the loss calculation process. The C2 loss can be expressed in the form as follows, where is the total loss, and is the learning weight for edge detection:
3.3. Improved U2Net
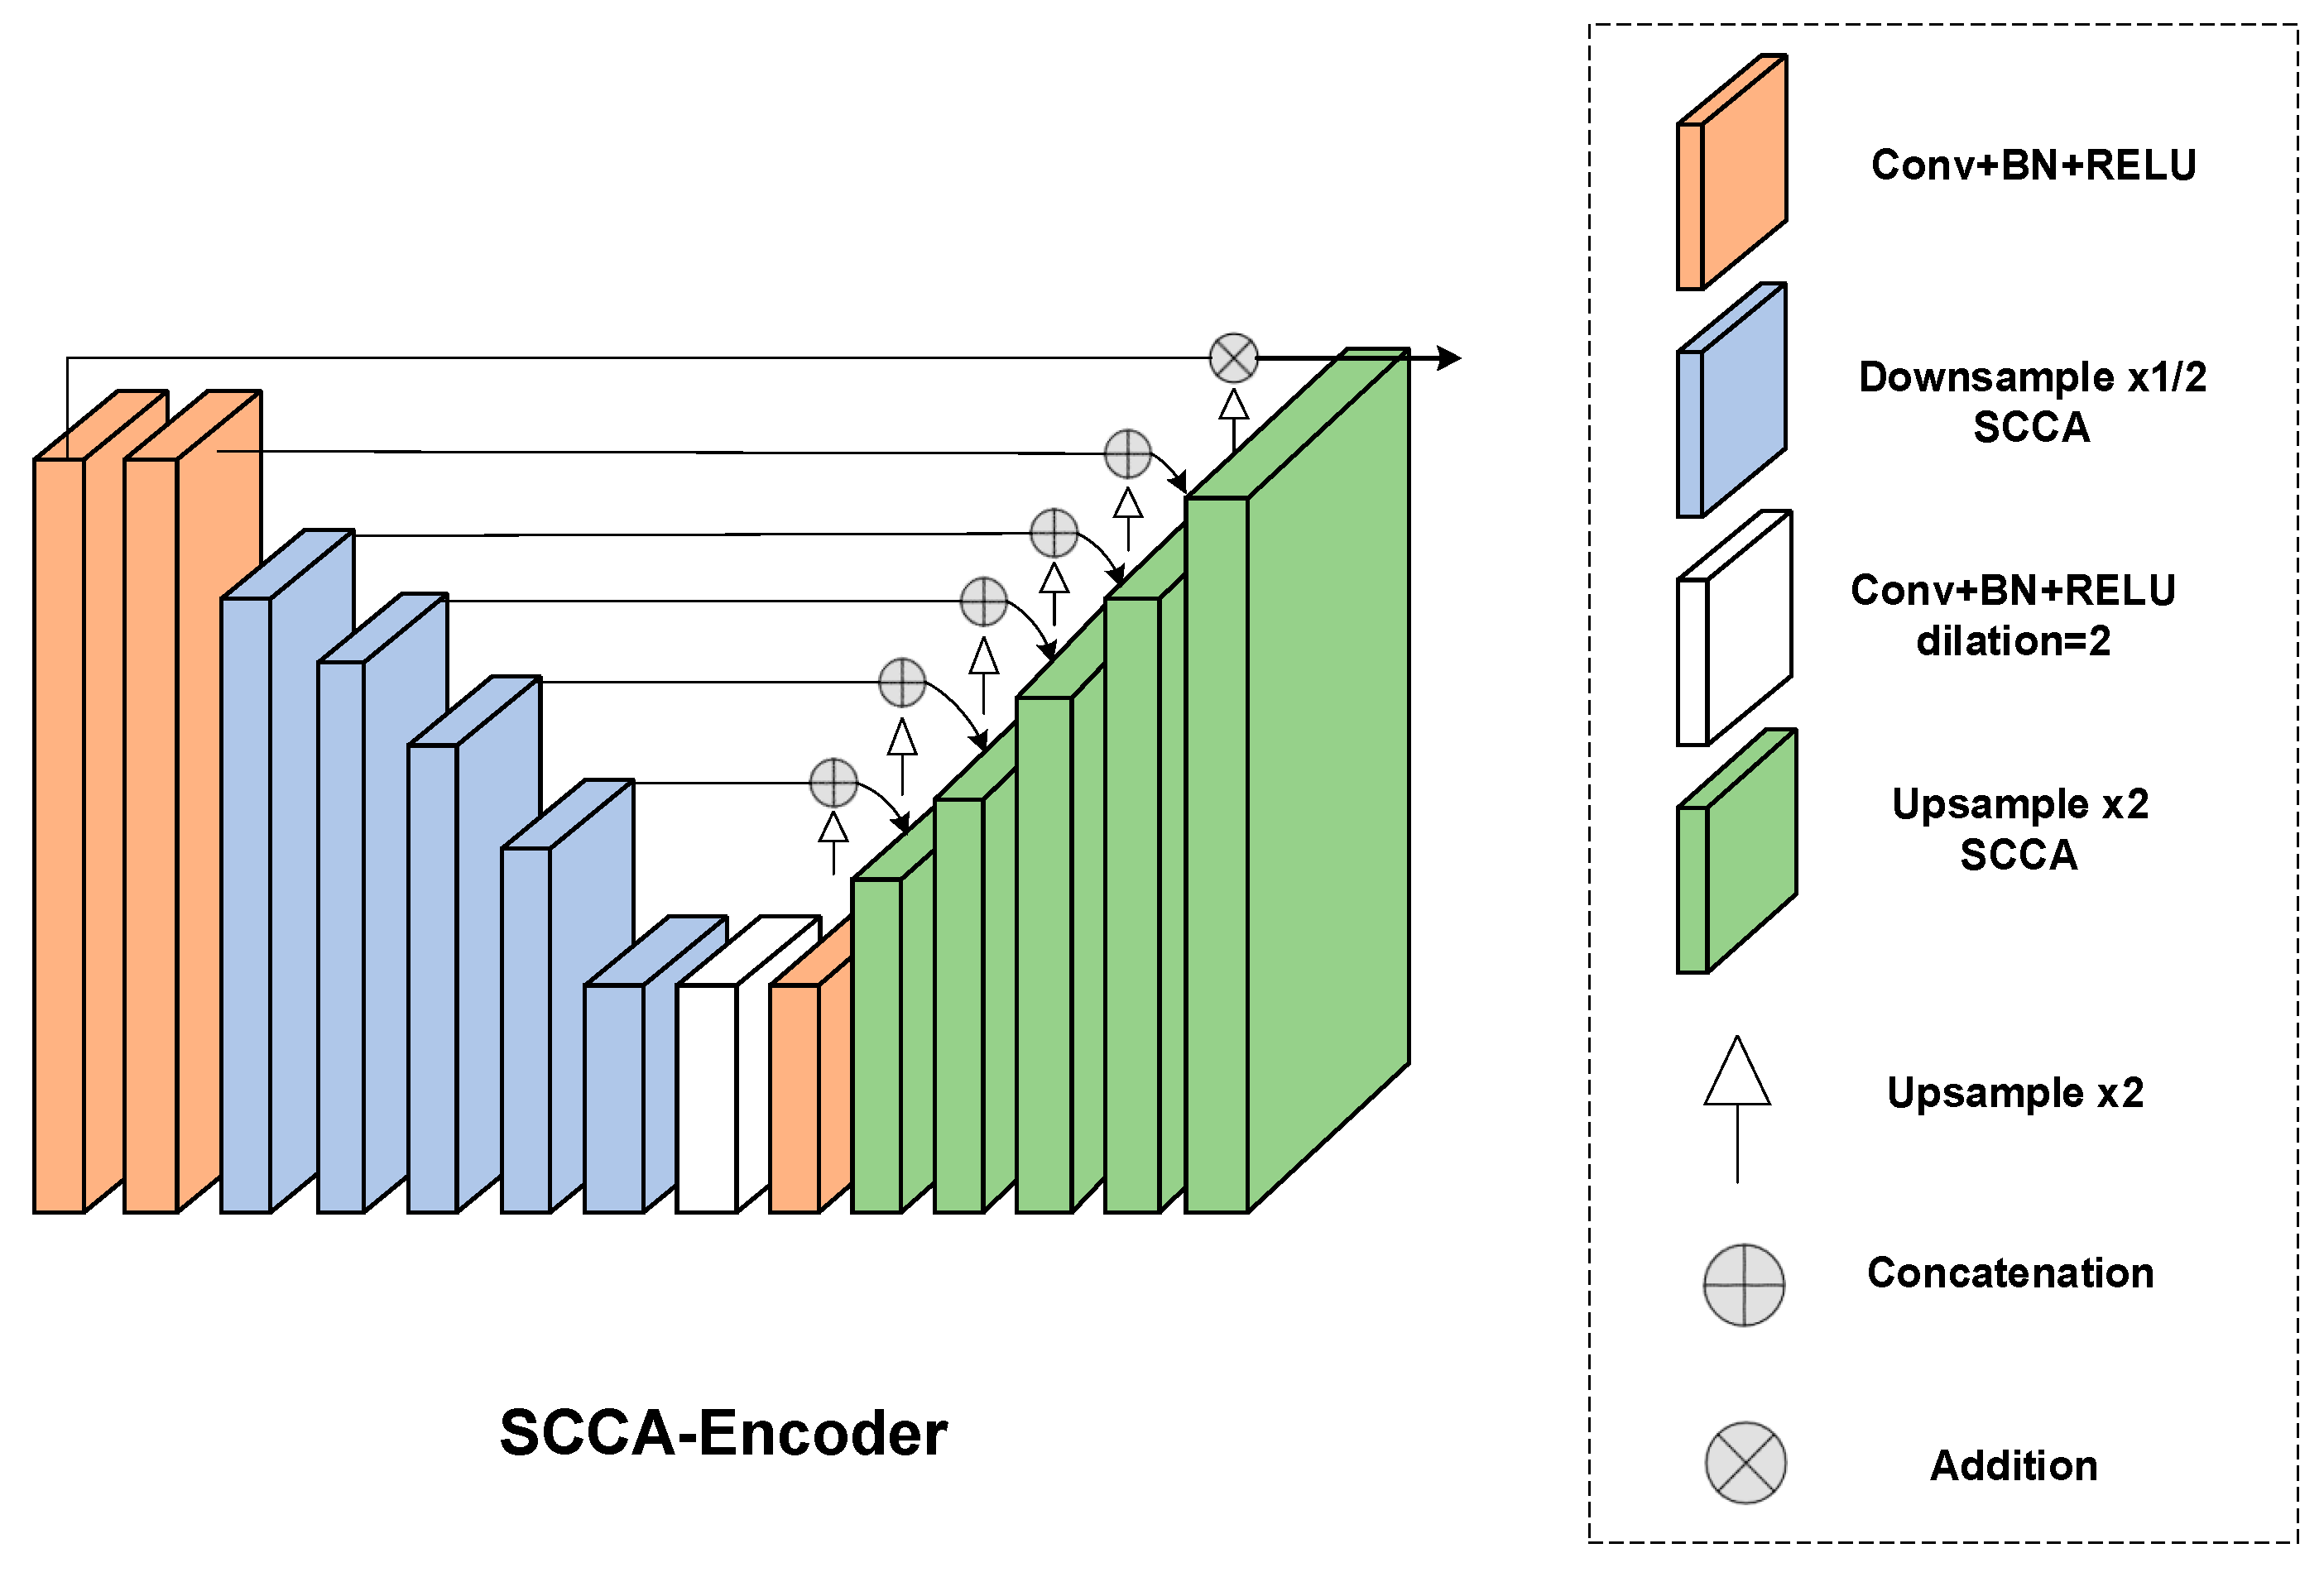
Based on the two improvement strategies, this paper proposes an enhanced U2Net algorithm for salient object detection. In the backbone network for feature extraction, while keeping the overall framework unchanged, the encoder module is replaced by the SCCA module, which can better identify the position information of the object. The structural changes are shown as follows. The BCE loss function is replaced by C2 loss when calculating total loss. The architecture of Encoder and SCCA-Encoder can be seen in Figure 4 and Figure 5.
4. Results and Discussion
4.1. Experiment Processing
The training and prediction process of salient object detection for the SCCA-U2Net algorithm is as follows:
- Model parameter initialization, including the training device, number of input batches, number of iterations, weight decay, learning rate, validation intervals, and whether to use mixed precision;
- Input the training dataset in batches and perform scaling, random cropping, random flipping, and regularization of the images;
- Model training, calculate the loss of the training process;
- Update the weight values according to the direction of the loss gradient and update the learning rate according to the measurement;
- If the maximum number of iterations is reached, the training is terminated, and the weight value is retained. Otherwise, the mean absolute error is calculated, the experimental round is iterated, and the training step is continued until the maximum number of iterations is reached;
- Input pictures and predict the binarized images.
4.2. Experiment Details
For the experiment, we selected several attention modules for comparison, including encoder, CA (coordinate attention) [26], SCCA (split coordinate channel attention), CBAM (convolutional block attention module) [27], SENet (squeeze-and-excitation network) [28], triplet [29], GCB (global context block) [30], SKNet (selective kernel network) [31], NLB (non-local block) [32], and APNB (asymmetric pyramid non-local block) [33]. The objective is to confirm the role of attention modules in salient object detection and to compare the highlighting effects of different attention modules on salient object detection. The prediction time for a single image, the mean absolute error (MAE), F1-score, and model size are compared and analyzed.
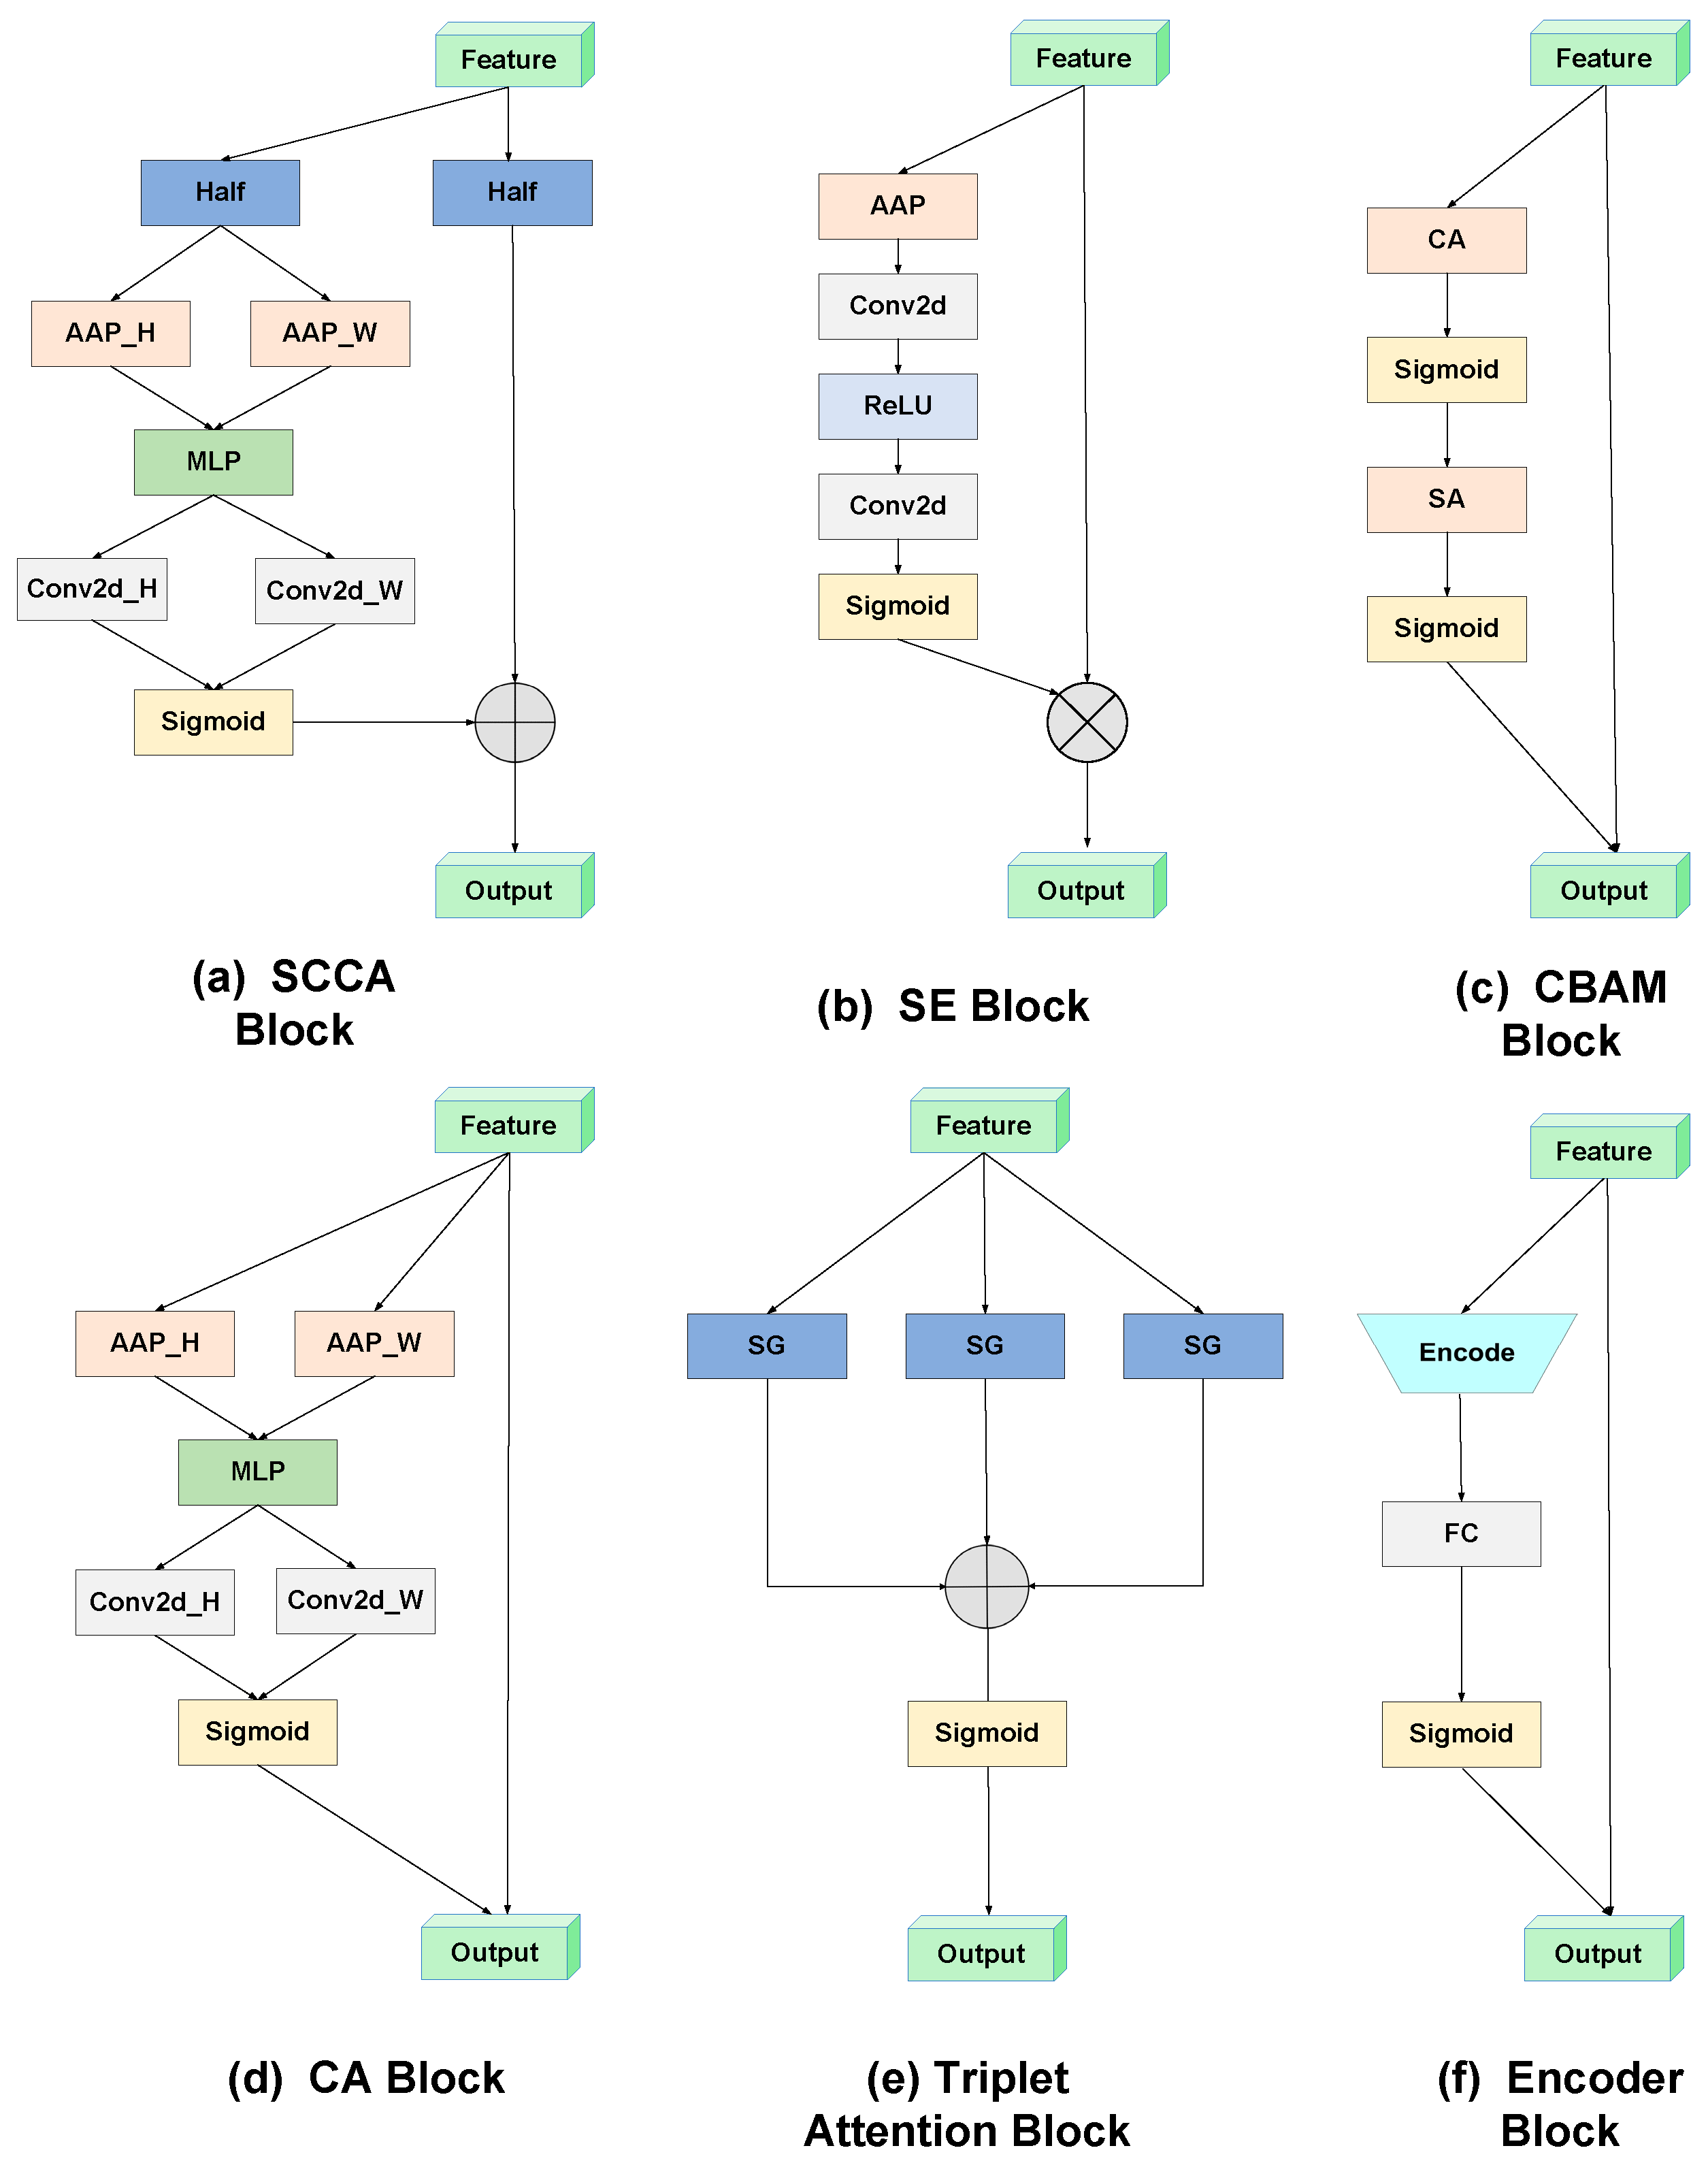
The split ratio of the squeeze block and the kernel size of spatial attention in the CBAM is set as 16 and 7 × 7, respectively. The average transformation and the ratio used in SE is adaptive average pooling and 2, respectively. The reduction ratio in the SCCA, CA is 4, and the kernel size of the convolution of line 1 in the SCCA is 3 × 3. The overall architecture of attention modules is depicted in Figure 6.
4.3. Dataset
DUTS is a saliency detection dataset that includes 10,553 training images and 5019 test images. All training images are collected from the ImageNet DET train/validation set, while the test images are obtained from the ImageNet DET test set and the SUN dataset. Both the training and test sets include highly challenging saliency detection scenarios.
HKU-IS contains 4447 original images and corresponding ground truths, each of which is annotated at the pixel level for salient object detection research. Some images are selected for visualization in Figure 7.
4.4. Evaluation Metrics
There are several metrics used to evaluate the model, including precision (), recall (), F-measure (), and mean absolute error (MAE). The precision calculates the proportion of correctly predicted positive samples among the predicted positive samples. The recall calculates the proportion of correctly predicted positive samples among the true positive samples. The F-measure calculates the weighted harmonic mean considering the precision and recall, while the absolute mean error measures the average pixel absolute error between the predicted saliency map and the true value. is the binary mask image transformed from the saliency map, is the true value, is the predicted value, and and represent the width and height of the feature map, respectively. The introduction of hyperparameters results in a set of maximum or average measures.
4.5. Training Process
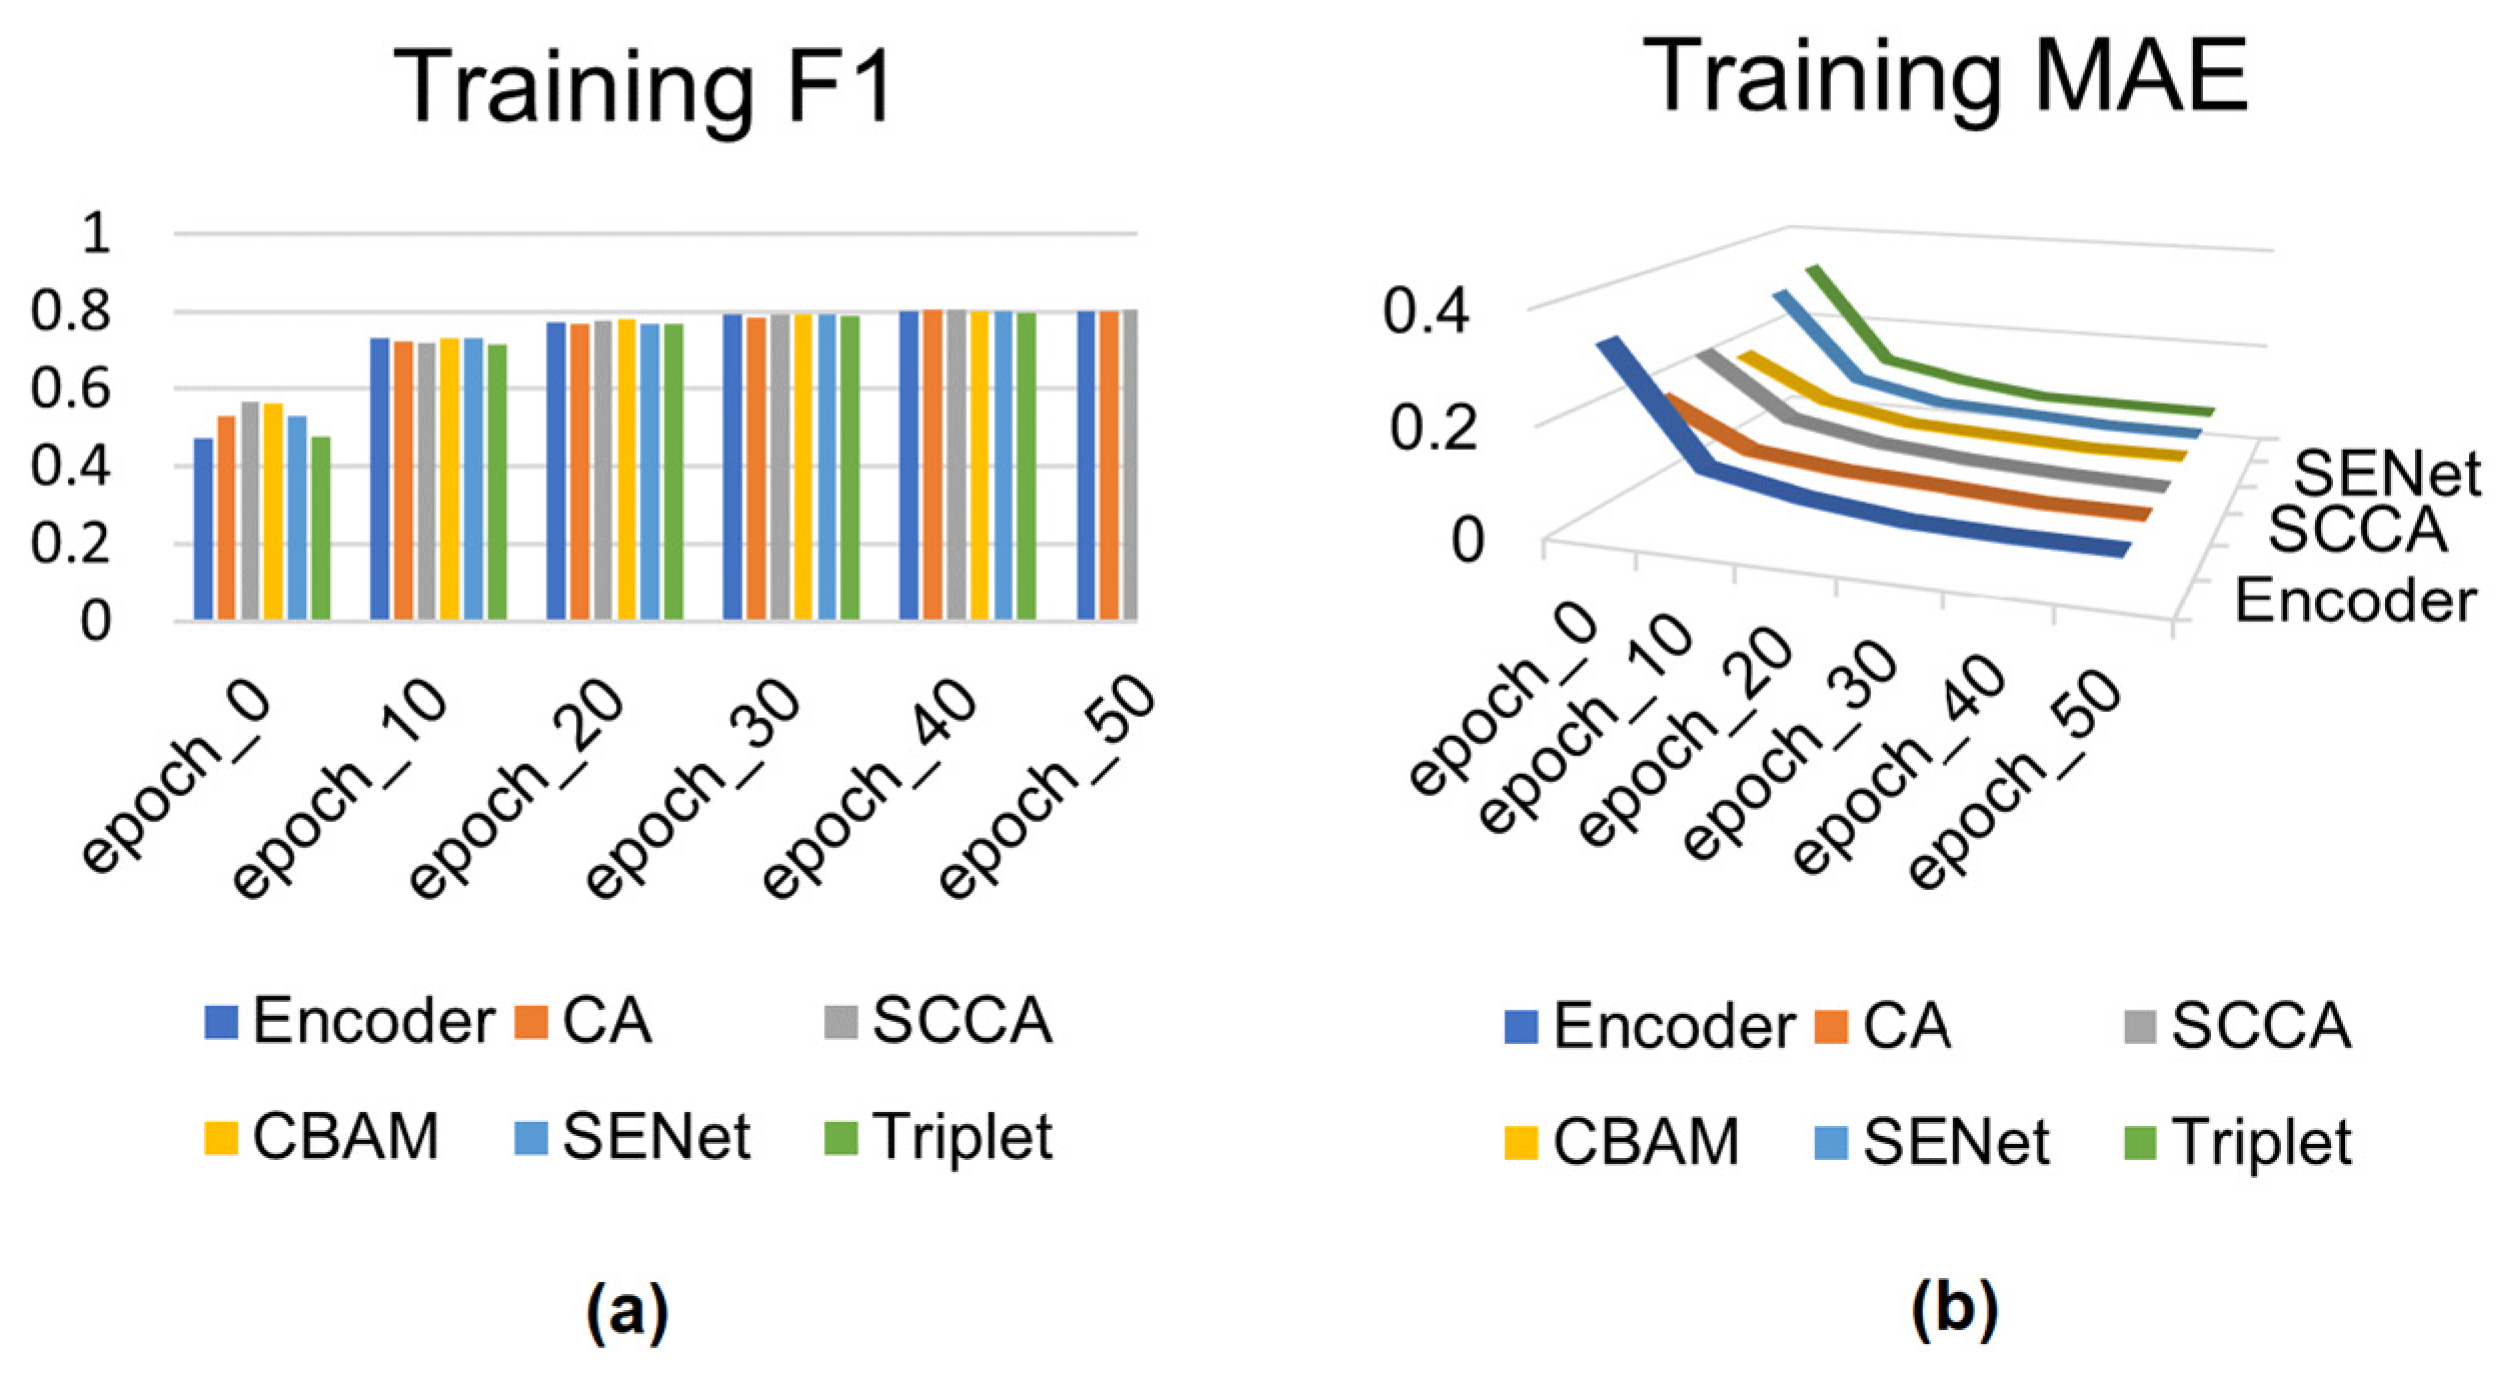
The experimental results in Figure 8 show the F1-score and MAE of different attention modules under 50 rounds and 100 rounds on the DUTS and HKU-IS datasets, respectively. The F1-score of each model increases with an increase in iterations, and the MAE of each model decreases with an increase in iterations, indicating that the training of the model is successful.
4.6. Comparison Analysis
The proposed SCCA module is compared with nine existing state-of-the-art methods. For a fair comparison, different methods are trained using the same parameters. The number of batches, weight decay, number of training rounds, and initial learning rate are set to 16, 1 × 10⁻⁴, 50, and 1 × 10⁻³, respectively. The top-three outstanding performers under the single measure are highlighted in bold. The comparison results are shown in Figure 9 and Table 1.
The encoder makes predictions in the shortest time, taking only 0.387 and 0.020 s to predict a single image, respectively. This illustrates that the original U2Net model utilizes convolutional coding in a reasonable and efficient manner. The SCCA training model has the smallest MAE, being the only model with less than 0.07 and 0.03. SCCA achieves the highest F1-score measure, while CA and SENet are tied for second place on the DUTS dataset, both with an F1-score measure of 0.802. The module sizes of SENet, SCCA, and GCB are the smallest, at 0.50 MB, 0.57 MB, and 0.57 MB, respectively. In the comprehensive evaluation, SCCA demonstrates the best performance, achieving the top-three marks in all four indicators. Encoder and SENet perform well on the HKU-IS dataset but still have potential in improving detection precision and reducing training error. Therefore, the SCCA module has the best detection effect among all attention modules. It not only boasts a high prediction accuracy and few parameters but also has a short prediction time, making it very suitable for deployment on mobile devices for salient object detection tasks.
4.7. Ablation Studies
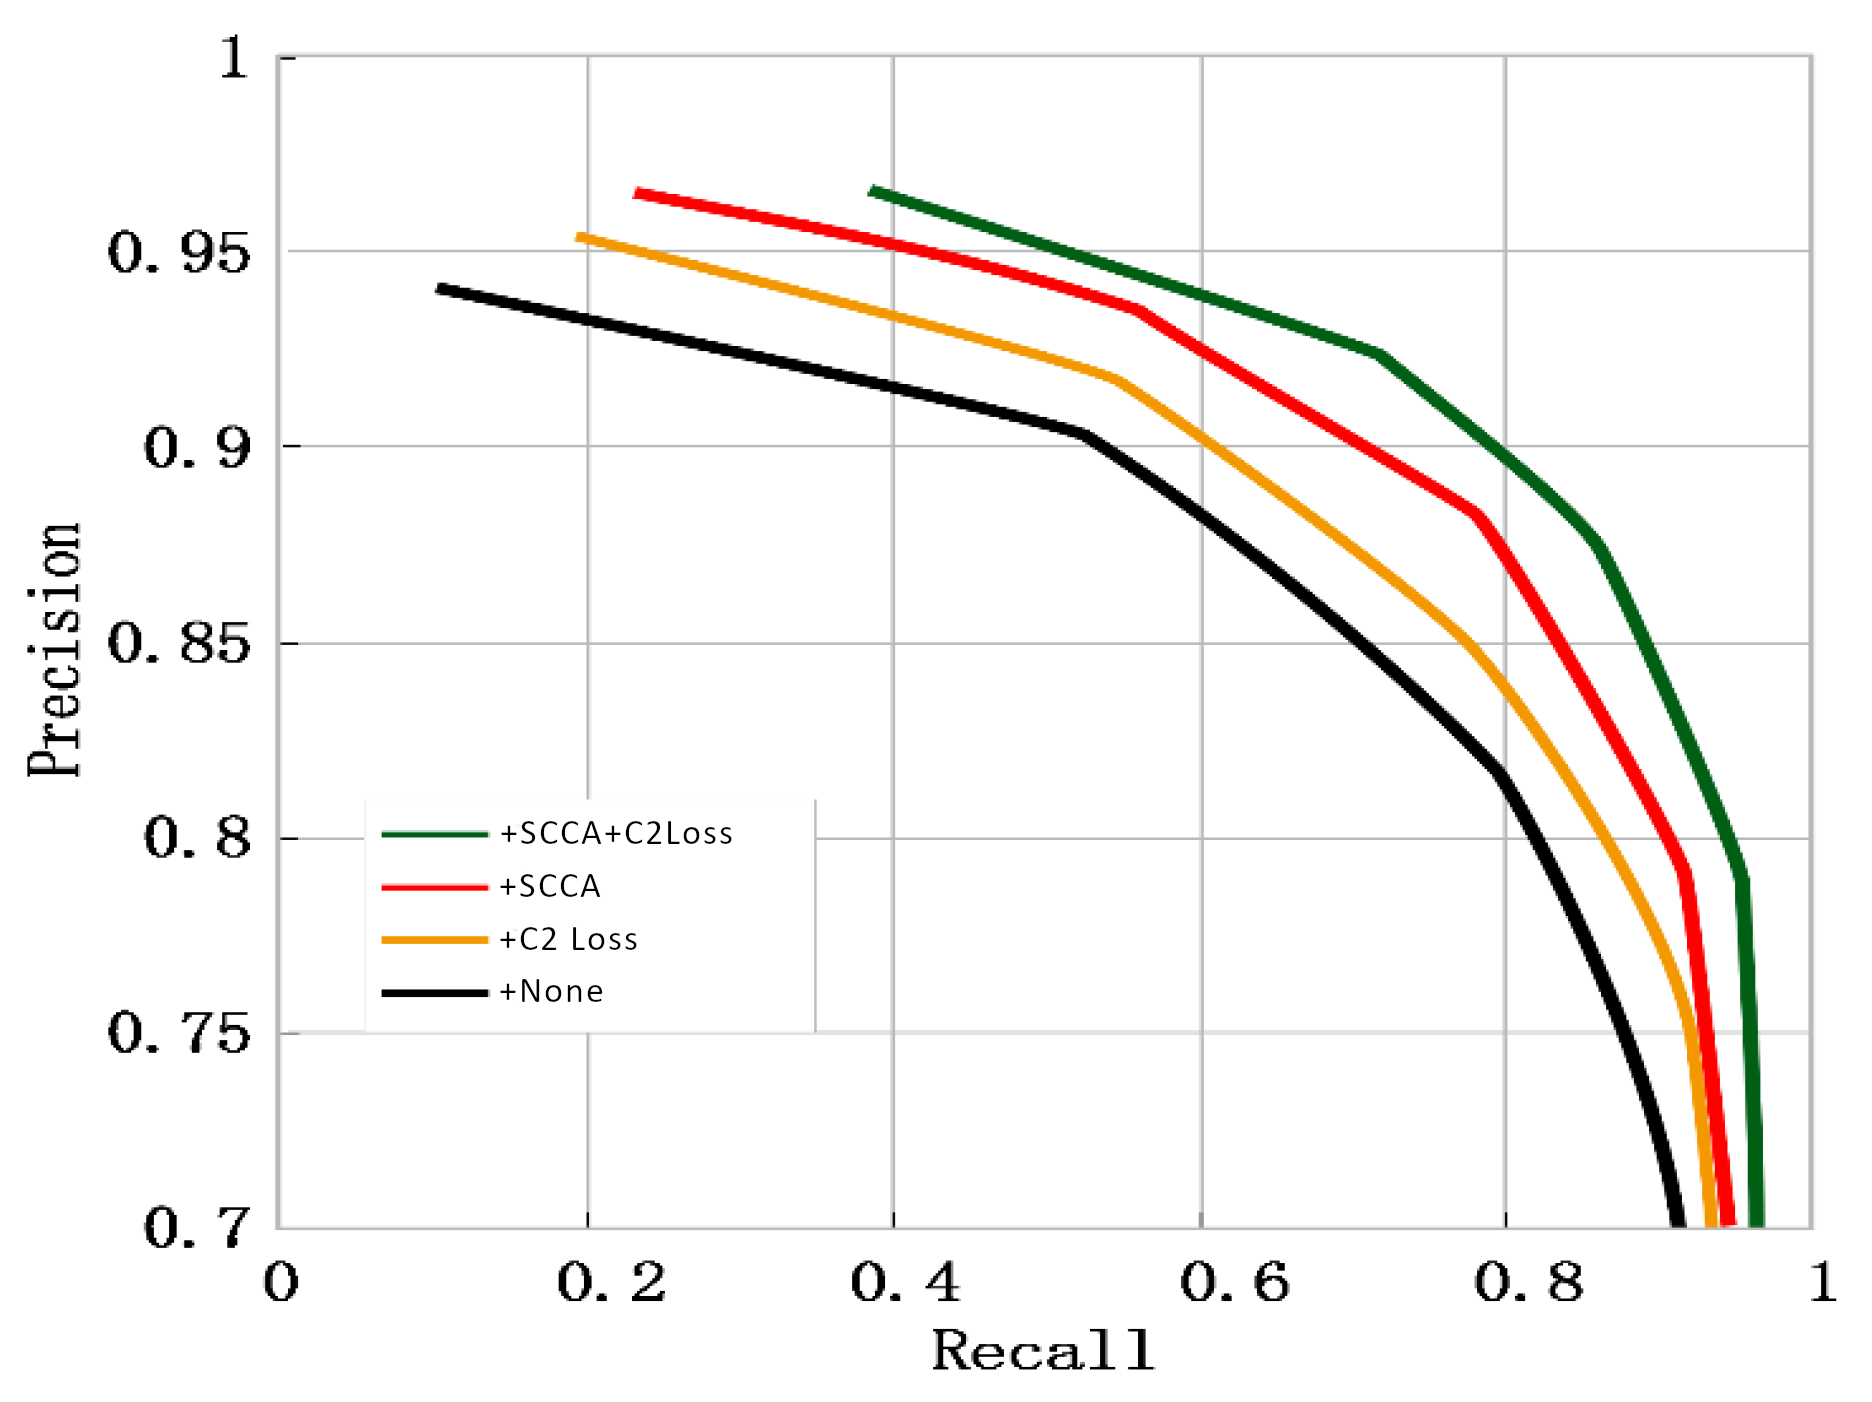
This paper conducts ablation experiments on the two proposed enhanced strategies to verify the impact of SCCA and C2 loss on detection performance, respectively. The model that incorporates both improvement strategies achieves optimal performance across three metrics, albeit with a slight increase in prediction time. The results of ablation studies are shown in Figure 10 and Table 2. The MAE of U2Net+ SCCA+ C2 Loss is significantly smaller than that of the original model, without any additional improvement strategies added. Moreover, the F1-score is higher than that of the model with only a single improvement strategy added. Therefore, the ablation experiment demonstrates that the two enhancement strategies outlined in this paper lead to improvements in the model’s performance to varying degrees.
4.8. Visualization
In the experiment, six attention modules, namely, encoder, SCCA, CA, CBAM, SENet, and triplet, were chosen for visualizing the detection results. Figure 11 displays the detected salient objects using an RGB color map, while Figure 12 shows the detected salient objects using a black-and-white binarized image. For the bird detection results, SCCA can accurately detect the bird entity. However, encoder, CA, and triplet cannot detect the tail of the bird. Although CBAM can detect the bird entity, it is unable to detect the size of the bird. SCCA can accurately detect the woman holding the cat, eliminate noise interference, and outline the woman and the cat. All attention modules perform well in the phone booth detection, but only the predictions of SCCA and encoder which have no gap in the middle of the phone booth are close to the ground truth. When it comes to detecting small sea lions, all attention modules show similar detection effects.
The model’s detection results on the DUTS and HKU-IS datasets indicate that the SCCA attention module exhibits the best overall performance in the evaluation metrics for salient object detection. Furthermore, the two enhancement strategies proposed in this paper have contributed to the model’s improved performance. Visualization results demonstrate that the detection performance of SCCA in real-life scenarios surpasses that of other comparison models. It offers rapid detection speed and minimal model parameters, making it fully suitable for deployment in real-world scenes.
5. Conclusions
In this paper, we propose an enhanced salient object detection algorithm, SCCA-U2Net, to address issues such as incomplete target detection, edge detection failure, noise interference, and interference from secondary targets in salient object detection tasks. Compared to attention modules such as encoder, CA, CBAM, SENet, triplet, GCB, SKNet, NLB, and APNB, SCCA achieves top-three excellent detection results in the four indicators of single prediction time, F1-score, absolute mean error, and model size in the DUTS and HKU-IS datasets. This capability allows for effective detection of the target entity and edge and the ability to distinguish salient objects from secondary objects and background. A novel loss function, C2 loss, proposed in this paper enables the model to learn the edge information of the target to be detected and enhances the detection performance of the model. The experimental results on ablation show that the model achieves the best performance when employing two improved strategies simultaneously. Compared to the original model, the improvement effect is evident.
Author Contributions
Methodology, project administration, supervision, writing—original, software, draft preparation, Y.W. (Yuhuan Wu); data curation, validation, writing—review and editing, Y.W. (Yonghong Wu). All authors have read and agreed to the published version of the manuscript.
Funding
This work was partially supported by the Natural Science Foundation of Hubei Province (No. 2020CFB546), National Natural Science Foundation of China under Grants 12001411, 12201479, and the Fundamental Research Funds for the Central Universities (WUT: 2021IVB024, 2020-IB-003).
Data Availability Statement
Publicly available datasets were analyzed in this study. The DUTS dataset can be found at http://saliencydetection.net/duts/ (accessed on 22 January 2018). The HKU-IS dataset can be found at https://i.cs.hku.hk/~gbli/deep_saliency.html (accessed on 24 August 2016).
Conflicts of Interest
The authors declare no conflicts of interest. The funders had no role in the design of the study; in the collection, analyses, or interpretation of data; in the writing of the manuscript; or in the decision to publish the results.
References
- Sharma, N.; Sharma, R.; Jindal, N. Machine learning and deep learning applications—A vision. Glob. Transit. Proc. 2021, 2, 24–28. [Google Scholar] [CrossRef]
- Shinde, P.P.; Shah, S. A review of machine learning and deep learning applications. In Proceedings of the 2018 Fourth International Conference on Computing Communication Control and Automation (ICCUBEA), Pune, India, 16–18 August 2018; IEEE: New York, NY, USA, 2018; pp. 1–6. [Google Scholar]
- Chai, J.; Zeng, H.; Li, A.; Ngai, E.W. Deep learning in computer vision: A critical review of emerging techniques and application scenarios. Mach. Learn. Appl. 2021, 6, 100134. [Google Scholar] [CrossRef]
- Xu, S.; Wang, J.; Shou, W.; Ngo, T.; Sadick, A.-M.; Wang, X. Computer vision techniques in construction: A critical review. Arch. Comput. Methods Eng. 2021, 28, 3383–3397. [Google Scholar] [CrossRef]
- Voulodimos, A.; Doulamis, N.; Doulamis, A.; Protopapadakis, E. Deep learning for computer vision: A brief review. Comput. Intell. Neurosci. 2018, 2018, 7068349. [Google Scholar] [CrossRef] [PubMed]
- Niu, Z.; Zhong, G.; Yu, H. A review on the attention mechanism of deep learning. Neurocomputing 2021, 452, 48–62. [Google Scholar] [CrossRef]
- Brauwers, G.; Frasincar, F. A general survey on attention mechanisms in deep learning. IEEE Trans. Knowl. Data Eng. 2021, 35, 3279–3298. [Google Scholar] [CrossRef]
- Guo, M.H.; Xu, T.X.; Liu, J.J.; Liu, Z.N.; Jiang, P.T.; Mu, T.J.; Zhang, S.H.; Martin, R.R.; Cheng, M.M.; Hu, S.M. Attention mechanisms in computer vision: A survey. Comput. Vis. Media 2022, 8, 331–368. [Google Scholar] [CrossRef]
- Tong, W.; Chen, W.; Han, W.; Li, X.; Wang, L. Channel-attention-based DenseNet network for remote sensing image scene classification. IEEE J. Sel. Top. Appl. Earth Obs. Remote Sens. 2020, 13, 4121–4132. [Google Scholar] [CrossRef]
- Zhou, T.; Fan, D.-P.; Cheng, M.-M.; Shen, J.; Shao, L. RGB-D salient object detection: A survey. Comput. Vis. Media 2021, 7, 37–69. [Google Scholar] [CrossRef] [PubMed]
- Ji, Y.; Zhang, H.; Zhang, Z.; Liu, M. CNN-based encoder-decoder networks for salient object detection: A comprehensive review and recent advances. Inf. Sci. 2021, 546, 835–857. [Google Scholar] [CrossRef]
- Wang, L.; Lu, H.; Wang, Y.; Feng, M.; Wang, D.; Yin, B.; Ruan, X. Learning to detect salient objects with image-level supervision. In Proceedings of the IEEE Conference on Computer Vision and Pattern Recognition, Honolulu, HI, USA, 21 July 2017; pp. 136–145. [Google Scholar]
- Rong, W.; Li, Z.; Zhang, W.; Sun, L. An improved CANNY edge detection algorithm. In Proceedings of the 2014 IEEE International Conference on Mechatronics and Automation, Tianjin, China, 3–6 August 2014; IEEE: New York, NY, USA, 2014; pp. 577–582. [Google Scholar]
- Qin, X.; Zhang, Z.; Huang, C.; Dehghan, M.; Zaiane, O.R.; Jagersand, M. U2-Net: Going deeper with nested U-structure for salient object detection. Pattern Recognit. 2020, 106, 107404. [Google Scholar] [CrossRef]
- Wang, W.; Zhao, S.; Shen, J.; Hoi, S.C.; Borji, A. Salient object detection with pyramid attention and salient edges. In Proceedings of the IEEE/CVF Conference on Computer Vision and Pattern Recognition, Long Beach, CA, USA, 15–20 June 2019; pp. 1448–1457. [Google Scholar]
- Wei, J.; Wang, S.; Huang, Q. F³Net: Fusion, feedback and focus for salient object detection. In Proceedings of the AAAI Conference on Artificial Intelligence, New York, NY, USA, 7–12 February 2020; Volume 34, pp. 12321–12328. [Google Scholar]
- Qin, X.; Zhang, Z.; Huang, C.; Gao, C.; Dehghan, M.; Jagersand, M. Basnet: Boundary-aware salient object detection. In Proceedings of the IEEE/CVF Conference on Computer Vision and Pattern Recognition, Long Beach, CA, USA, 15–20 June 2019; pp. 7479–7489. [Google Scholar]
- Zhao, X.; Pang, Y.; Zhang, L.; Lu, H.; Zhang, L. Suppress and balance: A simple gated network for salient object detection. In Proceedings of the Computer Vision–ECCV 2020: 16th European Conference, Glasgow, UK, 23–28 August 2020; Proceedings, Part II 16. Springer International Publishing: Berlin/Heidelberg, Germany, 2020; pp. 35–51. [Google Scholar]
- Chen, T.; Hu, X.; Xiao, J.; Zhang, G.; Wang, S. CFIDNet: Cascaded feature interaction decoder for RGB-D salient object detection. Neural Comput. Appl. 2022, 34, 7547–7563. [Google Scholar] [CrossRef]
- Liao, G.; Gao, W.; Li, G.; Wang, J.; Kwong, S. Cross-collaborative fusion-encoder network for robust RGB-thermal salient object detection. IEEE Trans. Circuits Syst. Video Technol. 2022, 32, 7646–7661. [Google Scholar] [CrossRef]
- Wang, Q.; Liu, Y.; Xiong, Z.; Yuan, Y. Hybrid feature aligned network for salient object detection in optical remote sensing imagery. IEEE Trans. Geosci. Remote Sens. 2022, 60, 5624915. [Google Scholar] [CrossRef]
- Zhou, X.; Shen, K.; Weng, L.; Cong, R.; Zheng, B.; Zhang, J.; Yan, C. Edge-guided recurrent positioning network for salient object detection in optical remote sensing images. IEEE Trans. Cybern. 2022, 53, 539–552. [Google Scholar] [CrossRef] [PubMed]
- Wu, Y.H.; Liu, Y.; Zhang, L.; Cheng, M.M.; Ren, B. EDN: Salient object detection via extremely-downsampled network. IEEE Trans. Image Process. 2022, 31, 3125–3136. [Google Scholar] [CrossRef]
- Ji, Y.; Zhang, H.; Jie, Z.; Ma, L.; Wu, Q.M.J. CASNet: A cross-attention siamese network for video salient object detection. IEEE Trans. Neural Netw. Learn. Syst. 2020, 32, 2676–2690. [Google Scholar] [CrossRef]
- Canny, J.F. Finding Edges and Lines in Images; AITR-720; Theory of Computing Systems/Mathematical Systems Theory; Artificial lntelligence Laboratory: Cambridge, MA, USA, 1983; Volume 16. [Google Scholar]
- Hou, Q.; Zhou, D.; Feng, J. Coordinate attention for efficient mobile network design. In Proceedings of the IEEE/CVF Conference on Computer Vision and Pattern Recognition, Nashville, TN, USA, 19–25 June 2021; pp. 13713–13722. [Google Scholar]
- Woo, S.; Park, J.; Lee, J.Y.; Kweon, I.S. Cbam: Convolutional block attention module. In Proceedings of the European Conference on Computer Vision (ECCV), Munich, Germany, 8–14 September 2018; pp. 3–19. [Google Scholar]
- Hu, J.; Shen, L.; Sun, G. Squeeze-and-excitation networks. In Proceedings of the IEEE Conference on Computer Vision and Pattern Recognition, Salt Lake City, UT, USA, 18–23 June 2018; pp. 7132–7141. [Google Scholar]
- Misra, D.; Nalamada, T.; Arasanipalai, A.U.; Hou, Q. Rotate to attend: Convolutional triplet attention module. In Proceedings of the IEEE/CVF Winter Conference on Applications of Computer Vision, Virtual, 5–9 January 2021; pp. 3139–3148. [Google Scholar]
- Yang, Y.; Deng, H. GC-YOLOv3: You only look once with global context block. Electronics 2020, 9, 1235. [Google Scholar] [CrossRef]
- Li, X.; Wang, W.; Hu, X.; Yang, J. Selective kernel networks. In Proceedings of the IEEE/CVF Conference on Computer Vision and Pattern Recognition, Long Beach, CA, USA, 15–20 June 2019; pp. 510–519. [Google Scholar]
- Wang, X.; Girshick, R.; Gupta, A.; He, K. Non-local neural networks. In Proceedings of the IEEE Conference on Computer Vision and Pattern Recognition, Salt Lake City, UT, USA, 18–23 June 2018; pp. 7794–7803. [Google Scholar]
- Zhu, Z.; Xu, M.; Bai, S.; Huang, T.; Bai, X. Asymmetric non-local neural networks for semantic segmentation. In Proceedings of the IEEE/CVF International Conference on Computer Vision, Seoul, Republic of Korea, 27–28 October 2019; pp. 593–602. [Google Scholar]
Figure 1.
The flow chart of U2Net.

Figure 2.
The structure of SCCA.

Figure 3.
Loss calculation graph.

Figure 4.
The architecture of the encoder.

Figure 5.
The architecture of the SCCA-encoder.

Figure 6.
The structure of six compared attention blocks, AAP, MLP, CA, SA, RT, and FC, represents the adaptive average pooling, multilayer perceptron, channel attention, spatial attention, residual transformation, and full connection, respectively.
Figure 6.
The structure of six compared attention blocks, AAP, MLP, CA, SA, RT, and FC, represents the adaptive average pooling, multilayer perceptron, channel attention, spatial attention, residual transformation, and full connection, respectively.

Figure 7.
Samples selected from the DUTS and HKU-IS datasets.


Figure 8.
Training results of the DUTS dataset with added attention modules: encoder, CA (channel attention), SCCA (split coordinate channel attention), CBAM (convolutional block attention module), SE (squeeze-and-excitation Network), and triplet. (a,b) shows the comparison results of F1-score and MAE, respectively.

Figure 9.
Detection results of the compared attention mechanisms.

Figure 10.
Ablation results of U2Net.

Figure 11.
Visualization of the RGB color maps of the compared mechanisms.

Figure 12.
Visualization of the black-and-white binarized images of the compared mechanisms.


Table 1.
Detection results of the compared attention mechanisms.
| Attention | Size | DUTS | HKU-IS | ||||
|---|---|---|---|---|---|---|---|
| Times | MAE | F1-Score | Times | MAE | F1-Score | ||
| Encoder | 1.29 | 0.387 | 0.071 | 0.801 | 0.020 | 0.032 | 0.932 |
| CA | 0.58 | 0.555 | 0.072 | 0.802 | 0.054 | 0.033 | 0.927 |
| SCCA | 0.57 | 0.424 | 0.067 | 0.806 | 0.054 | 0.028 | 0.938 |
| CBAM | 0.6 | 0.609 | 0.074 | 0.801 | 0.089 | 0.032 | 0.930 |
| SENet | 0.5 | 0.436 | 0.071 | 0.802 | 0.021 | 0.031 | 0.931 |
| Triplet | 0.88 | 0.544 | 0.071 | 0.801 | 0.034 | 0.034 | 0.924 |
| GCB | 0.57 | 0.582 | 0.070 | 0.800 | 0.038 | 0.036 | 0.919 |
| SKNet | 6.65 | 1.086 | 0.840 | 0.792 | 0.072 | 0.040 | 0.894 |
| NLB | 35.01 | 1.568 | 0.180 | 0.768 | 1.002 | 0.048 | 0.882 |
| APNB | 35.01 | 1.653 | 0.160 | 0.770 | 1.004 | 0.048 | 0.884 |
Table 2.
Ablation results of U2Net. × indicates that the strategy is not used, √ indicates that the strategy is used.
Table 2.
Ablation results of U2Net. × indicates that the strategy is not used, √ indicates that the strategy is used.
| SCCA | C2 Loss | Size | DUTS | HKU-IS | ||||
|---|---|---|---|---|---|---|---|---|
| Times | MAE | F1-Score | Times | MAE | F1-Score | |||
| × | × | 1.29 | 0.387 | 0.071 | 0.801 | 0.020 | 0.032 | 0.932 |
| √ | × | 0.57 | 0.424 | 0.067 | 0.806 | 0.054 | 0.028 | 0.938 |
| × | √ | 1.29 | 0.402 | 0.069 | 0.804 | 0.032 | 0.030 | 0.934 |
| √ | √ | 0.57 | 0.424 | 0.066 | 0.809 | 0.056 | 0.028 | 0.939 |
Disclaimer/Publisher’s Note: The statements, opinions and data contained in all publications are solely those of the individual author(s) and contributor(s) and not of MDPI and/or the editor(s). MDPI and/or the editor(s) disclaim responsibility for any injury to people or property resulting from any ideas, methods, instructions or products referred to in the content. |
© 2024 by the authors. Licensee MDPI, Basel, Switzerland. This article is an open access article distributed under the terms and conditions of the Creative Commons Attribution (CC BY) license (https://creativecommons.org/licenses/by/4.0/).
Share and Cite
MDPI and ACS Style
Wu, Y.; Wu, Y. Application of Split Coordinate Channel Attention Embedding U2Net in Salient Object Detection. Algorithms 2024, 17, 109. https://doi.org/10.3390/a17030109
AMA Style
Wu Y, Wu Y. Application of Split Coordinate Channel Attention Embedding U2Net in Salient Object Detection. Algorithms. 2024; 17(3):109. https://doi.org/10.3390/a17030109
Chicago/Turabian StyleWu, Yuhuan, and Yonghong Wu. 2024. "Application of Split Coordinate Channel Attention Embedding U2Net in Salient Object Detection" Algorithms 17, no. 3: 109. https://doi.org/10.3390/a17030109
Note that from the first issue of 2016, this journal uses article numbers instead of page numbers. See further details here.