1. Introduction
Within the field of bioacoustics, there is a growing need for accurate automatic signal classification for tasks such as call-type classification, individual identification, and assessment of correlation between vocalization patterns and specific social or behavioral contexts. There are a number of well-established techniques for vocalization classification, both template-based and parameter-based. Of the template-based methods, many require significant hand-tuning and have difficulty with temporal and individual variability. In recent years, there has been work toward application of more advanced pattern recognition methods such as those used in human speech and speaker recognition, in particular Hidden Markov Models (HMMs). The work presented here focuses on the use of HMMs as a robust recognition framework for bioacoustic signal classification across a variety of species and classification tasks.
Existing methods for bioacoustic signal classification include multivariate feature analysis, spectrogram cross-correlation, matched filtering, neural networks, dynamic time warping, and others. The most well-established of these is spectrogram cross-correlation (SPCC) [
1,
2], in which a spectrogram (time-sequence of short-time Fourier transforms) is directly correlated with test vocalizations. Spectrogram cross-correlation is simple to implement, requiring only a single vocalization example of each type of call to be recognized, and can be easily applied to either the isolated vocalization task, where recordings have been presegmented into separate files, or to continuous detection, where a sliding window is applied across a long recording, with correlation peaks indicating target detection. This SPCC method is well-suited to recognizing animal sounds consisting of tones and frequency sweeps [
3]. However, the cross correlation approach is unable to adapt to changes in call duration and alignment, and is also significantly impacted by frequency variation such as shifts caused by vocal individuality across callers.
Matched filtering (MF) is a time-series correlation method that uses synthetic waveforms [
4] or synthetic spectrograms [
3] instead of recording examples. This approach is also easy to implement, although requiring more effort to construct pattern templates, and has many of the same strengths and weaknesses as spectrogram cross-correlation. Artificial Neural Network (ANN) approaches can be used for classification in many different applications, depending on the specific choice of input features and network topologies. If spectrogram values are used as input features, a common configuration, then ANNs can adjust the emphasis given to various portions of the time-frequency template, giving improved classification for some tasks such as species detection [
5,
6,
7]. However, in this configuration, ANNs are subject to some of the same temporal nonlinearity and frequency shifting weaknesses as SPCC and MF. Dynamic time warping (DTW) [
8], commonly used in small-vocabulary isolated word recognition for human speech, is able to handle temporal nonlinearity through optimal frame-to-frame alignment of the reference template with test vocalizations. However, it is difficult to implement DTW in a continuous detection framework, which is one of the reasons it is now rarely used for large-scale speech recognition.
HMMs, now used in nearly all state-of-the-art speech recognition systems, have begun to gain attention in bioacoustics as well [
9,
10,
11,
12]. An HMM is a statistical state machine model where each state represents a stationary spectral configuration, and transitions between states represent spectral changes over time. Benefits of HMMs include their ability to handle nonlinear temporal alignment, their statistical basis for classification, their extendibility to continuous recognition or detection, and the ease with which they can incorporate complex language or other recognition constraints.
The performance of HMM-based systems has been compared to other classification methods for bioacoustic tasks. Weisburn
et al. [
13] compared the performance of a matched filter and an HMM system for detecting bowhead whale (
Balaena mysticetus) call notes. The matched filter used a spectrogram template, while the HMM used the three largest spectral peaks as features for an 18-stage model. The HMM detected 97% of the notes, whereas the MF detected 84%. Anderson [
14] compared an HMM approach to a DTW-based system using a dataset consisting of two different species of bird song. His conclusion was that although the DTW system worked better with a small amount of training data, the HMM system was more robust to noise and to vocalization variability.
One of the issues that makes comparison across methods difficult is that of feature extraction. The selection of features is an essential component of any pattern recognition system, often having as much or more impact on the outcome as the choice of classification model. For example, SPCC by definition relies on short-time Fourier transform amplitudes as a feature, whereas MF uses a direct time-series correlation, and DTW can use any spectral distance measure between frames. HMMs, as statistical classification models, are able to use any frame-based feature vector giving meaningful discriminability across classes, most commonly cepstral coefficients. This use of cepstrum coefficients is somewhat different than the standard statistical analysis approaches common in the bioacoustics field, where typical features include whole-vocalization measures such as duration, energy, and maximum, minimum and average fundamental frequency values. Such measures work well with statistical test techniques such as the t-test, Chi-Squared test, MANOVA, and factor analysis. Frame-based features, however, are somewhat more difficult to use with traditional statistical approaches [
8,
15] because there are a variable number of features per vocalization. Another significant and often unavoidable problem in bioacoustic signal processing is the presence of background noise due to adverse recording environments, as well as convolutional noise due to microphone and sound propagation variability. Standard spectral features are highly sensitive to noise, which can decrease system accuracy and give misleading results. It is important, therefore, to incorporate signal enhancement and/or robust feature extraction techniques that enhance the vocalization while suppressing background noise. Common techniques to reduce noise artifacts in bioacoustic signals include basic bandpass filters and related frequency-based methods for spectrogram filtering and equalization, often incorporated directly into acquisition and analysis tools [
16]. Other approaches in recent years have included spectral subtraction [
17], minimum mean-squared error (MMSE) estimation [
18,
19], adaptive line enhancement [
20], and perceptually motivated wavelet denoising [
21].
In the study presented here, we examine the HMM recognition framework and look at its applicability to several different types of bioacoustic classification tasks. The framework is illustrated with three different datasets, each representing a different kind of task. While the same HMM framework and feature extraction methods are used across all tasks, front-end signal processing methods and implementation details are tailored to each application. Application tasks include call type classification of Asian elephant vocalizations, syllable-based song-type classification of ortolan bunting songs, and age-dependent stress stimulus classification of poultry vocalizations.
3. Experiments
3.1. Asian Elephant (Elephas maximus): Repertoire Analysis
Elephants are intelligent, long-living animals that live in a complex and fluid society in which several modes of communication play a role in maintaining group cohesion and social order, and in locating and assessing reproductive state of potential mates [
32,
33]. Although the social and behavioral contexts of Asian elephant communication signals are well studied [
34,
35,
36,
37], the study of the elephant vocal repertoire through categorization of call types by acoustic parameters is still needed as a basis for future research on individuality and for comparisons of acoustic communication among elephant species and populations [
32]. McKay [
38] described ten basic vocalizations for Asian elephants, divided into three major categories. However, only the low frequency rumble has been described by spectral and temporal features [
39].
This study focuses on call type classification for Asian elephant repertoire analysis and validation. Vocalizations were recorded from captive elephants housed at the Oregon Zoo in Portland, OR (USA) and from domesticated elephants in Thailand [
40,
41]. Vocalizations were collected in a variety of social contexts, time frames, and environmental noise conditions in both urban and rural settings. Data was recorded from seven known individuals and between 10 and 25 unknown individuals, at distances ranging from 1 to 100 meters. The primary sampling rate was 44.1 kHz, although a few calls were alternatively recorded at 32 kHz. Call types were manually classified using perceptual aural cues and visual inspection of spectrograms for differentiation of fundamental frequency contour, tonality, and signal duration. Glaeser
et al. [
40,
41] defined an acoustic repertoire of Asian elephants based on acoustic parameters, and validated structural distinction among six basic call types (Bark, Roar, Rumble, Squeak, Squeal, and Trumpet) and the non-laryngeal Blow. In addition to these basic call types, five call combinations with these basic calls forming their constituent parts are defined (Roar-Rumble, Squeal-Squeak, Squeak train, Squeak-Bark, and Trumpet-Roar). The frequency range of the signal energy ranges from 14 Hz up to 9 kHz, and call durations range from 0.1 to 14 seconds. Trumpets, Squeaks, Squeals have energy in the higher frequency range (54 Hz to 9 kHz) and are differentiated perceptually and through visual inspection by frequency modulation and duration. Rumbles, Roars, and Barks are limited to the lower frequency range (14 Hz to 5 kHz), and are differentiated by amplitude modulation and duration. A total of 2,044 vocalizations were manually segmented into all call categories. All vocalizations are included in the data set, regardless of signal degradation by noise or presence of overlapping signals.
To maximize training set size given the limited number of examples, 5-fold cross validation is implemented. In the cross-validation methodology, the data set is divided into multiple equal subsets (five for this experiment), with one set used for testing and the remaining for training. The process is then repeated once for each test subset, so that each example is used as a test point exactly once.
For analysis, GFCC features are extracted from the vocalizations using a moving Hamming window with a window size of 25 ms with 15 ms overlap. A 39 element feature vector (standard in human speech recognition) is used, with 12 GFCC coefficients with cepstral mean normalization plus log-energy, appended by velocity and acceleration, as described previously. The Greenwood frequency warping constants are calculated using 10 Hz−10 kHz to encompass the signal energy [
40,
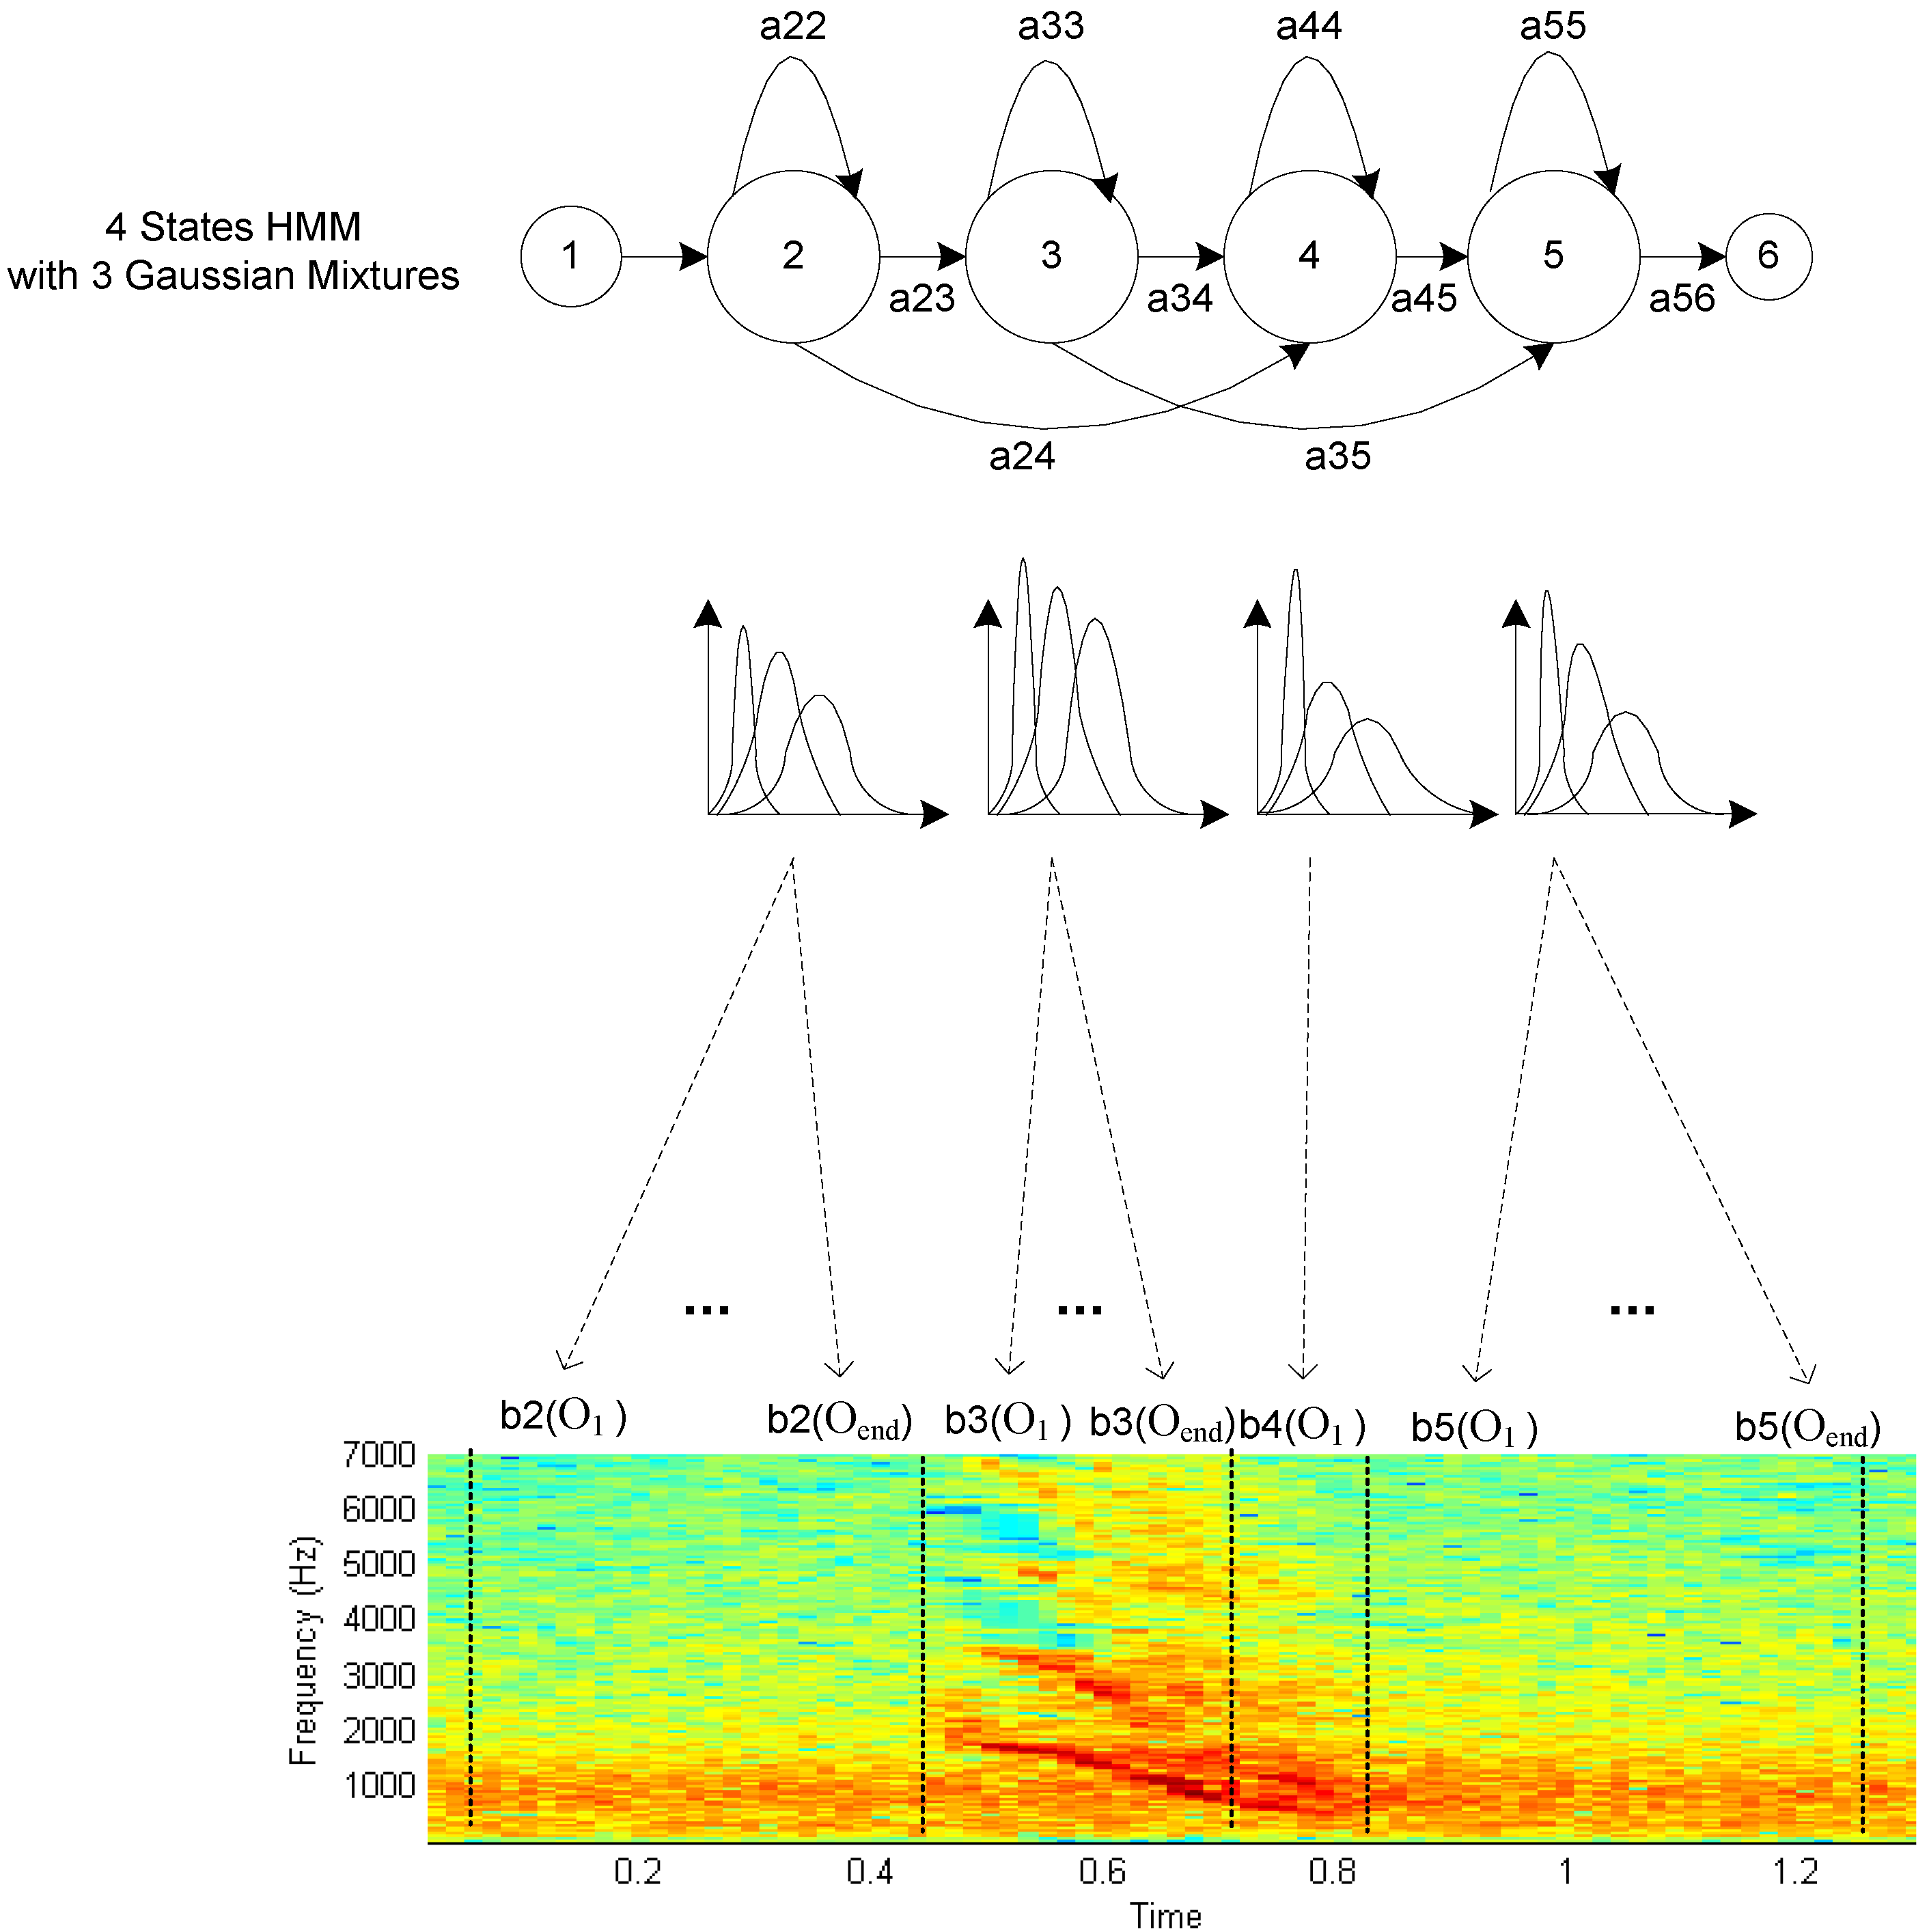
41]. A total of 60 triangular filterbanks (more than is usually used in human speech) are spaced in accordance with the Greenwood warping function across that frequency range to guarantee enough filterbanks in the low frequencies, where a large amount of signal energy is located. One Hidden Markov Model is used to model each of the 11 different call types discussed above, with 12 emitting states per HMM and GMM state distributions with three Gaussian mixtures per state. A range of parameter variations was also implemented for comparative evaluation, with generally similar performance present across a broad range of states and mixtures.
Table 1.
Confusion matrix for 12 state HMM with 3 mixtures. Basic call types are shown in bold. BRK=Bark, RRM=Roar-Rumble, ROR=Roar, RUM=Rumble, SKC=SqueakTrain, SQG=Squeak-Bark, SQK=Squeak, SQL=Squeal, SQS=Squeak-Squeal, TMP=Trumpet, TRR=Trumpet-Roar. Overall accuracy is 60.1% (vs. chance accuracy 28.0%).
| | Classification |
| BRK | RRM | ROR | RUM | SKC | SQG | SQK | SQL | SQS | TMP | TRR |
| Label | BRK | 42 | 0 | 10 | 20 | 0 | 0 | 1 | 5 | 0 | 6 | 0 |
| RRM | 0 | 5 | 8 | 4 | 0 | 0 | 0 | 0 | 0 | 0 | 0 |
| ROR | 21 | 5 | 134 | 32 | 0 | 0 | 0 | 11 | 2 | 8 | 0 |
| RUM | 7 | 1 | 20 | 87 | 1 | 0 | 0 | 32 | 10 | 23 | 0 |
| SKC | 0 | 0 | 2 | 0 | 64 | 5 | 0 | 10 | 22 | 3 | 0 |
| SQG | 0 | 0 | 1 | 0 | 8 | 13 | 3 | 2 | 1 | 0 | 0 |
| SQK | 11 | 0 | 0 | 5 | 26 | 2 | 253 | 16 | 11 | 7 | 0 |
| SQL | 12 | 0 | 2 | 38 | 17 | 0 | 11 | 323 | 103 | 66 | 0 |
| SQS | 0 | 0 | 0 | 7 | 26 | 4 | 13 | 75 | 75 | 1 | 0 |
| TMP | 6 | 0 | 1 | 22 | 2 | 1 | 17 | 24 | 4 | 227 | 0 |
| TRR | 0 | 0 | 0 | 0 | 0 | 0 | 0 | 1 | 1 | 0 | 4 |
The confusion matrix over the full data set conditions, including all call types with all overlapping and noisy calls, are shown in
Table 1. The overall accuracy for the full set is 60.1%. The pattern shown by the confusion matrix indicates that a significant number of the errors are made between highly confusable call types and between basic call types and their corresponding call-combinations. By roughly ordering the columns according to confusability between calls, similarity can be observed by looking along the diagonal for blocks with significant error rates. Some of these patterns are highlighted in the confusion matrix for reference. Similarity between RRM (Roar-Rumble) and RUM (Rumble) and to a lesser extent ROR (Roar) is noted, as well as substantial similarity between SQS (Squeak-Squeal) and SQL (Squeal). These similarities are expected because combination calls are made up of the basic call types with which they are confused, and the error patterns help confirm the repertoire categories.
More accurate classification is possible by including only the basic call types, and by excluding calls with high noise degradation and calls that overlap with other calls or sporadic sounds. This improvement is shown in
Table 2, where the accuracy for a 12 state HMM classifier with three Gaussian mixtures is 85.0%, across 186 clean vocalizations.
Table 2.
Call type classification accuracy over reduced-set clean Asian Elephant data. Overall accuracy is 85.0% (vs. chance accuracy 32.8%).
Table 2.
Call type classification accuracy over reduced-set clean Asian Elephant data. Overall accuracy is 85.0% (vs. chance accuracy 32.8%).
| | Classification |
|---|
| BRK | ROR | RUM | SQK | SQL | TMP |
|---|
| Label | BRK | 15 | 0 | 0 | 0 | 4 | 3 |
| ROR | 3 | 22 | 0 | 0 | 1 | 0 |
| RUM | 1 | 2 | 4 | 0 | 0 | 1 |
| SQK | 0 | 0 | 0 | 60 | 1 | 0 |
| SQL | 0 | 1 | 0 | 1 | 26 | 2 |
| TMP | 0 | 2 | 0 | 3 | 3 | 31 |
3.2. Ortolan Bunting (Emberiza Hortulana): Syllable, Song Variant, and Song Type Classification
The ortolan bunting is an endangered migratory passerine distributed from Western Europe to Mongolia [
42], which has undergone a major population decline in recent years [
43,
44]. This bird vocalizes in a range between 1.9 kHz and 6.7 kHz and has a relatively simple song and a repertoire size that varies between just a few songs per individual to as many as 24 [
45]. The ortolan bunting vocalizations examined for this study were collected from County Hedmark, Norway in May of 2001 and 2002 [
46]. The male vocalizations were recorded on 11 out of 25 sites within an area of about 500 km
2. The total number of males in the covered area during 2001 and 2002 was approximately 150. As described by Osiejuk [
46], these ortolan vocalizations were recorded between 04:00 and 11:00 am with a professional DAT recorder at the sampling rate of 48 kHz.
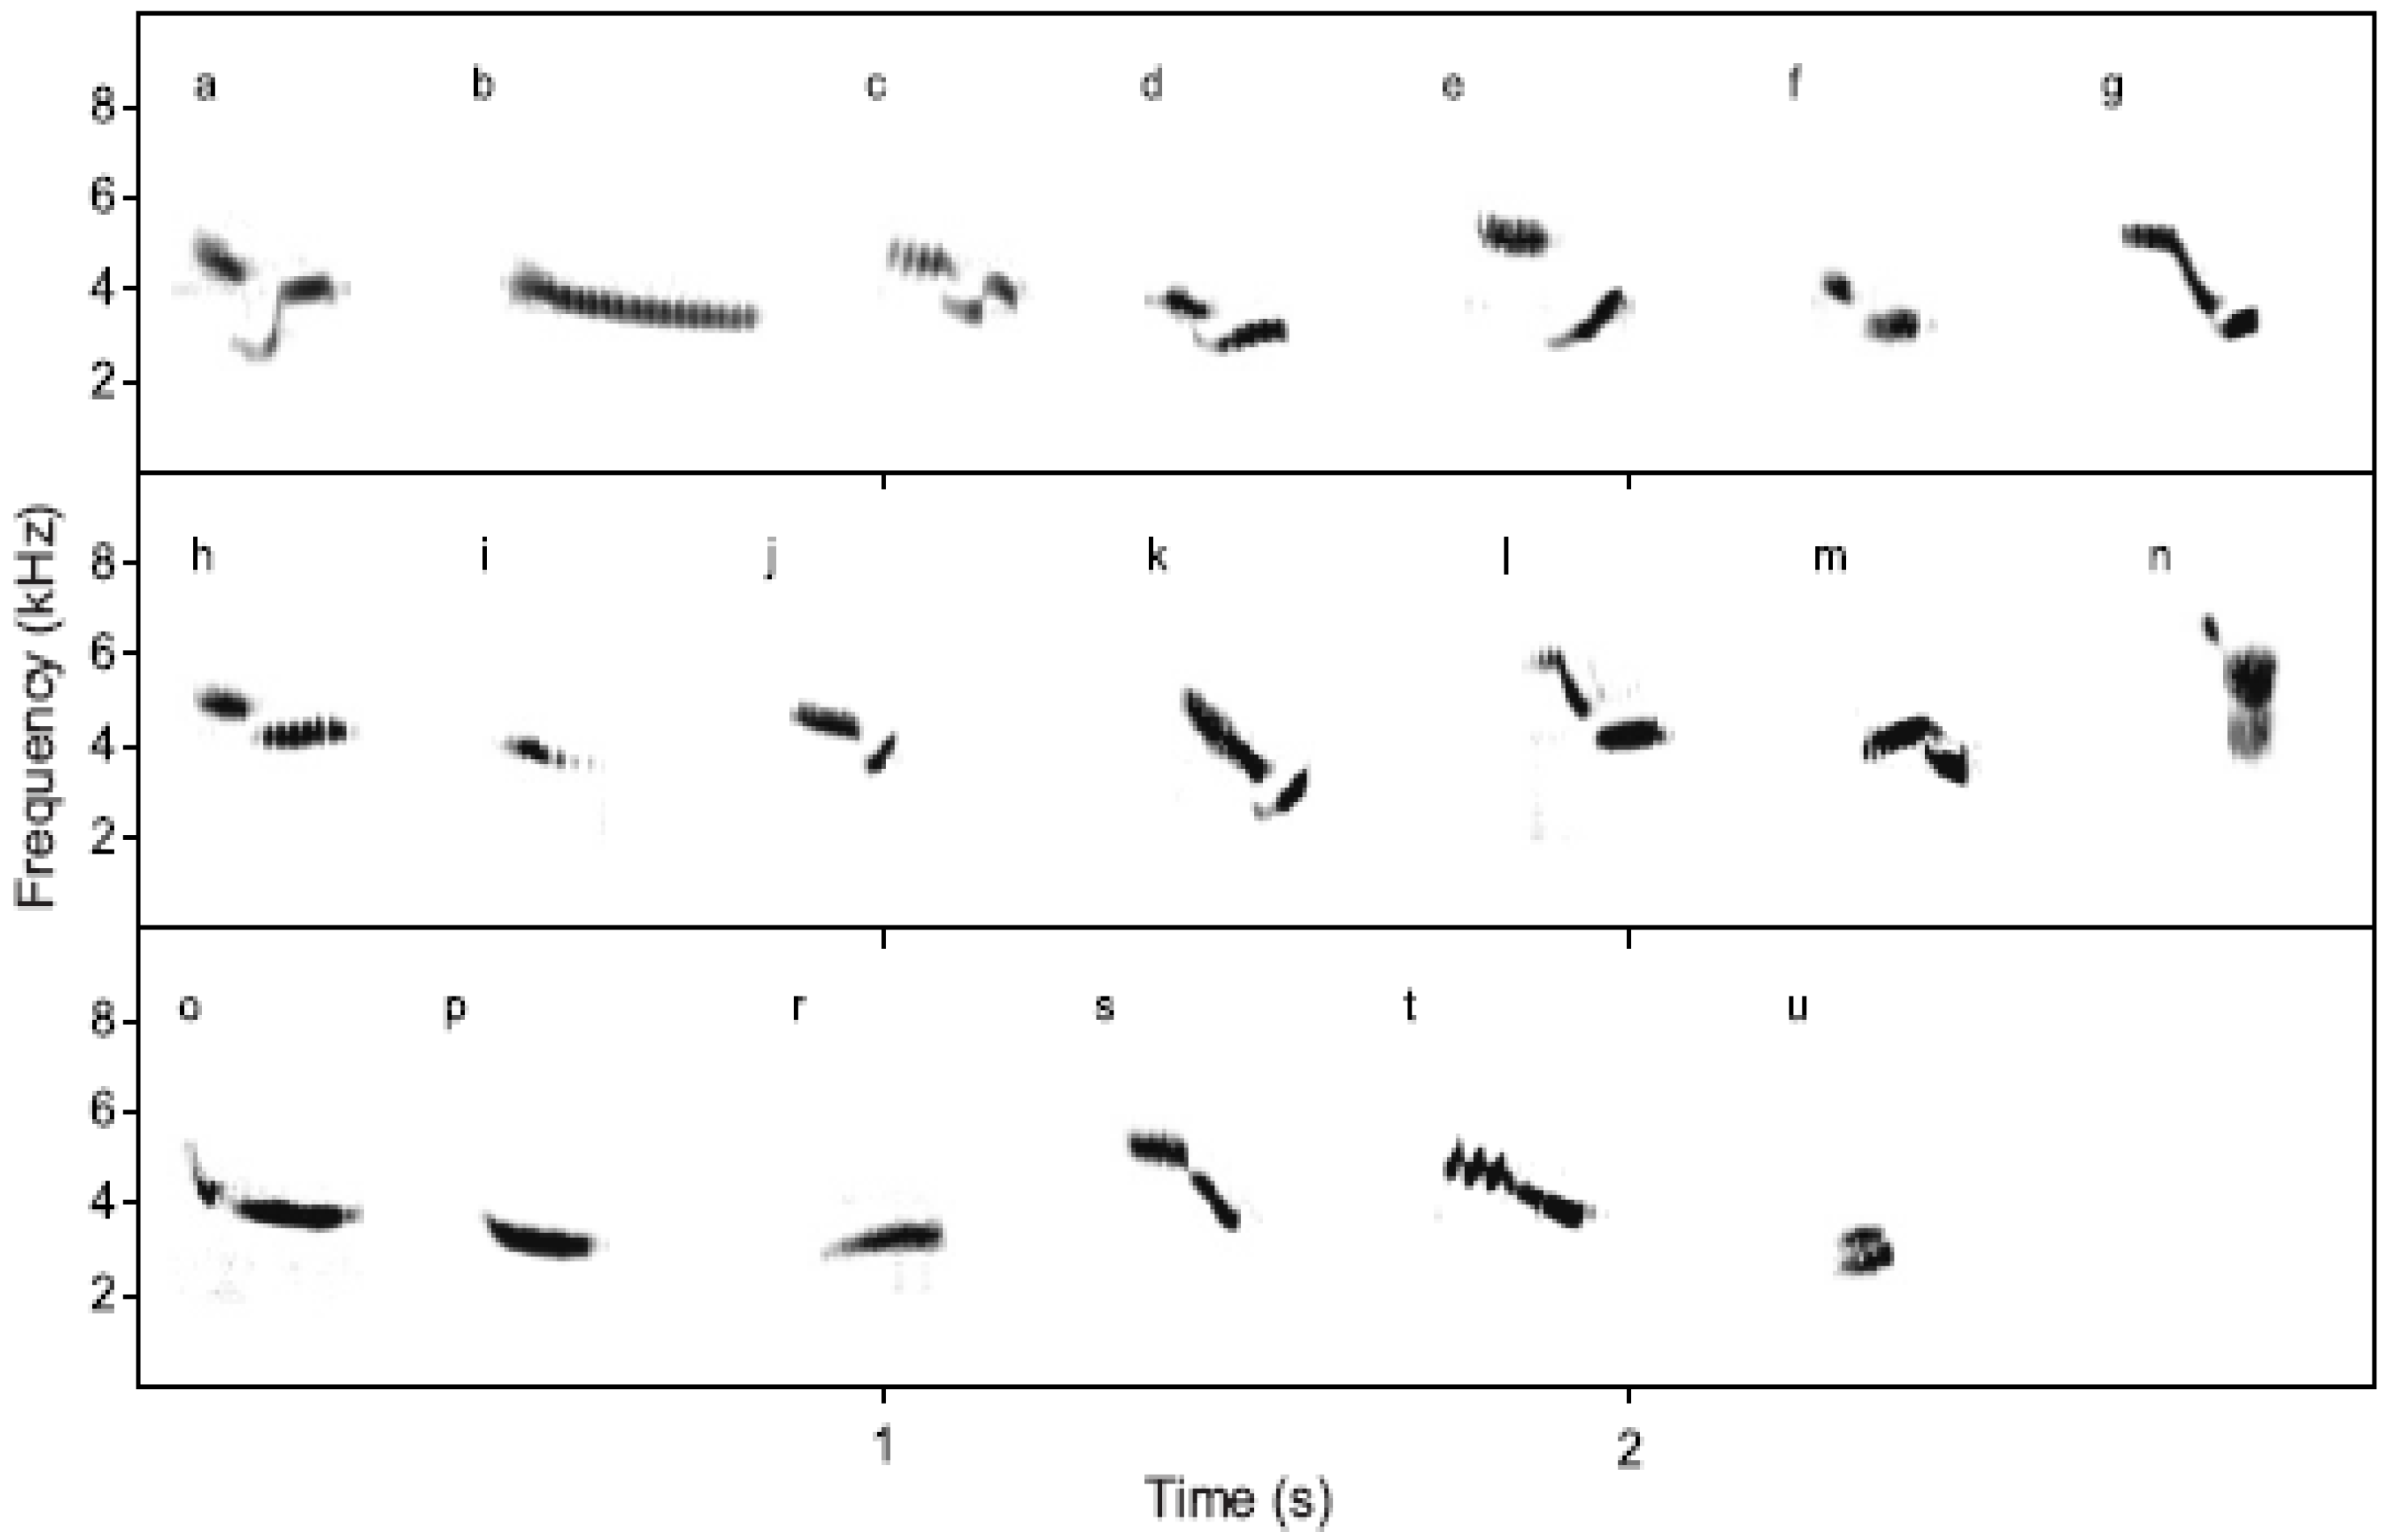
Songs of ortolan buntings are composed of base units referred to as syllables. Each syllable is described using letter notation, as illustrated in
Figure 4. Songs are categorized by song type, defined according to the general type of syllable pattern, and further into specific song variants, defined by exact repetition pattern. For example, common song types include
ab,
cd, and
huf, with common song variants such as
aaaab,
aaaaabb,
cccd, and
hhhhuff. Although individual examples of syllables differ in length and frequency across individuals, they maintain the same sonogram shape and underlying temporal pattern.
Figure 4.
Ortolan bunting syllables (from [
46]).
Figure 4.
Ortolan bunting syllables (from [
46]).
This study focuses on automatic song classification in the ortolan bunting. Modeling is done at the syllable level, so that each syllable type has a corresponding HMM, and then classifying into a syllable sequence to match individual songs with a specific song type and song variant.
To evaluate classification accuracy using HMMs, a subset of 10 frequently produced call types is used, with 25 calls in each type used for training and 25 for testing, and data across multiple individuals included in both the training and test sets. The call types selected include ab, cb, cd, eb, ef, gb, guf, h, huf, and jufb, which consist of the ten common syllables a, b, c, d, e, f, g, h, j, and u. In addition a silence model is trained to represent beginning and ending silence and pauses between syllables.
Due to substantial recording noise, all waveforms are enhanced using simple band-pass filtering to eliminate noise outside the active vocalization range (2,500 to 7,500 Hz) of these calls, followed by Ephraim-Malah filtering [
18], a statistical signal enhancement method common in human speech processing applications. Analysis is then done using Hamming windows with a window size of 5 ms with 2.5 ms overlap, accounting for the much faster temporal patterns present in the bunting vocalizations as compared to the Asian elephants. Features for classification are the same 39 element GFCC feature vector described previously for the Asian elephant data, with a few minor differences. The main difference is that the lower and upper frequency limits of the Greenwood function used for frequency warping are adjusted to 2,500 and 7,500 Hz, respectively, to represent the frequency range of these calls. In addition, a simple baseline curve normalization is added to the log energy feature. This consists of performing a second order polynomial fit to the log energy curve for each song, then subtracting the baseline curve from the log energy on a per-frame basis. This is done because the amplitude of the individual syllables is commonly the loudest in the middle portion of calls, and the normalization compensates for the longer-term amplitude changes while still allowing shorter-term signal amplitude modulations to be represented by the energy feature and thus used for classification.
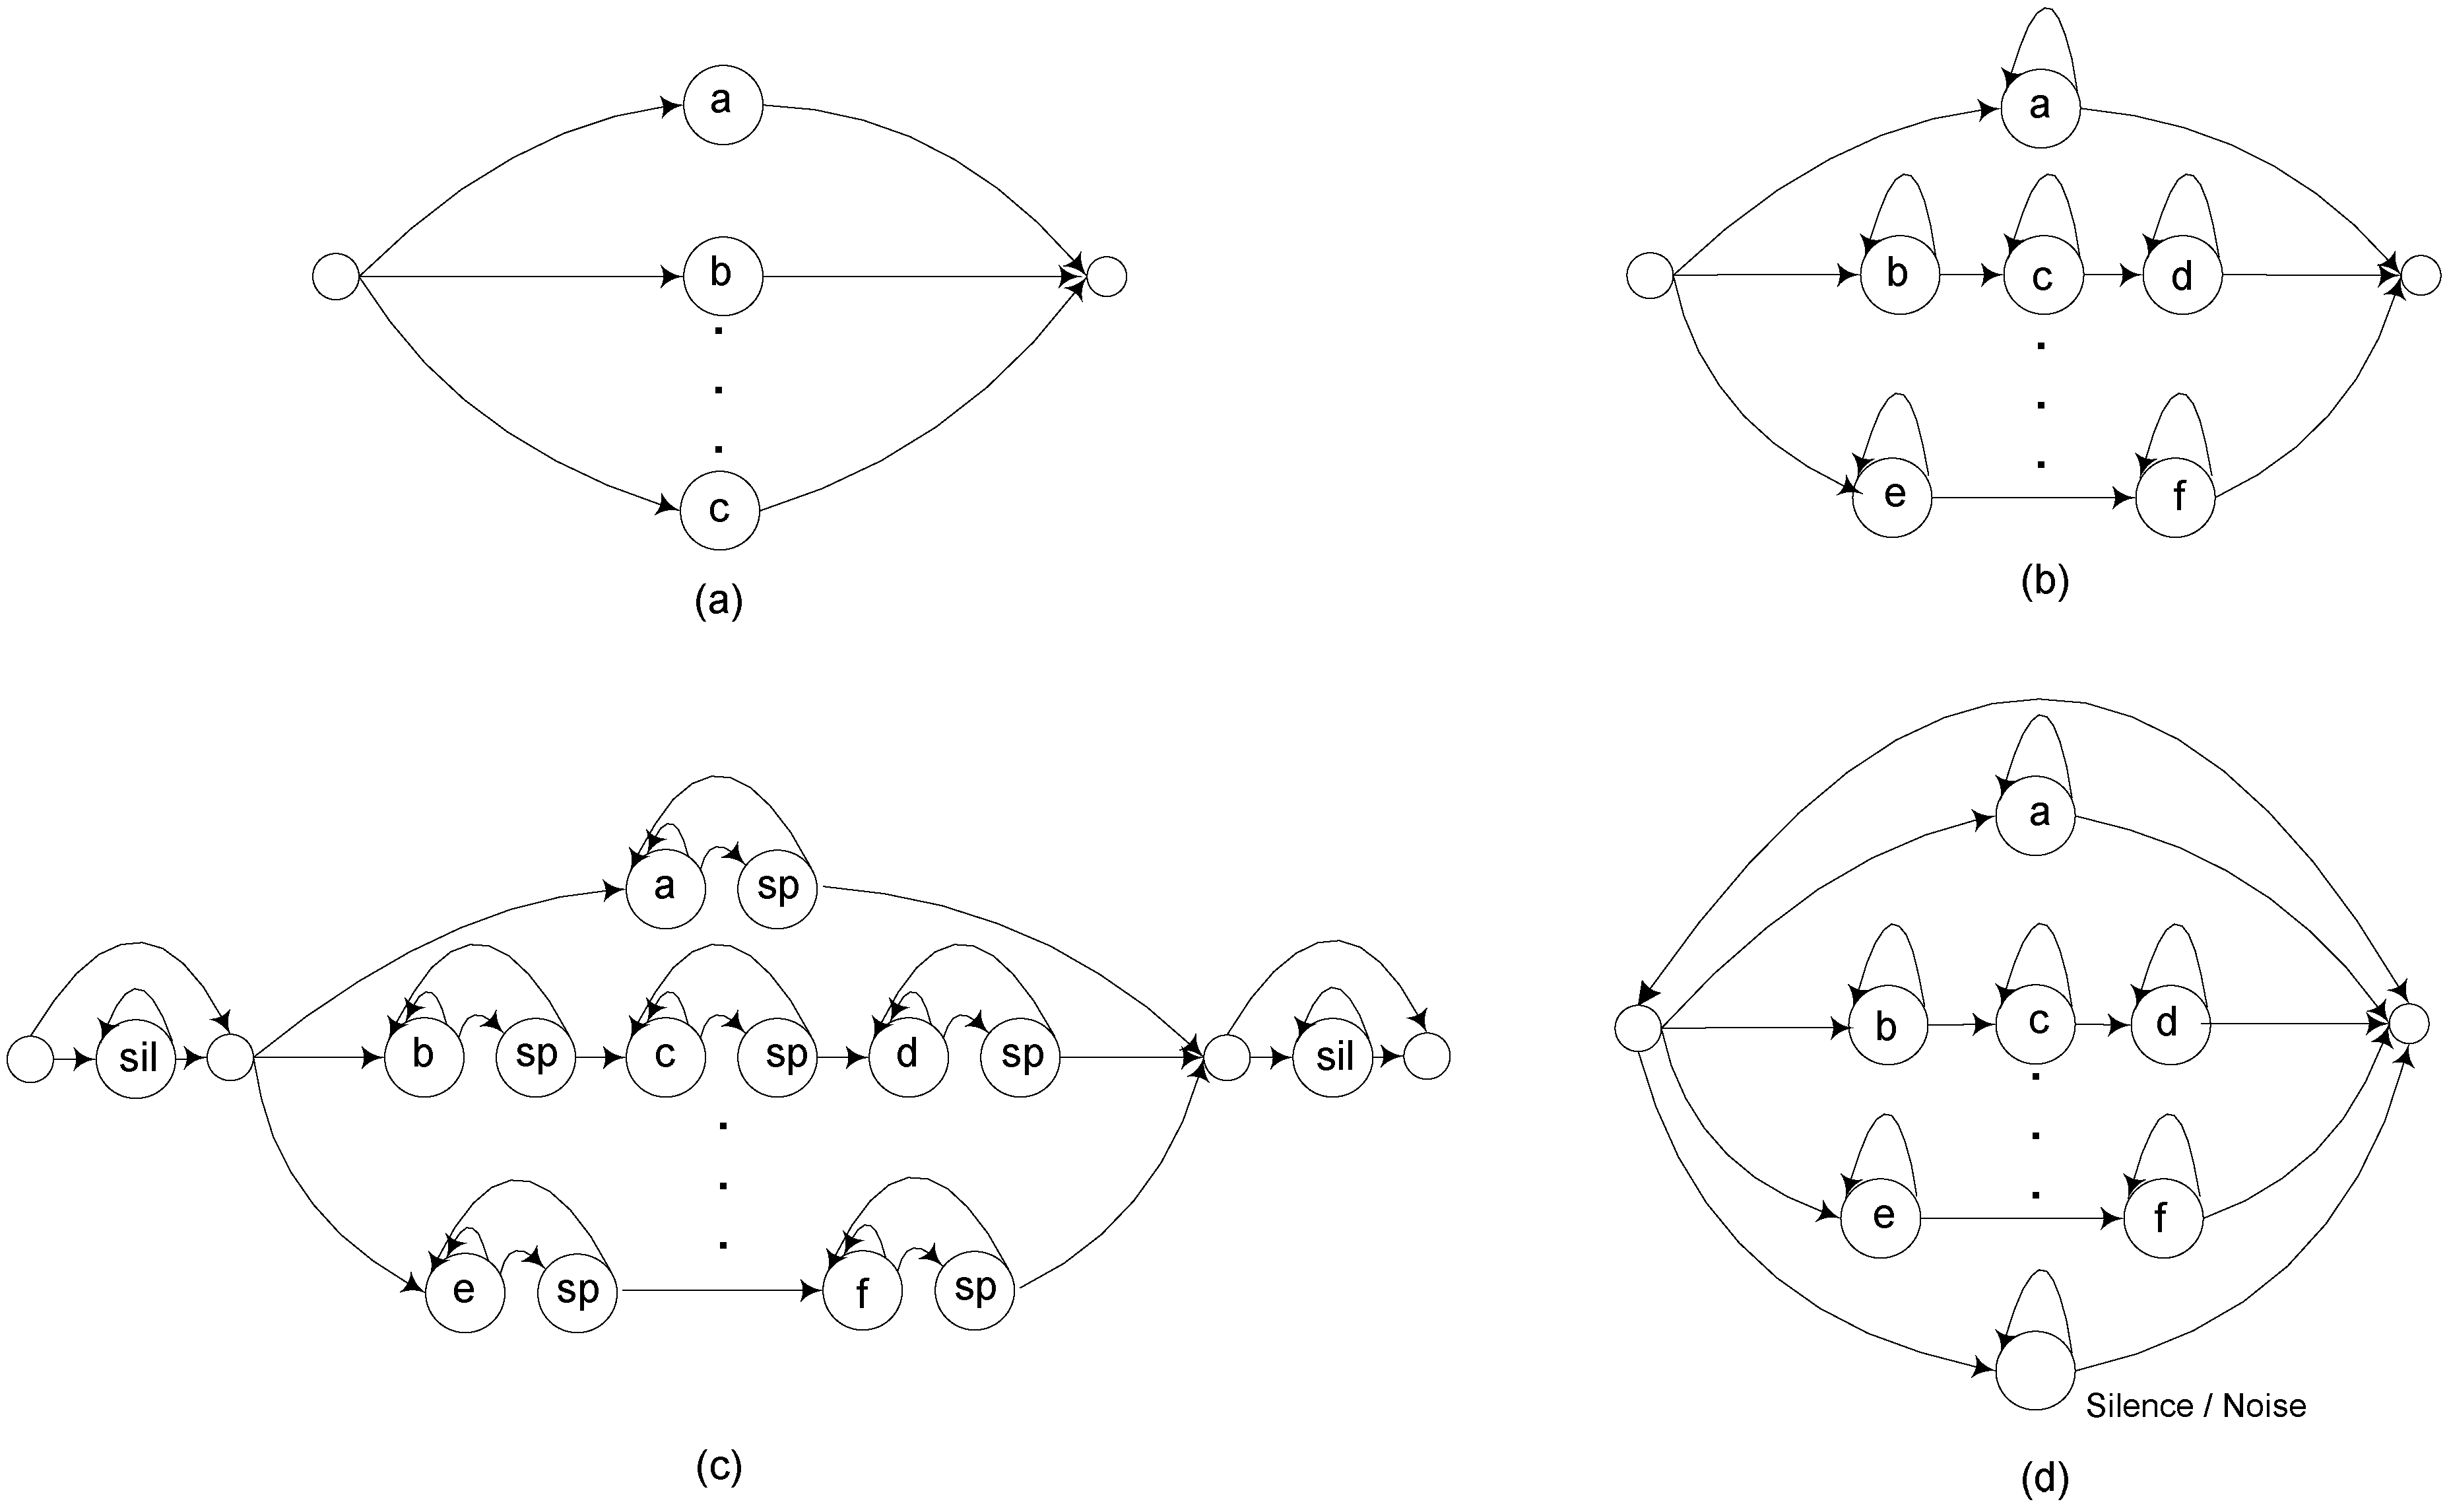
Each syllable model consists of a 15 emitting state HMM with a single Gaussian, designed to track the time-evolution of each syllable’s frequency pattern. Multiple Gaussian mixtures are not necessary because of the simplicity of the frequency characteristics along each step in the time-frequency pattern. Recognition is implemented using a constrained language model describing the allowable song patterns, as illustrated previously in
Figure 3.
Classification is evaluated in terms of song-type accuracy, syllable accuracy, and song-variant accuracy. Song-type and song-variant accuracy can be computed directly as the percent of songs with the correct classification. However, since there are multiple syllables in each song, syllable accuracy requires a detailed alignment process, where the recognized song is aligned against the correct song transcription and a dynamic programming method is used to determine the minimal number of insertions, deletions, and substitutions differentiating the recognized song or correct song [
23]. Final results are shown in
Table 3 below. In addition,
Table 4 shows the increase in syllable accuracy as the various system improvements described above are added sequentially, including language modeling constraints, feature normalization and signal enhancement, short pause models between syllables, and energy normalization. It can be seen that language model constraints, feature normalization (which reduces individual vocal variability), and front-end signal enhancement each make very substantial contributions to accuracy improvement.
Table 3.
Song type, syllable, and song variant classification accuracy for overall system.
Table 3.
Song type, syllable, and song variant classification accuracy for overall system.
| Measure | Accuracy |
|---|
| Song Type | 100% |
| Syllable | 97.5% |
| Song Variant | 77.6% |
Table 4.
Increase in accuracy due to sequential system improvements. Constrained Recognition Network (CRN) refers to the song-type language model of
Figure 3b. Cepstral Mean Subtraction (CMS) is feature normalization as described in
Section 2.2. Signal Enhancement (SE) is Bandpass plus Ephraim-Malah filtering as described above. Short Pause (SP) is the song-type language model of
Figure 3c, and Energy normalization (EN) is baseline curve energy normalization as described above.
Table 4.
Increase in accuracy due to sequential system improvements. Constrained Recognition Network (CRN) refers to the song-type language model of Figure 3b. Cepstral Mean Subtraction (CMS) is feature normalization as described in Section 2.2. Signal Enhancement (SE) is Bandpass plus Ephraim-Malah filtering as described above. Short Pause (SP) is the song-type language model of Figure 3c, and Energy normalization (EN) is baseline curve energy normalization as described above.
| Methodology (15 state HMMs with 1 Gaussian) | SyllableAccuracy |
|---|
| Baseline 39 element feature vector | 61.0% |
| Baseline + CRN (Constrained Recognition Network ) | 74.0% |
| Baseline + CMS (Cepstral Mean Subtraction) | 88.0% |
| Baseline + CRN +CMS + SE (Signal Enhancement) | 95.9% |
| Baseline + CRN + CMS + SE + SP (Short Pause) | 96.7% |
| Baseline + CRN + CMS + SE + SP + EN (Energy Normalization) | 97.5% |
3.3. Chicken (Gallus Domesticus): Age-Dependent Stress Condition Classification
Maintaining low-stress living conditions is extremely important to the care of domesticated poultry used for agricultural food production. However, currently the only clinical tool for directly measuring stress levels requires measuring hormonal indicators in blood samples, which itself stresses the animals. This study is focused on investigating the correlation between vocalization patterns in agricultural chickens and various stress stimuli in this environment, for the purpose of assessing whether vocalizations could be reliably used as a stress indicator. Two separate stress-related task experiments are implemented, one focused on directly detecting living condition stress in vocalizations and one focused on evaluating the connection among stress induced by human presence, diet and age.
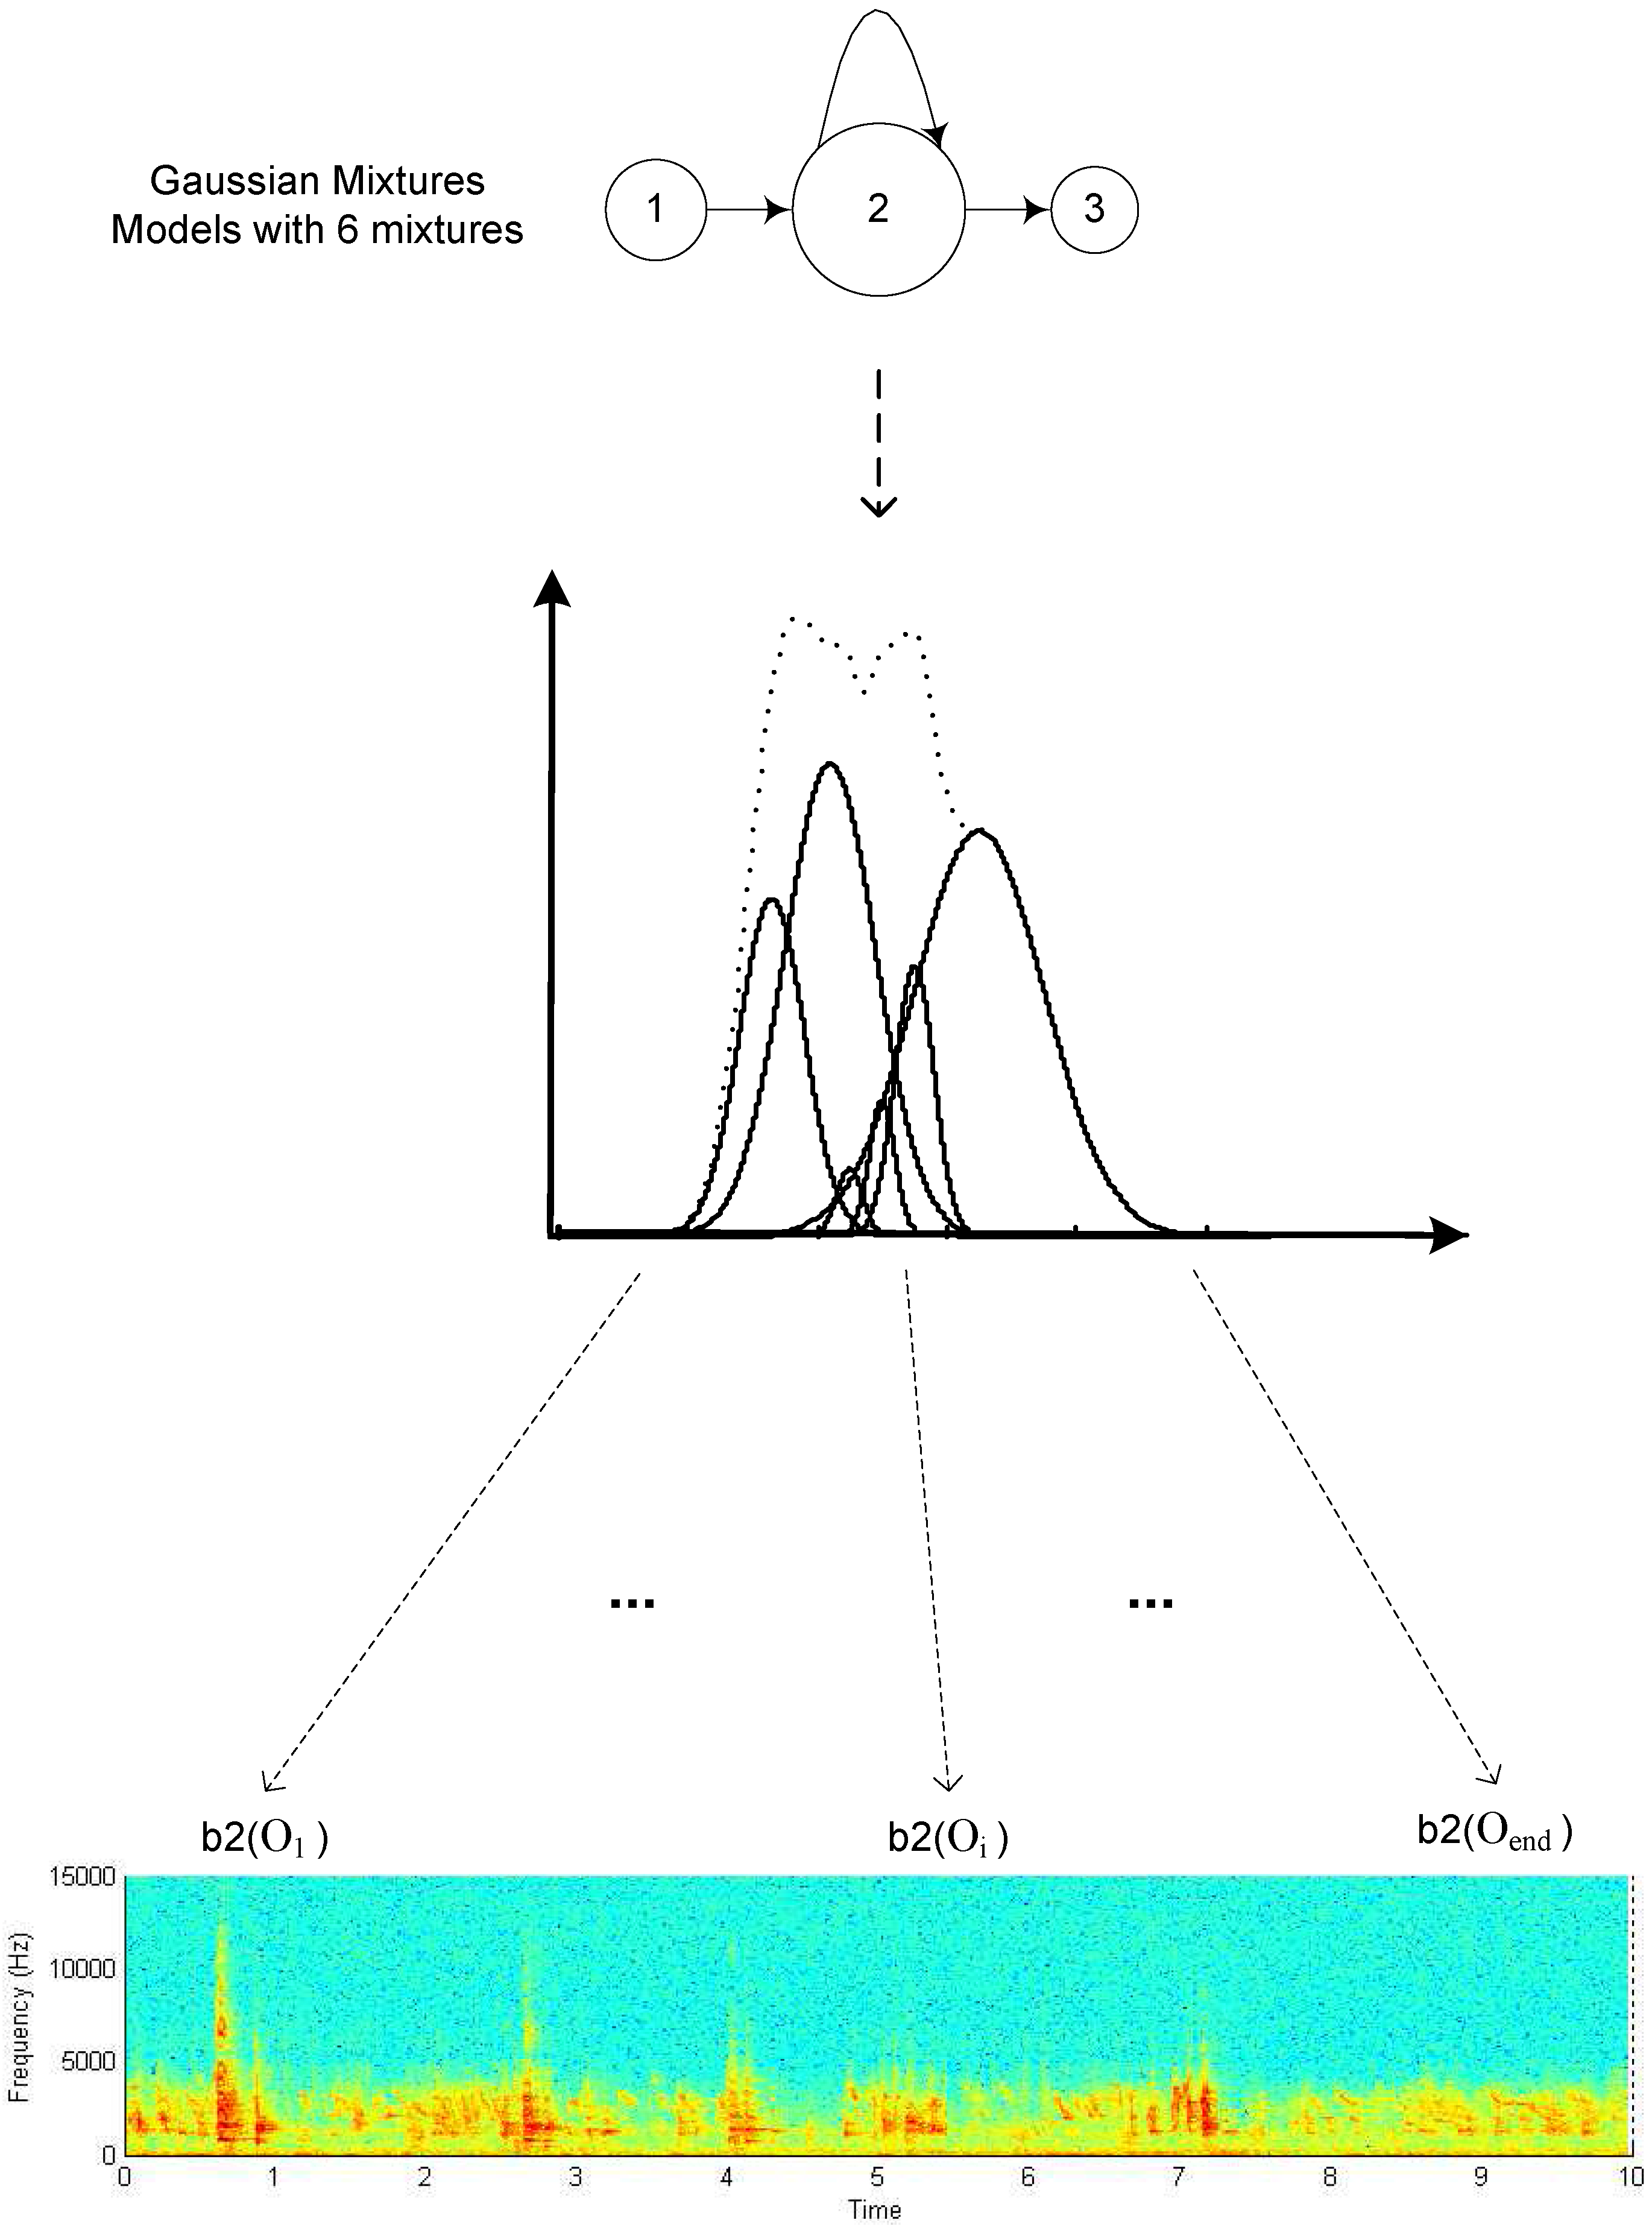
Vocalizations were collected at the University of Connecticut Poultry Barn, which houses 25 animals. A stationary microphone to which the animals were accustomed was used. Long (multiple-minute) DAT recordings at a 44.1 kHz sampling rate were made after acclimatization to each condition under test, and then divided into 10 second duration segments for analysis and classification. The vocalizations used in these experiments vary from previous studies in that there are large numbers of individuals vocalizing simultaneously, so that individual vocalizations cannot be separated and there is no discernible time patterning. This is accommodated within the HMM framework by reducing the number of states to 1 because there is no time sequence to be modeled, and increasing the number of mixtures to 12 to get a finer resolution discrimination in terms of overall spectral characteristics across the population. Thus, the classification method is spectral as opposed to sequential, and the HMM approach becomes equivalent to a much simpler GMM statistical classifier.
Feature extraction is again similar to that of the previous tasks, using a base 39-element GFCC feature vector, with Hamming frames of 25 ms each, frame overlap of 15 ms, and 26 filter banks for analysis. The lower and upper frequency limits are set to 125 Hz and 2,000 Hz [
47], respectively, based on the approximate hearing range. However, the log energy coefficient is not included since there is no need for a loudness pattern due to the non-temporal model, and to avoid any bias that might be introduced by overall vocalization amplitude in different conditions,
3.3.1. Age dependent living condition detection
The goal of the first task is age-dependent living condition classification. Newly hatched chicks were recorded at the ages of 1, 2 and 3 months, in six different stress factor conditions. These conditions include: No stimulus (Control), Heat (H), Human Presence (HP), Heat + Human Presence (H + HP), Crowding (C), Heat + Crowding (H + C). The baseline Control condition was without any humans present and an ambient temperature of 60 degrees Fahrenheit, the Heat condition was conducted at an ambient temperature of 100 degrees Fahrenheit, the Human Presence condition was conducted with one individual present in the barn, and the Crowding condition was conducted with space per chicken reduced by 1/3 over standard recommended conditions. A total of 1,355 vocalization segments were recorded across the three age groups and six conditions.
Classification is run over each age category separately using 10-fold cross validation. An example confusion matrix for the 3 month old data subset is shown in
Table 6, and overall accuracies are given in
Table 5. Chance accuracy in all cases is between 25−35%. The results suggest that vocalizations are affected by condition and also that vocal production patterns become more consistent over time. It can be seen that, as might be expected, the highest confusion is between conditions with overlapping stimuli, for example Heat
vs. Heat + Human Presence
vs. Heat + Crowding. Accuracy between the disjoint stimuli Heat, Human Presence, and Crowding is much higher.
Table 5.
Sample condition classification confusion matrix, for 3 month old age group. Accuracy 72.4% (vs. chance accuracy 25.3%).
Table 5.
Sample condition classification confusion matrix, for 3 month old age group. Accuracy 72.4% (vs. chance accuracy 25.3%).
| | Classification |
|---|
| Control | H | HP | H + HP | C | H + C |
|---|
| Label | Control | 97 | 0 | 2 | 0 | 0 | 0 |
| H | 0 | 39 | 7 | 12 | 7 | 0 |
| HP | 5 | 1 | 70 | 0 | 20 | 0 |
| H + HP | 0 | 12 | 0 | 24 | 0 | 6 |
| C | 7 | 2 | 2 | 0 | 34 | 1 |
| H + C | 3 | 1 | 0 | 11 | 9 | 19 |
Table 6.
Overall 6 condition classification accuracy for 1, 2, and 3 month old age groups.
Table 6.
Overall 6 condition classification accuracy for 1, 2, and 3 month old age groups.
| | Accuracy |
|---|
| 1 month | 60.5% |
| 2 months | 62.0% |
| 3 months | 72.4% |
To examine the change in vocalization patterns as a function of age, a cross testing experiment is done by training and testing on disjoint age groups. An example of these results, training on one month old data and testing on two and three month old data, is shown in
Table 7. Accuracy drops in proportion to age differences between training and test set conditions, dropping from 60.5% within the same age group (from
Table 6), to 49.1% on 2 month olds (a one month age differential), to 34.9% on 3 months (a two month age differential).
Table 7.
Accuracy of 2 and 3 month old chick vocalizations using models trained on 1 month old data.
Table 7.
Accuracy of 2 and 3 month old chick vocalizations using models trained on 1 month old data.
| | Accuracy |
|---|
| 2 months | 49.1% |
| 3 months | 34.9% |
3.3.2. Stress and Diet detection
A second study on poultry vocalizations is also implemented, focused on determining whether vocalization patterns could be used to differentiate dietary conditions (meat vs. vegetable fed), stress vs. nonstress conditions (human presence being the stress stimulus), and age of the animals (young, 0–4 weeks, vs. mature, 5−6 weeks).
Results for stress classification are shown in
Table 8. All accuracies are above 90%, and indicate that within these conditions, human presence stress is relatively easy to detect. The slightly higher accuracy for mature vocalizations may be simply correlated with age, in that vocalization patterns tend to be more stable and established in older individuals, or may be due to learned reactions or preferences.
Table 8.
Stress (S) vs. Nonstress (NS) classification as a function of age and diet conditions.
Table 8.
Stress (S) vs. Nonstress (NS) classification as a function of age and diet conditions.
| Meat fed 0–4 weeks old 98.6% | Classification | | Veg fed 0–4 weeks old 94.40% | Classification |
| NS | S | | NS | S |
| Label | NS | 176 | 0 | | Label | NS | 224 | 1 |
| S | 5 | 190 | | S | 22 | 164 |
| | | | | | | | |
| Meat fed 5–6 weeks old 100% | Classification | | Veg fed 5–6 weeks old 98.9% | Classification |
| NS | S | | NS | S |
| Label | NS | 72 | 0 | | Label | NS | 92 | 0 |
| S | 0 | 89 | | S | 2 | 82 |
Table 9.
Meat vs. Vegetarian diet classification as a function of age and stress conditions.
Table 9.
Meat vs. Vegetarian diet classification as a function of age and stress conditions.
| Nonstress 0–4 weeks old 61.6% | Classification | | Stress 0–4 weeks old 69.6% | Classification |
| Meat | Veg | | Meat | Veg |
| Label | Meat | 157 | 140 | | Label | Meat | 128 | 46 |
| Veg | 24 | 106 | | Veg | 62 | 119 |
| | | | | | | | |
| Nonstress 5–6 weeks old 89.2% | Classification | | Stress 5–6 weeks old 78.4% | Classification |
| Meat | Veg | | Meat | Veg |
| Label | Meat | 63 | 9 | | Label | Meat | 71 | 19 |
| Veg | 9 | 85 | | Veg | 18 | 63 |
In comparison, determining whether or not diet has impact on vocalization patterns is a much more difficult classification task.
Table 9 presents the results on this question. The main observation is that diet does impact vocalization patterns with accuracies high enough to confirm significance in all cases. Additionally, it can be seen that the nonstressed condition vocalizations are much easier to discriminate than the stress condition vocalizations, and that more mature animals are easier to differentiate than young animals. This indicates that diet-related vocalization differences are diminished by stress but increase with age. Maximum accuracy, for mature animals in the nonstressed condition, are relatively easy to discriminate on the basis of diet, at 89.2%. Looking comprehensively at all the poultry experiments, the main overall conclusion is that while vocalization patterns increase in consistency and differentiability with age, stress conditions can be differentiated across all age levels.


