Communication

Three-Dimensional Landscape Visualizations: New Technique towards Wildfire and Forest Bark Beetle Management

1
Department of Forestry and Natural Resources, Clemson University, Clemson, SC 29634, USA
2
Department of Forestry and Natural Resources, Belle W. Baruch Institute of Coastal Ecology and Forest Science, Clemson University, P.O. Box 596, Georgetown, SC 29442, USA
3
Department of Entomology, Soils, and Plants Sciences, Clemson University, Clemson, SC 29634, USA
*
Author to whom correspondence should be addressed.
Forests 2010, 1(2), 82-98; https://doi.org/10.3390/f1020082
Submission received: 12 February 2010 / Revised: 2 April 2010 / Accepted: 12 April 2010 / Published: 19 April 2010

Abstract

:
After a century of fire exclusion, western US forests are vulnerable to wildfire and bark beetles. Although integrated fire and pest management programs (e.g., prescribed burning and thinning) are being implemented efficiently, damage to forests continues. Management challenges come in the forms of diverse land ownership, dynamic forest landscapes, the uncertainty effect of management strategies, and social interaction of the increasing wildland-urban interface. Three-dimensional (3-D) landscape visualization is comprised of multi-spatial, multi-temporal, and multi-expression elements. Supplemented with GIS database, remote sensing images, and simulation models, this technique can provide a comprehensive communication medium for decision makers, scientists, stakeholders, and the public with diverse backgrounds on the wildfire and forest bark beetle management. The technique we describe here can be used to organize complicated temporal and spatial information, evaluate alternative management operations, and improve decision-making processes. The application and limitations of our technique are also discussed.

1. Introduction

In the western US, a major impact of management for nearly a century had been the attempted exclusion of fire from major forest vegetations [1]. This management approach produced shifts in successional patterns, increased the density of small trees, and resulted in not only the increasingly severe and extensive wildfires, but also the substantially altered forest composition, structure, and vulnerability to damaging insect pests [2].
For wildfire control, the most important strategy is fuel management, which is achieved by modifying the available fuel load to modulate fire behavior and effect [3,4,5]. Mechanical thinning and prescribed burning (alone or in combination) are options available for modifying forest fuel structure and reducing the likelihood of potentially severe wildfires [6,7]. Integrated pest management (IPM) provides methods to reduce bark beetle populations by developing silvicultural techniques to simultaneously decrease the abundance of insect pests, their favored environments, and their most susceptible hosts [3]. Silvicultural procedures (e.g., prescribed burning, stand regeneration, and thinning) are the most efficient methods for preventing bark beetle infestations [8]. Although the US Department of Agriculture, Forest Service, private, and industrial landowners are implementing a number of alternatives (i.e., prescribed burning, thinning, and stand regeneration) to deal with these problems, millions of acres of forests are still impacted by wildfire and bark beetle infestations every year [8,9]. Our objectives here are to (1) identify the challenges of management strategies aimed at addressing wildfire and forest bark beetle damage, (2) illustrate how 3-D landscape visualization responds to these challenges, especially on the facility and application of this 3-D visualization technique to forest management, and (3) supplement the applicability of 3-D visualization with geographic information system (GIS), remote sensing images, and simulation models. In particular, some projected 3-D visualizations are included to demonstrate how this 3-D technique could help improve forest management.

2. Challenges of Wildfire and Bark Beetle Management

2.1. Diverse Land Ownership

Responsibilities for wildfire control and pest detection differ across land ownerships, as do the management objectives and economic resources associated with each [10,11]. It can be particularly difficult to navigate the conflicting interests and discrepancy of perspectives from diverse landowners when attempting to manage forestlands for any purpose.

2.2. Dynamic Forest Landscapes

Pine forests are among the lands most susceptible to wildfire and bark beetle impacts [4,12]. The variance of age-class and size-class distribution and the dynamics of habitat and species composition in regional forest stands make it difficult to detect and estimate infestation areas and spreading patterns of wildfire and bark beetle damage [4,12].

2.3. The Uncertainty Effect of Wildfire and Bark Beetle Strategy

The primary management strategies include prescribed burning and mechanical thinning. However, it is difficult to predict the consequences of management strategies and determine how to efficiently accomplish them [4,13]. It is even more challenging to illustrate the consequences and effect of a specified management operation.

2.4. Social Interaction and the Increasing Wildland-Urban Interface

Currently, diverse opinions exist among Congress, Federal agencies, state and local governments, environmental groups, and commodity groups about what should be done to reduce wildfire and bark beetle damage [14]. In addition, an increasing number of private residences are being built in or adjacent to the forests with severe fire potential [6]. With continued population growth, these wildland-urban interfaces increase the probability of wildfire outbreaks [12]. Therefore, fire safe communities and forest health plans are becoming increasingly popular with the public, and the public can have a powerful influence on strengthening or opposing related forest management policies.
Therefore, these challenges could constrain the decision-making process and implementation of wildfire and bark beetle management because there are (1) different objectives and resources with diverse land ownership, (2) dynamic forest stands that are susceptible to wildfire and bark beetle, (3) complicated and uncertain consequences of wildfire and bark beetle operations, and (4) diverse perspectives in the related and interested public. In the following, a comprehensive and sophisticated communication medium, which is supplemented with GIS database, remote sensing images, and simulation models, will be introduced to improve the consensus among diverse decision makers.

3. Three-Dimensional Landscape Visualizations

Visual images (i.e., pictures) can convey more meaningful and memorable information than the written word, figures, or other types of media [15]. The visual representation of the real world as well as related management alternatives is essential for landscape designers and planners to express and communicate their thoughts, especially on the aesthetic and ecological effects of management strategies [16,17,18]. Over the past 30 years, advances in computer hardware and software have enabled managers and researchers to visualize the complex phenomena and dynamics of natural systems using a more perceptible and comprehensive computer-aided medium [19]. 3-D landscape visualization is one of the most outstanding outcomes from these innovations. It can be used to visualize different management alternatives without temporal and spatial limitations [5,17]. In the following, we describe the characteristics of 3-D landscape visualization for contributing to wildfire and bark beetle management decision-making processes.

3.1. Characteristics of 3-D Landscape Visualization

3.1.1 Multi-spatial

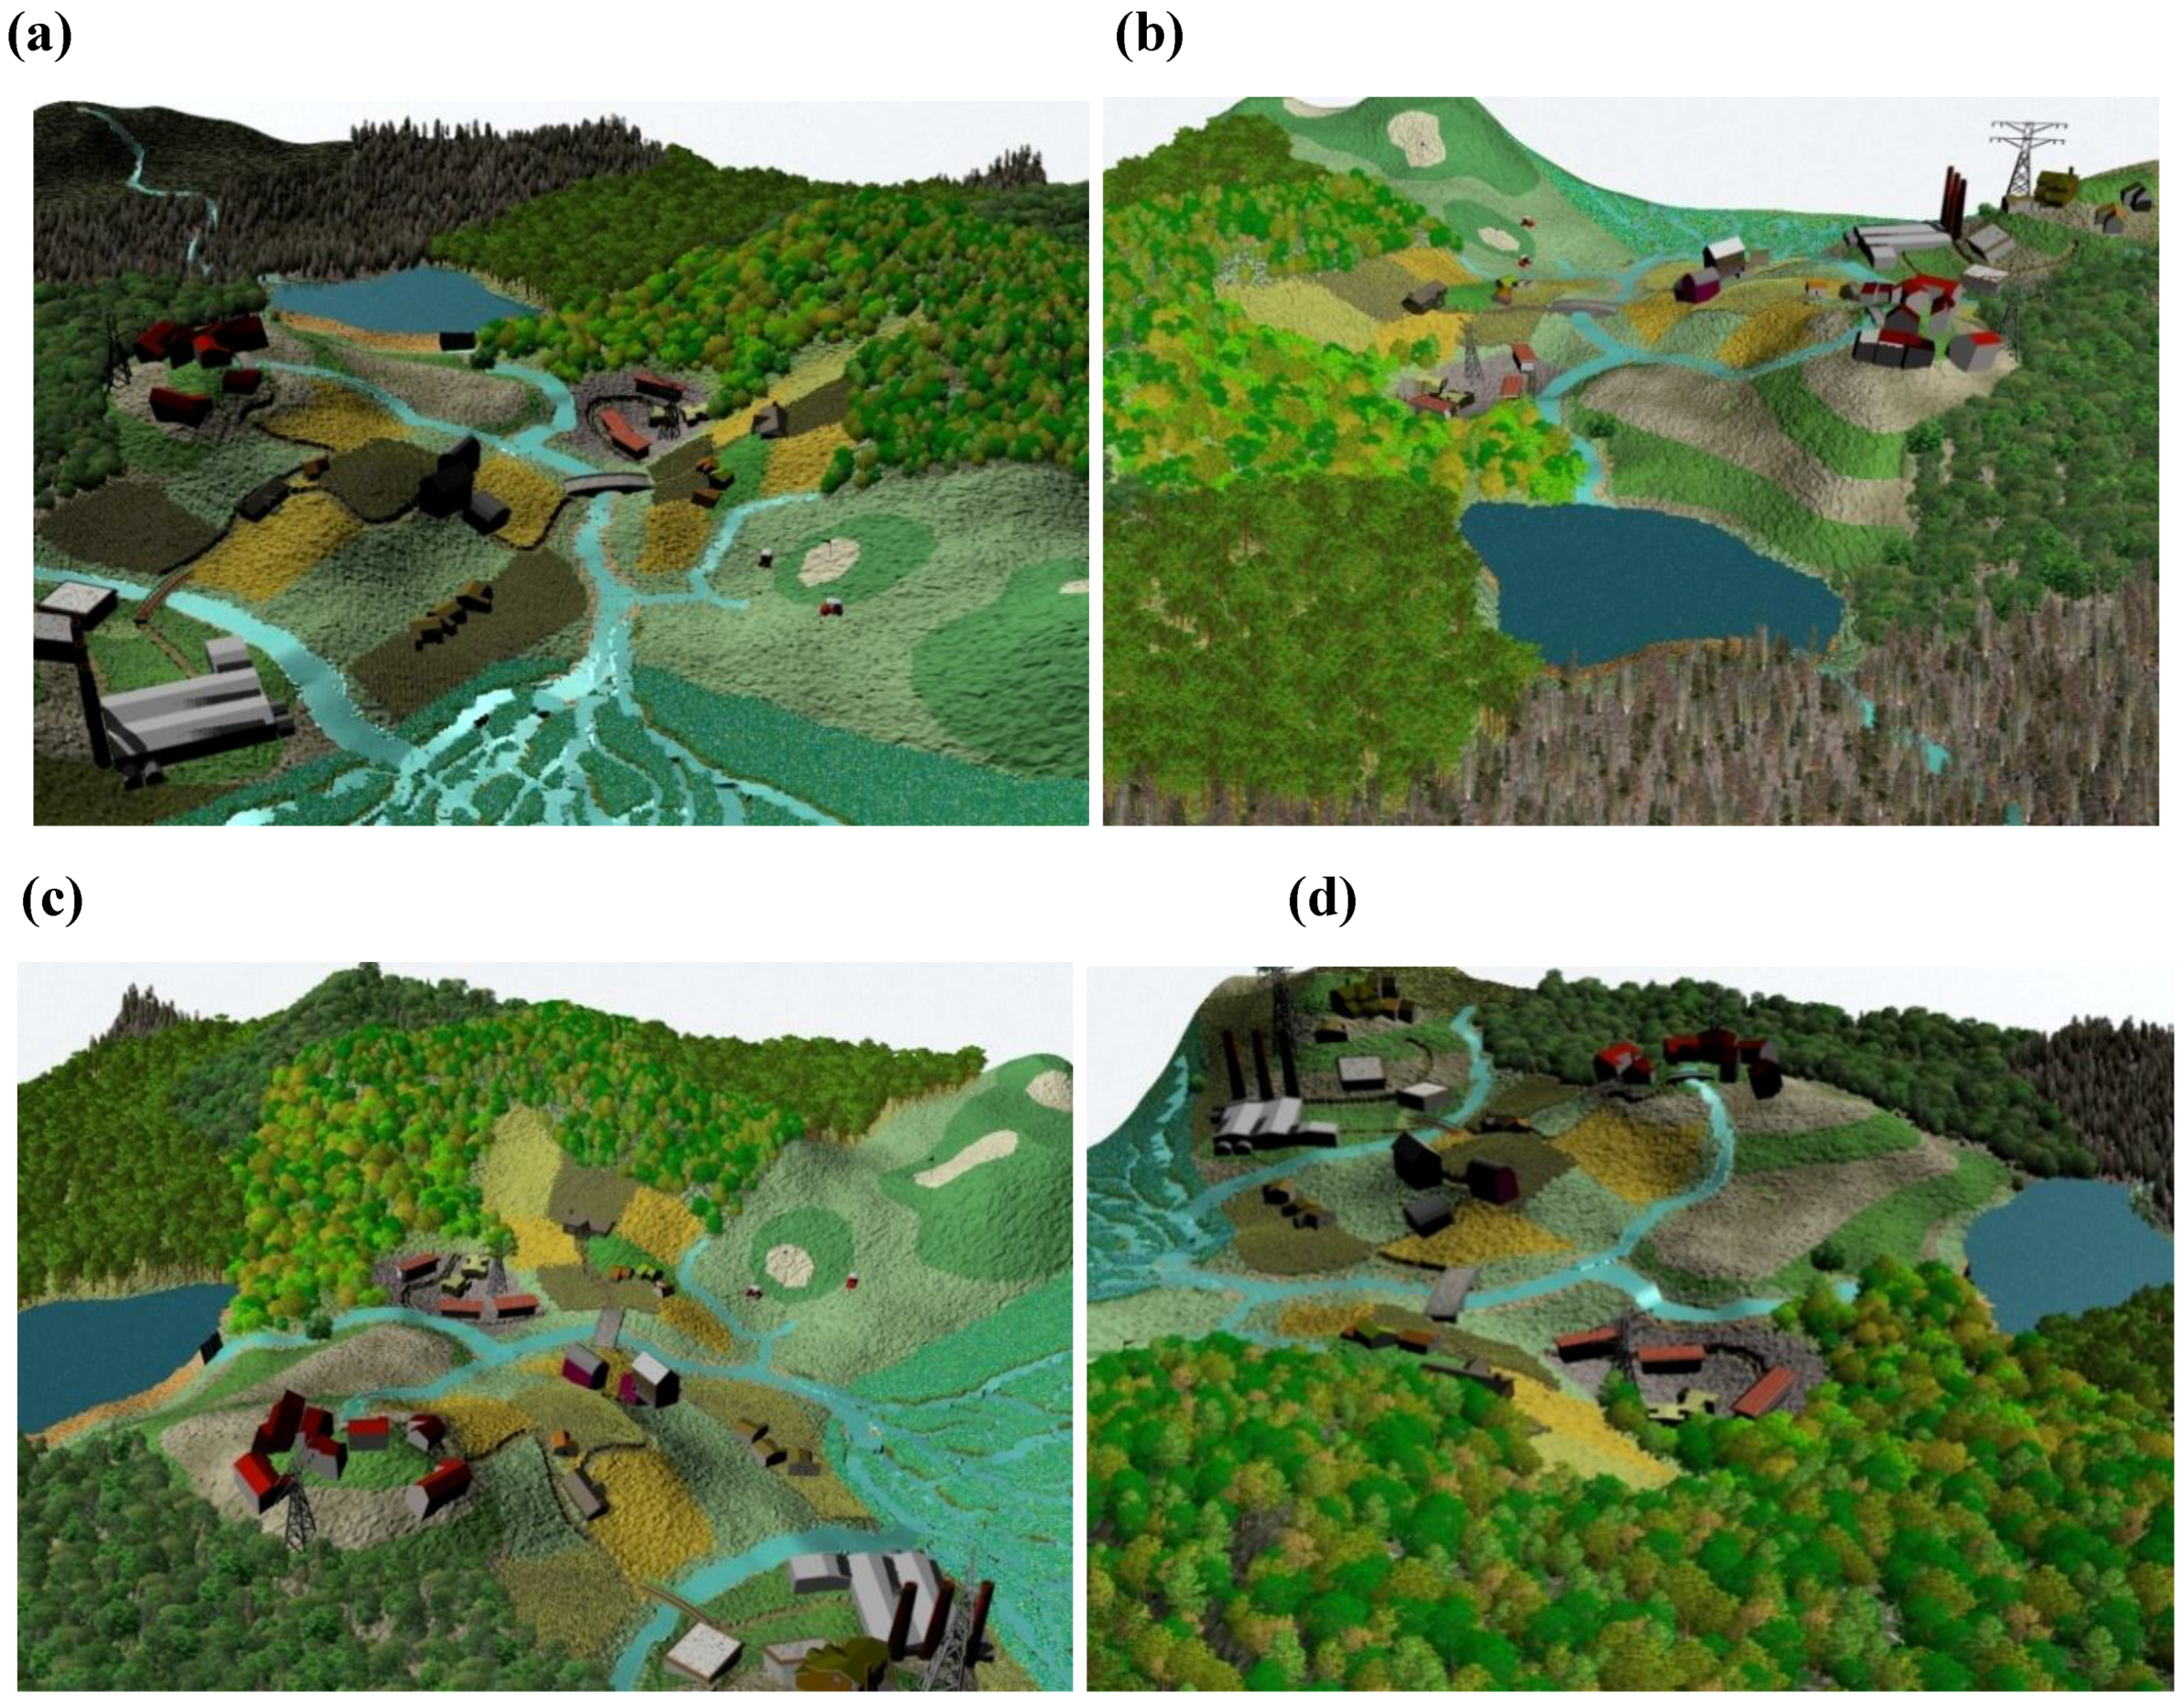
3-D visual simulators allow the flexibility to choose several perspectives in representing forest landscapes (Figure 1). This takes advantage of the tendency of observers to view an area from different directions, locations, and distances [20]. In addition, viewer movement is a normal way of experiencing the forest landscape. Usually, visual landscape simulators use camera position to provide various perspective viewsheds from any point of view [21]. We can therefore assign any specified pathway and duration for the movement of the camera to provide animation by flythrough or walkthrough of the viewshed of interest (http://people.clemson.edu/~cchou/VStream.avi).

3.1.2. Multi-temporal

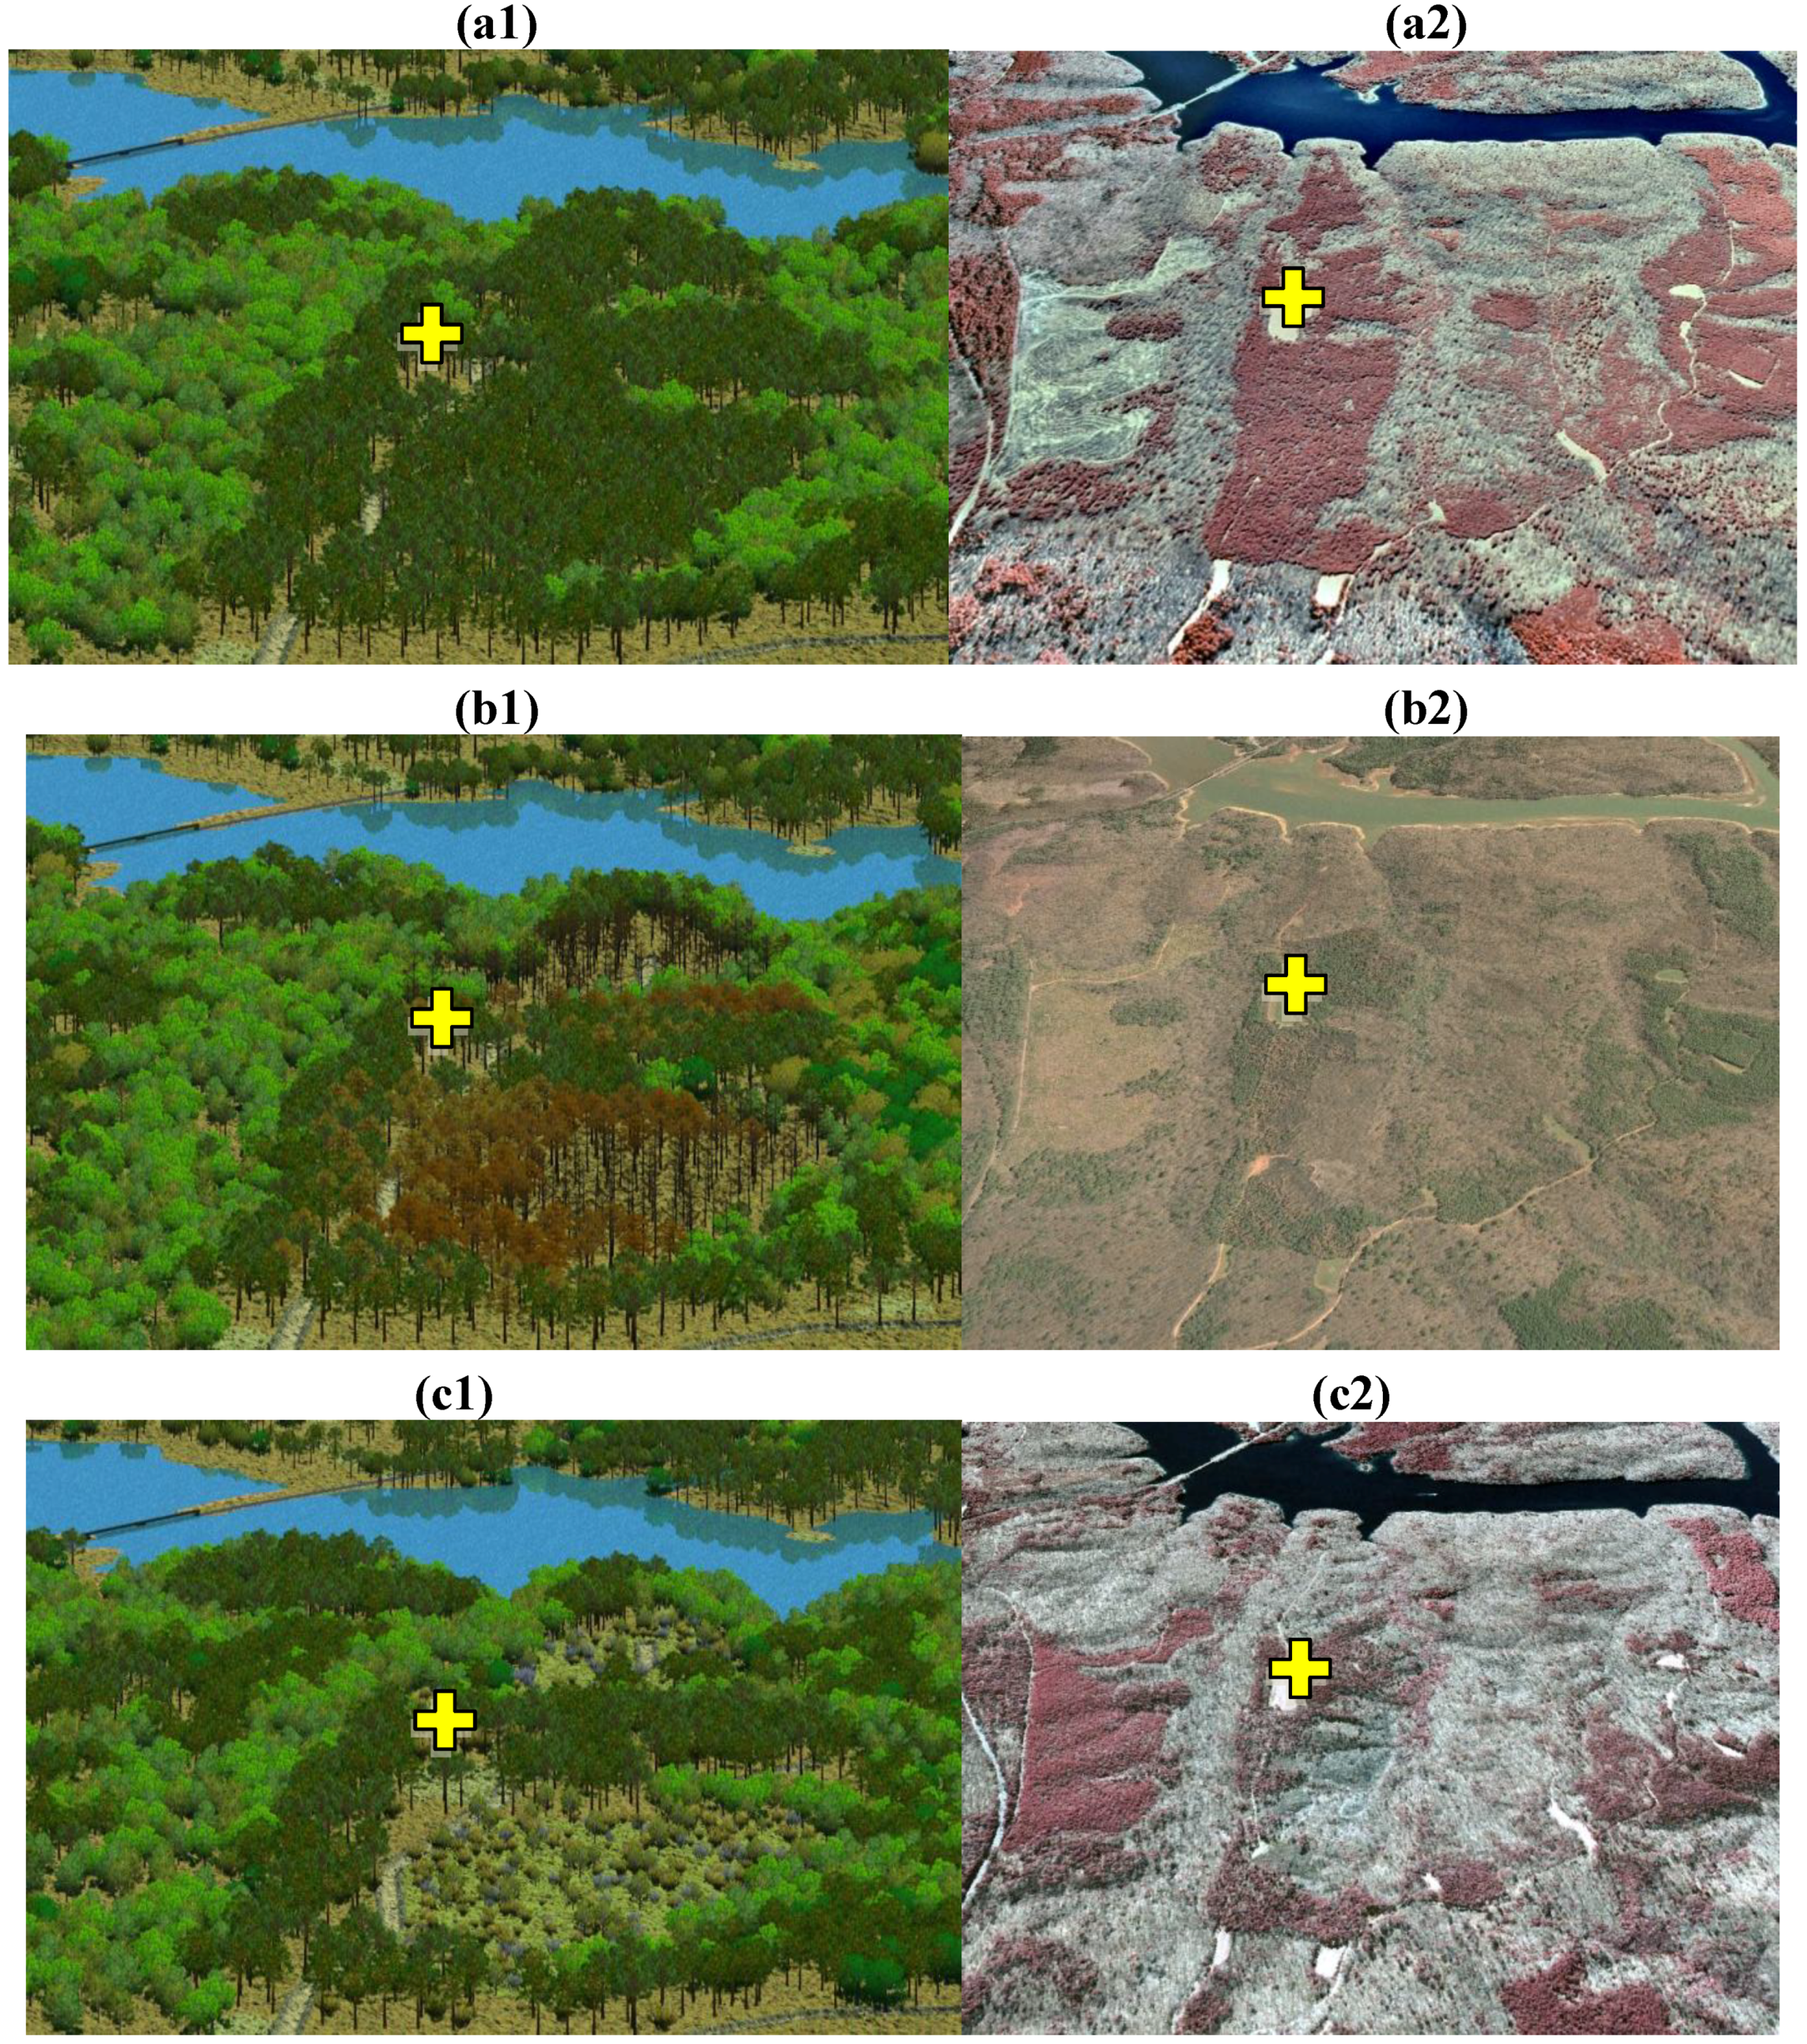
Quantitative and information-based 3-D landscape visualizations can visualize stand succession, landscape transformation, and regional planning [19]. They are capable of visualizing forest changes caused by management activities and disturbances. And they are capable of demonstrating future development using time-series databases and predictive models. Visualizing the past, present, and future conditions of forest landscapes provides the ability to display potential outcomes that are difficult to illustrate in the field [22] (Figure 3).
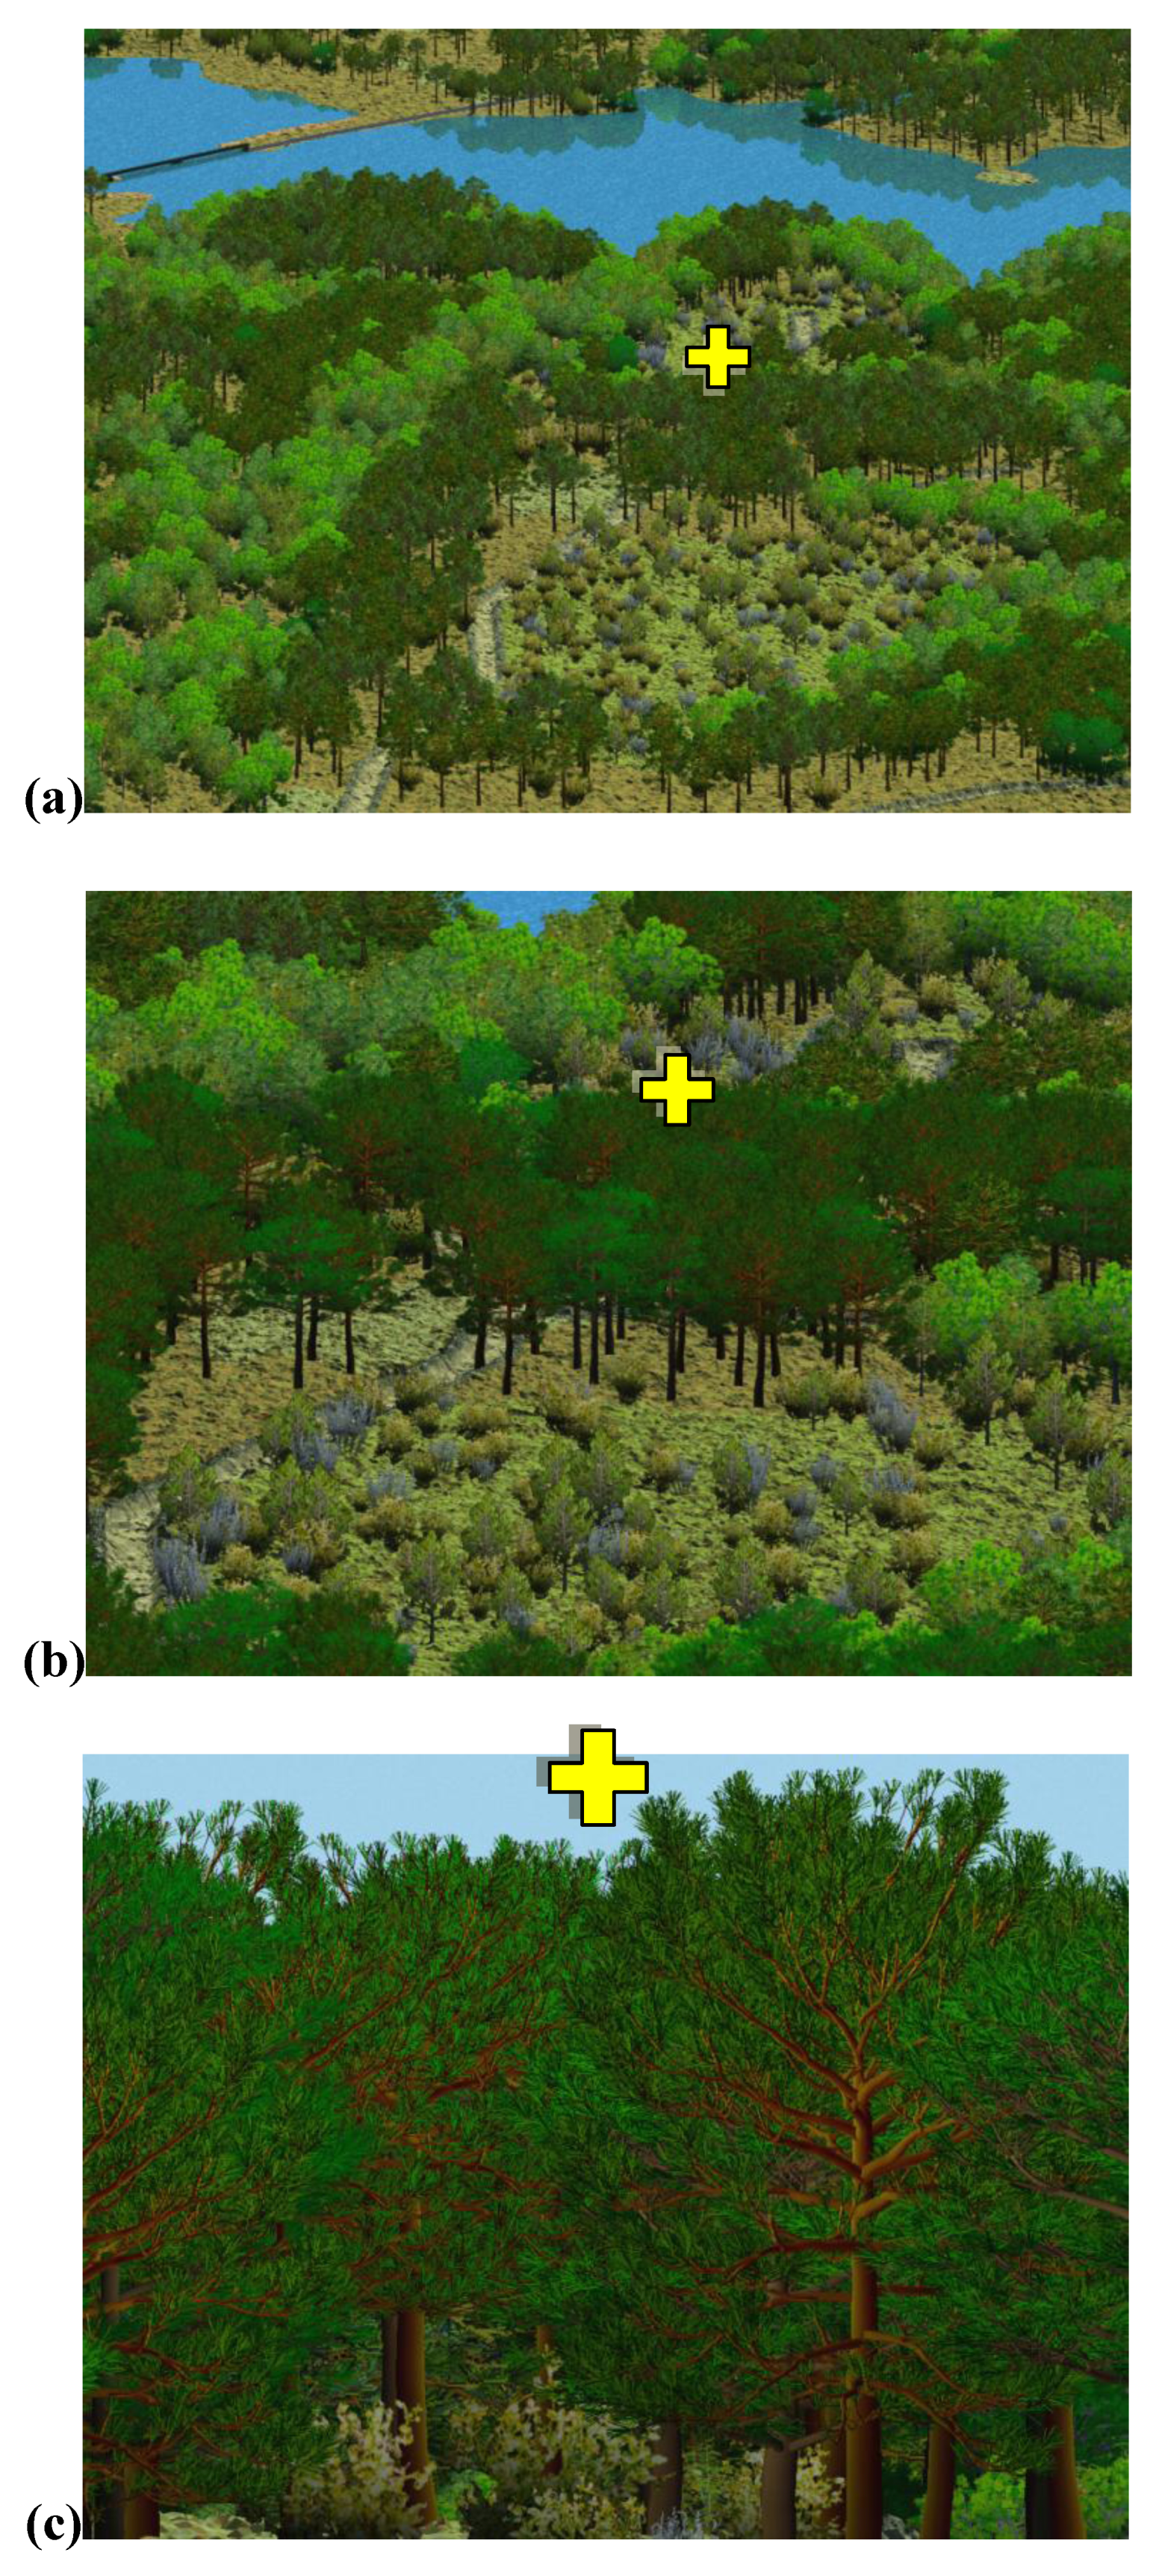
Spatial scale is also a key issue in developing forest visualizations. The amount and types of data needed for stand versus landscape scale visualizations differ because the purposes differ [8]. Stand scale visualization focuses on accurately displaying the vertical structure and dynamics of the stand, including stand density, species composition, and tree height. In contrast, landscape scale visualization emphasizes relative landscape components, such as the arrangement and interaction of patches, corridors, and matrixes. Hence, depending on the purpose, 3-D visualizations can be created for specified foliage effects (e.g., different species, ages, and statuses), understory and overstory ecotypes, and ground effects for appropriate landscape elements under assigned visualization scales (Figure 2).

3.1.3. Multi-expression

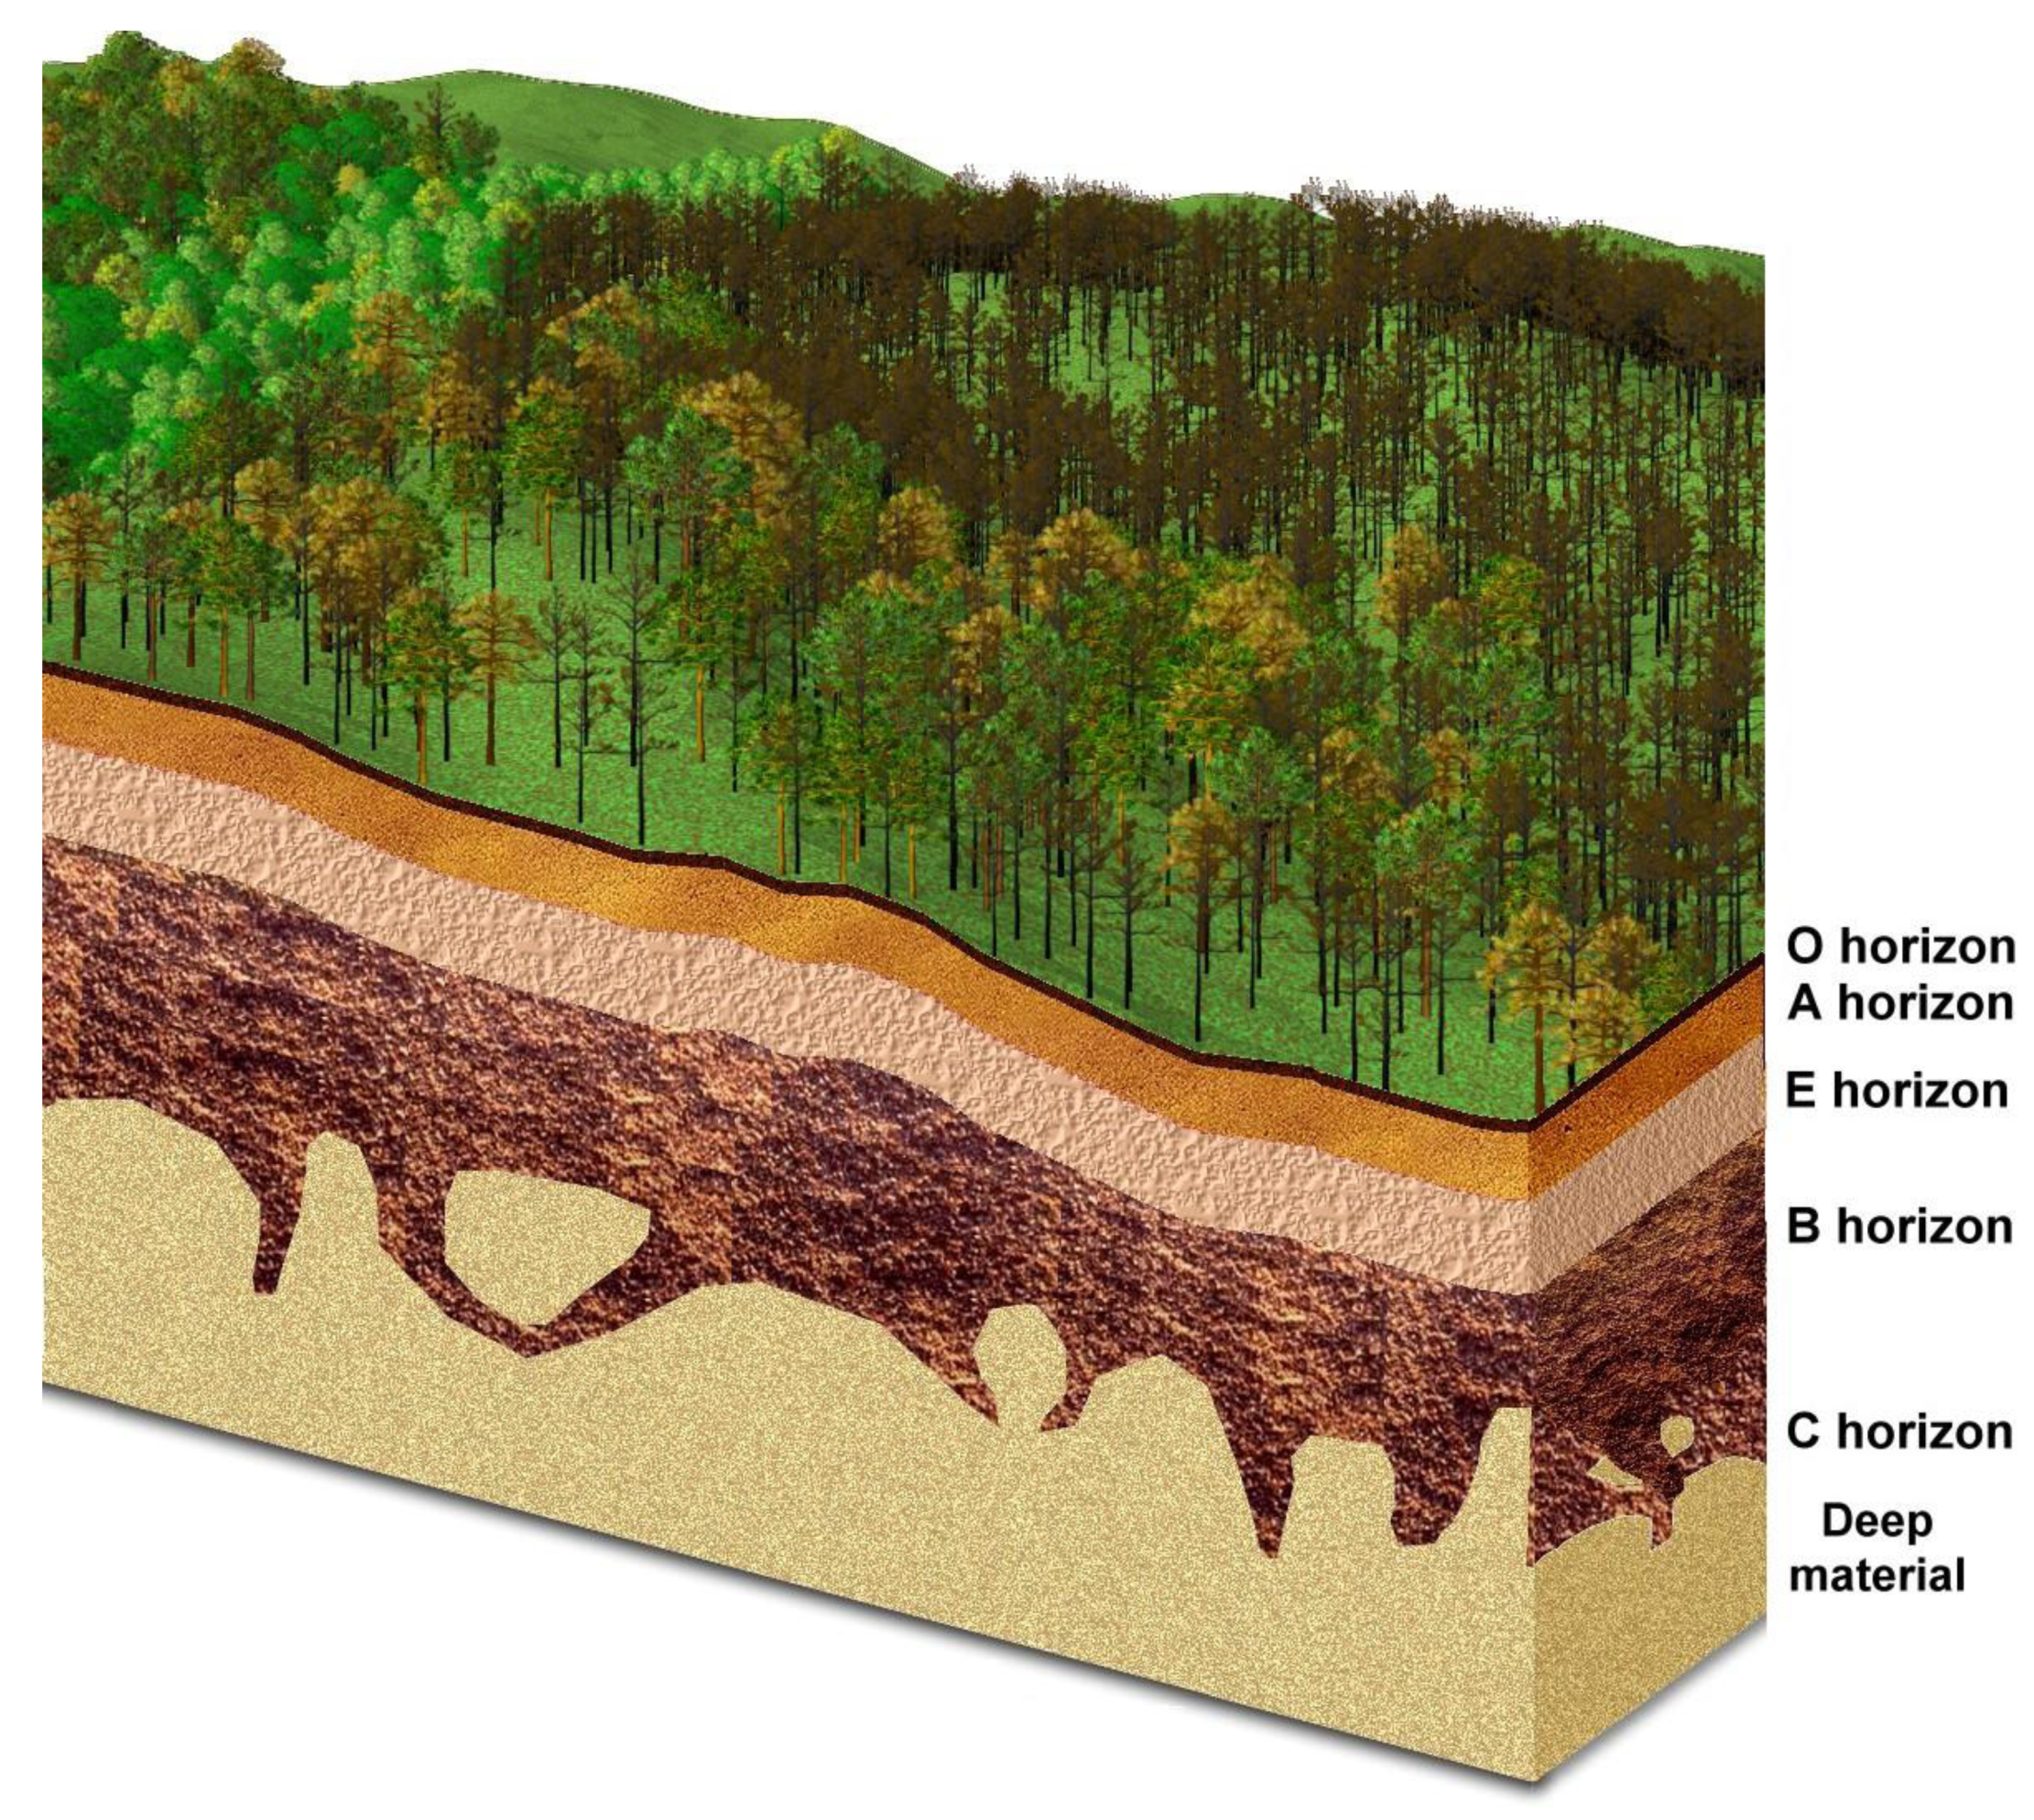
In the past, tables, figures, and maps have been the predominant methods used to communicate management alternatives, but these types of data include a high level of abstraction. Recently, 3-D visualizations have allowed the creation of perspective views to achieve more natural and direct depictions, enhance communications, and make complex information more easily understood by both experts and the general public [16]. Usually, a static diagram can only display a maximum of three factors [16]. In reality, natural phenomena result from many interactive factors and effects. For instance, bark beetle spot growth is typically discussed by referencing distances between pines, susceptible species, temperatures, and seasonal effects [11]. However, overall time-series effects (i.e., extended drought, infestation history) and relative spatial effects (i.e., arrangement of landscape patches, landforms, slopes, and soil characteristics) are seldom considered in beetle-infected forests [2,10,23]. 3-D landscape visualization allows the overlaying and integration of the combined effects of diverse interactive geo-information into simplified and integrated 3-D media [24] (Figure 4).
Figure 1. Different viewpoints of 3-D landscape visualizations over a projected river basin. The river starts from a highland, stops by a lake, passes through a village, flows into a marsh, and ends in a delta. (a) The viewshed with the camera above the delta provides an overview of the river flow and focuses on the relationship between the marsh and coast. (b) The viewshed with the camera above the highland delineates the arrangement of forest patterns from upriver to downstream. (c) The viewshed with the camera from right of the riverside emphasizes the impact of buildings on the river. (d) The viewshed with the camera from the left of the riverside emphasizes the protection of vegetation over the riverside. The different viewpoints focus on different key subjects and integrate all of the different perspectives as fly-through animation for supporting a more comprehensive communication media. (Data source: terrain generator and ecosystem component gallery from VNS) (http://people.clemson.edu/~cchou/VStream.avi).
Forests 01 00082 g001
Figure 2. 3-D visualizations from different spatial scales. (a) Landscape scale displays the arrangements, boundaries, and variations of vegetation patterns. (b) Near-stand scale focuses on the stand density, the composition of vegetation patterns, and the relationship between adjacent stands. (c) Stand scale emphasizes the vertical distribution of species and the shape of individual trees (Data source: GIS database from Clemson Experimental Forest).
Forests 01 00082 g002
Figure 3. 3-D landscape visualizations and their corresponding historical aerial orthophotos prior to, during, and after the southern pine beetle (SPB) infestation at CEF. (a1) and (a2) are the viewshed visualization and aerial photo, respectively, before the SPB infestation in 1999. There are completely mature pure pine stands covering the central area. (b1) and (b2) are the viewshed visualization and aerial photo, respectively, during the SPB infestation in 2002. There are at least two SPB spots in these pine forest stands. Great parts of these pine stands were attacked, shown as red and fading tree images, and turned into killed trees, shown as snag images. (c1) and (c2) are the viewshed visualization and aerial photo, respectively, after the SPB infestation in 2006. Great parts of the attacked trees in 2002 were gone in 2006 and replaced by regeneration shrubs, herbs, and secondary pine sprouts. (Data source: GIS database from CEF).
Forests 01 00082 g003
Figure 4. 3-D landscape visualization with soil profile represents an infected pine stand at the front right, and other healthy hardwood stands on the left backside of the hill. This is a loblolly pine stand with SPB infestation at CEF. Most of the loblolly pines were attacked, shown as fading tree images, and turned into killed trees, shown as snag images. The backside of the pine stand suffered severe damage, with the spot moving toward the front side. The hardwood stands, shown as brighter and yellowish green tree images adjacent to the left side of the infected stand were safe. Under the infestation hill, a soil profile visualization represents the relative arrangements, depths, and colors among O horizon, A horizon, E horizon, B horizon, C horizon, and deeper parent material. (Data source: GIS database from CEF).
Forests 01 00082 g004

3.2. 3-D Landscape Visualization

The 3-D landscape visualizations in Figure 1, Figure 2, Figure 3 and Figure 4 were generated using a 3-D simulator software called Visual Nature Studio (VNS, 3D Nature Inc. http://3dnature.com/), with the required data to delineate a landscape consisting of the terrain, vegetation, water, built structures, animals, and light [16,21,25].
VNS is a premium photo-realistic and landscape-visualization software package. It was chosen from a vast number of visualization tools for some of its specific qualities: (1) integration with georeferenced GIS datasets, (2) flexibility of land cover type development, (3) use of raster and vector formats to drive rendered vegetation components, and (4) including both motion and time-series animation ability [26]. Although, VNS provides the flexible and various models to bring a scene to life with vivid photo-realistic visualization, it requires skilled operation, high-end hardware, and long rendering time for high quality animation.
In order to visualize the base layer of landscapes, terrain was obtained based on digital elevation model (DEM; the most common source of digital terrain models, [27]) from high-resolution remote sensing images [16,25,28]. In addition, vegetation visualization is the critical technique to determine if the 3-D landscape visualization is convincing or not [24]. To realistically visualize the vegetation, various forest “ecosystems” were created using the ecosystem function in VNS. Appropriate individual tree images were placed in the canopy and understory layers based on species from the inventory data. The individual tree images were generated from OnyxTree Professional (Onyx Computing Inc. 1992–2008, http://www.onyxtree.com). It is a procedural tree modeling system that is capable of synthesizing realistic-looking tree images and provides a user-friendly platform. The other elements of landscape were visualized from the built-in task modes (i.e., Water Task Mode for water animation, 3-D Object Task Mode for animal and built structure animations, Sky and Light Task Mode for light animation) of VNS.

4. Incorporating Remote Sensing Images and GIS

GIS is a computer program that allows one to efficiently manage, process, analyze, and represent data. The data can be referenced to a location on the earth, including any thematic attribute that may be connected to the location [21]. GIS can be used to develop data sources for projecting 3-D landscape visualizations. With GIS one can utilize information from field or remotely sensed data to help classify different land cover types, such as agricultural land, rangeland, forestland, and wetlands. The GIS can also maintain detailed forest stand characteristics, including cover type, tree species, crown diameter, and stand height and density. Compatibility of 3-D visualization simulators and GIS data layers allows the rendering of landscapes based on information collected from the actual landscape.
Remote sensing images, including aerial photography and satellite imagery, constitute the basis for the creation of a variety of spatial data. The DEM, which forms the basis of most landscape visualization, is generally derived from remotely sensed data such as aerial photography, LiDAR (Light Detection and Ranging), and Interferometric Synthetic Aperture Radar. The elements of landscape include the physical materials or objects on the surface of the land, and are also known as land covers [23]. By interpreting remote sensing images, we can generate land cover maps. These images can include a widespread area with multi-spatial resolutions (the finest resolution can be less than 1 m). Information not apparent with visible light can be also obtained from multispectral satellite imageries that record the detailed physical characteristics of ground-features [29,30]. Based on these images, we can identify, recognize, and delineate land cover maps on multilevel land cover classification systems to support different landscape scale managers with appropriate resolution information on a nationwide, interstate, or countywide basis [29]. Moreover, foliage color usually changes with damage from wildfire or bark beetle outbreaks, and these widespread infestation phenomena can be easily detected using aerial photographs [30]. For these reasons, aerial photo interpretation usually supports the detection and assessment of stand health, forest vigor, the different stages or degrees of damage, and predicting the spreading region of a bark beetle or wildfire damage [30].
The analysis of landscape pattern change is an important method for understanding significant ecological dynamics, such as natural and human disturbances, forest succession, and recovery from previous disturbances [31]. Satellite imagery and aerial photography have been classified according to vegetation or land cover types, and they provide an excellent source of data for performing structural studies of landscapes [26]. When comparing these remote sensing images over time, they become especially useful for describing types of landscape changes and indicating the resulting impacts on surrounding habitats [26] (an example shown in Figure 3).
Therefore, remote sensing images and GIS database can help us effectively monitor forest changes according to type, duration, and intensity [32]. They can facilitate the representation of these highly dynamic temporal and spatial phenomena at varying scales ranging from an individual tree to an extensive forest landscape [32,33]. Illustrating landscape change is one of the most beneficial applications of 3-D landscape visualization [34]. Using a time-series GIS database and remote sensing images, we can delineate the appearance of terrain, land cover, and vegetation to compare the spatial and temporal changes in past and present forest landscapes [17] (Figure 3). In attempts to visualize future landscapes, the visual projection must be driven by dynamic models that can simulate the recovery, succession, or growth situations under different management scenarios.

5. Incorporating Simulation Models

In the following discussion, we examine how simulation models can be linked with 3-D landscape visualization.

5.1. Forest Vegetation Simulator (FVS)

FVS is a distance-independent growth and yield model at the individual tree scale [35]. It can simulate growth and yield for major forest tree species, forest types, and stand conditions for all national forests in the US [35]. For instance, Wang et al. [19] used a Forest Inventory Analysis (FIA) dataset to simulate the dynamics of tree size (diameter and height) for different forest types in FVS models and VNS.

5.2. Fire Area Simulator (FARSITE)

FARSITE is a fire growth simulation model that can incorporate existing models of surface fire, crown fire, point-source fire acceleration, spotting, and fuel moisture to simulate fire behavior and represent fire growth and effect over an entire landscape [36]. Williams et al. [37] used VNS and shapefiles of different wildfire stages generated from FARSITE to visualize fire spread and intensity across the New Jersey Pine Barrens. In this study, in order to describe the different effects of fire severity and crown fire on forest stands, they created burned tree image models using Photoshop to visualize the different flame effects on either individual trees or clusters of trees [37]. As a result, both still frame and animated views of wildfire visualizations were established by combining the burned tree models with different flame models [37].

5.3. CLEMBEETLE

The CLEMBEETLE model simulates the stand damage caused by southern pine beetle (SPB), including estimating the number of attacked and killed trees per spot, percentage of stand killed per acre, and expected yield per acre with or without SPB attacks [23]. Chou et al. [38] visualized the active spot growth with different affected-stage from SPB infestation. By using CLEMBEETLE, a GIS-based spot growth model, VNS, and ArcGIS (Environment System Research Institute Inc. http://www.esri.com/), 3-D visualizations of SPB spot growth with different stand densities, species compositions, and stand ages were generated [38]. This new GIS-based spot growth model created realistic views with stereo viewsheds and vivid foliage images, and helps us understand the dynamics of SPB spot growth under different silvicultural scenarios [38].

5.4. Landscape Disturbance and Succession Simulation Model (LANDIS)

LANDIS is a spatially explicit and stochastic landscape model for simulating large-scale and long-term forest landscape processes with species level vegetation dynamics. It can generate the time curves for heterogeneous spatial patterns and species abundance to represent the interaction of disturbances and succession with changing forest patterns over long periods of time and a wide range of landscape scales [39]. It can also provide species information, including age class, abundance percentage, diameter, and density on different land types within a specified environmental situation [15,40], to support the required data of landscape visualization. LANDIS has been used to simulate the disturbance influences of wildfire and SPB on successional dynamic landscapes [40,41], and it also generates major required data for the 3-D landscape visualization.

6. Discussions

3-D visualization that incorporates a GIS database, remote sensing images, and simulation models can provide a more comprehensive, practical, and applicable approach for monitoring spatial pattern changes due to disturbances caused by wildfires and bark beetles. It can be used to evaluate alternative management strategies and to effectively communicate the impacts of those strategies to diverse stakeholder groups. In addition, 3-D visualization can depict the structure and composition of landscapes, and also portray spatial and temporal changes resulting from different natural disturbances or management strategies [5,15,18,42,43]. It can facilitate communication among researchers, managers, and the public to promote a better understanding of the impacts derived from dynamic natural or operational scenarios. This 3-D visualization has been applied to forest management in the following studies to: (1) improve the decision making process by simplifying the complicated information and providing comprehensive communication media among diverse stakeholders with diverse backgrounds on forest management [34,42,44], (2) compare the multi-objective forest management strategies [45], and (3) represent the past, present, and future phenomena in forest landscape planning [43,46,47]. The 3-D visualization has been used in the latter two applications to provide visual representation (i.e., photo-realistic visualizations) to extend our power of perception to consequences of non-visual processes (i.e., stand growth and yield model, forest restoration, ecosystem succession, etc.) [45,46,47]. Consequently, it can synthesize different dimensions (i.e., time-series, spatial scale, purpose, etc.) and provide a well-organized technique. It can be used to combine complex information into a comprehensive media to enhance the integration of information, processes, and strategies.
The value of such 3-D landscape visualization depends on accuracy and realism, which will depend on the quality of the supporting data and the validity of the simulation models [22,48]. In order to produce 3-D visualization that can be viewed with confidence by various public groups, we must be assured of the accuracy of the underlying forest data and the application of this data to simulation models. Especially, the visual representation should be defensible through making the projection process and assumptions transparent to the audiences, and by clearly describing the expected level of accuracy and uncertainty [49].
In the future, the research group would aim to improve the quantitative analysis of (1) whether the 3-D visualization (comparing to the text, tabular, or 2-D map) could help the participants articulate more clearly their preferences for landscape conditions [50], (2) whether the 3-D visualization could increase the perception of multi-purpose, multi-temporal, and multi-spatial alternative forest management strategies [45,51], and (3) the accuracy of assessment (i.e., the ability of the simulation model to capture the essence or details of the scene) by comparing static views of the projected landscape visualization with known photorealistic viewpoints [52]. Furthermore, although the 3-D visualization is recognized as a helpful and meaningful medium to forest management plans and other activities, it is still a new technique for forest research with limited used. More widespread studies are needed to extend its applicability, as well as the development of standard guidance and validation for its use in practice [15,50].

Acknowledgements

This research was supported by the grant from the U.S. Department of Agriculture, Forest Service. We would like to thank the following individuals that provided significant help in this study: Patricia A. Layton, Donald Lipscomb, Knight Cox, Ross Phillips, Soung-Ryoul Ryu, and Stephen Hutchinson for their comments and contributions and Kier D. Klepzig, Danny C. Lee, and Carl C. Trettin for their ideas and support. In particular, we are grateful to two anonymous referees for their time and most helpful suggestions. Technical Contribution No. 5790 of the Clemson University Experiment Station under project number SC-1700259.

References and Notes

  1. Agee, J.K. Fire ecology of Pacific Northwest forests; Island Press: Washington, DC, USA, 1993; pp. 53–74. [Google Scholar]
  2. McCullough, D.G.; Werner, R.A.; Neumann, D. Fire and insects in northern and boreal forest ecosystems of North America. Ann. Rev. Entom. 1998, 43, 107–127. [Google Scholar] [CrossRef] [PubMed]
  3. Edmonds, R.L. Forest Health and Protection; McGraw Hill Co. Inc.: Boston, MA, USA, 2000; pp. 254–337. [Google Scholar]
  4. Martell, D.L. Forest fire management. In Fires: Behavior and Ecological Effects; Johnson, E.A., Miyanishi, K., Eds.; Academic Press: San Diego, CA, USA, 2001; pp. 527–583. [Google Scholar]
  5. Orland, B. Visualization techniques for incorporation in forest planning geographic information systems. Landsc. Urban Plan. 1994, 30, 83–97. [Google Scholar] [CrossRef]
  6. Daniel, T.C.; Carroll, M.; Moseley, C.; Raish, C. Introduction to people, fire, and forests. In People, Fire, and Forests; Daniel, T.C., Carroll, M., Moseley, C., Raish, C., Eds.; Oregon State University Press: Corvallis, OR, USA, 2007; pp. 1–8. [Google Scholar]
  7. Waldron, J.D.; Lafon, C.W.; Coulson, R.N.; Cairns, D.M.; Tchakerian, M.D.; Birt, A.; Klepzig, K.D. Simulating the impacts of southern pine beetle and fire on the dynamics of xerophytic pine landscapes in the southern Appalachians. Appl. Veg. Sci. 2007, 10, 53–64. [Google Scholar] [CrossRef]
  8. Oliver, C.D.; Ferguson, D.E.; Harvey, A.E.; Malany, H.S.; Mandzak, J.M.; Mutch, R.W. Managing ecosystems for forest health: An approach and the effects on uses and values. In Assessing Forest Ecosystem Health in the Inland West; Sampson, R.N., Adams, D.L., Eds.; Forest Policy Center: Washington, DC, USA, 1994; pp. 113–133. [Google Scholar]
  9. Stephens, S.L.; Ruth, L.W. Federal forest-fire policy in the United States. Ecol. Appl. 2005, 15, 532–542. [Google Scholar] [CrossRef]
  10. Clarke, S. Review of the operational IPM program for the southern pine beetle. Integr. Pest Manage. Rev. 2001, 6, 293–301. [Google Scholar] [CrossRef]
  11. Fettig, C.J.; Dlepzig, K.D.; Billings, R.F.; Munson, A.S.; Nebeder, T.E.; Negron, J.F.; Nowak, J.T. The effectiveness of vegetation management practices for prevention and control of bark beetle infestations in coniferous forests of the western and southern United States. For. Ecol. Manage. 2007, 238, 24–53. [Google Scholar] [CrossRef]
  12. Fire and Resource Assessment Program (FRAP). The changing California: forest and range 2003 assessment: assessment summary; US Department of Agriculture, Forest Service, Department of Forestry and Fire Protection: Sacramento, CA, USA, 2003; pp. 42–197.
  13. Coster, J.E. Developing integrated management strategies. In The Southern Pine Beetle; Thatcher, R.C., Searcy, J.L., Coster, J.E., Hertel, G.D., Eds.; US Department of Agriculture, Expanded Southern Pine Beetle Research and Application Program, Forest Service, Science and Education Administration: Washington, DC, USA, 1980; pp. 195–203. [Google Scholar]
  14. Shindler, B. Public acceptance of wildland fire conditions and fuel reduction practices: challenges for federal forest managers. In People, Fire, and Forests; Daniel, T.C., Carroll, M., Moseley, C., Raish, C., Eds.; Oregon State University Press: Corvallis, OR, USA, 2007; pp. 37–54. [Google Scholar]
  15. Sheppard, S.R.J.; Salter, J. The role of visualization in forest planning. In Encyclopedia of Forest Sciences; Burley, J., Evans, J., Youngquist, J.A., Eds.; Academic Press: Oxford, UK, 2004; pp. 486–498. [Google Scholar]
  16. Lange, E.; Bishop, I.D. Communication, perception and visualization. In Visualization in Landscape and Environmental Planning: Technology and Application; Bishop, I., Lange, E., Eds.; Taylor & Francis: London, UK, 2005; pp. 3–21. [Google Scholar]
  17. Song, B.; Wang, X.; Williams, T.M.; Mladenoff, D.J.; Chen, J.; Gustafson, E.J.; Hom, J.L.; Crow, T.R. Visualizing a landscape, its changes, and driving processes. In Ecology of Hierarchical Landscapes: from Theory to Application; Chen, J., Saunders, S.C., Brosofske, K.D., Crow, T.R., Eds.; Nova Science Publishers Inc.: New York, NY, USA, 2006; pp. 167–191. [Google Scholar]
  18. Meitner, M.J.; Sheppard, S.R.G.; Cavens, D.; Gandy, R.; Picard, P.; Harshaw, H.; Harrison, D. The multiple roles of environmental data visualization in evaluating alternative forest management strategies. Comput. Electr. Agric. 2005, 49, 192–205. [Google Scholar] [CrossRef]
  19. Wang, X.; Song, B.; Chen, J.; Zheng, D.; Crow, T.R. Visualizing forest landscapes using public data sources. Landsc. Urban Plan. 2006, 75, 111–124. [Google Scholar] [CrossRef]
  20. Karjalainen, E.; Tynäinen, L. Visualization in forest landscape preference research: A Finnish perspective. Landsc. Urban Plan. 2002, 59, 13–28. [Google Scholar] [CrossRef]
  21. Mach, R.; Petschek, P. Visualization of Digital Terrain and Landscape Data: A Manual; Springer: London, UK, 2007; pp. 123–254. [Google Scholar]
  22. Wang, X.; Song, B.; Chen, J.; Crow, T.R.; LaCroix, J.J. Challenges in visualizing forests and landscapes. J. For. 2006, 104, 316–319. [Google Scholar]
  23. Hedden, R.L. Simulation of southern pine beetle-associated timber loss using CLEMBEETLE. In Proceedings of Integrated Pest Management Research Symposium, Asheville, NC, USA, 1985; pp. 288–291.
  24. Hirtz, P.; Hoffmann, H.; Nüesch, D. Interactive 3D landscape visualization: improved realism through use of remote sensing data and geoinformation. In Proceedings of Computer Graphics International, Canmore, AB, Canada, 1999; pp. 101–108.
  25. Ervin, S.M. Digital landscape modeling and visualization: A research agenda. Landsc. Urban Plan. 2001, 54, 49–62. [Google Scholar] [CrossRef]
  26. Dunbar, M.D.; Moskal, L.M.; Jakubauskas, M.E. 3D visualization for the analysis of forest cover change. Geocarto Int. 2005, 19, 103–112. [Google Scholar] [CrossRef]
  27. U.S. Geological Survey (USGS). Standards for digital elevation models. National Mapping Program, Technical Instructions; US Geological Survey: Raston, VA, USA. Available online: http://rockyweb.cr.usgs.gov/nmpstds/demstds.html (accessed on 1 April, 2010 ).
  28. Doellner, J.; Hinrichs, K. A generic rendering system. IEEE Trans. Visual. Comput. Graphics 2002, 8, 99–118. [Google Scholar] [CrossRef]
  29. Chandra, A.M.; Ghosh, S.K. Remote Sensing and Geographical Information System; Alpha Science: Oxford, UK, 2006; pp. 73–144. [Google Scholar]
  30. Lillesand, T.M.; Kiefer, R.W. Remote Sensing and Image Interpretation; John Wiley & Sons: New York, NY, USA, 2000; pp. 190–308. [Google Scholar]
  31. Turner, M.G. Landscape changes in nine rural counties in Georgia. Photogram. Eng. Remote Sensing 1990, 56, 379–386. [Google Scholar]
  32. Rogan, J.; Miller, J. Integrating GIS and remotely sensed data for mapping forest disturbance and change. In Understanding Forest Disturbance and Spatial Pattern: Remote Sensing and GIS Approaches; Wulder, M.A., Franklin, S.E., Eds.; CRC Press: Boca Raton, FL, USA, 2006; pp. 133–171. [Google Scholar]
  33. Attiwill, P.M. The disturbance of forest ecosystems: The ecological basis for conservative management. For. Ecol. Manage. 1994, 63, 247–300. [Google Scholar] [CrossRef]
  34. Ghadirian, P.; Bishop, I.D. Integration of augmented reality and GIS: A new approach to realistic landscape visualization. Landsc. Urban Plan. 2008, 86, 226–232. [Google Scholar] [CrossRef]
  35. Crookston, N.L.; Stage, A.R. Percent canopy cover and stand structure statistics from the forest vegetation simulator; U.S. Department of Agriculture, Forest Service, Rocky Mountain Research Station: Ogden, UT, USA, 1999; pp. 1–16.
  36. Finney, M.A. FARSITE: fire area simulator—model development and evaluation; US Department of Agriculture, Forest Service, Intermountain Fire Science Laboratory: Missoula, MT, USA, 1998; pp. 1–52.
  37. Williams, B.J.; Song, B.; Hom, J.; Duveneck, M. Wildfire visualization using GIS and forest inventory data. In Proceedings of 6th Southern Forestry and Natural Resources GIS Conference, Orlando, FL, USA, 2008; pp. 37–47.
  38. Chou, C.-Y.; Song, B.; Hedden, R.L.; Williams, T.M. The simulation of southern pine beetle spot growth in loblolly pine stands. In Proceedings of 6th Southern Forestry and Natural Resources GIS Conference, Orlando, FL, USA, 2008; pp. 178–195.
  39. He, H.S.; Mladenoff, D.J. Spatially explicit and stochastic simulation of forest-landscape fire disturbance and succession. Ecology 1999, 80, 81–99. [Google Scholar] [CrossRef]
  40. He, H.S.; Mladenoff, D.J.; Gustafson, E.J. Study of landscape change under forest harvesting and climate warming-induced fire disturbance. For. Ecol. Manage. 2002, 155, 257–270. [Google Scholar] [CrossRef]
  41. Cairns, D.M.; Lafon, C.W.; Waldron, J.D.; Tchakerian, M.; Coulson, R.N.; Klepzig, K.D.; Birt, A. G.; Xi, W. Simulating the reciprocal interaction of forest landscape structure and southern pine beetle herbivore using LANDIS. Landsc. Ecol. 2008, 23, 403–415. [Google Scholar] [CrossRef]
  42. Sheppard, S.R.J.; Meitner, M. Using multi-criteria analysis and visualization for sustainable forest management planning with stakeholder groups. For. Ecol. Manage. 2005, 207, 171–187. [Google Scholar] [CrossRef]
  43. Chamberlian, B.C.; Meitner, M.J. Automating the visual resource management and harvest design process. Landsc. Urban Plan. 2009, 90, 86–94. [Google Scholar] [CrossRef]
  44. Paar, P.; Rohricht, W.; Schuler, J. Towards a planning support system for environmental management and agri-environmental measures—The Colorfields study. J. Environ. Manage. 2008, 89, 234–244. [Google Scholar] [CrossRef] [PubMed]
  45. Seely, B.; Nelson, J.; Wells, R.; Peter, B.; Meitner, M.; Anderson, A.; Harshaw, H.; Sheppard, S.; Bunnell, F.L.; Kimmins, H.; Harrison, D. The application of a hierarchical, decision-support system to evaluate multi-objective forest management strategies: a case study in northeastern British Columbia, Canada. For. Ecol. Manage. 2004, 199, 283–305. [Google Scholar] [CrossRef]
  46. Stoltman, A.M. Computer visualization of pre-settlement and current forests in Wisconsin. For. Ecol. Manage. 2007, 246, 135–143. [Google Scholar] [CrossRef]
  47. Meitner, M.; Gandy, R.; Nelson, J. Application of texture mapping to generate and communicate the visual impacts of partial retention systems in boreal forests. For. Ecol. Manage. 2006, 228, 225–233. [Google Scholar] [CrossRef]
  48. Salter, J.D.; Campbell, C.; Journeay, M.; Sheppard, S.R.J. The digital workshop: Exploring the use of interactive and immersive tools in participatory planning. J. Environ. Manage. 2009, 90, 2090–2101. [Google Scholar] [CrossRef] [PubMed]
  49. Sheppard, S.R.J. Guidance for crystal ball gazers: developing a code of ethics for landscape visualization. Landsc. Urban Plan. 2001, 54, 183–199. [Google Scholar] [CrossRef]
  50. Lewis, J.L.; Sheppard, S.R.J. Culture and communication: Can landscape visualization improve forest management consultation with indigenous communities? Landsc. Urban Plan. 2006, 77, 291–313. [Google Scholar] [CrossRef]
  51. Wergles, N.; Muhar, A. The role of computer visualization in the communication of urban design – A comparison of viewer responses to visualizations versus on-site visits. Landsc. Urban Plan. 2009, 91, 171–182. [Google Scholar] [CrossRef]
  52. Orland, B.; Budthimedhee, K.; Uusitalo, J. Considering virtual worlds as representations of landscape realities and as tools for landscape planning. Landsc.Urban Plan. 2001, 54, 139–148. [Google Scholar] [CrossRef]