Article

RAD-Seq Data Point to a Distinct Split in Liriodendron (Magnoliaceae) and Obvious East–West Genetic Divergence in L. chinense

The Key Laboratory of Horticultural Plant Genetic and Improvement of Jiangxi Province, Institute of Biological Resources, Jiangxi Academy of Sciences, No.7777, Changdong Road, Gaoxin District, Nanchang 330096, China
*
Author to whom correspondence should be addressed.
Forests 2019, 10(1), 13; https://doi.org/10.3390/f10010013
Submission received: 7 November 2018 / Revised: 17 December 2018 / Accepted: 24 December 2018 / Published: 26 December 2018

Abstract

:
Liriodendron is a Tertiary period relic tree genus with a typical East Asian and North American disjunction distribution pattern. As an angiosperm base group of trees, Liriodendron provides a valuable resource for the study of evolution processes. Here, we reconstruct the phylogeny and population genetic structure of Liriodendron based on the restriction site-associated DNA sequencing (RAD-Seq) of a wide collection of individuals from 16 populations. Our results reveal a clear phylogenetic break between L. chinense and L. tulipifera and obvious genetic divergence between the eastern and western populations of L. chinense, which are consistent with the patterns of geographical distributions. The phylogeographic history and long-term geographical isolation of the genus may be responsible for this pattern. Furthermore, a closer relationship was found between L. tulipifera and the eastern populations of L. chinense, indicating the ancient phylogeny of L. chinense in this area. The results of this study will aid in the development of scientific strategies for the conservation and utilization of the Liriodendron germplasm.

1. Introduction

East Asian and North American disjunction is a long-term concern [1,2,3,4,5]. As a relic tree genus, Liriodendron (Magnoliaceae) was once widespread in the Northern Hemisphere and comprised several species in the Cretaceous and Tertiary periods [6]. However, the intercontinental disjunction of Liriodendron in the Northern Hemisphere appears to have occurred since the middle Miocene (ca. 14.15 million) [7], when the climate converted from the warmer Oligocene to the colder Pliocene [8]. The Liriodendron now consists of two deciduous tree species with a typical East Asian and east North American disjunction: Liriodendron chinense (Hemsl.) Sargent and Liriodendron tulipifera L. L. chinense is native to subtropical China and north Vietnam and is an endangered species with several small isolated populations due to its low percentage of seed setting and seed germination rate, as well as the prevalence of anthropogenic disturbances [9,10]. In contrast, L. tulipifera is predominantly distributed in the east of the Mississippi river, from the gulf coast to southern Canada, and is a major reforestation species in the USA [6,11,12]. Although these two species are geographically isolated by the Pacific Ocean, they are morphologically similar and cross-fertile [13]. The Liriodendron was pivotal to the evolution of flowering plants [14]. It is an ideal plant for population genetics and phylogenetic studies [15].
The phylogenetic and genetic diversity of Liriodendron have fascinated many researchers. For example, Parks and Wendel detected an obvious phylogenetic split within Liriodendron [8]. A survey of flavonoid extracts and genetic isozymes indicated that the two Liriodendron species diverged from a presumed common ancestor [6]. For L. tulipifera, a significant south–north genetic divergence was frequently found between the Florida Peninsula and continental North America. L. tulipifera survived in these two distinct refugia during the glacial advances of the Pleistocene. For example, the restriction site variation of chloroplast DNA (cpDNA) in 64 populations suggests genetic divergence between Florida and North Carolina-based populations of L. tulipifera [12], which was further confirmed by a survey of 55 populations based on three cpDNA sequences [16]. Moreover, apart from the isolated Florida “peninsular” group and the widespread Appalachian “upland” group, an investigation of 50 populations from its entire range also found a diverse “intermediate” group from the southeastern coastal plains based on allozyme variation of L. tulipifera [17].
These studies showed a drift in the phylogenetic pattern of Liriodendron and revealed a clear genetic divergence pattern for L. tulipifera. Nevertheless, due to the difficulties in the sampling of L. chinense, the previous phylogeny studies of Liriodendron have been biased towards L. tulipifera [8,12]. Relevant studies of L. chinense are currently underway. For example, Li et al. [18] assessed the genetic diversity and differentiation within natural populations of L. chinense by simple sequence repeats (SSRs) and showed high genetic diversity but limited gene flow among these populations [18]. Yang et al. [19] investigated the genetic diversity and the phylogeographic pattern of L. chinense based on nuclear simple sequence repeat (nSSR) and chloroplast simple sequence repeat (cpSSR) markers and reported the multiple isolated mountain refugia within the whole range of L. chinense.
However, geographically limited sampling or limited markers have reduced the informative value of these efforts; hence, the application of a large set of genetic markers from the whole genome, such as single nucleotide polymorphisms (SNPs), which have high throughput efficiency and abundance, is necessary. Yet, the size and complexity of the Liriodendron genome (about 1.57 G) [20] has increased the cost and efficiency of SNP development. A next-generation sequencing approach, termed RAD-Seq (restriction site-associated DNA sequencing), can successfully detect large genome-wide SNPs even without a reference genome [21,22,23]. Furthermore, the analyses based on RAD-Seq usually achieve better results in terms of statistical estimates than analyses using limited sequences of mitochondrial DNA (mtDNA) or nuclear DNA (nDNA). For example, RAD-Seq has been used to identify agronomically important genes in breeding for crops such as maize [24] and rice [25]. The results of RAD-Seq can be used to infer the origin of the arctic–alpine genus Cassiope (Ericaceae) [26] and to clarify the evolutionary relationships in bee orchids [27], and it can also provide a robust phylogenetic hypothesis for variously related taxa of Ohomopterus ground beetles [28], unambiguously resolved phylogenetic relationships among recalcitrant taxa of Paragorgia [29], and clear relationships of the Nyssa sylvatica complex [30]. In the present study, we applied RAD-Seq to investigate the genetic structure within Liriodendron and explored the phylogenetic relationships within this intercontinental, discontinuous genus. This involved a wide collection of individuals from 16 populations of Liriodendron, with particular focus on L. chinense. We aimed not only to determine the genetic structure within the Liriodendron genus, but also to elucidate the phylogeny relationships especially within L. chinense. The results of this study will aid in the development of scientific strategies for the conservation and utilization of Liriodendron breeding.

2. Methods and Materials

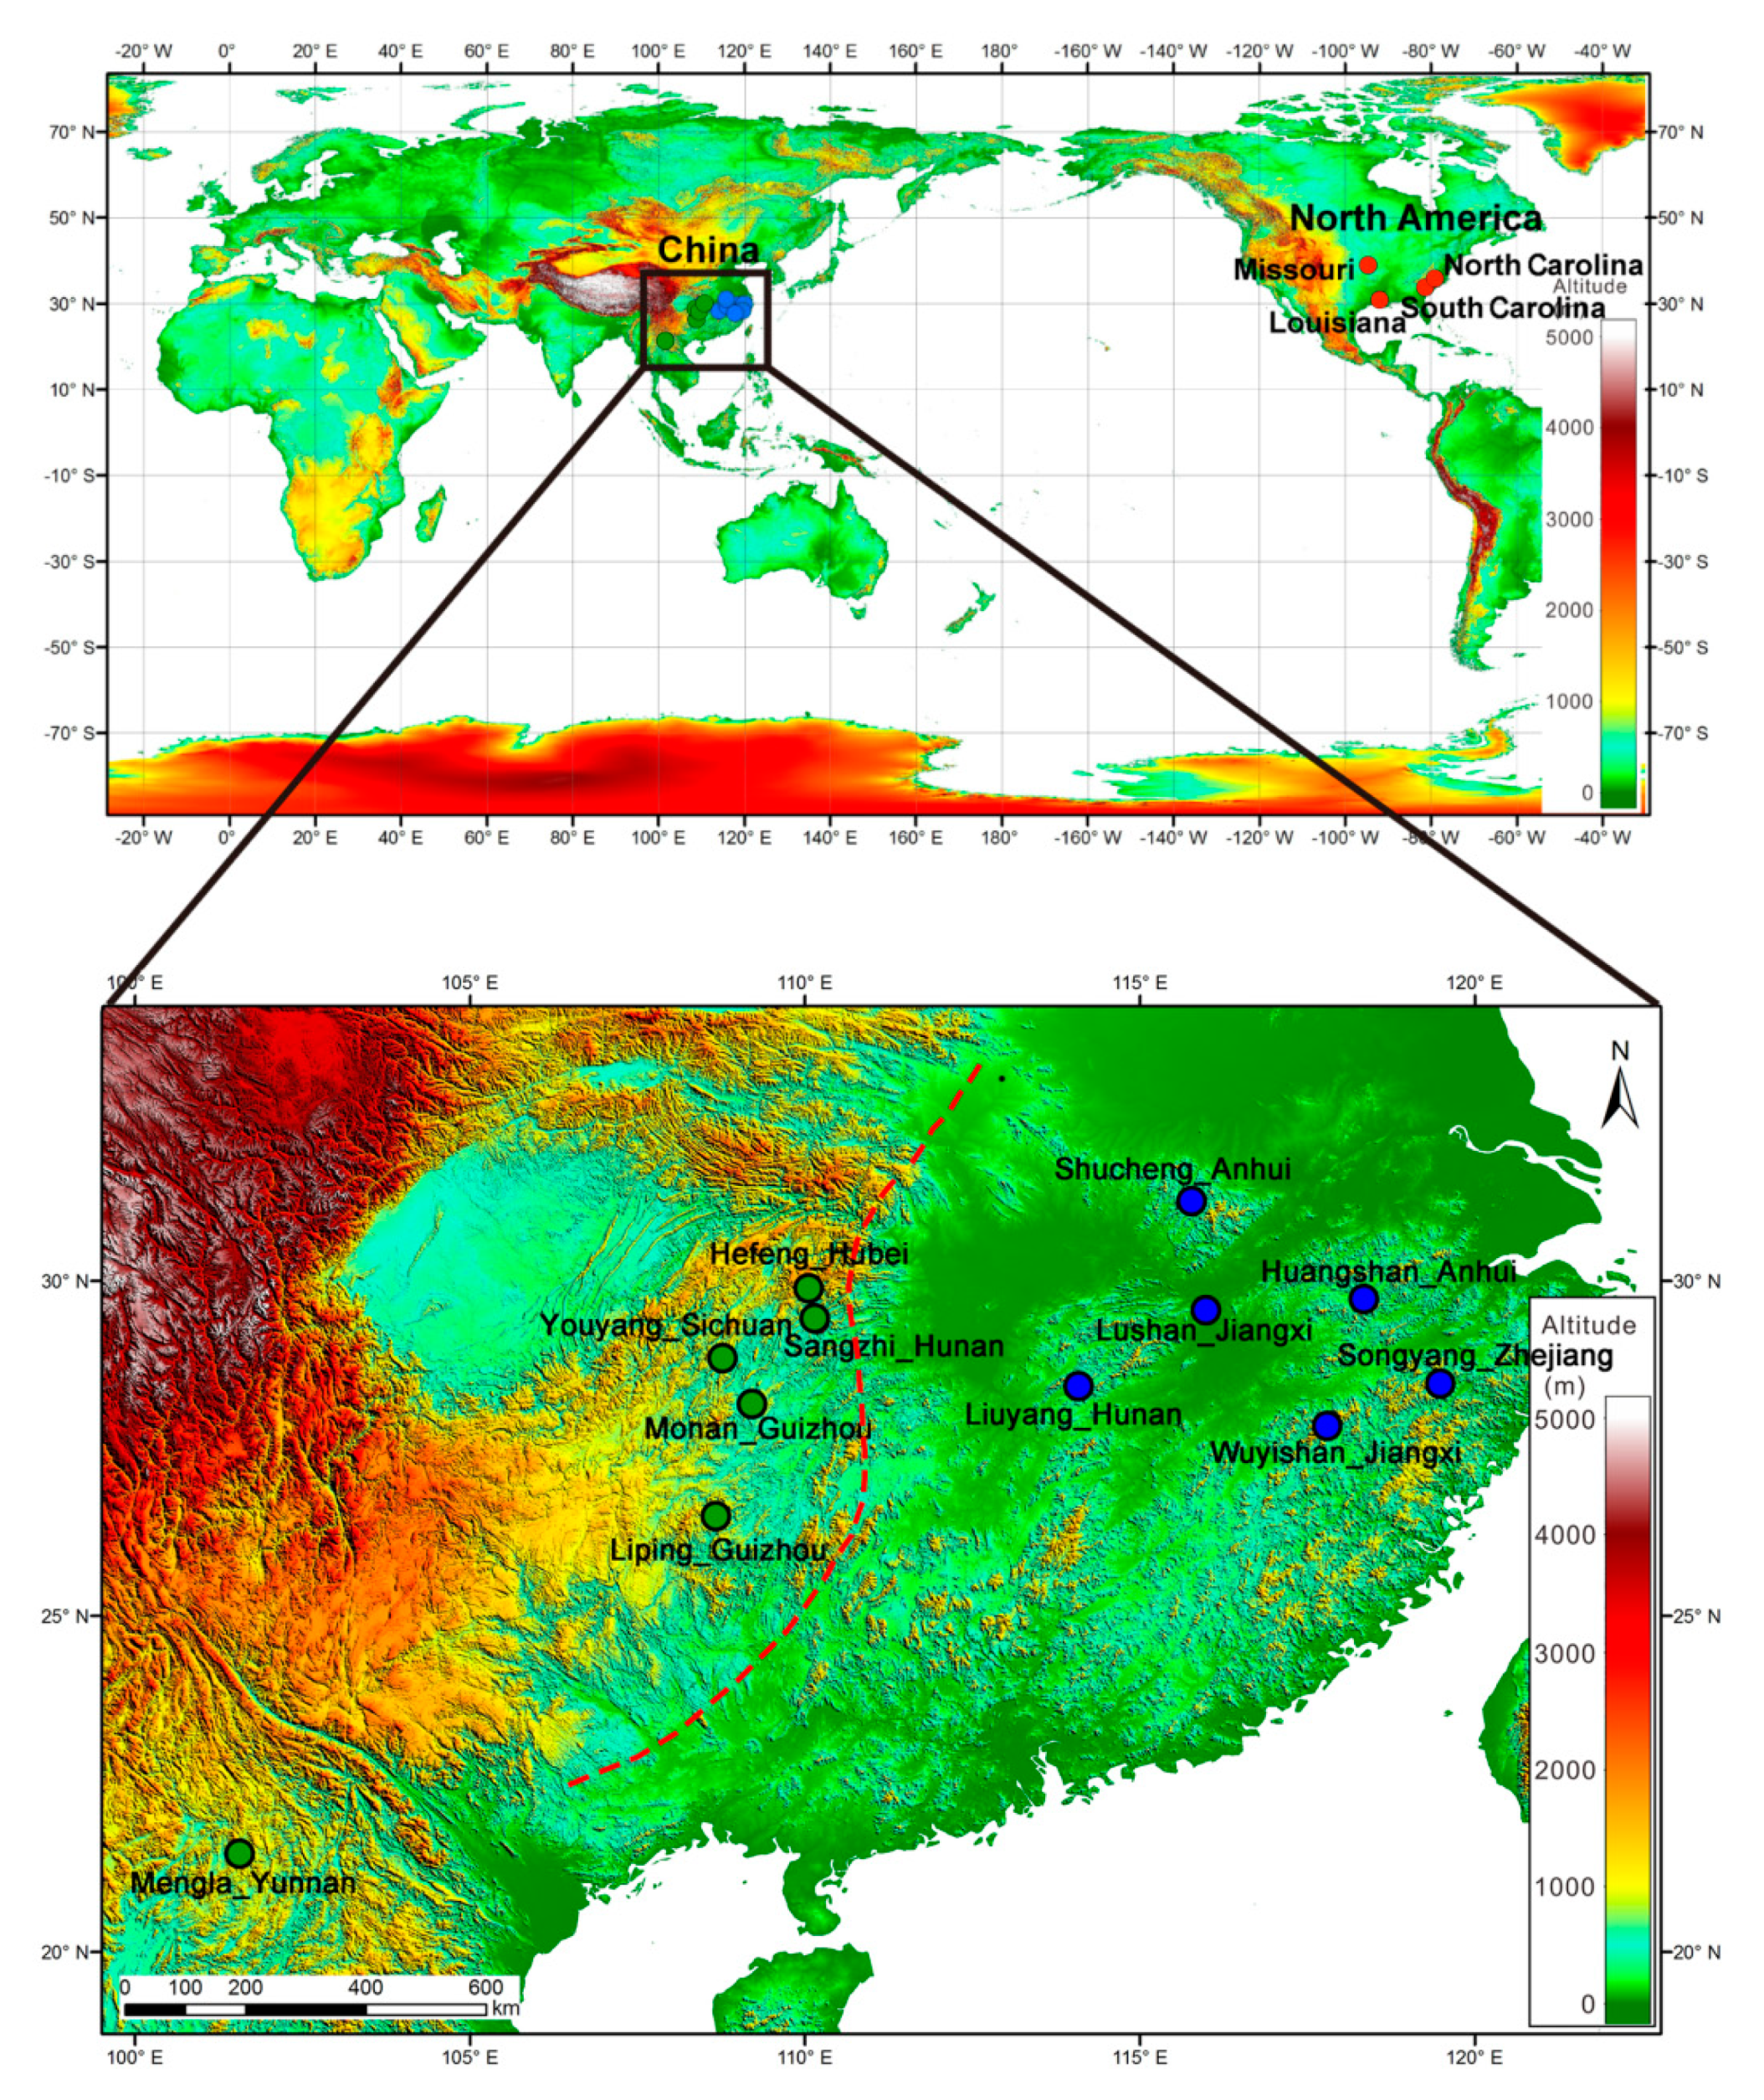
2.1. Sample Collection

Sixteen Liriodendron populations have been maintained in Fenyi, Jiangxi Province, China, since 1991 (Figure 1, Table S1). Of these, four are L. tulipifera populations, originating from Missouri, Louisiana, South Carolina, and North Carolina in the USA and obtained from the World Bank’s project management center of China’s forestry department in 1990. Twelve are L. chinense populations that were collected across the natural distribution in China, with six populations each from the eastern and western regions. The spatial distance between each individual was ≥50 m in order to reduce the probability of closely related samples. Fresh leaves from each individual were immediately frozen in liquid nitrogen and stored at −80 °C in November 2014.

2.2. RAD Sequencing, Reads Clustering, and SNP Calling

Genomic DNA was extracted using the cetyltrimethylammonium bromide (CTAB) method [31]. The concentration of DNA was determined using an ND-2000 spectrophotometer (NanoDrop, Wilmington, DE, USA) and diluted to 25 ng/μL. The RAD library was processed according to Baird et al. [32]. EcoRI was selected to cut the genomic DNA. Paired-end (125 bp) sequencing was performed with Illumina HiSeq2500 (Illumina, San Diego, CA, USA).
Stacks 1.44 [33] was implemented to preprocess the raw data. Raw sequence reads were demultiplexed, and only those reads with an unambiguous RAD site and the correct barcode were retained. All nucleotides with Phred quality score <20 were defined as “N”s, and any paired reads with a number of “N”s >10% were removed from further analyses. The reads were clustered into read tags (hereafter, RAD-tags) by sequence similarity using cd-hit-est version 4.6.8 [34] to reduce redundancies in quality-filtered read files (main parameters: -c 0.95 -n 10), allowing for a maximum of three mismatches. To obtain a reference genome, the reads of the population of Liping in Guizhou Province were used to generate consensus reduced genome sequences using VelvetOptimiser 2.2.5 [35] based on reads-clustering results (main parameters: -s 23 -e31 -x4). For each individual, reads were aligned to the reference genome using the Burrows–Wheeler alignment tool version 0.5.9 [36] with parameters “mem -t 4 -k 32 -M”. To obtain high-quality SNPs, the mapping quality score was set at ≥20 in SAM tools 1.8 [37]; only the base quality at this position passed the rank-sum test (p > 0.05), and those with no more than two haplotypes were retained. Finally, we retained a coverage depth of the SNP from 4× to 1000×, and the sites with <10% missing data were used for further analysis.

2.3. Phylogeny Construction

A neighbor-joining phylogenetic tree was constructed based on the p-distances between different populations. The p-distance between two individuals, i and j, was defined as:
D i j = 1 L i = 1 L d i j ( l ) d
where L is the length of the high-quality SNP regions, and the given alleles are A/C at position l, d i j ( l ) was set to 0 if the two individual genotypes were AA and AA; it was set to 0.5 if the two individual genotypes were AA and AC or AC and AC, and 1 if the two individual genotypes were AA and CC. The pairwise genetic distance based on the results of RAD-Seq was compared by t-tests and one-way ANOVAs in SPSS 13.0 (SPSS Inc., Chicago, IL, USA). The phylogenetic tree was constructed based on the distance matrix, calculated with PHYLIP 3.69 software [38].

2.4. Genetic Structure Analysis

We divided the Liriodendron populations into three groups based on their geographic locations: North America (NA), Eastern China (EC), and Western China (WC). All of the L. tulipifera populations were in the North America group, with the L. chinense populations being allocated to the two China groups. The Eastern and Western China groups were defined by the division of the western foothills region of China and the eastern plains of China, which is quite consistent with its geographical distribution pattern [10].
The isolation by distance (IBD) pattern was tested by regressing the genetic distance (estimated by the p-distance between different populations) against the natural logarithm of surface geographic distances in GenAlEx 6.5 [39] with 1000 matrix randomizations.
A principal component analysis (PCA) was performed with population-scale SNPs according to the procedure reported by Patterson et al. [40]. The eigenvector decomposition of the transformed genotype data was conducted using the eigen function in R, and the eigenvector significance was calculated with the Tracey–Widom test, which was implemented in the program twstats in the software EIGENSOFT 4.2 [40]. Furthermore, we investigated the population structure with Frappe software 1.1 [41], which allows for uncertainty in ancestral allele frequencies using SNP data with the maximum likelihood approach and the expectation-maximization algorithm. To explore the convergence of individuals, we predefined the number of genetic clusters from K = 2 to K = 5. The maximum iteration of the expectation-maximization algorithm was set to 10,000 in the Frappe analysis.
To identify genetic boundaries where genetic variation patterns changed abruptly, we computed the first three barriers by implementing the Monmonier maximum difference algorithm in BARRIER 2.2 [42].

3. Results

3.1. Sequencing Data Quality and Processing

The RAD sequencing generated 142,708,202 clean reads after quality filtering. The number of reads for each individual varied from 6,092,430 to 10,341,630 (Table S2). This variation was much smaller than in non-model species using RAD, such as bottle gourd [21] and Orestias fishes [43], which suggested a uniform quality and quantity for the input DNA. Unlike some RAD-based studies [21,43], the sequencing depth of each population was similar after grouping RAD reads into RAD-tags and ranged from 5.53× (Shucheng_Anhui) to 8.15× (Hefeng_Hubei). The SAM tools detected 163,703 to 393,215 unique SNPs in each population, which were used for further analyses (Table S2).

3.2. Phylogenetic Analysis

The genetic distance between L. tulipifera and L. chinense was the largest (0.452–0.498, Table 1, see details in Table S3) and was significantly higher than that within the two species (p < 0.01). We also found a high genetic distance between the EC and WC L. chinense groups (0.157–0.193, average 0.177). The genetic distance within L. tulipifera (0.121–0.135, average 0.127) was parallel to that within the EC L. chinense group (0.105–0.144, average 0.130), while both were significantly lower than the WC L. chinense group (0.153–0.172, average 0.161, p < 0.01). The WC L. chinense group showed a closer relationship with L. tulipifera than the EC group (genetic distance 0.465 vs. 0.486, p < 0.01, Table 1 and Table S3). The population from Liping (WC) showed the largest genetic divergence with L. tulipifera (0.490–0.498), and the population from Lushan (EC) showed the closest relationship with L. tulipifera (0.452–0.460) (Table S3).
To clearly reveal the genetic relationships between the studied populations, the average genetic distances were used to construct a neighbor-joining phylogenetic tree (Figure 2). Sixteen Liriodendron populations were divided into two distinct clades. The first clade included 12 L. chinense populations, which were further separated into two sub-clades: six EC populations (blue) and six WC populations (green). The other clade (red) contained four L. tulipifera populations from North America.

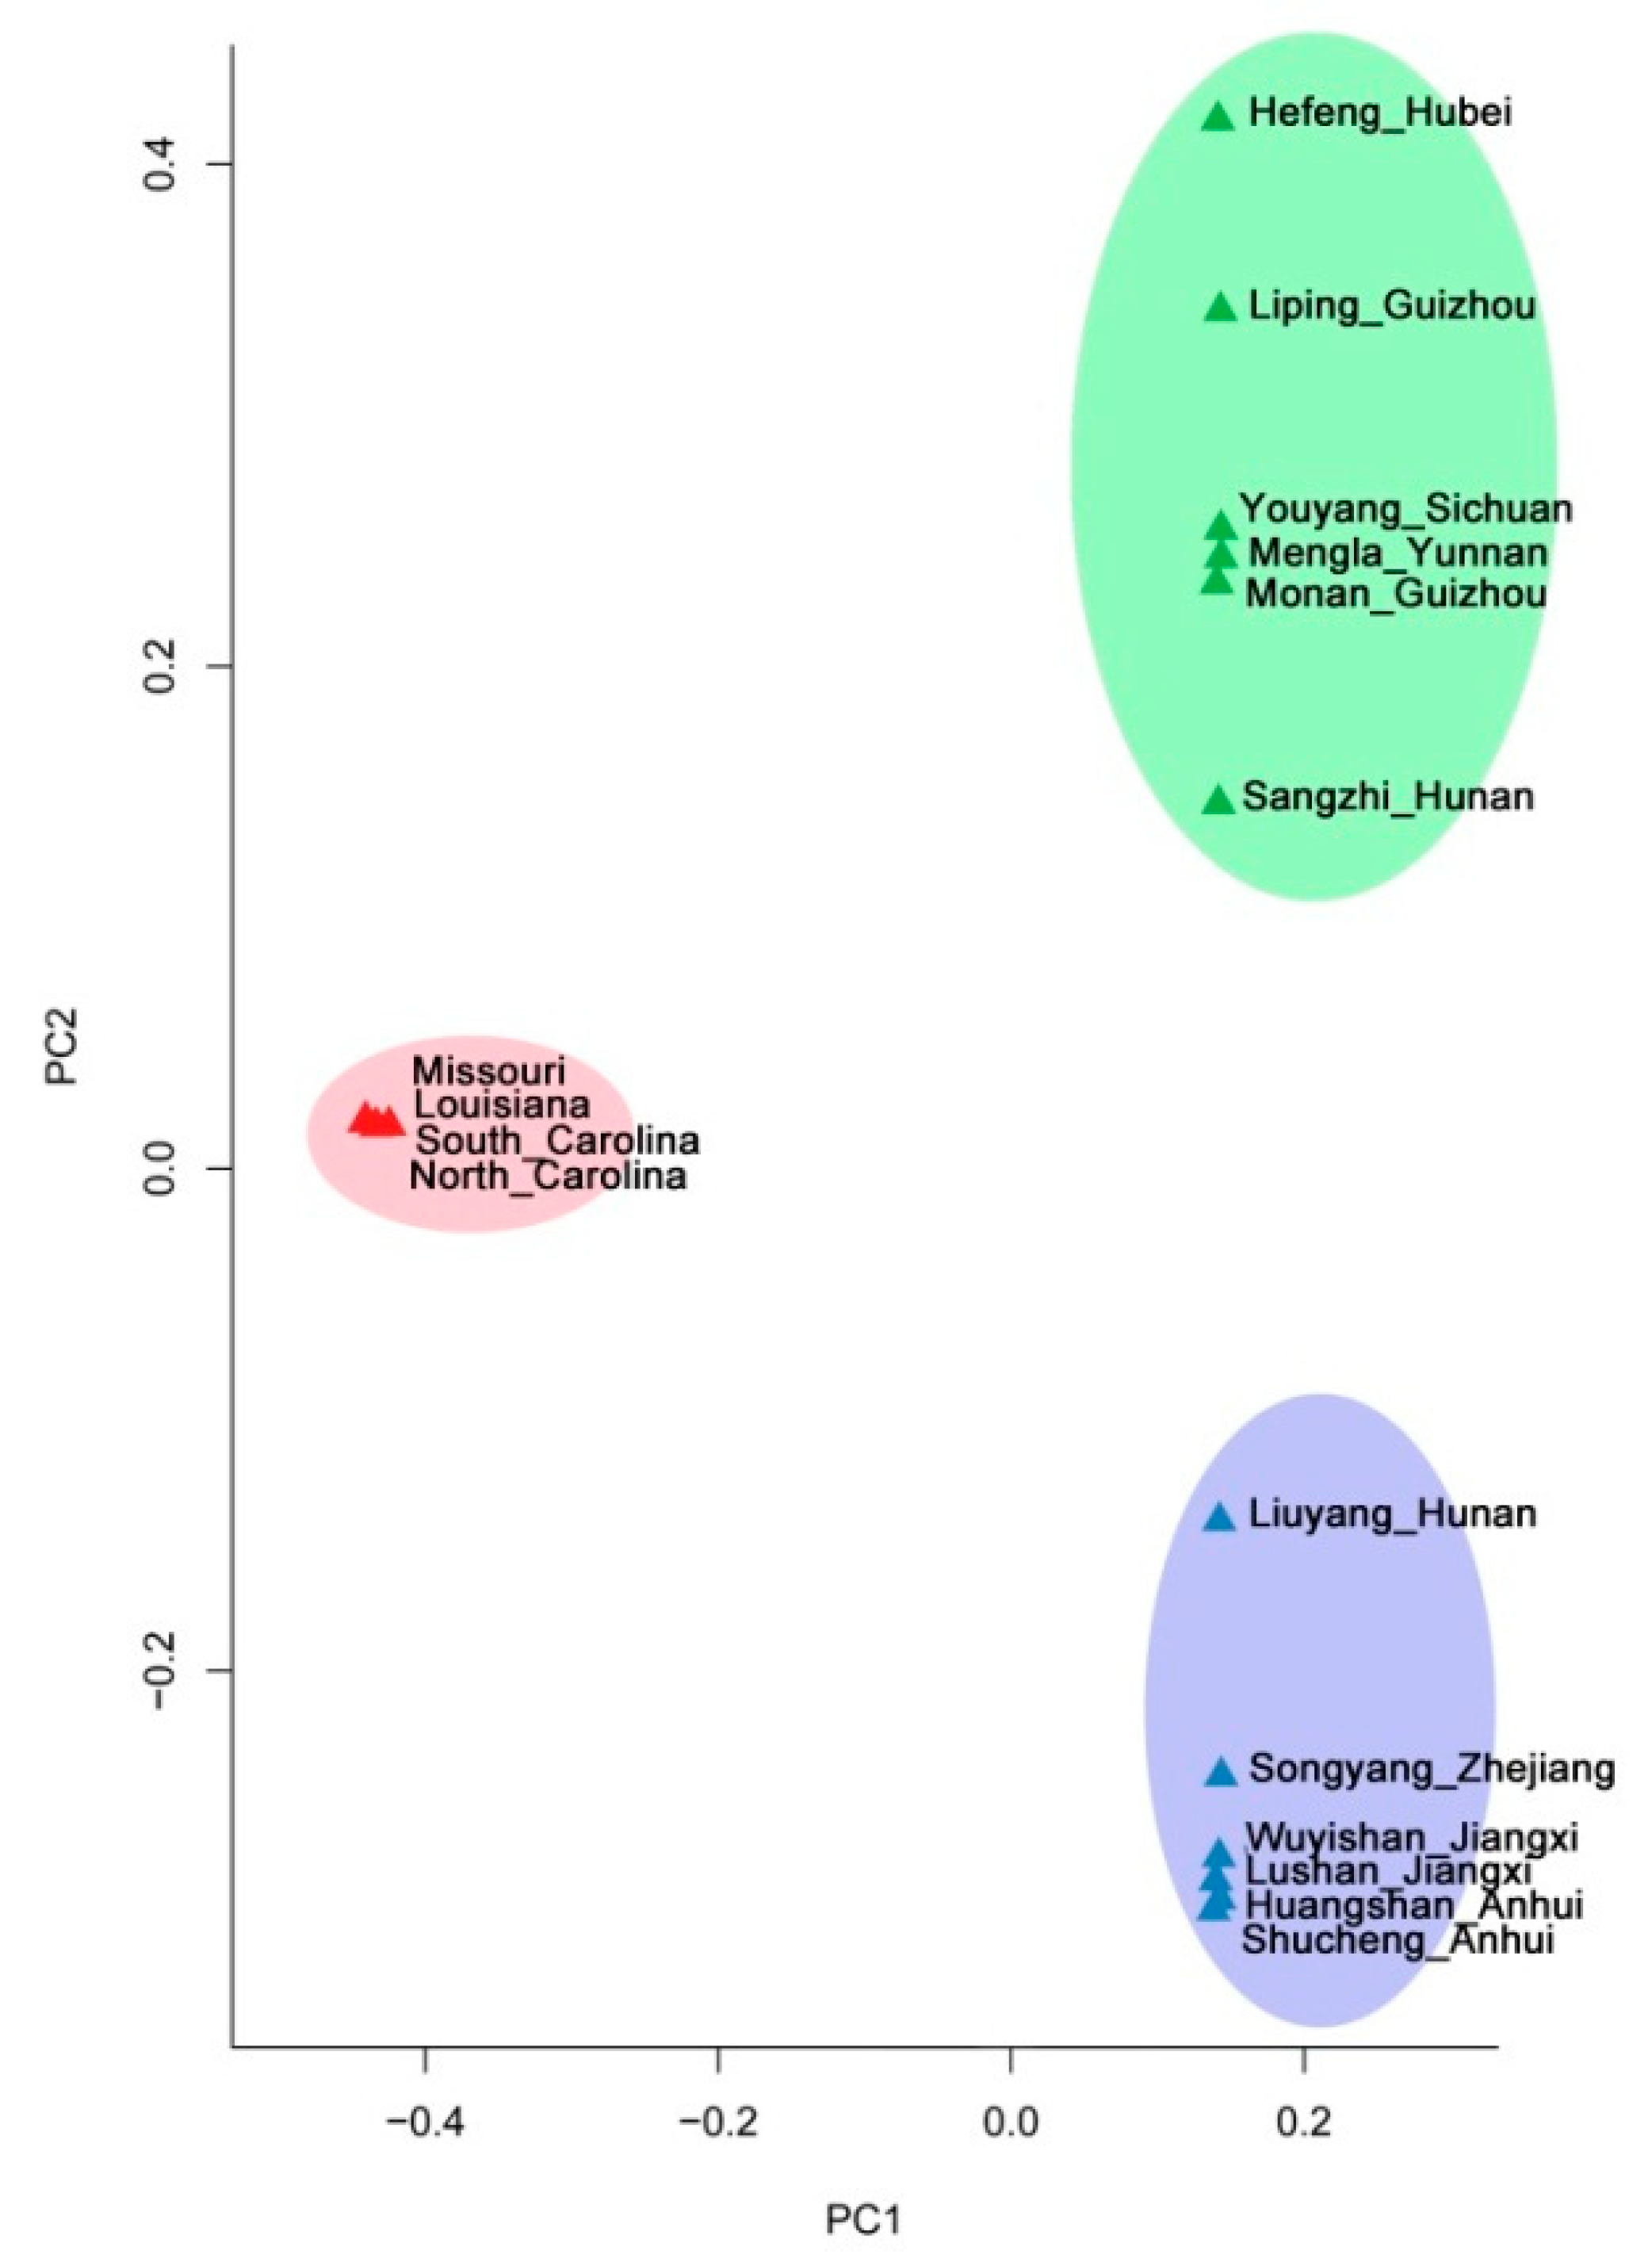
3.3. Population Structure Analyses

A significant correlation between the pairwise genetic distance and the natural logarithm of the surface geographic distances was detected by the Mantel test (Mantel r = 0.820, p = 0.001, Table 2), indicating a significant effect of isolation by distance (IBD) in the Liriodendron genus. We also identified a significant IBD effect in L. chinense as a whole (r = 0.566, p = 0.002) and in the EC group (r = 0.564, p = 0.006), but this was not detected in the WC group (Mantel r = −0.165, p = 0.439, Table 2).
The results of the principal coordinate analysis (Figure 3) were consistent with the neighbor-joining tree. All populations were divided into two groups, North America and eastern Asia, in the first axis, and then the EC and WC groups were clearly separated in the second axis. The two China groups seemed to be more dispersed (Figure 3), indicating higher genetic divergence.
Furthermore, we performed a population structure analysis using Frappe software, which estimates the individual ancestry and admixture proportions under an assumed K (the number of populations). We analyzed the data by increasing K from 2 to 5 (Figure 4). When K = 2, we detected a major division between the populations of North America and East Asia. For K = 3, the eastern Asia populations were further separated into the EC and WC groups. For K = 4, the population of Liuyang, located in the central region (Figure 1), split from the EC cluster. When K = 5, another population (Shucheng) located in the central region further separated from the EC cluster. Population clusters matched well with the groupings revealed by the phylogenetic tree (Figure 2) and were quite consistent with the geographical distribution pattern (Figure 1).
The results of the BARRIER test (Figure 5) identified the first genetic barrier between North America and eastern Asia, and the second genetic barrier between EC and WC (b). The third barrier isolated the Liping populations in Guizhou Province from other L. chinense populations (c).

4. Discussion

4.1. The Extensive Genetic Divergence in Liriodendron

Parks and Wendel suggested that the two Liriodendron species are considerably genetically differentiated; they shared the lowest genetic identity for a pair of sexually compatible species based on allozyme data and plastid genomes [8]. In the present study, we also found a significant genetic divergence in Liriodendron using RAD sequencing data. All of the sampled Liriodendron populations could be clearly separated into two groups (Figure 2) in agreement with their phenotypes and natural geographical isolation.
Liriodendron tulipifera has previously been thought to harbor higher genetic diversity and stronger genetic divergence than its sister counterpart [8]. Nevertheless, in contrast to previous reports, we found a larger genetic differentiation within L. chinense than L. tulipifera. This might largely be attributed to the scattered distribution pattern of L. chinense [10] induced by limited gene flow among natural populations [18] and the dispersed multiple mountain refugia [19], whereas L. tulipifera is a common and abundant tree plant throughout the majority of the southeastern United States [6]. Furthermore, the high climate and topography heterogeneity may be responsible for both the species and phylogenetic diversity being greater in eastern Asia than in eastern North America [5]. However, we must consider that L. chinense was more widely sampled and covered most of its natural distribution region, while the L. tulipifera populations were mainly collected from the “upland” group in the present study, whereas Parks et al. collected the L. tulipifera data from a much wider geographical area than the L. chinense data set [17].

4.2. Demarcations between Eastern and Western China for L. chinense

Compared with the obvious south and north divergence in L. tulipifera, a clear demarcation between the eastern and western Chinese populations of L. chinense was identified in the present study (Figure 2, Figure 3, Figure 4 and Figure 5). Hao proposed a “one belt and five islands” model to describe the geographic distribution pattern of L. chinense, emphasizing the fragmented distribution pattern in EC and the relatively continuous habitat in the WC [10]. Coincidentally, a significant correlation between genetic and geographical distances was confirmed throughout the whole range of L. chinense by our present research (Table 2) and by Li et al. [18]. Furthermore, we also identified a significant “isolation by distance” pattern in EC, where the L. chinense was sparsely distributed, indicating long-term spatial isolation and limited gene flow within EC, partially suggesting different genetic patterns between the EC and WC groups. Although not obvious, the genetic divergence of L. chinense between EC and WC was first noticed by Yang et al. using eight nSSR markers for 29 populations [19]. In the present study, a clear distinction and genetic barrier was found between the EC and WC groups of L. chinense (Figure 5). Moreover, from the EC to WC, there are large plains and obvious altitude changes bounded by the Wu Mountains, Wuling Mountains, and Yungui Plateau (Figure 1), presenting a natural geographic barrier. In addition, Hao et al. also showed that long-term reproductive isolation occurred between the EC and WC populations [10]. Taken together, these results suggest a clear demarcation between the populations of L. chinense.
Nevertheless, we must point out the existence of divergence in the southern range limits of L. chinense in some studies; for example, Li et al. suggested a variety of L. chinense in southern Yunnan Province [18]. Compared with the divergence of L. tulipifera in Florida caused by the phylogeographic history and local conditions [12,16,17], we argue that local adaptation and limited gene flow may largely account for the southern divergence of L. chinense. Firstly, this area is a tropical region, while a subtropical climate is present in most of the distribution regions. As has always been noticed, many deciduous species become almost evergreen in this tropical region, including L. chinense. Secondly, in our common garden experiments in Nanchang of Jiangxi Province (28.374° N, 116.019° E), we found that the young brunches of L. chinense in southern Yunnan populations were always green, even during the winter, while other L. chinense populations were brown, and L. tulipifera was dark brown. Different climate types may lead to special selection pressures on southern Yunnan populations. Accordingly, the local adaption of L. chinense along the latitude and climate gradients has been shown in L. chinense [44], and the Liriodendron tree in southern Yunnan Province showed probable genetic divergence when investigated by 14 potentially functional associated Expressed sequence tag–simple sequence repeat (EST-SSR) markers [18], whereas a previous phylogeographic study [19] and the present RAD-Seq results suggest that the southern Yunnan populations are genetically consistent with other western populations.
We argue that the results of RAD-Seq may reflect a neutral evolution history of Liriodendron, and the genetic demarcations between the EC and WC L. chinense populations suggest a background genetic structure inherited from its long history. The east–west demarcation pattern in L. chinense is also supported by phylogeographic study [19]. Furthermore, a recent study on 40 populations of L. chinense revealed an east–west split over the whole range of L. chinense using three cpDNA fragments [45]; this is coincidently consistent with the present results revealed by RAD-Seq data from the whole genome. Meanwhile, the distinct demarcation between EC and WC in L. chinense corresponds well with its geographic distribution pattern (c.f. [10]).

4.3. Genetic Relationship within Liriodendron

We found a significantly closer relationship between L. tulipifera and the WC group of L. chinense than with the EC group (Table 1 and Table S3). Although this is in conflict with previous knowledge supported both by the isoperoxidase [46] and leaf phenotype [10], we argue that the present markers of RAD-Seq from the whole genome of Liriodendron may provide more information than the previous isoperoxidase results, and the general pattern of leaf shapes still varies in both EC and WC. For example, the leaves from the Hefeng population (Figure 6B) in WC are a typical L. chinense type (Figure 6A), different to L. tulipifera (Figure 6D). Furthermore, the Liuyang population from the EC group has a foliar shape with the typical foliar character of both L. chinense and L. tulipifera. Populations from Liuyang, located in the Luoxiao Mountains, a relatively central region of L. chinense (Figure 1), formed a separate group when all of the Liriodendron populations (NA, WC, EC) were further divided (K = 4, Figure 4). This mountain region was previously reported to be an important glacial refugia for L. chinense, and populations there have a close relationship with L. tulipifera [19]. We also found the EC of L. chinense to be closely connected with L. tulipifera, as revealed by three cpDNA fragments [45]. Furthermore, the results of the RAD-Seq data aided in the classification and delineation of taxa with high morphological similarities and complex morphological variation [30]. Hence, the closer relationship between the EC group of L. chinense and L. tulipifera revealed by the present RAD-Seq data may also reflect its more ancient phylogeny relationship with L. tulipifera.

5. Conclusions

The analyses from the RAD-Seq data provided an effective strategy for phylogenetic research and the genetic structure investigation of Liriodendron, which has large and complex genomes but lacks reference genomes. Our results revealed a clear split between the two species of Liriodendron, and obvious genetic divergence between the eastern and western populations in L. chinense, a finding consistent with its geographic distribution pattern. We argue that the divergence in Liriodendron was induced by the phylogeographic history and further shaped by long-term geographical isolation. A closer relationship was found between L. tulipifera and the eastern populations of L. chinense, implying that the ancient origin of L. chinense was likely in the eastern China region. Collectively, the genomic information together with previous information will be beneficial for developing scientific strategies for the conservation and hybridization breeding of Liriodendron and for accelerating the utilization of the Liriodendron germplasm.

Supplementary Materials

The following are available online at https://www.mdpi.com/1999-4907/10/1/13/s1, Table S1: Locations of the 16 Liriodendron populations, Table S2: Summary statistics for all the populations of RAD-Seq data processing, Table S3: Pairwise comparisons of genetic distance among sixteen populations of Liriodendron as measured by p-distance.

Author Contributions

Conceptualization: Y.Z., A.Y., and F.Y.; Methodology: S.L. and Z.W. Software: L.L. and A.Y.; Validation: Y.L., S.L., and L.L.; Funding acquisition: Y.Z. and A.Y.; Investigation: Y.Z. and Y.L.; Resources: S.L. and Z.W.; Project administration: F.Y.; Writing—original draft: Y.Z. and A.Y.; Writing—review and editing: Y.Z., F.Y., and A.Y.

Funding

This research was funded by the National Natural Science Foundation of China (No. 31500460), the Foreign Science and Technology Cooperation Projects of Jiangxi Academy of Sciences (2014-H-002), the Construction of Advantage of Science and Technology Innovation Team of Nanchang City (2015CTXD005), the Jiangxi Academy of Sciences doctoral program (2014-YYB-03), and the Jiangxi Academy of Sciences Pratt & Whitney Project (2014-XTPH1-03).

Acknowledgments

We are grateful to Hongwei Li for his assistance in map-making. We also appreciate Enying Liu’s help in revising the manuscript and her constructive advice.

Conflicts of Interest

The authors declare no conflict of interest.

References

  1. Gray, A. Analogy between the flora of Japan and that of the United States. Am. J. Sci. Arts 1846, 2, 135–136. [Google Scholar]
  2. Wen, J. Evolution of Eastern Asian and Eastern North American disjunct distributions in flowering plants. Annu. Rev. Ecol. Syst. 1999, 30, 421–455. [Google Scholar] [CrossRef]
  3. Zhao, Y.; Qi, Z.; Ma, W.; Dai, Q.; Li, P.; Cameron, K.M.; Lee, J.; Xiang, Q.Y.; Fu, C. Comparative phylogeography of the Smilax hispida group (Smilacaceae) in eastern Asia and North America—Implications for allopatric speciation, causes of diversity disparity, and origins of temperate elements in Mexico. Mol. Phylogenet. Evol. 2013, 68, 300–311. [Google Scholar] [CrossRef]
  4. Zhu, W.-D.; Nie, Z.-L.; Wen, J.; Sun, H. Molecular phylogeny and biogeography of Astilbe (Saxifragaceae) in Asia and eastern North America. Bot. J. Linn. Soc. 2013, 171, 377–394. [Google Scholar] [CrossRef]
  5. Qian, H.; Jin, Y.; Ricklefs, R.E. Phylogenetic diversity anomaly in angiosperms between eastern Asia and eastern North America. Proc. Natl. Acad. Sci. USA 2017, 114, 11452–11457. [Google Scholar] [CrossRef] [Green Version]
  6. Parks, C.; Miler, N.; Wendel, J.; Mcdouglas, K. Genetic divergence within the genus Liriodendron (Magnoliaceae). Ann. Mo. Bot. Gard. 1983, 70, 658–666. [Google Scholar] [CrossRef]
  7. Nie, Z.-L.; Wen, J.; Azuma, H.; Qiu, Y.-L.; Sun, H.; Meng, Y.; Sun, W.-B.; Zimmer, E.A. Phylogenetic and biogeographic complexity of Magnoliaceae in the Northern Hemisphere inferred from three nuclear data sets. Mol. Phylogenet. Evol. 2008, 48, 1027–1040. [Google Scholar] [CrossRef] [Green Version]
  8. Parks, C.R.; Wendel, J.F. Molecular divergence between Asian and North American species of Liriodendron (Magnoliaceae) with implications for interpretation of fossil floras. Am. J. Bot. 1990, 77, 1243–1256. [Google Scholar] [CrossRef]
  9. Zhang, F.; Zhao, Y. Advance of study on Liriodendron. J. Yunnan Agric. Univ. 2005, 20, 697–701. [Google Scholar]
  10. Hao, R.-M.; He, S.-A.; Tang, S.-J.; Wu, S.-P. Geographical distribution of Liriodendron chinense in China and its significance. J. Plant Resour. Environ. 1995, 4, 1–6. [Google Scholar]
  11. Zhang, X.; Carlson, A.; Tian, Z.; Staton, M.; Schlarbaum, S.E.; Carlson, J.E.; Liang, H. Genetic characterization of Liriodendron seed orchards with EST-SSR markers. J. Plant Sci. Mol. Breed. 2015, 4, 1. [Google Scholar] [CrossRef]
  12. Sewell, M.; Parks, C.; Chasem, M. Intraspecific chloroplast DNA variation and biogeography of north American Liriodendron L. (Magnoliaceae). Evolution 1996, 50, 1147–1154. [Google Scholar] [CrossRef]
  13. Merkle, S.A.; Hoey, M.T.; Watson-Pauley, B.A.; Schlarbaum, S.E. Propagation of Liriodendron hybrids via somatic embryogenesis. Plant Cell Tissue Organ Cult. 1993, 34, 191–198. [Google Scholar] [CrossRef]
  14. Kim, S.; Koh, J.; Yoo, M.J.; Kong, H.; Hu, Y.; Ma, H.; Soltis, P.S.; Soltis, D.E. Expression of floral MADS-box genes in basal angiosperms: Implications for the evolution of floral regulators. Plant J. 2005, 43, 724–744. [Google Scholar] [CrossRef]
  15. Liang, H.; Carlson, J.E.; Leebens-Mack, J.H.; Wall, P.K.; Mueller, L.A.; Buzgo, M.; Landherr, L.L.; Hu, Y.; DiLoreto, D.S.; Ilut, D.C.; et al. An EST database for Liriodendron tulipifera L. floral buds: The first EST resource for functional and comparative genomics in Liriodendron. Tree Genet. Genomes 2008, 4, 419–433. [Google Scholar] [CrossRef]
  16. Fetter, K.C. Migration, adaptation, and speciation—A post-glacial history of the population structure, phylogeography, and biodiversity of Liriodendron tulipifera L. (Magnoliaceae). Diss. Theses Gradworks 2014, 62, 304–309. [Google Scholar]
  17. Parks, C.R.; Wendel, J.F.; Sewell, M.M.; Qiu, Y.-L. The significance of allozyme variation and introgression in the Liriodendron tulipifera complex (Magnoliaceae). Am. J. Bot. 1994, 81, 878–889. [Google Scholar] [CrossRef]
  18. Li, K.; Chen, L.; Feng, Y.; Yao, J.; Li, B.; Xu, M.; Li, H. High genetic diversity but limited gene flow among remnant and fragmented natureal populations of Liriodendron chinense Sarg. Biochem. Syst. Ecol. 2014, 54, 230–236. [Google Scholar] [CrossRef]
  19. Yang, A.; Dick, C.W.; Yao, X.; Huang, H. Impacts of biogeographic history and marginal population genetics on species range limits: A case study of Liriodendron chinense. Sci. Rep. 2016, 6, 25632. [Google Scholar] [CrossRef]
  20. Zhong, Y.D.; Zhang, X.; Li, Y.Q.; Liu, L.P.; Yu, F.X. Genome survey of Liriodendron chinense (Hemsl.) Sarg. Mol. Plant Breed. 2017, 15, 507–512. [Google Scholar]
  21. Xu, P.; Xu, S.; Wu, X.; Tao, Y.; Wang, B.; Wang, S.; Qin, D.; Lu, Z.; Li, G. Population genomic analyses from low-coverage RAD-Seq data: A case study on the non-model cucurbit bottle gourd. Plant J. Cell Mol. Biol. 2014, 77, 430–442. [Google Scholar] [CrossRef]
  22. You, F.M.; Huo, N.; Deal, K.R.; Gu, Y.Q.; Luo, M.-C.; McGuire, P.E.; Dvorak, J.; Anderson, O.D. Annotation-based genome-wide SNP discovery in the large and complex Aegilops tauschii genome using next-generation sequencing without a reference genome sequence. BMC Genomics 2011, 12, 59. [Google Scholar] [CrossRef]
  23. Novaes, E.; Drost, D.R.; Farmerie, W.G.; Pappas, G.J.; Grattapaglia, D.; Sederoff, R.R.; Kirst, M. High-throughput gene and SNP discovery in Eucalyptus grandis, an uncharacterized genome. BMC Genomics 2008, 9, 312. [Google Scholar] [CrossRef]
  24. Lai, J.; Li, R.; Xu, X.; Jin, W.; Xu, M.; Zhao, H.; Xiang, Z.; Song, W.; Ying, K.; Zhang, M.; et al. Genome-wide patterns of genetic variation among elite maize inbred lines. Nat. Genet. 2010, 42, 1027–1030. [Google Scholar] [CrossRef]
  25. Xu, X.; Liu, X.; Ge, S.; Jensen, J.D.; Hu, F.; Li, X.; Dong, Y.; Gutenkunst, R.N.; Fang, L.; Huang, L.; et al. Resequencing 50 accessions of cultivated and wild rice yields markers for identifying agronomically important genes. Nat. Biotechnol. 2012, 30, 105–111. [Google Scholar] [CrossRef]
  26. Hou, Y.; Nowak, M.D.; Mirre, V.; Bjora, C.S.; Brochmann, C.; Popp, M. RAD-seq data point to a northern origin of the arctic-alpine genus Cassiope (Ericaceae). Mol. Phylogenet. Evol. 2016, 95, 152–160. [Google Scholar] [CrossRef]
  27. Bateman, R.M.; Sramko, G.; Paun, O. Integrating restriction site-associated DNA sequencing (RAD-seq) with morphological cladistic analysis clarifies evolutionary relationships among major species groups of bee orchids. Ann. Bot. 2018, 121, 85–105. [Google Scholar] [CrossRef]
  28. Takahashi, T.; Nagata, N.; Sota, T. Application of RAD-based phylogenetics to complex relationships among variously related taxa in a species flock. Mol. Phylogenet. Evol. 2014, 80, 137–144. [Google Scholar] [CrossRef]
  29. Herrera, S.; Shank, T.M. RAD sequencing enables unprecedented phylogenetic resolution and objective species delimitation in recalcitrant divergent taxa. Mol. Phylogenet. Evol. 2016, 100, 70–79. [Google Scholar] [CrossRef] [Green Version]
  30. Zhou, W.; Ji, X.; Obata, S.; Pais, A.; Dong, Y.; Peet, R.; Xiang, Q.J. Resolving relationships and phylogeographic history of the Nyssa sylvatica complex using data from RAD-seq and species distribution modeling. Mol. Phylogenet. Evol. 2018, 126, 1–16. [Google Scholar] [CrossRef]
  31. Doyle, J.J.; Doyle, J.L. A rapid DNA isolation procedure for small amounts of fresh leaf tissue. Phytochem. Bull. 1987, 19, 11–15. [Google Scholar]
  32. Baird, N.A.; Etter, P.D.; Atwood, T.S.; Currey, M.C.; Shiver, A.L.; Lewis, Z.A.; Selker, E.U.; Cresko, W.A.; Johnson, E.A. Rapid SNP Discovery and Genetic Mapping Using Sequenced RAD Markers. PLoS ONE 2008, 3, e3376. [Google Scholar] [CrossRef]
  33. Catchen, J.M.; Amores, A.; Hohenlohe, P.; William, C.; Postlethwait, J.H. Stacks: Building and Genotyping Loci De Novo from Short-Read Sequences. Genes Genomes Genet. 2011, 1, 171–182. [Google Scholar] [CrossRef]
  34. Li, W.; Godzik, A. Cd-hit: A fast program for clustering and comparing large sets of protein or nucleotide sequences. Bioinformatics 2006, 22, 1658–1659. [Google Scholar] [CrossRef]
  35. Zerbino, D.R. Using the Velvetde novoassembler for short-readsequencing technologies. Curr. Protoc. Bioinf. 2010, 31, 11.5.1–11.5.12. [Google Scholar]
  36. Li, H.; Durbin, R. Fast and accurate short read alignment with Burrows-Wheeler transform. Bioinformatics 2009, 25, 1754–1760. [Google Scholar] [CrossRef] [Green Version]
  37. Li, H.; Handsaker, B.; Wysoker, A.; Fennell, T.; Ruan, J.; Homer, N.; Marth, G.; Abecasis, G.; Durbin, R. The Sequence Alignment/Map format and SAMtools. Bioinformatics 2009, 25, 2078–2079. [Google Scholar] [CrossRef] [Green Version]
  38. Retief, J.D. Phylogenetic analysis using PHYLIP. Methods Mol. Biol. 2000, 132, 243–258. [Google Scholar]
  39. Peakall, R.; Smouse, P.E. GenAlEx 6.5: Genetic analysis in Excel. Population genetic software for teaching and research—An update. Bioinformatics 2012, 28, 2537–2539. [Google Scholar] [CrossRef]
  40. Patterson, N.; Price, A.L.; Reich, D. Population structure and eigenanalysis. PLoS Genet. 2006, 2, e190. [Google Scholar] [CrossRef]
  41. Tang, H.; Peng, J.; Wang, P.; Risch, N.J. Estimation of Individual Admixture: Analytical and Study Design Considerations. Genet. Epidemiol. 2005, 28, 289–301. [Google Scholar] [CrossRef]
  42. Manni, F.; Guerard, E.; Heyer, E. Geographic patterns of (genetic, morphologic, linguistic) variation: How barriers can be detected by using Monmonier’s algorithm. Hum. Biol. 2004, 76, 173–190. [Google Scholar] [CrossRef]
  43. Takahashi, T.; Moreno, E. A RAD-based phylogenetics for Orestias fishes from Lake Titicaca. Mol. Phylogenet. Evol. 2015, 93, 307–317. [Google Scholar] [CrossRef] [PubMed]
  44. Yang, A.; Wei, N.; Fritsch, P.W.; Yao, X. AFLP genome scanning reveals divergent selection in natural populations of Liriodendron chinense (Magnoliaceae) along a latitudinal transect. Front. Plant Sci. 2016, 7, 698. [Google Scholar] [CrossRef] [PubMed]
  45. Yang, A.; Zhong, Y.; Liu, S.; Liu, T.; Liu, L.; Li, Y.; Yu, F. New insight into the phylogeographic pattern of Liriodendron chinense (Magnolicaceae) revealed by chloroplast DNA: East–west lineage split and genetic mixture within western subtropical China. Peer J. 2018. under review. [Google Scholar]
  46. He, S.A.; Santamour, F.S. Isoenzyme Verification of American-Chinese Hybrids of Liquidambar and Liriodendron. Ann. Mo. Bot. Gard. 1983, 70, 748–749. [Google Scholar] [CrossRef]
Figure 1. Geographical distribution of the plant materials. Solid dots indicate the populations that were collected worldwide, and the red dashed line represents the line that divides the eastern plains region and the western foothills region, which we used to divide the Eastern and Western China groups. Populations in the Eastern and Western China groups are indicated by blue and green dots, respectively.
Forests 10 00013 g001
Figure 2. Neighbor-joining phylogenetic tree of Liriodendron based on all single nucleotide polymorphisms (SNPs), with the evolutionary distances measured by p-distances with PHYLIP. The populations from different geographic locations were colored as red (North America), blue (Eastern China), and green (Western China).
Forests 10 00013 g002
Figure 3. The principal coordinate analysis of Liriodendron populations using all identified SNPs as markers. The icon for each population was colored as red (North America), blue (Eastern China), and green (Western China).
Forests 10 00013 g003
Figure 4. Population structure of Liriodendron using Frappe software 1.1. Each color represents one cluster. Each population is represented by a vertical bar, and the length of each colored segment in each vertical bar represents the proportion contributed by ancestral populations.
Forests 10 00013 g004
Figure 5. The first three genetic barriers in Liriodendron projected by BARRIER 2.2. The red lines with two opposite arrows indicate the barriers (a–c).
Forests 10 00013 g005
Figure 6. Leaf shape variation in juvenile foliage of Liriodendron. The leaf shapes of L. chinense (A); Hefeng, Hubei population (B); Liuyang, Hunan population (C); and L. tulipifera (D).
Forests 10 00013 g006
Table 1. Pairwise genetic distances between three regions of Liriodendron based on the results of restriction site-associated DNA sequencing (RAD-Seq).
GroupEastern ChinaWestern ChinaNorth America
Eastern China0.130 a0.177 c0.465 d
Western China 0.161 b0.486 e
North America 0.127 a
a–e: Duncan’s group in one-way ANOVA tests.
Table 2. Results of the Mantel test of the genetic distance versus the geographic distances.
Grouprp
Liriodendron0.8200.001
L. tulipifera0.3110.290
L. chinense0.5660.002
Eastern China0.5640.006
Western China−0.1650.439

