An RNA Sequencing Transcriptome Analysis and Development of EST-SSR Markers in Chinese Hawthorn through Illumina Sequencing

1
Beijing Key Laboratory of Ornamental Germplasm Innovation and Molecular Breeding, China National Engineering Research Center for Floriculture, College of Landscape Architecture, Beijing Forestry University, Beijing 100083, China
2
College of Horticulture, Shenyang Agricultural University, Shenyang 110866, China
3
Plant Research Institute, Beijing Botanical Garden, Beijing 100094, China
*
Author to whom correspondence should be addressed.
Forests 2019, 10(2), 82; https://doi.org/10.3390/f10020082
Submission received: 6 December 2018
/
Revised: 15 January 2019
/
Accepted: 18 January 2019
/
Published: 22 January 2019
(This article belongs to the Special Issue Genetic Diversity of Tree Species in Forest and Conservation Management)
Abstract
:Chinese hawthorn (Crataegus pinnatifida) is an important ornamental and economic horticultural plant. However, the lack of molecular markers has limited the development and utilization of hawthorn germplasm resources. Simple sequence repeats (SSRs) derived from expressed sequence tags (ESTs) allow precise and effective cultivar characterization and are routinely used for genetic diversity analysis. Thus, we first reported the development of polymorphic EST-SSR markers in C. pinnatifida with perfect repeats using Illumina RNA-Seq technique. In total, we investigated 14,364 unigenes, from which 5091 EST-SSR loci were mined. Di-nucleotides (2012, 39.52%) were the most abundant SSRs, followed by mono- (1989, 39.07%), and tri-nucleotides (1024, 20.11%). On the basis of these EST-SSRs, a total of 300 primer pairs were designed and used for polymorphism analysis in 70 accessions collected from different geographical regions of China. Of 239 (79.67%) pairs of primer-generated amplification products, 163 (54.33%) pairs of primers showed polymorphism. Finally, 33 primers with high polymorphism were selected for genetic diversity analysis and tested on 70 individuals with low-cost fluorescence-labeled M13 primers using capillary electrophoresis genotyping platform. A total of 108 alleles were amplified by 33 SSR markers, with the number of alleles (Na) ranging from 2 to 14 per locus (mean: 4.939), and the effective number of alleles (Ne) ranging from 1.258 to 3.214 (mean: 2.221). The mean values of gene diversity (He), observed heterozygosity (Ho), and polymorphism information content (PIC) were 0.524 (range 0.205–0.689), 0.709 (range 0.132–1.000), and 0.450 (range 0.184–0.642), respectively. Furthermore, the dendrogram constructed based on the EST-SSR separated the cultivars into two main clusters. In sum, our study was the first comprehensive study on the development and analysis of a large set of SSR markers in hawthorn. The results suggested that the use of NGS techniques for SSR development represented a powerful tool for genetic studies. Additionally, fluorescence-labeled M13 markers proved to be a valuable method for genotyping. All of these EST-SSR markers have agronomic potential and constitute a scientific basis for future studies on the identification, classification, and innovation of hawthorn germplasms.
1. Introduction
The plants from genus Crataegus L., commonly known as hawthorn, a member of the Rosaceae family, have a wide distribution in the temperate regions of the northern hemisphere in Europe, Asia, and North America [1]. Hawthorn has considerable economic, ecological, and ornamental value, making it an important horticultural crop worldwide [2,3]. Therefore, hawthorn has a wide spectrum of uses. Some species are cultivated for their edible fruits, which have abundant contents of flavonoids, procyanidins, and vitamin C [4]. Some species with significant pharmaceutical value are well documented and widely used in traditional Chinese medicine [5,6]. Meanwhile, others are cultivated as landscape plants for ornamental purposes, such as Crataegus laevigata ‘Paul’s Scarlet’. Moreover, they are of great importance in nature and important for wildlife, as the fruit is also consumed by birds and mammals, and the dense branches offer good nesting sites for birds [2,3].
As one of the origin and cultivation centers of hawthorn, China has more than 1000 years of history of collecting and cultivating hawthorns [7]. Although a total of 18 species and 6 variations have been identified and confirmed [8], valuable hawthorn cultivars mainly originated from four species: Crataegus pinnatifida Bunge, Crataegus hupehensis Sarg., Crataegus scabrifolia (Franch.) Rehder, and Crataegus bretschnederi. The leading cultivated species by far is C. pinnatifida, and its variation Crataegus pinnatifida Bge. var. major N.E.Br., which is indigenous to northern China, large fruited (6–17 g), and represented by more than 100 cultivars [9,10,11]. The cultivar classification system of C. pinnatifida was based on the color of fruit and divided into red fruit cultivar group, orange fruit cultivar group, and yellow fruit cultivar group [8]. However, the genomic and molecular research studies on hawthorn have lagged behind those on other horticultural crops, such as apples (Malus × domestica) [12], pears (Pyrus sp.) [13], Ussurian pears (Pyrus ussuriensis) [14], and cherries (Prunus sp.) [15], which hindered the development and utilization of hawthorn. The coming research efforts should be focused on these.
Currently, molecular characterization is a favored way to quantify variation within germplasms. A number of efforts have been made to assess hawthorn genetic resources, mainly using random amplified polymorphism DNA (RAPD) [10,16,17,18,19,20,21,22,23] and inter-simple sequence repeats (ISSR) [10,16,24,25,26,27,28]. Moreover, sequence related amplified polymorphism (SRAP) [29] markers, inter-retrotransposon amplified polymorphism (IRAP) [26], and start codon targeted (SCoT) polymorphism [26,28] have been developed and used successfully for investigation of genetic characterization of hawthorns. Among dozens of markers, microsatellites, also known as simple sequence repeats (SSRs) or short tandem repeats (STRs), have gained considerable popularity in genetic diversity studies because of its codominant inheritance, reproducibility, relative abundance, extensive genome coverage, chromosome specific location, and high throughput genotyping [30].
Traditionally, there are two approaches to develop SSR primers: testing known SSR primers already developed for related species, or constructing a genomic library and developing SSRs from next generation sequencing (NGS) technologies [31]. Dickinson et al. [32] used the former method to select 23 microsatellite loci from Malus × domestica [33] for preliminary primer testing in Crataegus section Douglasianae. In total, 9 of these 23 loci proved to be variable in a larger sample of Crataegus [34,35]. Lo et al. [35] selected 13 SSR markers from Malus × domestica, which were shown by Liebhard et al. [33] to be transferable to Crataegus. These SSR markers, together with chloroplast microsatellites, were used to compare population structure and genetic variability in two closely related taxa (Crataegus douglasii Lindl. and Crataegus suksdorfii (Sarg.) Kruschke). Based on the results of Lo et al. [35], 13 SSR markers were tested for population genetic and structure analysis of Tunisian Azarole (Crataegus azarolus L. var. aronia (Willd.) Batt.) by Khiari et al. [36]. Brown et al. [2] firstly applied SSR markers to examine patterns of genetic diversity in Crataegus monogyna Jacq., which is a key component of hedgerows. All eight SSR markers were originally developed from Malus × domestica [33], and seven of them had previously been used by Lo et al. [35]. According to Emami et al. [28], 11 SSR markers, also selected form the report of Lo et al. [35], used to assess the genetic variation that exists in the 6 hawthorn species in Iran. Likewise, Betancourt-Olvera et al. [3] used 7 SSR markers (from Lo et al. [35]) to access the biodiversity of tejocote (hawthorn) in Mexico. As for Chinese hawthorn species, Zhang et al. [37] assessed the interspecific genetic relationship using 10 apple SSR primers. Therefore, all these markers were designed from related species, that is, apple (Malus × domestica), and tested in Crataegus sp. with positive results in previous research. They have been successfully used to distinguish between species and detect the genetic diversity and structure of hawthorn germplasms. However, not all primers developed in Malus are transferable to Crataegus (Liebhard et al. [33]), and it is too costly to test all the primers [35]. Only a very limited number of primers can be developed by this method, and some new methods should be explored as an alternative.
As high-throughput technology and NGS methods have been developed, it has paved the way for the large-scale discovery of genetic markers at reduced prices and in less time than the traditional methods (develop from related species) and Sanger sequencing, or the “first-generation sequencing”, which are both no longer utilized for SSR development [31]. De novo transcriptome sequencing (RNA-Seq) as a simple, straightforward, and reliable approach has been applied for SSR development in many species, even in non-model plant populations with limited background genetic information [38]. For RNA-Seq, four technologies (Roche 454, Illumina, Helicos BioSciences and Life Technologies) are generally used, among which Illumina is the most widely utilized NGS platform [39,40,41].
Dai et al. [11] reported the first application of Illumina-based RNA-Seq technology for transcriptome studies in soft and hard endocarp hawthorns (C. pinnatifida) in 2013. Yang et al. [42] used RNA-seq analysis identified numerous candidate genes involved in the hawthorn (C. pinnatifida) biosynthesis of polyphenolic compounds. Xu et al. [43] used RNA-Seq analysis to study soft and hard flesh textures in hawthorn (C. pinnatifida) fruits. All these research studies aided the studies on the development of expressed sequence tag SSRs (EST-SSRs), which are located in the flanking coding region and identified from transcribed RNA sequence, while the genomic SSRs (g-SSRs) are identified from random genomic sequences [44]. In contrast to g-SSRs, EST-SSRs are more likely to be conserved across species, resulting in high levels of transferability [38,45].
Once the EST-SSRs have been produced, genotyping can begin. SSR locus can be identified by agarose gel (AGE) or polyacrylamide gel electrophoresis (PAGE). However, both of them are laborious and time-consuming. Fortunately, a powerful alternative method has been developed to facilitate genotyped polymerase chain reaction (PCR) multiplexing by capillary electrophoresis (CE), such as the fluorescent-labeled M13 primer method proposed by Oetting et al. [46] and enhanced by Schuelke et al. [47]. In this method, the reaction is performed as a multiplexed PCR with three primers—a sequence-specific forward primer with universal primer M13 (TGTAAAACGACGGCCAGT) tail at its 5′ end, a sequence-specific reverse primer, and the fluorescent-labeled universal primer M13. Fluorescent-labeled M13-SSR markers have advantages of high-throughput and high accuracy, which have been successfully used in peanut (Arachis hypogaea L.) [48], wheat (Triticum aestivum L.) [49], Ussurian pear (Pyrus ussuriensis Maxim.) [14], Chinese bayberry (Myrica rubra Siebold & Zucc.) [50], and cranberry (Vaccinium macrocarpon Aiton) [51].
So far, no previous reports about EST-SSR markers are available in this genus. Also, no report has yet been published on genetic diversity assessment of cultivars of C. pinnatifida and other hawthorn species present in China using molecular markers. The deficiencies in the study on molecular variation in cultivated hawthorn are somewhat surprising, since it is an efficient tool for genetic analysis.
Thus, the present study is part of an effort to (1) further explore the benefit of RNA-Seq for SSR development in combination with M13-labeled SSR primers, (2) detect the polymorphic SSR markers for Chinese hawthorn cultivars, (3) assess the genetic diversity among selected Chinese hawthorn cultivars using EST-SSRs, and (4) provide baseline information for identification, classification, and utilization of the germplasm resources of the hawthorn.
2. Materials and Methods
2.1. Plant Material and DNA Extraction
A collection of 70 Chinese hawthorn cultivars (C. pinnatifida) was obtained from the National Hawthorn Germplasm Repository of China (Shenyang, China) and Institute of Forestry and Pomology, Beijing Academy of Agricultural and Forestry Sciences (Beijing, China), as summarized in Supplementary Table S1. These cultivars were chosen because they were diploid (2n = 34) and representative samples currently used in China. Fresh and young leaves were dried on silica gel and then ground into fine powder with liquid nitrogen. The powders were preserved at −80 °C refrigerator. Genomic DNA of each cultivar was extracted from 30 mg of leaf powders using DNAsecure Plant kit (DP320, Tiangen Biotech Co., Beijing, China) according to the manufacturer’s instructions with minor modifications. The DNA quality and quantity were evaluated on agarose gel (1.0%) and Quawell Q5000 (Quawell Technology Inc., San Joes, CA, USA). All DNA samples were subsequently diluted to 30 ng/μL, which was the working concentration for PCR, and stored at −20 °C for further use.
2.2. EST-SSR Mining from RNA-Seq and Primer Design
In the previous research, an RNA-Seq experiment was conducted using Illumina HiSeq 2500 by Xu and Dong [43]. The accession number was PRJNA339788. Based on these sequencing data, EST-SSRs were detected and mined among the unigenes with length >1000 bp using the MIcroSAtellite (MISA; http://pgrc.ipk-gatersleben.de). Seven types of microsatellites were investigated. The parameters were set as follows: the SSRs were considered to contain mono-, di-, tri-, tetra-, penta- and hexa-nucleotides with minimum repeat numbers of 10, 6, 5, 5, 5, and 5, respectively. As for the compound SSRs, there were at most 100 bases between two SSRs. Unigenes with a sequence of more than 150 bp before and after the SSR region were used for primer design by Primer v3.0.
2.3. Primer Selection and PCR Amplification
The criteria for primer selection referred to Du [52]. A total of 300 primers were selected according to the conditions of the base repeat type (di-nucleotide was preferred), the annealing temperature of 50–60 °C, with an optimum of 55 °C, and similar content of GC% in a range of 40%–60%. The primer size was set from 18 to 24 bp, with an optimum of 20 bp, and the expected PCR product size of the primers from 100 to 300 bp [53]. All primers performed in PCR reactions were synthesized by Sangon Biotech Co., Shanghai, China.
The PCR reaction system was performed in 20 μL volumes containing 2 μL of template DNA, 10 μL of 2× Taq PCR MasterMix (Aidlab Biotechnologies Co., Beijing, China), 1 μL of 10 μM each primer, and 6μL double distilled water. The following PCR program included an initial step at 95 °C for 3 min followed by 35 cycles of 95 °C for 30 s, the appropriate annealing temperature for 30 s, and 40 s at 72 °C, and a final extension for 5 min at 72 °C. Finally, the products were examined on 1% agarose gel. In addition, DL500 DNA marker (3590A, Takara Biotech Co., Beijing, China) was used to determine the sizes of the PCR products.
After PCR testing, primer pairs, which amplified distinct, reproducible, and strong bands with expected size, were selected for polymorphic screening using 8% non-denaturing PAGE in 1 × TBE buffer and then detected by silver staining. The pBR322 DNA/Mspl marker (MD206, Tiangen Biotech Co., Beijing, China) was used to identify alleles.
2.4. Fluorescent-Labeled M13-SSR Markers and Capillary Electrophoresis
From these effective primers that amplified bands with the expected sizes and high polymorphism, new forward primers were designed with an M13 tail on the 5′ end. The multiplexed PCR reactions consist of three primers, among which the M13-labeled universal primer was alternatively labeled with the following four fluorescent dyes: FAM (blue), HEX (green), TAMRA (yellow), and ROX (red). All the primers were synthesized from Sangon Biotech (Shanghai, China).
The 33 EST-SSRs were amplified in individual reactions in 20 μL, 10 μl of 2× Taq PCR MasterMix (Aidlab Biotechnologies Co., Beijing, China), 2 μL of template DNA, 0.2 μL M13-tailed forward primer, 0.2 μL the reverse primer, 0.4 μL fluorescently labeled M13 primer, and 7.2 μL double distilled water. The PCR was performed with 5 min denaturation at 95 °C, followed by 20 cycles of denaturing at 95 °C for 30 s, annealing for 30 s at 56 °C, elongation at 72 °C for 30 s, 15 cycles at 95 °C for 30 s, 53 °C (the annealing temperature of the fluorescent-labeled M13 primer) for 30 s, 72 °C for 30 s, and an extra elongation at 72 °C for 5 min.
Finally, the separation and identification of alleles by CE was detected on an ABI PRISM 3730XL DNA Analyzer (Applied Biosystems, Foster, CA, USA). The amplified PCR products were separated and recorded automatically as individual GeneScan files. Sizes and peaks were calibrated automatically against the ROX-500 size standards.
2.5. Data Analysis
The original data from ABI platform, with a FSATA file format, were analyzed by Gene Mapper v3.2 (Applied Biosystems, Foster, CA, USA). Then, the peak feature and fragment size of the corresponding peaks were obtained and the fragment size was transferred onto alleles and formatted as an Excle file. Aberrant peaks were not scored. MicroSatellite tools (MS tools) were used to obtain the resulting data matrix and the computation of genetic diversity and polymorphism information content (PIC). The genetic diversity was evaluated by the number of alleles (Na), the number of effective alleles (Ne), observed heterozygosity (Ho), expected heterozygosity (He), and Shannon’s information index (I) using GenAlEx v6.4.
2.6. Clustering Analysis
Using Power Marker v3.25 software, a depiction of the Q-clustering analysis of the 70 selected hawthorn cultivars based on the polymorphic alleles was constructed using the Unweighted Pairgroup Method, with Arithmetic Means (UPGMA) based on Nei’s genetic distance. Eventually, the dendrograms were generated and edited by Fig Tree v1.4.3.
3. Results
3.1. Frequency and Distribution of EST-SSRs
In total, 72,837 unigenes were obtained from Illumina sequencing. Among the unigenes, 14,364 (19.72%) unigenes have lengths of more than 1000 bp. 5091 EST-SSR loci were mined from the 14,364 unigenes, distributed in 4011 sequences. In 863 sequences, there was more than one EST-SSR. Among the identified EST-SSRs, 273 (5.36%) were present in compound formation, while others were of perfect one-repeat type (Table 1). Among the 5091 potential EST-SSRs, six types of motifs were identified; mono-nucleotide (1989, 39.07%) and di-nucleotide (2012, 39.52%) had the highest frequencies, followed by tri-nucleotide repeats (1024, 20.11%), tetra-nucleotide repeats (46, 0.90%), penta-nucleotide repeats (9, 0.18%), and hexa-nucleotide repeats (11, 0.22%). The number and percentage for six EST-SSR types is shown in Figure 1. The density of each type of EST-SSR is shown in Figure 2. These EST-SSRs served as the basis for further marker development.
3.2. Development, Screening, and Polymorphic Validation of EST-SSRs
A total of 3781 EST-SSR primers were designed and 300 primers were selected for validation. In the initial screen of EST-SSR primers, they were validated by agarose gel with a subset of eight accessions, which showed significant difference in appearance (Supplementary Table S2). The screening results of percentage for 300 EST-SSR primer pairs is shown in Figure 3. A total of 239 (79.67%) pairs of primers generated amplification products, while the remaining 61 (20.33%) pairs of primers failed to detect PCR amplification products at multiple annealing temperatures. For the primers that amplified successfully, 206 (68.67%) pairs of primers were obtained with clear and well-sized amplified products. While the remaining 33 (11.00%) pairs of primers amplified the PCR, product band size was greater than the expected product size, which could be due to the introns (Supplementary Figure S1). Then EST-SSR primers were selected for further screening based on their polymorphism, using PAGE with a larger subset of twelve accessions. Of the 206 pairs of EST-SSR primers capable of amplifying the expected product size, 163 (54.33%) pairs of primers showed polymorphism, while the remaining 43 (14.33%) pairs of primers were monomorphic (Supplementary Figure S1). Finally, 33 primers with high polymorphism were selected and used for genetic diversity analysis (Table 2).
3.3. Genetic Diversity Analysis
All of the 33 EST-SSR markers amplified successfully across all 70 accessions and showed high polymorphism by CE (Supplementary Figure S2). A total of 108 alleles were detected with these markers, with an average of 3.272 alleles per locus. As shown in Table 2, the number of alleles (Na) ranged from 2 (Pr59, Pr117, Pr237, Pr244, and Pr255) to 14 (Pr171), with an average of 4.939; and the effective number of alleles (Ne) varied from 1.258 (Pr117) to 3.214 (Pr171), with a mean value of 2.221. The Shannon’s information index (I) varied between 0.359 (Pr117) and 1.571 (Pr171). The observed heterozygosity (Ho) ranged from 0.132 (Pr174) to 1.000 (Pr235 and Pr237). The gene diversity (expected heterozygosity, He) ranged from 0.205 (Pr117) to 0.689 (Pr171), and the lowest and highest values of polymorphism information content (PIC) were 0.184 for Pr117 and 0.642 for Pr171, with an average value of 0.450. Generally, markers with fewer number of alleles (Na) had lower He values; for instance, Pr117 with only 2 alleles displayed the lowest He value, while the Pr171 with 14 alleles displayed the highest He value.
3.4. Cluster Analysis Using EST-SSR Markers
According to the UPGMA dendrogram (Figure 4), 70 individual cultivars of Chinese hawthorn were divided into two clusters. Group I contained cultivar 36, which was the only soft-seed germplasm, while the remaining accessions with hard-seeds were all clustered in Group II. From the results of the cluster analysis, we continued dividing Group II into two subgroups, roughly according to the color of fruits. It can be seen that the cultivars of 16, 53, and 62 with yellow color fruits, as well as the cultivars of 2, 3, 6, 44, 57, 67, and so forth with orange color fruits, were clustered together and separated from the germplasm with red color fruits. The molecular data and dendrogram generated by EST-SSR marker were in good agreement with the traditional cultivar classification system in China, which is mostly according to the color of the fruit.
4. Discussion
Currently, phylogenetic relationship and genetic diversity analysis among hawthorns based on molecular markers are in progress. In the study of Wu et al. [54], chloroplast DNA PCR-RFLP (Restriction Fragment Length Polymorphism) was employed to investigate the phylogenetic diversity of 8 Crataegus species in China. C. brettschnederi was once regarded as a variety or subspecies of C. pinnatifida by Dai [9], but the data obtained in Wu’s study indicated that it was not a variation of C. pinnatifida but a new species. Another important result was that interspecies of the genus Crataegus had higher chloroplast DNA variations, but no visual bands were detected in different genotypes of C. pinnatifida. Thus, the investigated chloroplast DNA intergenic regions may, however, only be suitable for the separation of Crataegus at section and series levels but not on species level [55]. Therefore, we did not use this method in our study.
RAPD (Random Amplification Polymorphic DNA) markers used to be widely used for genetic studies in the past, especially in natural populations. For instance, Ferrazzini et al. [17] investigated the amount and distribution of genetic variation within and among six populations of the one-seed hawthorn (C. monogyna) located in Italy using RAPD markers. Rajeb et al. [18] assessed the genetic diversity of nine wild Tunisian C. azarolus var. aronia populations from different bioclimates using RAPD markers. These Crataegus populations maintained a low level of genetic diversity, as observed in above research studies. In Iran, Erfani-moghadam et al. [22] investigated the genetic variability among four species of Crataegus using morphological traits and RAPD markers. The results showed a relatively high genetic diversity. Besides, Yilmaz et al. [19] used RAPD markers to study 17 hawthorn genotypes in Turkey. Serce et al. [20] characterized 15 Crataegus accessions sampled from Turkey, which showed that molecular data generated by RAPD and morphological data were in good agreement. Dai et al. [10] used RAPD and ISSR markers to determine the genetic relationship in 8 species from China. The results of similarity coefficient indicated a high level of genetic diversity and the RAPD-based tree showed a better cluster than the ISSR-based tree. Although RAPD markers have been widely used to study the molecular relatedness of Crataegus species, they have a number of limitations, such as poor reproducibility, homology, and dominance, which may lead to an underestimation of the level of genetic diversity [36]. Fewer studies with these methods have been reported in recent years.
For cultivated plants, SSR markers are becoming extensively employed in studies of genetic diversity, population structure, cultivar identification, DNA fingerprints, quantitative trait loci (QTL) mapping, and molecular assisted selection (MAS) [40]. Therefore, it is enormously useful to develop SSR markers from hawthorn transcriptomes, which proved to be cost-effective and species specific.
However, there have been very few reports on the transcriptome sequencing of hawthorn, and until now, the EST sequences available for hawthorn have been very limited. For the entire Crataegus genus, only 29 EST sequences have been deposited in the National Center of Biotechnology Information (NCBI) EST database, which cannot be used for EST-SSR marker development. As to the RNA-Seq data used in the current study, more than 23 million reads were generated and assembled into 72,837 unigenes, with an N50 of 1656 bp, which is greater than the results of previous studies (Table 3) [11,42]. These indicated that transcriptome data were efficiently assembled and are appropriate for transcriptome analysis and marker development. In this study, we have identified a total of 5091 potential EST-SSRs from 14,364 unigenes, revealing the abundance of EST-SSRs for hawthorn. Here, di- and mono- nucleotide repeats were found to be the most abundant repeats in hawthorn, which was consistent with previous studies. As shown in Table 3 and Table 4, Dai [11] conducted a de novo assembly of the fruit transcriptome of C. pinnatifida and EST-SSRs were generated from 3174 unigenes, which represents about 29.5% (3174/10,744) of the analyzed unigenes. EST-SSRs with mono-, di-, tri-, tetra-, penta-, and hexa-nucleotide repeats composed about 31.25%, 39.51%, 21.33%, 0.91%, 0.13%, and 0.13%, respectively. Di- and mono- nucleotide repeats were shown to be the most frequent repeats. Yang [42] used de novo mRNA-Sequence analysis and obtained 83,817 transcripts, and 10,472 EST-SSRs were detected from 9180 (10.95%) transcripts. In these EST-SSRs, di-nucleotide (64.05%) repeat motifs had the highest frequency, followed by tri-nucleotide (29.77%), hexa-nucleotide repeats (3.17%), tetra-nucleotide repeats (1.52%), and penta-nucleotide repeats (1.49%). In our study, both di-nucleotide and tri-nucleotide SSR markers were developed. Additionally, some researchers were concerned that tri-nucleotide SSR markers derived from transcriptomes might be biased towards coding regions, and therefore could be under different selective pressures than SSRs from non-coding regions. Especially in some downstream analysis, where SSRs were assumed to be neutral, tri-nucleotide repeats developed from ESTs should be excluded to avoid potential coding regions [56]. Even if the tri-nucleotide SSRs are developed and used, they could be analyzed separately or tested for selection, which could possibly reveal important insights.
A significant number of high-quality EST-SSRs were generated, which will allow a better understanding of the genetic diversity and facilitate the application in breeding programs. Traditional cultivar identification and classification depended on morphological characters like leaf blade, fruit color, fruit size, and so on, but the accuracy was often affected by environmental factors. The molecular markers developed from our study were efficient alternatives to morphological identification, especially for hybrids, which will lay a foundation for DNA fingerprinting and hawthorn breeding in the future. In this study, 33 newly developed EST-SSR markers were used to evaluate the genetic diversity of 70 hawthorn cultivars of C. pinnatifida. The genetic diversity estimated by EST-SSRs was based on the values of Na, Ne, I, Ho, He, and PIC. When the PIC value was higher than 0.500, the locus was regarded to be of high polymorphism [28,57]. Thus, in our study, 14 SSR primers were highly polymorphic. The average value of Na, Ne, He, Ho, I, and PIC were 4.939, 2.221, 0.924, 0.709, 0.524, and 0.450, respectively. These values (except Na) were lower than those seen in previous studies on other hawthorn species [28,36]. This could be because the expresses sequences, from which EST-SSR are derived, are highly conserved. Notably, the genetic diversity is much higher among different species than among different cultivars from one species. Nevertheless, in this study, we report an efficient protocol for the development of EST-SSR markers of Chinese hawthorn cultivars from RNA-Sequence. Nowadays, NGS technologies are constantly evolving. Third generation platforms are also currently available, including SMRT (Single -molecule real time) sequencing, single-molecule nanopore DNA sequencing, and others. They are being considered an efficient and viable alternative for developing SSR markers [40,58].
5. Conclusions
In the present study, we developed a large number of EST-SSR markers for hawthorn from transcriptome data. A total of 72,837 unigenes were generated, and 5091 EST-SSRs were identified. For these EST-SSRs, 3781 primer pairs were successfully designed. Of these primers, 300 were selected for further validation, and 163 primers were detected for polymorphism. Eventually, 33 EST-SSRs were selected to estimate the genetic diversity, with a total of 108 alleles detected, ranging from 2 to 14 per locus. A UPGMA cluster analysis was used to separate the Chinese hawthorn cultivars into two clusters. There is no doubt that these novel EST-SSR markers will be helpful for future research on cultivar identification, population structure, and QTL analysis for hawthorn. In addition, the analysis of genetic diversity is a prerequisite for its exploration and utilization.
Supplementary Materials
The following are available online at https://www.mdpi.com/1999-4907/10/2/82/s1, Supplementary Table S1. Details of 70 cultivars used in study, Supplementary Table S2. Details of 300 primer pairs selected for initial screening, Supplementary Figure S1. Initial screening of EST-SSR primers with 1% agarose gel and 8% non-denaturing PAGE, Supplementary Figure S2 Screening of EST-SSR primers with CE.
Author Contributions
S.M., W.D., T.L., and Y.L. conceived and designed the experiment. S.M. and T.L. performed the experiment, analyzed the data, and wrote the manuscript. W.D. and Y.L. revised the manuscript.
Funding
This work was funded by the State Forestry and Grass Administration of the People’s Republic of China, grant number was 2014-LY-020.
Acknowledgments
We would like to sincerely thank National Hawthorn Germplasm Repository of China (Shenyang, China) and Institute of Forestry and Pomology, Beijing Academy of Agricultural and Forestry Sciences (Beijing, China) for providing plant materials.
Conflicts of Interest
The authors declare no conflict of interest.
References
- Christensen, K.I. Revision of Crataegus sect. Crataegus and nothosect. Crataeguineae (Rosaceae-Maloideae) in the Old World. Syst. Bot. Monogr. 1992, 35, 1–199. [Google Scholar] [CrossRef]
- Brown, J.A.; Beatty, G.E.; Finlay, C.; Montgomery, I.; Tosh, D.G.; Provan, J. Genetic analyses reveal high levels of seed and pollen flow in hawthorn (Crataegus monogyna, Jacq.), a key component of hedgerows. Tree. Genet. Genomes 2016, 12, 58. [Google Scholar] [CrossRef]
- Betancourt-Olvera, M.; Nieto-Ángel, R.; Urbano, B.; González-Andrés, F. Analysis of the biodiversity of hawthorn (Crataegus spp.) from the morphological, molecular, and ethnobotanical approaches, and implications for genetic resource conservation in scenery of increasing cultivation: The case of Mexico. Genet. Resour. Crop. Evol. 2018, 65, 897–916. [Google Scholar] [CrossRef]
- Gundogdu, M.; Ozrenk, K.; Ercisli, S.; Kan, T.; Kodad, O.; Hegedus, A. Organic acids, sugars, vitamin C content and some pomological characteristics of eleven hawthorn species (Crataegus spp.) from Turkey. Biol. Res. 2014, 47, 21. [Google Scholar] [CrossRef] [PubMed]
- Rigelsky, J.M.; Sweet, B.V. Hawthorn: Pharmacology and therapeutic uses. Am. J. Health-Syst. Pharm. 2002, 59, 417. [Google Scholar] [CrossRef] [PubMed]
- Zheng, G.; Deng, J.; Wen, L.; You, L.; Zhao, Z.; Zhou, L. Release of phenolic compounds and antioxidant capacity of Chinese hawthorn “Crataegus pinnatifida” during, in vitro, digestion. J. Funct. Foods 2018, 40, 76–85. [Google Scholar] [CrossRef]
- Guo, T.J.; Jiao, P.J. Hawthorn (Crataegus) resources in China. HortScience 1995, 30, 1132–1134. [Google Scholar]
- Zhao, H.C.; Feng, B.T. China Fruit-Plant Monograph of Hawthorn (Crataegus) Flora; Zhongguo Linye Press: Beijing, China, 1996. [Google Scholar]
- Dai, H.; Zhang, Z.; Guo, X. Adventitious bud regeneration from leaf and cotyledon explants of Chinese hawthorn (Crataegus pinnatifida Bge. var major N.E.Br.). In Vitro Cell Dev. Biol. 2007, 43, 2–8. [Google Scholar] [CrossRef]
- Dai, H.; Guo, X.; Zhang, Y.; Li, Y.; Chang, L.; Zhang, Z. Application of random amplified polymorphic DNA and inter-simple sequence repeat markers in the genus Crataegus. Ann. Appl. Biol. 2009, 154, 175–181. [Google Scholar] [CrossRef]
- Dai, H.; Han, G.; Yan, Y.; Zhang, F.; Liu, Z.; Li, X.; Li, W.; Ma, Y.; Li, H.; Liu, Y.; et al. Transcript assembly and quantification by RNA-Seq reveals differentially expressed genes between soft-endocarp and hard-endocarp hawthorns. PLoS ONE 2013, 8, e72910. [Google Scholar] [CrossRef]
- Silfverberg-Dilworth, E.; Matasci, C.L.; Van de Weg, W.E.; Van Kaauwen, M.P.; Walser, M.; Kodde, L.P.; Soglio, V.; Gianfranceschi, L.; Durel, C.E.; Costa, F.; et al. Microsatellite markers spanning the apple (Malus x domestica Borkh.) genome. Tree. Genet. Genomes 2006, 2, 202–224. [Google Scholar] [CrossRef]
- Bao, L.; Chen, K.; Zhang, D.; Cao, Y.; Yamamoto, T.; Teng, Y. Genetic diversity and similarity of pear (Pyrus L.) cultivars native to East Asia revealed by SSR (simple sequence repeat) markers. Genet. Resour. Crop. Evol. 2007, 54, 959. [Google Scholar] [CrossRef]
- Cao, Y.; Tian, L.; Gao, Y.; Liu, F. Genetic diversity of cultivated and wild Ussurian Pear (Pyrus ussuriensis Maxim.) in China evaluated with M13-tailed SSR markers. Genet. Resour. Crop. Evol. 2012, 59, 9–17. [Google Scholar] [CrossRef]
- Liang, C.; Wan, T.; Xu, S.; Li, B.; Li, X.; Feng, Y.; Cai, Y. Molecular identification and genetic analysis of cherry cultivars using capillary electrophoresis with fluorescence-labeled SSR markers. 3 Biotech 2018, 8, 16. [Google Scholar] [CrossRef]
- Dai, H. Molecular Identification and Enhancement of Germplasms in Hawthorn. Ph.D. Thesis, Shenyang Agricultural University, Shenyang, China, 2007. [Google Scholar]
- Ferrazzini, D.; Monteleone, I.; Belletti, P. Small-scale genetic diversity in oneseed hawthorn (Crataegus monogyna, Jacq.). Eur. J. Forest Res. 2008, 127, 407–414. [Google Scholar] [CrossRef]
- Rajeb, C.; Messaoud, C.; Chograni, H.; Bejaoui, A.; Boulila, A.; Rejeb, M.N.; Boussaid, M. Genetic diversity in Tunisian Crataegus azarolus L. var. aronia L. populations assessed using RAPD markers. Ann. Forest. Sci. 2010, 67, 512. [Google Scholar] [CrossRef]
- Yilmaz, K.U.; Yanar, M.; Ercislï, S.; Sahiner, H.; Taskin, T.; Zengin, Y. Genetic relationships among some hawthorn (Crataegus spp.) species and genotypes. Biochem. Genet. 2010, 48, 873–878. [Google Scholar] [CrossRef] [PubMed]
- Serçe, S.; Şimşek, Ö.; Toplu, C.; Kamiloğlu, Ö.; Çalışkan, O.; Gündüz, K.; Özgen, M.; Kacar, Y.A. Relationships among Crataegus, accessions sampled from Hatay, Turkey, as assessed by fruit characteristics and RAPD. Genet. Resour. Crop. Evol. 2011, 58, 933–942. [Google Scholar] [CrossRef]
- Beigmohamadi, M.; Rahmani, F. Genetic variation in hawthorn (Crataegus spp.) using RAPD markers. Afr. J. Biotechnol. 2011, 10, 7131–7135. [Google Scholar] [CrossRef]
- Erfani-Moghadam, J.; Mozafari, M.; Fazeli, A. Genetic variation of some hawthorn species based on phenotypic characteristics and RAPD marker. Biotechnol. Biotechnol. Equip. 2016, 30, 247–253. [Google Scholar] [CrossRef]
- Zarei, A.; Erfanimoghadam, J.; Mozaffari, M. Phylogenetic analysis among some pome fruit trees of Rosaceae family using RAPD markers. Biotechnol. Biotechnol. Equip. 2017, 31, 247–253. [Google Scholar] [CrossRef]
- Han, X.Y.; Liang, Y.H.; Wang, Y.J.; Li, F.; Guo, T.; Xue, Y. Analysis of the origin and classification of C. brettschnederi by ISSR markers. J. Jilin Agric. Univ. 2009, 31, 164–167. [Google Scholar] [CrossRef]
- Mirali, N.; Alodat, M.; Haider, N.; Nabulsi, I. The genus Crataegus L.: An ecological and molecular study. Russ. J. Genet. 2011, 47, 26–34. [Google Scholar] [CrossRef]
- Rahmani, M.S.; Shabanian, N.; Khadivi-Khub, A.; Woeste, K.; Badakhshan, H.; Alikhani, L. Population structure and genotypic variation of Crataegus pontica inferred by molecular markers. Gene 2015, 572, 123–129. [Google Scholar] [CrossRef] [PubMed]
- Sheng, F.; Chen, S.; Tian, J.; Li, P.; Qin, X.; Wang, L.; Li, J. Morphological and ISSR molecular markers reveal genetic diversity of wild hawthorns (Crataegus songorica K. Koch.) in Xinjiang, China. J. Integr. Agric. 2017, 16, 2482–2495. [Google Scholar] [CrossRef]
- Emami, A.; Shabanian, N.; Rahmani, M.S.; Khadivi, A.; Mohammad-Panah, N. Genetic characterization of the Crataegus, genus: Implications for in situ, conservation. Sci. Hortic. 2018, 231, 56–65. [Google Scholar] [CrossRef]
- Zhao, Y.; Wang, G.; Su, K.; Dong, W.; Guo, Y. Genetic Diversity of Hawthorn Germplasms Analyzed by SRAP Markers. Mol. Plant Breed. 2014, 12, 1281–1287. [Google Scholar] [CrossRef]
- Kalia, R.K.; Manoj, K.R.; Kalia, S.; Singh, R.; Dhawan, A. Microsatellite markers: An overview of the recent progress in plants. Euphytica 2011, 177, 309–334. [Google Scholar] [CrossRef]
- Csencsics, D.; Brodbeck, S.; Holderegger, R. Cost-Effective, Species-Specific Microsatellite Development for the Endangered Dwarf Bulrush (Typha minima) Using Next-Generation Sequencing Technology. J. Hered. 2010, 101, 789–793. [Google Scholar] [CrossRef]
- Dickinson, T.A.; Lo, E.Y.Y.; Talent, N.; Love, R.M. Black-fruited hawthorns of western North America—One or more agamic complexes? Botany 2008, 86, 846–865. [Google Scholar] [CrossRef]
- Liebhard, R.; Gianfranceschi, L.; Koller, B.; Ryder, C.D.; Tarchini, R.; Van de Weg, E.; Gessler, C. Development and characterisation of 140 new microsatellites in apple (Malus domestica Borkh.). Mol. Breed. 2002, 10, 217–241. [Google Scholar] [CrossRef]
- Lo, E.Y.Y. Global and Fine Scale Molecular Studies of Polyploidy Evolution in Crataegus L. (Rosaceae). Ph.D. Thesis, University of Toronto, Toronto, ON, Canada, 2008. [Google Scholar]
- Lo, E.Y.Y.; Stefanovic, S.; Dickinson, T.A. Population genetic structure of diploid sexual and polyploid apomictic hawthorns (Crataegus; Rosaceae) in the Pacific Northwest. Mol. Ecol. 2009, 18, 1145–1160. [Google Scholar] [CrossRef] [PubMed]
- Khiari, S.; Boussaid, M.; Messaoud, C. Genetic diversity and population structure in natural populations of Tunisian Azarole (Crataegus azarolus, L. var aronia L.) assessed by microsatellite markers. Biochem. Syst. Ecol. 2015, 59, 264–270. [Google Scholar] [CrossRef]
- Zhang, Y.; Dai, H.Y.; Zhang, Q.J.; He, L.I.; Zhang, Z.H. Assessment of genetic relationship in Crataegus genus by the apple SSR primers. J. Fruit Sci. 2008, 25, 521–525. [Google Scholar] [CrossRef]
- Taheri, S.; Lee Abdullah, T.; Yusop, M.; Hanafi, M.; Sahebi, M.; Azizi, P.; Shamshiri, R. Mining and Development of Novel SSR Markers Using Next Generation Sequencing (NGS) Data in Plants. Molecules 2018, 23. [Google Scholar] [CrossRef] [PubMed]
- Zalapa, J.E.; Cuevas, H.; Zhu, H.; Steffan, S.; Senalik, D.; Zeldin, E.; McCown, B.; Harbut, R.; Simon, P. Using next-generation sequencing approaches to isolate simple sequence repeat (SSR) loci in the plant sciences. Am. J. Bot. 2012, 99, 193–208. [Google Scholar] [CrossRef] [PubMed] [Green Version]
- Vieira, M.L.C.; Santini, L.; Diniz, A.L.; Munhoz, C.D.F. Microsatellite markers: What they mean and why they are so useful. Genet. Mol. Biol. 2016, 39, 312–328. [Google Scholar] [CrossRef] [PubMed]
- Simsek, O.; Donmez, D.; Kacar, Y.A. RNA-Seq Analysis in Fruit Science: A Review. Am. J. Plant Biol. 2017, 2, 1–7. [Google Scholar] [CrossRef]
- Yang, M.; Dong, Z.; Cao, Q.; Chen, M. Transcriptomics analysis of Chinese hawthorn (Crataegus pinnatifida) provides insights into the biosynthesis of polyphenolic compounds. Plant Omics 2015, 8, 89–95. [Google Scholar]
- Xu, J.; Zhao, Y.; Zhang, X.; Zhang, L.; Hou, Y.; Dong, W. Transcriptome Analysis and Ultrastructure Observation Reveal that Hawthorn Fruit Softening Is due to Cellulose/Hemicellulose Degradation. Front. Plant. Sci. 2016, 7, R106. [Google Scholar] [CrossRef]
- Xing, W.; Liao, J.; Cai, M.; Xia, Q.; Liu, Y.; Zeng, W.; Jin, X. De novo assembly of transcriptome from Rhododendron latoucheae, Franch. using Illumina sequencing and development of new EST-SSR markers for genetic diversity analysis in Rhododendron. Tree. Genet. Genomes 2017, 13, 53. [Google Scholar] [CrossRef]
- Guichoux, E.; Lagache, L.; Wagner, S.; Chaumeil, P.; Léger, P.; Lepais, O.; Lepoittevin, C.; Malausa, T.; Revardel, E.; Salin, F.; et al. Current trends in microsatellite genotyping. Mol. Ecol. Resour. 2011, 11, 591–611. [Google Scholar] [CrossRef]
- Oetting, W.S.; Lee, H.K.; Flanders, D.J.; Wiesner, G.L.; Sellers, T.A.; King, R.A. Linkage analysis with multiplexed short tandem repeat polymorphisms using infrared fluorescence and M13 tailed primers. Genomics 1995, 30, 450–458. [Google Scholar] [CrossRef]
- Schuelke, M. An economic method for the fluorescent labeling of PCR fragments. Nat. Biotechnol. 2000, 18, 233–234. [Google Scholar] [CrossRef] [PubMed]
- Barkley, N.A.; Dean, R.E.; Pittman, R.N.; Wang, M.L.; Holbrook, C.C.; Pederson, G.A. Genetic diversity of cultivated and wild-type peanuts evaluated with M13-tailed SSR markers and sequencing. Genet. Res. 2007, 89, 93–106. [Google Scholar] [CrossRef] [PubMed]
- Zhu, Y.; Jin, H.; Han, R.; Wang, Y.; Zhu, S. Fingerprinting and identification of closely related wheat (Triticum aestivum L.) cultivars using ISSR and fluorescence-labeled TP-M13-SSR markers. Aust. J. Crop. Sci. 2011, 5, 846. [Google Scholar]
- Jia, H.M.; Shen, Y.T.; Jiao, Y.; Wang, G.Y.; Dong, X.; Jia, H.J.; Du, F.; Liang, S.M.; Zhou, C.C.; Mao, W.H.; et al. Development of 107 SSR markers from whole genome shotgun sequences of Chinese bayberry (Myrica rubra) and their application in seedling identification. J. Zhejiang Univ-Sci. B. 2014, 15, 997. [Google Scholar] [CrossRef]
- Schlautman, B.; Covarrubias-Pazaran, G.; Fajardo, D.; Steffan, S.A.; Zalapa, J.E. Discriminating power of microsatellites in cranberry organelles for taxonomic studies in Vaccinium, and Ericaceae. Genet. Resour. Crop. Evol. 2016, 64, 1–16. [Google Scholar] [CrossRef]
- Du, F.; Wu, Y.; Zhang, L.; Li, X.W.; Zhao, X.Y.; Wang, W.H.; Gao, Z.S.; Xia, Y.P. De Novo Assembled Transcriptome Analysis and SSR Marker Development of a Mixture of Six Tissues from Lilium, Oriental Hybrid ‘Sorbonne’. Plant. Mol. Biol. Rep. 2015, 33, 281–293. [Google Scholar] [CrossRef]
- Ouyang, P.; Kang, D.; Mo, X.; Tian, E.; Hu, Y.; Huang, R. Development and Characterization of High-Throughput EST-Based SSR Markers for Pogostemon cablin Using Transcriptome Sequencing. Molecules 2018, 23, 2014. [Google Scholar] [CrossRef] [PubMed]
- Wu, F.F.; Zhang, Z.H.; Dai, H.Y.; Zhang, Y.; Chang, L.L. Genetic Relationships of Some Hawthorns (Crataegus spp.) Derived from cp DNA PCR-RFLP. J. Shenyang Agric. Univ. 2008, 39, 664–668. [Google Scholar]
- Albarouki, E.; Peterson, A. Molecular and morphological characterization of Crataegus L. species (Rosaceae) in southern Syria. Bot. J. Linn. Soc. 2007, 153, 255–263. [Google Scholar] [CrossRef]
- Hodel, R.G.; Gitzendanner, M.A.; Germain-Aubrey, C.C.; Liu, X.; Crowl, A.A.; Sun, M.; Landis, J.B.; Segovia-Salcedo, M.C.; Douglas, N.A.; Chen, S.; et al. A New Resource for the Development of SSR Markers: Millions of Loci from a Thousand Plant Transcriptomes. Appl. Plant Sci. 2016, 4. [Google Scholar] [CrossRef] [PubMed]
- Vaiman, D.; Mercier, D.; Moazami-Goudarzi, K.; Eggen, A.; Ciampolini, R.; Lépingle, A.; Velmala, R.; Kaukinen, J.; Varvio, S.L.; Martin, P.; et al. A set of 99 cattle microsatellites: Characterization, synteny mapping, and polymorphism. Mamm. Genome 1994, 5, 288–297. [Google Scholar] [CrossRef] [PubMed]
- Grohme, M.A.; Soler, R.F.; Wink, M.; Frohme, M. Microsatellite marker discovery using single molecule real-time circular consensus sequencing on the Pacific Biosciences RS. BioTechniques 2013, 55, 253–256. [Google Scholar] [CrossRef] [PubMed]
Figure 1.
General information of the percentage for six EST-SSR types.
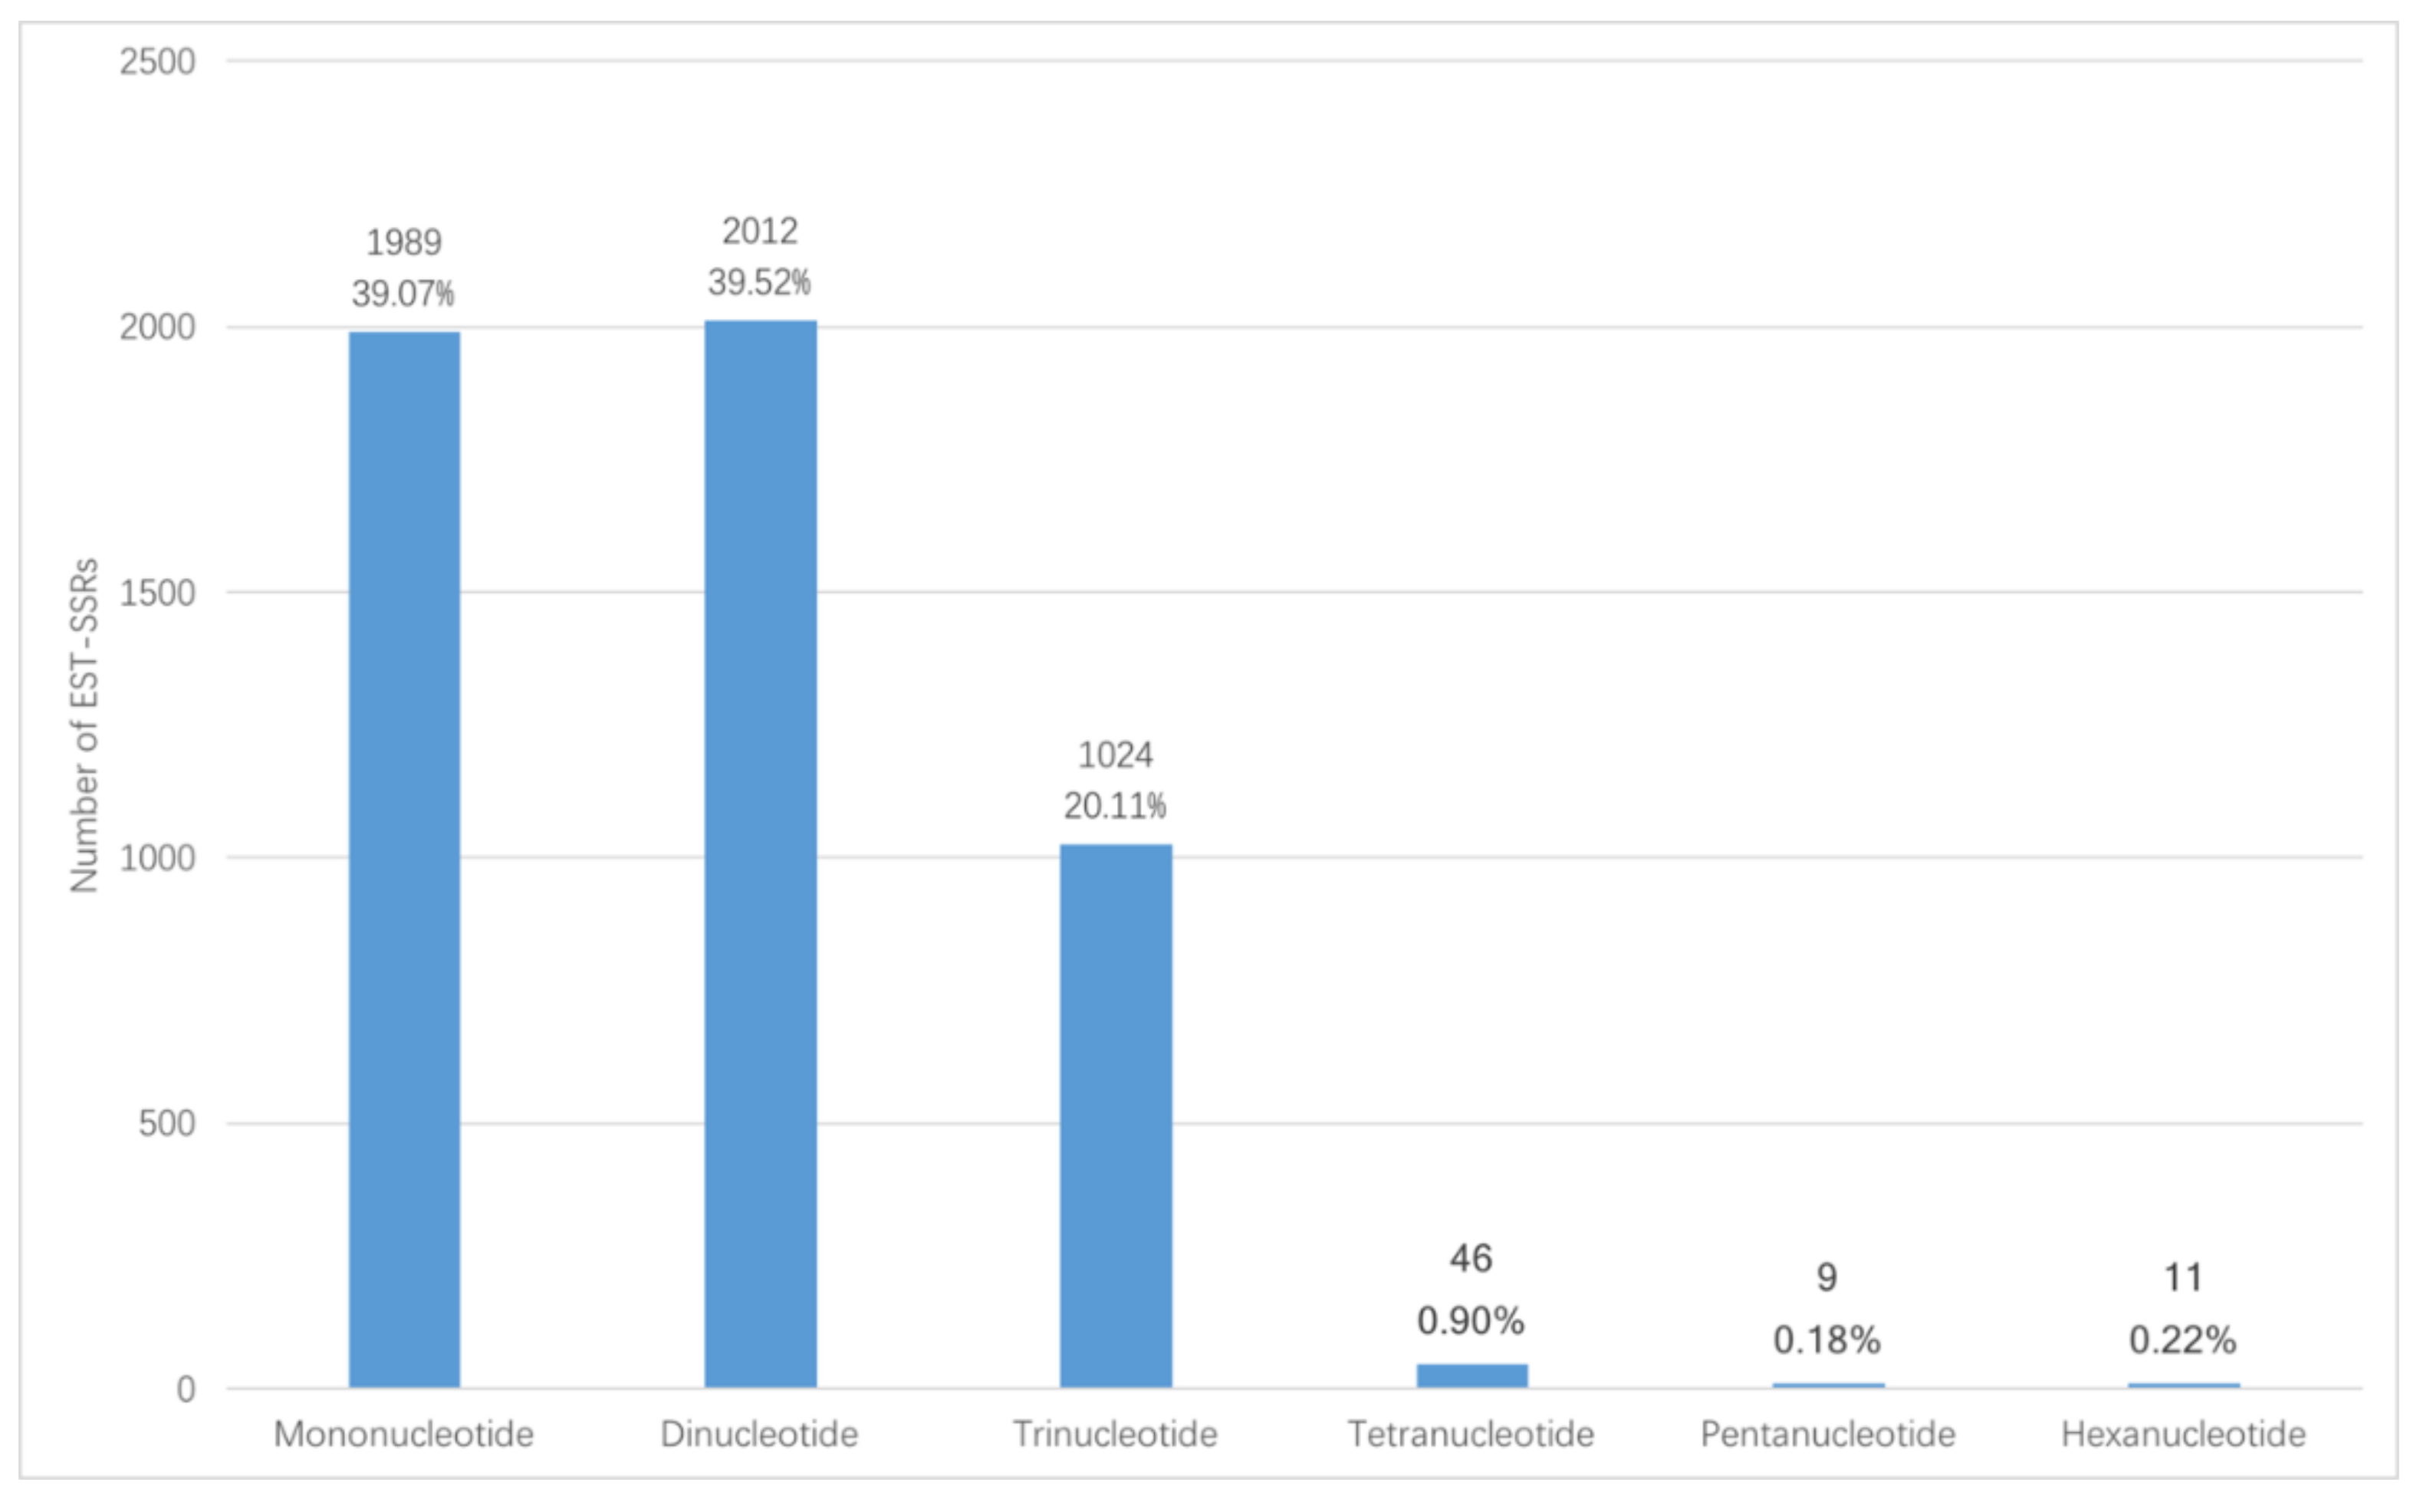
Figure 2.
Details of the density of each type of EST-SSR.

Figure 3.
Details of the screening results of percentage for EST-SSR primer pairs.

Figure 4.
A UPGMA dendrogram of 70 hawthorn cultivars based on 33 EST-SSRs. The numbers on x-axis were genetic similarities represented by coefficient value.
Figure 4.
A UPGMA dendrogram of 70 hawthorn cultivars based on 33 EST-SSRs. The numbers on x-axis were genetic similarities represented by coefficient value.


Table 1.
Summary of RNA-Sequence for SSRs in Chinese hawthorn (C. pinnatifida).
| Parameters Used in Screening | Data Generated by MIcroSAtellite (MISA) |
|---|---|
| Total number of sequences examined | 14,364 |
| Total size of examined sequences (bp) | 28,888,844 |
| Total number of identified SSRs | 5091 |
| Number of SSR-containing sequences | 4011 |
| Number of sequences containing more than one SSR | 863 |
| Number of SSRs present in compound formation | 273 |
Table 2.
Details of the 33 SSR primer pairs used and their summary of information.
| Primer Pairs | Forward Sequence (5′-3′) Reverse Sequence (5′-3′) | Motif Repeat | Product Size (bp) | Tm (°C) | Na | Ne | I | Ho | He | PIC |
|---|---|---|---|---|---|---|---|---|---|---|
| Pr1 | AATATTTGACCCGCTGCAAG TTCTGCAGGAAAAACCCATC | (AC)8 | 130 | 53.5 | 3 | 2.933 | 1.087 | 0.900 | 0.659 | 0.585 |
| Pr19 | ATCAGTTTCCATCCCTGTCG TGGTGGACGTAACAGCACTC | (TA)6 | 206 | 56.5 | 6 | 2.632 | 1.168 | 0.797 | 0.620 | 0.554 |
| Pr26 | GCTGCTGCAGTAAGCAATGA GCAACCCACAAAACTGGAAT | (CCT)6 | 103 | 54.5 | 6 | 2.271 | 0.986 | 0.913 | 0.560 | 0.469 |
| Pr29 | ATGAGGCTGACGAGAGAGGA TTTGCAGAACCCAAAAGTCC | (AG)7 | 235 | 55.5 | 4 | 1.407 | 0.585 | 0.214 | 0.289 | 0.272 |
| Pr31 | TTACACTCGCCAGAACCCTC CCGTCATGTTGAATCCTGTG | (CCG)5 | 182 | 56.5 | 3 | 2.010 | 0.790 | 0.729 | 0.503 | 0.407 |
| Pr56 | GACGAGAATAACTCGCCTCG TGCACGACTTGCAGTACCTC | (TCG)5 | 199 | 57.5 | 6 | 2.454 | 1.117 | 0.824 | 0.592 | 0.522 |
| Pr59 | CTGCAAGATTGGAGGAGGAG TCAAGGGGAGTGCTCTCAGT | (TGT)5 | 166 | 57.5 | 2 | 2.000 | 0.693 | 0.829 | 0.500 | 0.375 |
| Pr81 | AGGAAGAGGAGGAATAGCCG GGATTCGCAGAGGATGTTGT | (GA)7 | 157 | 56.5 | 4 | 2.181 | 0.873 | 0.754 | 0.542 | 0.441 |
| Pr83 | TTCCTTCTCACGCAAAATCC TGGGTTTTGGAAGCTTTGAG | (CT)6 | 116 | 53.5 | 4 | 1.280 | 0.457 | 0.194 | 0.219 | 0.206 |
| Pr100 | GGACACCTTCTTTGGCACTC TGTGGGTTGTGTGTTTTGCT | (CT)9 | 173 | 55.5 | 4 | 1.479 | 0.561 | 0.250 | 0.324 | 0.280 |
| Pr110 | CGCCGTAAACAGAGAGAGGA GTCGGAGAAAATGGTGTCGT | (CT)8 | 144 | 56.0 | 4 | 2.537 | 1.071 | 0.841 | 0.606 | 0.533 |
| Pr114 | TTCAACCTCCATCCATCCAT CAAGCCTCATCAGAACACGA | (GCC)6 | 123 | 54.0 | 5 | 2.340 | 0.976 | 0.855 | 0.573 | 0.480 |
| Pr117 | CTCAATGCAGTGGGAACTCA AGAGCTTGAGCAAGCAGAGG | (AG)6 | 262 | 56.0 | 2 | 1.258 | 0.359 | 0.232 | 0.205 | 0.184 |
| Pr125 | GATGTGGACGATTGAGTTGC GCATGTAGCCCACAAGACAA | (TG)6 | 266 | 54.5 | 3 | 1.540 | 0.582 | 0.414 | 0.351 | 0.298 |
| Pr134 | GGGTTGGTGAAAGCCCTAAT ATGCATACGCAGCAGTCTTG | (ATC)6 | 130 | 56.0 | 4 | 2.654 | 1.054 | 0.814 | 0.623 | 0.548 |
| Pr146 | AGAAGATGACGACCACGACC TGCGATTCGAAACCCTAATC | (TTC)6 | 269 | 54.5 | 4 | 2.373 | 1.008 | 0.786 | 0.579 | 0.518 |
| Pr152 | CGCTTGGTTAACTGTGGAGC TTGGACTCCACACATGCAAT | (AC)6 | 127 | 56.0 | 4 | 2.133 | 0.880 | 0.714 | 0.531 | 0.444 |
| Pr167 | AACACTTCCCTCACCGTCAC TAGATTGCCAGGACCAGACC | (GTC)5 | 209 | 57.0 | 6 | 2.090 | 0.878 | 0.754 | 0.521 | 0.425 |
| Pr171 | CATACCCACTCAAGGGCTGT GGCCTTTGACTCCAAATGAA | (CA)8 | 226 | 56.0 | 14 | 3.214 | 1.571 | 0.857 | 0.689 | 0.642 |
| Pr174 | TCTTTCTCACCGAACCCATC TCGTAATCGGCGAGAGAGTT | (CT)8 | 227 | 54.5 | 4 | 1.773 | 0.785 | 0.132 | 0.436 | 0.389 |
| Pr175 | TTGCACTTGTGGCTAGATCG CAATTCATTGCACTTCGGTG | (AT)7 | 133 | 53.5 | 9 | 3.010 | 1.383 | 0.870 | 0.668 | 0.616 |
| Pr205 | ACCGTAGGAAGTCCAACACG CCCTCAGTTCAAGGAATACTCG | (GAG)5 | 125 | 57.5 | 4 | 2.510 | 1.016 | 0.899 | 0.602 | 0.523 |
| Pr211 | TGTTGCTGCAATCTGCTTTC CCACTTGGAGGCAGTAGTGA | (AAT)6 | 183 | 56.0 | 4 | 3.082 | 1.228 | 0.900 | 0.676 | 0.615 |
| Pr224 | AAACTTCATCGGTCCGTCAG CTCTTCCTTGCTGCATCCTC | (AG)6 | 242 | 56.0 | 10 | 2.456 | 1.207 | 0.836 | 0.593 | 0.527 |
| Pr226 | ACGAGAGCATGCAGGAGAAT GCTTTCCGAACCTTCAACAG | (GGC)5 | 242 | 56.0 | 4 | 2.007 | 0.755 | 0.829 | 0.502 | 0.390 |
| Pr235 | GCAAACAATGGGCACACATA GCTGTGCATGAGATGGAAGA | (GAG)5 | 163 | 54.5 | 9 | 2.563 | 1.191 | 1.000 | 0.610 | 0.533 |
| Pr237 | CGGGATCAAGCAATGAAGAT CAGAGCCATGGTTCAGGAAT | (CCT)5 | 242 | 54.5 | 2 | 2.000 | 0.693 | 1.000 | 0.500 | 0.375 |
| Pr239 | ACCATGGAAGATTCGTGGAG CCAATGAGCAAAAGCGTGTA | (CTT)5 | 196 | 54.5 | 4 | 2.196 | 0.902 | 0.729 | 0.545 | 0.456 |
| Pr244 | GCCGACTCTACTTGAAGGGA TACGGATAAACCCAGCTTCG | (GTT)6 | 173 | 56.0 | 2 | 1.998 | 0.693 | 0.657 | 0.500 | 0.375 |
| Pr246 | GCAAGGGACTTGAAATTGGA ATCCGATCGGTTCTGTGAAG | (GA)9 | 174 | 54.5 | 13 | 2.259 | 1.397 | 0.609 | 0.557 | 0.542 |
| Pr251 | TCTTCCTTCTCCGCTCTCTG CCCATTTCTGTCTGCTCCAT | (AG)9 | 227 | 56.0 | 5 | 2.771 | 1.112 | 0.838 | 0.639 | 0.569 |
| Pr255 | GCCGTATGGAGGGTCCTTAG GCGGAGGTGATTGGAGACTA | (TC)6 | 177 | 58.5 | 2 | 1.845 | 0.651 | 0.710 | 0.458 | 0.353 |
| Pr295 | GCAATCGATGCATACAGCTC ACAAGAGTGTCAAGGCCCAG | (AG)9 | 225 | 56.0 | 3 | 2.047 | 0.772 | 0.729 | 0.512 | 0.401 |
| Mean | / | / | / | / | 4.939 | 2.221 | 0.924 | 0.709 | 0.524 | 0.450 |
| Standard Error | / | / | / | / | 0.515 | 0.088 | 0.049 | 0.042 | 0.022 | 0.118 |
Na: the number of alleles, Ne: the number of effective alleles, I: Shannon’s information index, Ho: observed heterozygosity, He: expected heterozygosity, and PIC: polymorphism information content.
Table 3.
General information of sequencing and assembly for three hawthorn transcriptomes.
| Source | Dai et al., 2013 [11] | Yang et al., 2015 [42] | Xu et al., 2016 [43] | |
|---|---|---|---|---|
| Materials | C. pinnatifida H8 | C. pinnatifida S7 | C. pinnatifida “Zezhouhong” | C. pinnatifida “Qiujinxing” and “Ruanroushanlihong3Hao” |
| Clean reads | 11,538,395 | 14,659,624 | 32,332,207 | 23,183,612 * |
| Total bases (bp) | 2,140,589,552 | 2,743,145,672 | 6,530,452,306 | 5,839,454,759 * |
| Number of >200 bp contigs | 460,119 | 515,118 | / | 2,182,914 |
| Mean length of contigs (bp) | 130 | 131 | / | 77 |
| Number of >200 bp transcripts | 54,662 | 62,653 | 83,817 | 199,204 |
| Mean length of transcripts (bp) | 756 | 846 | 938 | 1056 |
| N50 length of transcripts (bp) | 1237 | 1421 | 1615 | 1656 |
| Number of unigenes | 39,663 | 41,723 | / | 72,837 |
| Mean length of unigenes (bp) | 656 | 703 | / | 696 |
| Sequencer | Illumina HiSeq 2000 | Illumina HiSeq 2000 | Illumina HiSeq 2500 | |
* Mean value of 8 samples.
Table 4.
General information of repeat type of EST-SSR motif for three hawthorn transcriptomes.
| Source | Dai et al., 2013 [11] | Yang et al., 2015 [42] | Our Study | |||
|---|---|---|---|---|---|---|
| Mono-nucleotide | 992 | 31.25% | / | / | 1989 | 39.07% |
| Di-nucleotide | 1254 | 39.51% | 6707 | 64.05% | 2012 | 39.52% |
| Tri-nucleotide | 677 | 21.33% | 3118 | 29.77% | 1024 | 20.11% |
| Tetra-nucleotide | 29 | 0.91% | 159 | 1.52% | 46 | 0.90% |
| Penta-nucleotide | 4 | 0.13% | 156 | 1.49% | 9 | 0.18% |
| Hexa-nucleotide | 4 | 0.13% | 332 | 3.17% | 11 | 0.22% |
| Number of compound SSRs | 214 | 6.74% | / | / | 273 | 5.36% |
| Total number of identified SSRs | 3174 * | / | 10,472 | / | 5091 ** | / |
Note: * the number repeat type of SSR were statistic total number of identified SSRs included compound SSRs was calculated separately, ** total number of identified SSRs not included the number of compound SSRs.
© 2019 by the authors. Licensee MDPI, Basel, Switzerland. This article is an open access article distributed under the terms and conditions of the Creative Commons Attribution (CC BY) license (http://creativecommons.org/licenses/by/4.0/).
Share and Cite
MDPI and ACS Style
Ma, S.; Dong, W.; Lyu, T.; Lyu, Y. An RNA Sequencing Transcriptome Analysis and Development of EST-SSR Markers in Chinese Hawthorn through Illumina Sequencing. Forests 2019, 10, 82. https://doi.org/10.3390/f10020082
AMA Style
Ma S, Dong W, Lyu T, Lyu Y. An RNA Sequencing Transcriptome Analysis and Development of EST-SSR Markers in Chinese Hawthorn through Illumina Sequencing. Forests. 2019; 10(2):82. https://doi.org/10.3390/f10020082
Chicago/Turabian StyleMa, Suliya, Wenxuan Dong, Tong Lyu, and Yingmin Lyu. 2019. "An RNA Sequencing Transcriptome Analysis and Development of EST-SSR Markers in Chinese Hawthorn through Illumina Sequencing" Forests 10, no. 2: 82. https://doi.org/10.3390/f10020082
Note that from the first issue of 2016, this journal uses article numbers instead of page numbers. See further details here.