The Spatial Distribution of the Needle Area of Planted Larix olgensis Trees


Department of Forest Management, School of Forestry, Northeast Forestry University, Harbin 150040, China
*
Author to whom correspondence should be addressed.
Forests 2019, 10(1), 28; https://doi.org/10.3390/f10010028
Submission received: 20 November 2018
/
Revised: 25 December 2018
/
Accepted: 28 December 2018
/
Published: 4 January 2019
(This article belongs to the Section Forest Ecology and Management)
Abstract
:The spatial distribution of leaf area largely governs both the structure and function of a tree crown. Three sample trees were selected from a 16-year-old Larix olgensis plantation in the Maoershan Forest Farm, Heilongjiang Province, based on the average diameter at breast height in each plot. All needles from the branches in the nodal and internodal pseudowhorls within the crown were destructively sampled. The crown was divided into several segments in the vertical and horizontal directions, resulting in different sub-regions. The needle area (NA) in each sub-region was computed based on the needle mass per area (NMA). The vertical and horizontal distributions and their cumulative NA distributions were characterized using the Weibull distribution function and its cumulative form. A two-dimensional NA model was created by combining the two Weibull distribution functions of the vertical and horizontal distributions. The variation in the spatial distribution of the NA among the different crown directions is discussed, and the influence of competition from competitors on the spatial distribution of NA was analyzed. The results showed that the Weibull distribution function and its cumulative form performed well in describing the vertical and horizontal distributions and the cumulative distributions of the NA, which was generally concentrated upward within the crown. This phenomenon was most apparent in dense stands with strong competition. The center of the NA exhibited an inward shift in the horizontal direction within the crown but shifted outwards with an increase in competition. The cumulative vertical and horizontal distributions of the NA obviously varied with different crown directions, which was associated mainly with the light conditions. The two-dimensional NA patterns showed that the center of the NA generally shifted outward with an increase in the relative depth into the crown (RDINC), and that more concentrated and more skewed patterns usually occurred under increased competition. Different crown directions exhibited different two-dimensional NA patterns, but the core driver was the variable light condition caused by the competitors, particularly in closed stands.
1. Introduction
The spatial distribution of foliage (including mass and area) is one of the main determinants of crown structure [1,2] and function [3,4]. The spatial distribution of foliage influences the sapwood cross-sectional area (or area increment) [5,6,7,8,9], light transmittance [2,10,11], microenvironment [1,12,13], radial pattern of sap flux density [3] and photosynthetic productivity [14,15,16]. The vertical foliage distribution generally plays an important role in determining an effective crown [17], consisting of branches that can produce excess photosynthate to contribute to the growth of the main tree stem [18], which provides a reference for an artificial pruning height in young forests [19].
Previous studies have generally simulated vertical foliage distribution with probability density distributions, in which β [1,15,20,21,22] and Weibull [4,23,24,25,26,27] distributions are widely used because of their high flexibility. The β distribution has an advantage in that it is bound at the extremities [28], and is logically defined on an interval with fixed endpoints, i.e., (0, 1) [15]. The β distribution is equal to the relative depth into the crown (RDINC), with 0 being the tree tip and 1 being the crown base [22]. However, the β distribution does not have a cumulative distribution form, so some researchers have to compute it using the numerical integration method [9,15]. The Weibull distribution has the cumulative distribution form; thus, it is widely applied in order to model the cumulative distribution of foliage [10,16,29,30,31]. In contrast to vertical foliage distribution, there are relatively few studies on horizontal foliage distribution [1,10,20,21,27,32]. However, similarly to vertical foliage distribution, the horizontal distribution of foliage usually influences within-crown light environments [33], and many ecological and physiological models [1,34,35,36] rely on accurate characterizations of both horizontal and vertical distributions [10].
The two-dimensional distribution of foliage within a crown is important when establishing eco-physiological models of canopy photosynthesis [12,36]. Wang and Jarvis [1] first tried to simulate a two-dimensional distribution of leaf area density (LAD) by combining vertical and horizontal β distributions. Zhang et al. [21] modeled a two-dimensional distribution of the LAD based on a quadratic trend surface function to achieve multiple integrals in order to further model the radiation transfer within the canopy [37].
For an individual tree, vertical foliage distribution is generally influenced by crown size, tree social position [7,20,22,25], stand density [10,31], tree health [22], crown ratio [31], species shade tolerance [8,38], and silvicultural treatments [29]. Previous studies on foliage distribution have generally assumed that there were no significant differences among different horizontal directions [1,21,36]. However, during the actual measurement process, we found that in reality, the foliage distribution was inconsistent. In addition, a recent study has also suggested that foliage distributions differ among different quadrants, especially between southern and northern quadrants [27]. Some studies have proven that differences in branch size [39,40] and corresponding leaf photosynthetic traits [41] among different crown directions exist, which are probably derived from distinct light conditions and an unbalanced competition status [40,41,42]. Thus, it is necessary to analyze the distribution of foliage in different crown directions. Also, it is important to accurately model the light transmission and calculate the photosynthetic production of different crown directions.
Larix olgensis (L. olgensis) is a medium-sized tree that can reach a height of 30 m and a diameter of more than 1 m. Its leaves are needle-like, dark-green, 1.5–3 cm long and 1 cm wide. It is an apparently light-demanding but cold-resistant and drought-resistant tree species that has the advantages of fast growth and strong adaptability [43,44]. L. olgensis is also of high economic value due to its wide application for housing, furniture, plywood, flooring, decorative and pulp purposes [45]. To date, the planted area and volume of L. olgensis accounts for 36% and 37% of the total area and total volume, respectively, of all the plantations in Northeastern China, and its plantations represent almost 38% of the commercial timber plantations in Northeastern China [46]. However, studies of the spatial distribution of foliage (including mass and area) for L. olgensis are rarely reported. We assumed that the needle area (NA) is uniformly distributed in each sub-region within the crown. The objectives of this study are; (i) to model the vertical and horizontal distribution, cumulative vertical and horizontal distribution, and two-dimensional distribution of foliage with the Weibull probability density function; (ii) to analyze the differences in foliage area distributions among different crown directions; and (iii) to analyze the influence of competition from competitors on the distribution of the needle area.
2. Materials and Methods
2.1. Site Description
L. olgensis is a species of larch that occurs in central Sikhote-Alin and has been one of the main reforestation tree species in Northeastern China, especially in the mountainous regions, due to it being identified as a major fast-growing and high-yielding tree species in Northeastern China [47]. Our experiments were conducted at the Maoershan Forest Farm (127°18′0″ E–127°41′6″ E and 45°2′20″ N–45°18′16″ N), which was founded in 1958 in Northeastern China. The total area of the forest farm exceeds 27,000 ha, including 26,067 ha of forestland, with an average altitude of 400 m above sea level. The site is characterized by a temperate continental monsoon climate with warm, wet summers and cold, dry winters. Dominated by Eutroboralfs [48], the area has a mean annual temperature of 2 °C but exhibits a large temperature difference throughout the year with a minimum temperature of −40 °C and a maximum temperature of 34 °C. The total forest coverage is approximately 83.3%, where 14.7% of this area consists of plantations.
2.2. Field Measurements and Sample Selection
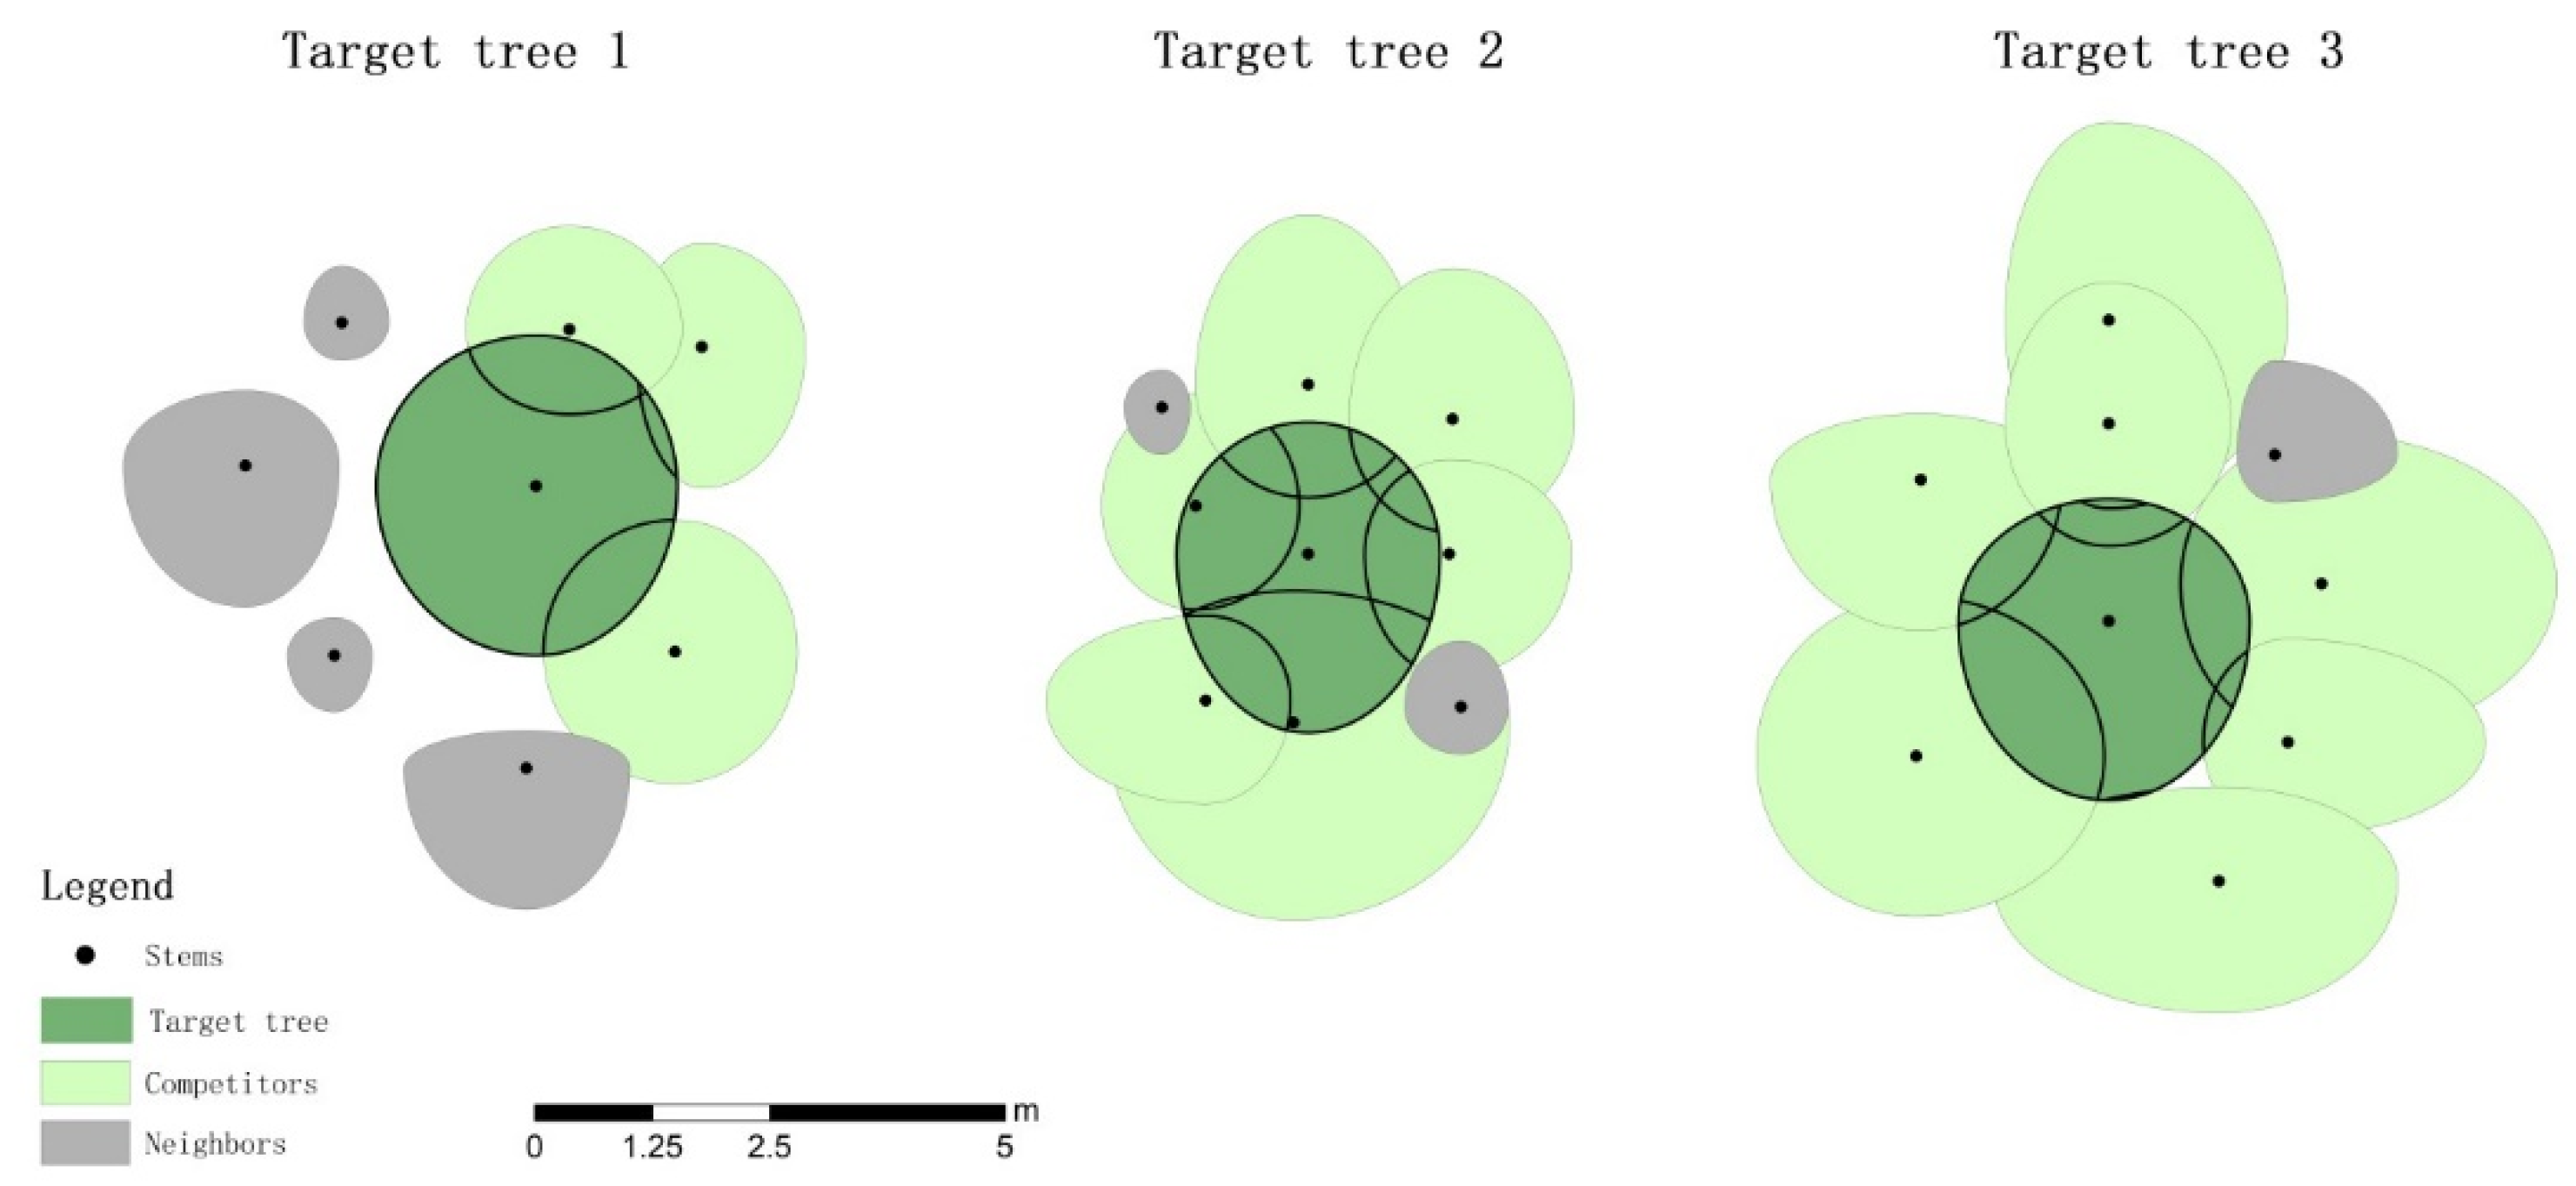
Three sample plots (20 m × 30 m) were established within pure and unthinned 16-year-old L. olgensis plantations of the same habitat, with different stand densities of 2000, 2400 and 3200 trees ha−1. The diameter at breast height (DBH), tree height (H) and crown width (CW) were measured for each tree with a DBH greater than 5 cm, and the quadratic mean diameter (Dg) was calculated for each plot. Then, near the plots, three sample trees with DBH values that were similar to the Dg of the corresponding plot were selected to represent the average state of the stand. We assumed that the major factor influencing the spatial distribution of foliage is the growing space of the crown. Thus, some neighboring trees were identified as competitors if their crown projections overlapped with the crown projection of the target tree (Figure 1). The DBH, H, CW, and relative azimuth of competitors to the target tree (RAN) were measured. The crown competition index (CCI) of each target tree was the sum of all competitor contributions [49] and was calculated as follows:
where i represents the serial number of competitors, n is the total number of competitors for each target tree, t represents the target tree, OS is the area of the overlapped part, CS is the crown cross-sectional area.
The attributes of the plots, sample trees and corresponding competitors are listed in Table 1.
2.3. Measurement of Needle Biomass of the Whole Crown
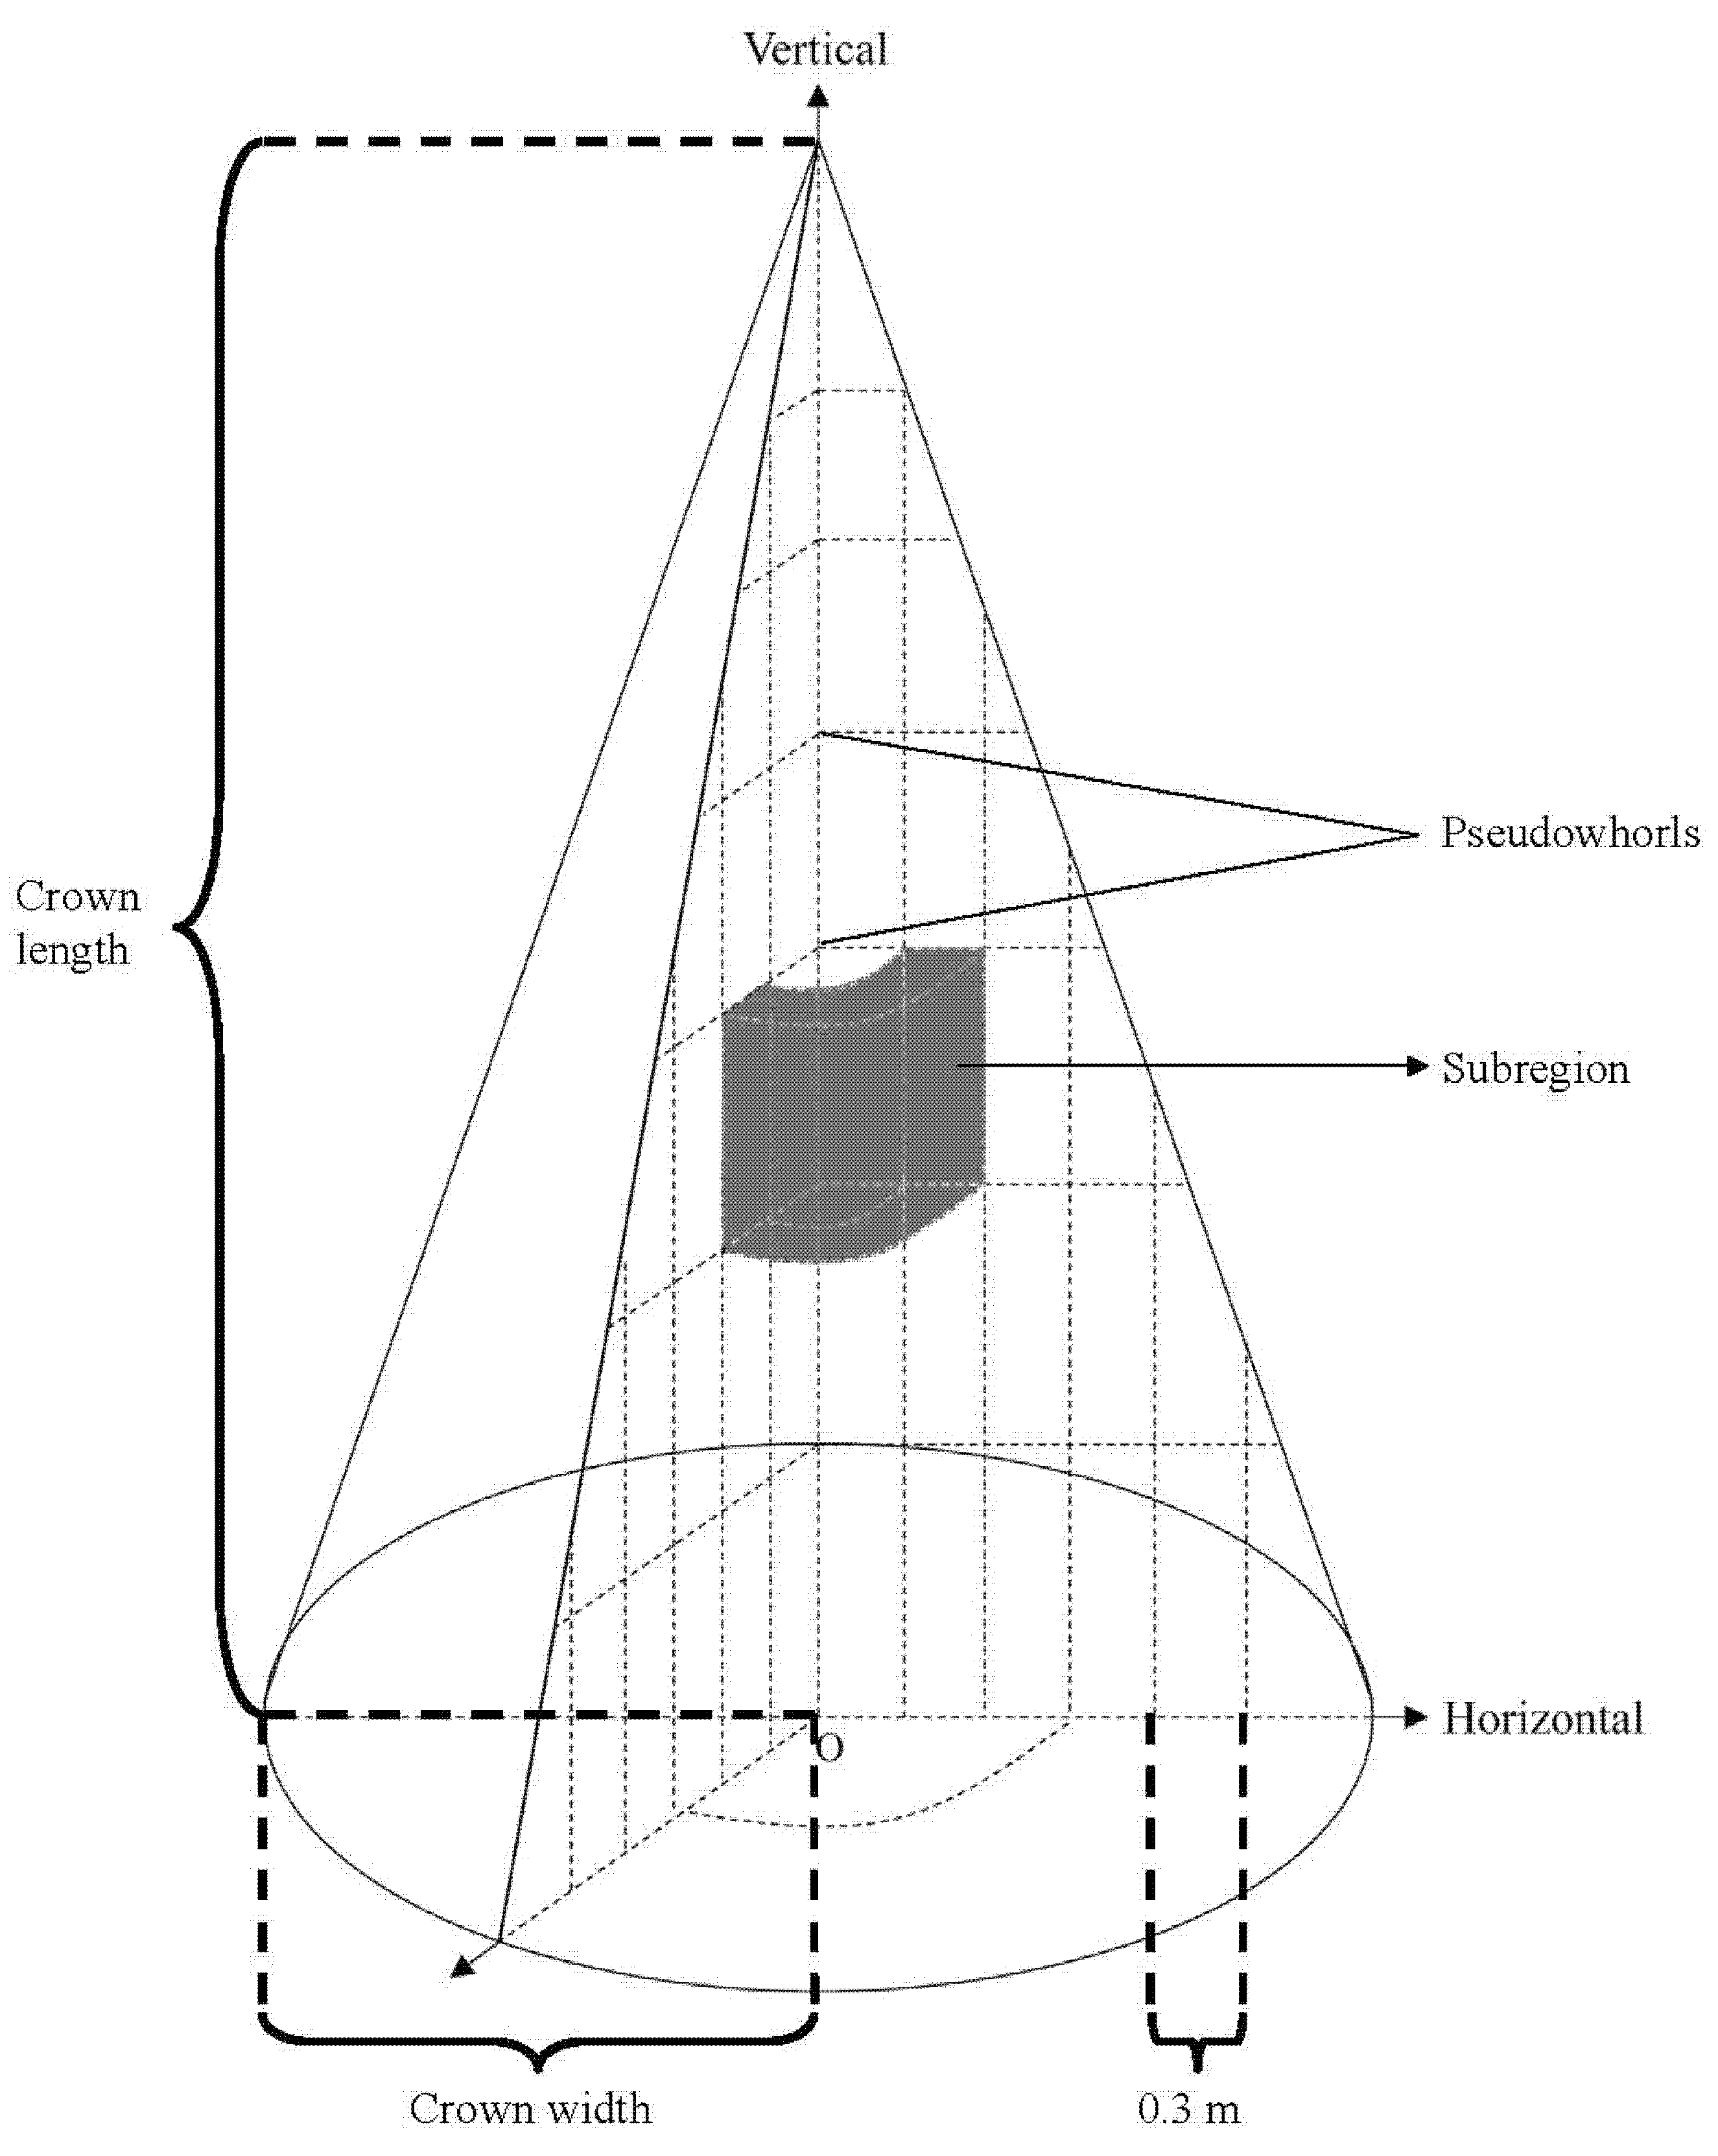
At the end of the growing season (early September), three sample trees were cut down for measurement. In the vertical direction, the crown length (the distance from the tree tip to the base of its live crown, which was defined if the pseudowhorl had at least one live branch, CL) of each sample tree was divided into several segments based on the pseudowhorls [50] from top to bottom. In the horizontal direction, the CWs were divided into several segments at 0.3 m projected length intervals from the branch base to the branch tip. The crown was divided into different sub-regions according to the above method (Figure 2). The branch diameter (BD), branch length (BH), branch chord length (BC), branch azimuth (φ), branch angle (θ) and depth into the crown (DINC) of all branches were measured. In this study, all of the branches were destructively cut and all of the needles on each branch were picked and weighed to obtain the actual needle mass despite the measurements being very time consuming. We also estimated the needle masses of the small branches (delayed by one or more years behind the main branches, BIPs) using the method from Maguire and Bennett [15], which was confirmed to be the best branch-level leaf area equation dependent on data from the main branches. The results showed that the absolute relative error of the crown needle mass was approximately 23.7%, indicating that sampling only the main branches was inaccurate for the purpose of modeling the BIPs. According to above method, all branches were cut to obtain the fresh weight of needles in each sub-region by destructive sampling. We assumed that the ratio of dry weight to fresh weight (RDF) was not significantly different within the same vertical segment of the crown. As such, 20 g needle samples were randomly selected from each vertical segment and dried immediately after they were taken from the field to a constant weight at 105 °C for 24 h and weighed to calculate the RDF.
2.4. Calculation of NA
The NA of coniferous tree species is generally difficult to measure and estimate due to the small sizes and irregular geometries of the needles. In recent studies, the method used to measure the needle surface area involved defining the cross-section of a needle as a simple geometric shape [1,51,52], such as a triangle for Pinus koraiensis, square for Picea, and rectangles for both Abies nephrolepis and L. gmelinii. However, this method ignores the variation in the sizes and shapes of cross-sections with regard to the position of the needle and is usually accompanied by large measurement errors. Thus, some authors measured the projected needle surface area by scanning, such as in previous studies on Pinus sylvestris [53] and L. decidua [54]. In this study, we selected the second method (scanning) because L. olgensis needles are so small that large errors may occur when measuring the length, width and thickness. Moreover, the mean width-to-thickness ratio of L. olgensis needles is greater than four, which indicates a close to flat shape.
Once the fresh weight of the needle was measured, 10 groups of 0.1 g needles were randomly selected in each vertical segment. Then all sample groups were scanned and surveyed with image analysis software (Image-Pro Plus 6.0, Media Cybernetics, Bethesda, MD, USA) in the laboratory, resulting in a projected leaf area. The needle mass per area (NMA) was calculated by dividing the projected leaf area by the corresponding needle dry mass. Finally, the NA in each sub-region was calculated as follows:
where i is the sub-region number, j is the vertical segment number, NA is the needle area, RDF is the ratio of dry weight to fresh weight, NMA is the needle mass per area and WF is the fresh weight of the needle.
To describe the NA distribution of each crown direction, we divided the crown into four directions, with the azimuth of a branch ranging from 0 to 360: 0 ≤ RAN < 45 and 315 ≤ RAN < 360 defined as north; 45 ≤ RAN < 135 defined as east; 135 ≤ RAN < 225 defined as south; and 225 ≤ RAN < 315 defined as west.
2.5. Description of NA Distribution Functions
In this study, we intended to simulate the vertical and horizontal distributions and cumulative vertical and horizontal distributions using the same type of distribution function. We therefore selected the Weibull probability density function to fit the NA distribution and cumulative NA distribution of the proportion of NA to total NA.
NA distribution function:
where P(x) is the proportion of the needle area (NA) at a specific relative depth into the crown (RDINC) relative to the total NA of the whole crown and b and c are the scale and shape parameters, respectively.
Cumulative NA distribution function is defined as:
where b and c are as described above.
2.6. Description of the Two-Dimensional Regression Equation of NA
Wang and Jarvis [1] first established a two-dimensional regression equation for LAD during a study of the crown structure of Sitka spruce. They authors suggested that if the LAD varied in both the vertical and horizontal directions, the LAD within the crown could be calculated by combining two β distributions. Thus, we established a two-dimensional regression equation by combining two Weibull distributions (vertical distribution and horizontal distribution) based on the same theory as that of Wang and Jarvis [1]:
where NA is the needle area; h and r are the relative crown height (1-relative depth into crown) and relative radial distance (ratio of the projective length from the tip to stem junction to the crown width), respectively; NAT is the total NA of the whole-tree crown; and a0, b1, b2, c1 and c2 are coefficients to be estimated.
In this study, maximum likelihood estimates of the coefficients of the distribution functions (Equations (2) and (3) were determined using Gauss–Newton, and the coefficients of the regression model were determined via nonlinear least squares, which were carried out using R software (Version 3.5.1). The performances of the Weibull distribution and cumulative Weibull distribution were evaluated by the Chi-square test [55]. The coefficient of determination (R2) and the root mean squared error (RMSE) were used to evaluate the performance of the regression equations (Equation (4)).
3. Results
3.1. Vertical Distribution of NA
The parameter estimates and the Chi-square test results of the Weibull distribution fitted to the vertical distribution of NA for three sample trees are presented in Table 2. The Chi-square test indicated that all of the vertical distributions of the NA satisfied the null hypothesis (α = 0.05). Figure 3 shows that the observed NA was distributed almost perfectly along the lines of the estimated NA. Hence, the Weibull distribution was suitable for describing the vertical distribution of NA within the crown. The peak NA in the vertical direction (PNAV) within the crown in each direction was also calculated from the Weibull distribution (Table 2). As we presumed, the PNAVs within the crown differed in different directions, although most were maintained within a range of 0.4 to 0.6. The predicted vertical distributions of the NA in the four directions (east, south, west and north) for three sample trees are shown in Figure 4. For tree 1, the PNAVs of the four directions were below the crown midpoint and showed little difference (Figure 4a). For tree 2, the vertical distribution of the NA in the four directions exhibited an upward shift, and the PNAVs were also similar (Figure 4b). For tree 3, the PNAVs in the four directions fluctuated more obviously (standard deviation = 0.08) than did those of the first two trees (standard deviations of 0.03 and 0.04). Interestingly, the peak of the total NA of tree 3 was almost equal to that of tree 1, although the PNAVs in different directions were absolutely different between the two trees. The PNAVs among the four directions in an individual tree were different but the difference was not correlated with direction.
The predicted cumulative vertical distribution of the NA in four directions within the crown for three sample trees is shown in Figure 5. For tree 1, the cumulative needle areas (CNAs) in four directions all demonstrated an increase with an increasing RDINC, but the total NA in four directions exhibited clearly different values of 12.4 m2 in the south, 9.2 m2 in the west, 5.2 m2 in the north and 4.9 m2 in the east, indicating that the NA was more concentrated in the south and west directions of the crown. For tree 2, the CNAs in four directions also demonstrated a pattern similar to that shown in tree 1, increasing with an increasing RDINC, but the rate of increase approached zero in the lower sections of the crown. The total NAs in the four directions were 15.1 m2 in the south, 9.0 m2 in the west, 7.8 m2 in the north and 5.3 m2 in the east. Tree 2 showed a similar concentration tendency to that of tree 1, where the NAs in the south and west directions of the crown were greater than the NAs in the east and north directions. For tree 3, however, the CNAs in the four directions also increased with an increasing RDINC as in the first two trees but the difference in the total NAs among the four directions was smaller. In addition, the order of the total NAs in the four directions differed from the orders for the first two trees: 9.5 m2 in the east, 8.0 m2 in the west, 6.3 m2 in the north and 5.9 m2 in the east. The rates of increase along the RDINC in tree 1 and tree 3 were smaller in the upper crown but greater in the lower crown than those in tree 2.
3.2. Horizontal Distribution of NA
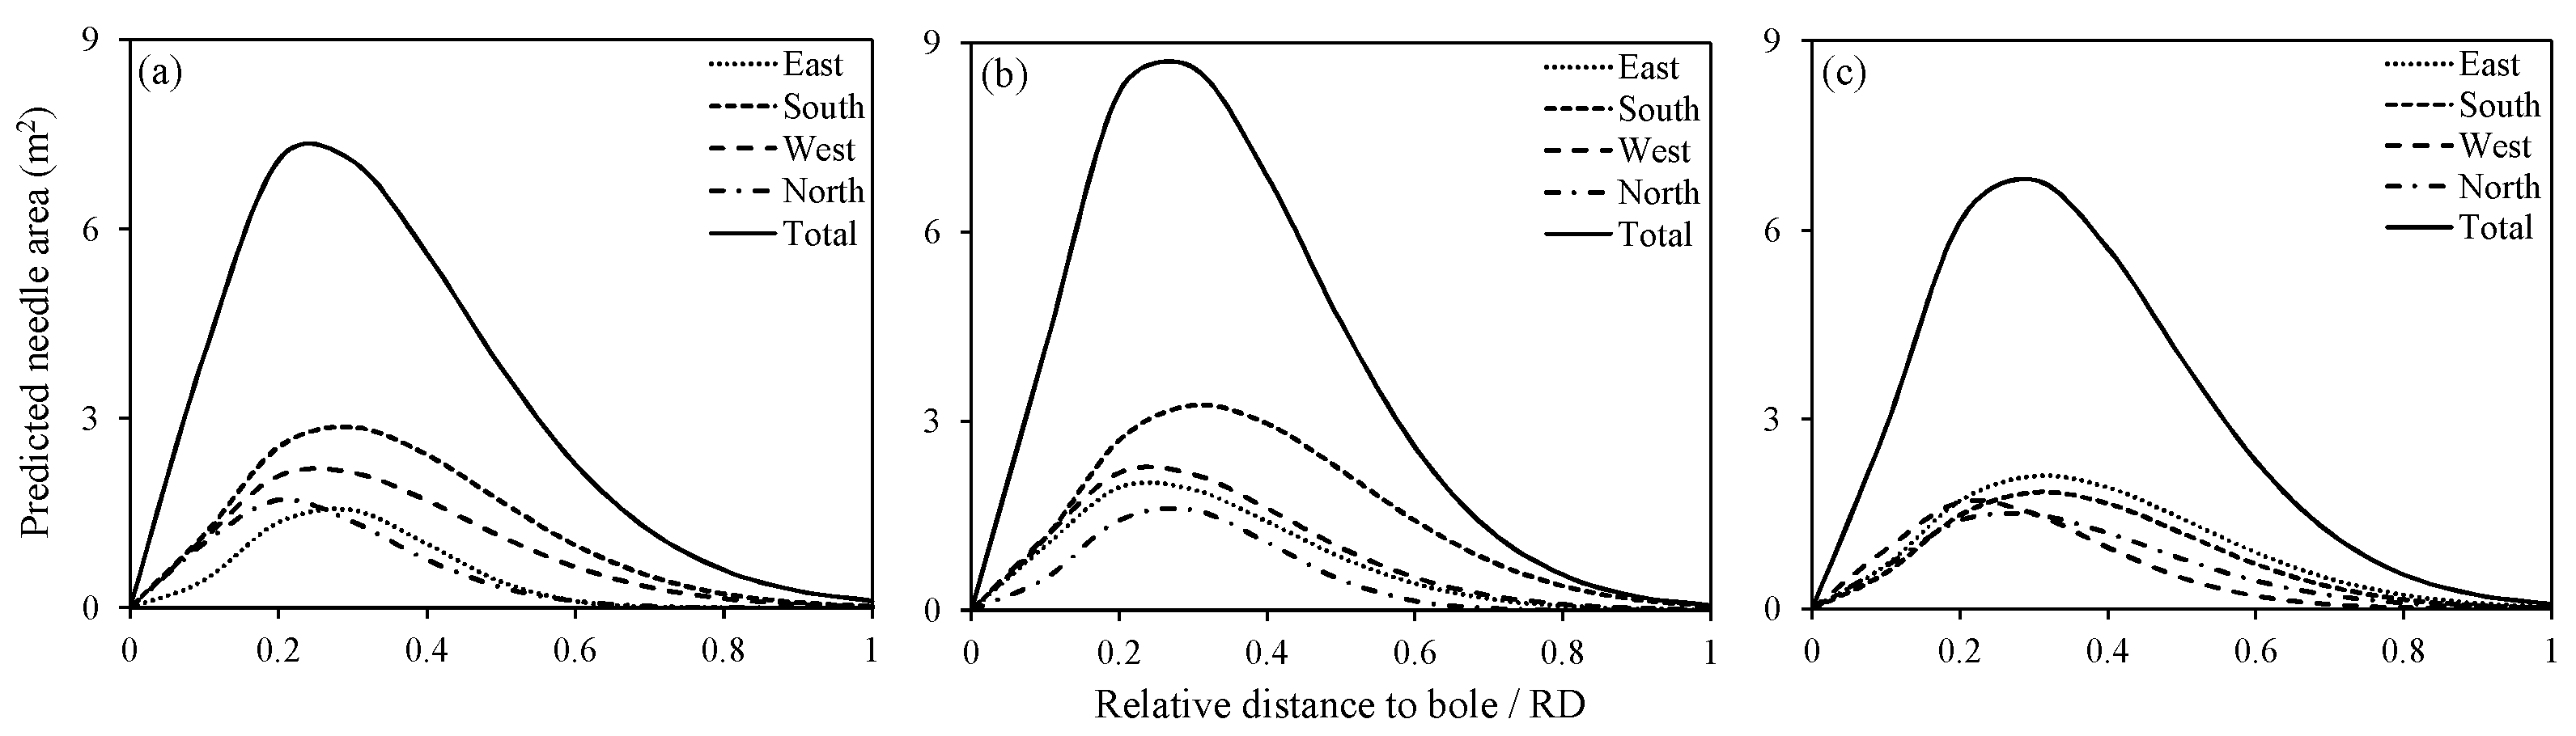
The parameter estimates and the Chi-square test results of the Weibull distribution fitted to the horizontal distribution of NA for three sample trees are presented in Table 3. The Chi-square test indicated that all of the horizontal distributions of NA satisfied the null hypothesis (α = 0.05). Figure 6 shows that the observed NA was distributed almost perfectly along the lines of the estimated NA. Hence, the Weibull distribution was also suitable for describing the horizontal distribution of the NA within the crown. The peak NA in the horizontal direction (PNAH) within the crown in each direction was also calculated from the Weibull distribution (Table 3). The PNAHs within the crown in different directions (east, south, west and north) were concentrated within the range of 0.15 to 0.30, and the relative distance from the bole (RD) exhibited little difference. The RD values of the PNAHs were usually greater in the south direction than in other directions, but in the other directions, the order of the RD values of the PNAHs was not associated with direction. The predicted horizontal distribution of the NA in the four directions for three sample trees is shown in Figure 7. The RD values of the PNAHs of the total NA for three sample trees were 0.19 (tree 1), 0.22 (tree 2) and 0.23 (tree 3), which indicated that the horizontal distribution of the total NA of the whole crown exhibited inside shifts for all three sample trees but this phenomenon was most obvious in tree 1. The difference in PNAHs among the four directions was obvious in tree 2 but weaker in tree 1 and tree 3 because the coefficients of variation (CVs) of the PNAHs among the four directions were 0.29, 0.32 and 0.14 for tree 1, tree 2 and tree 3, respectively.
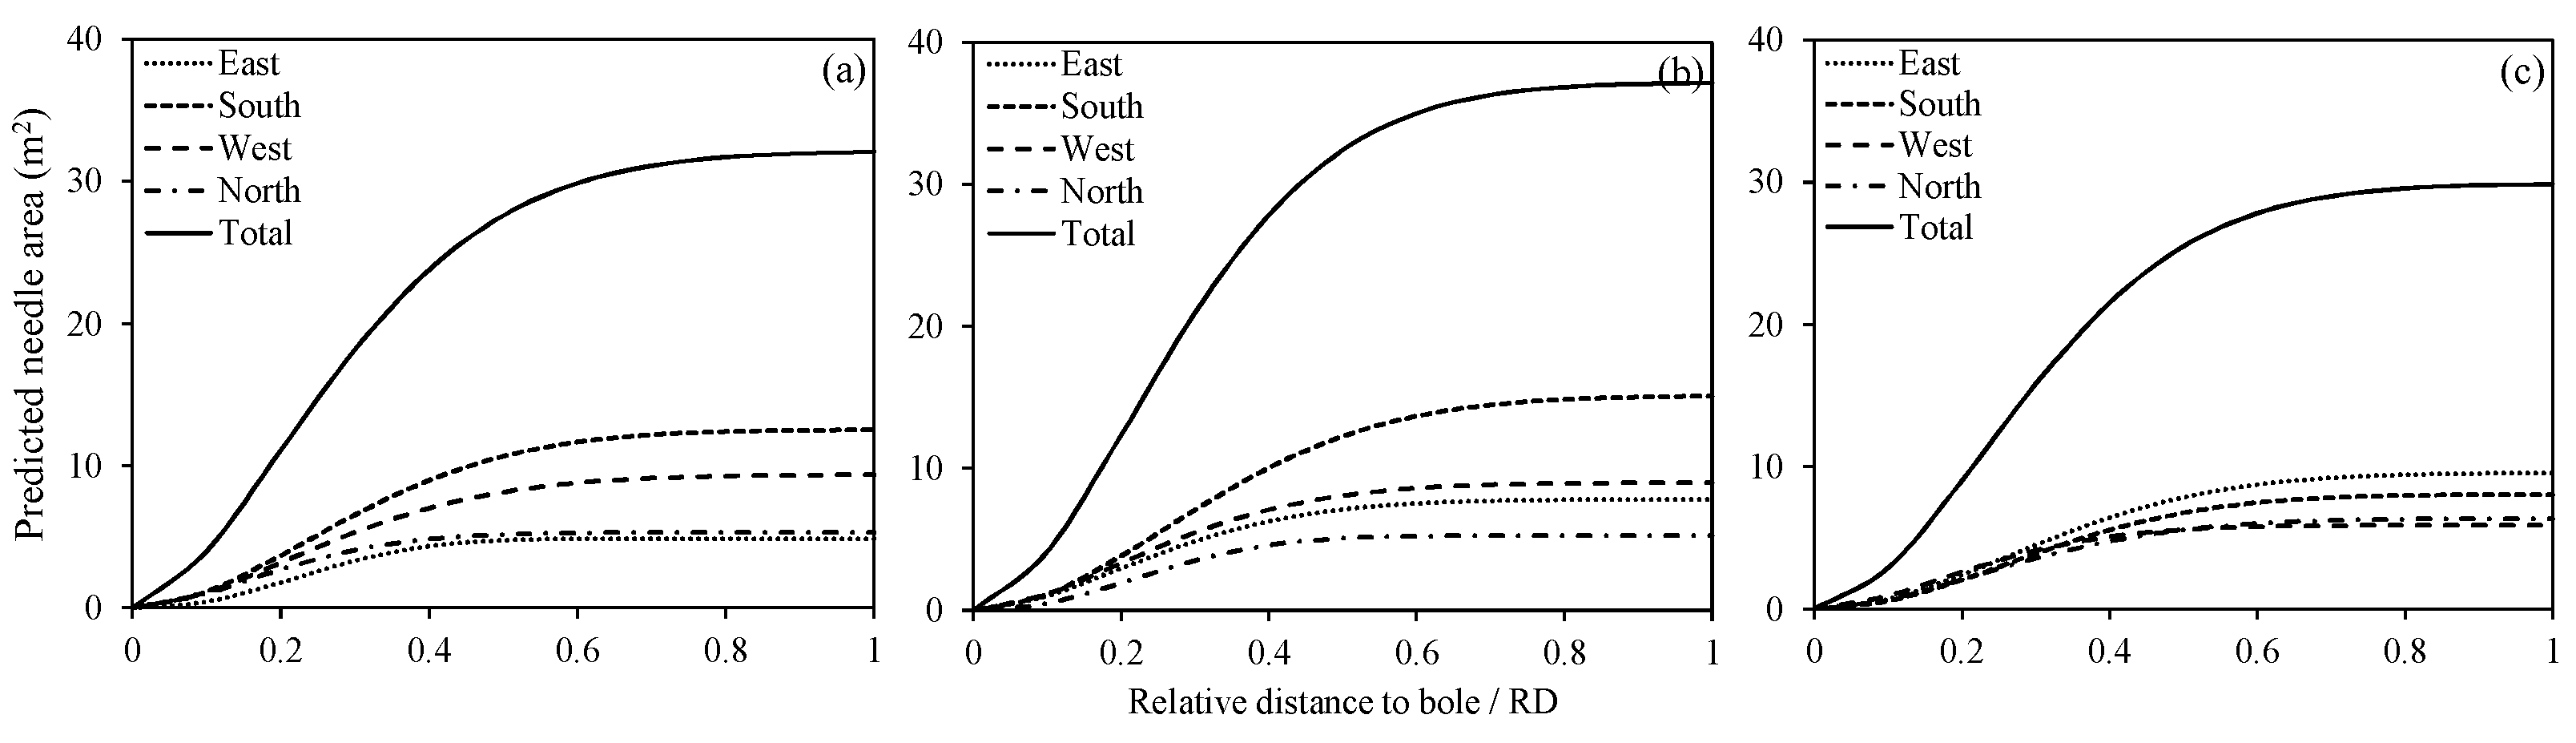
The predicted cumulative horizontal distribution of NA in the four directions within the crown for three sample trees is shown in Figure 8. The CNAs inside the crown (RD < 0.5) of the three sample trees all increased with an increasing RD, but there was almost no increase outside the crown (RD > 0.5), which indicated that most of the NA was concentrated inside the crown. The ratios of CNA within the RD ranged from 0 to 0.5, and for the total NA of the whole crown were 0.86, 0.87 and 0.85 for tree 1, tree 2 and tree 3, respectively, further validating that the horizontal distribution of the NA exhibited an inside shift. The horizontal distributions of the CNA also exhibited obvious variations in different directions. In tree 2, the difference of total NA among four directions was greater than that in tree 1 and tree 3.
3.3. Two-Dimensional Pattern of NA
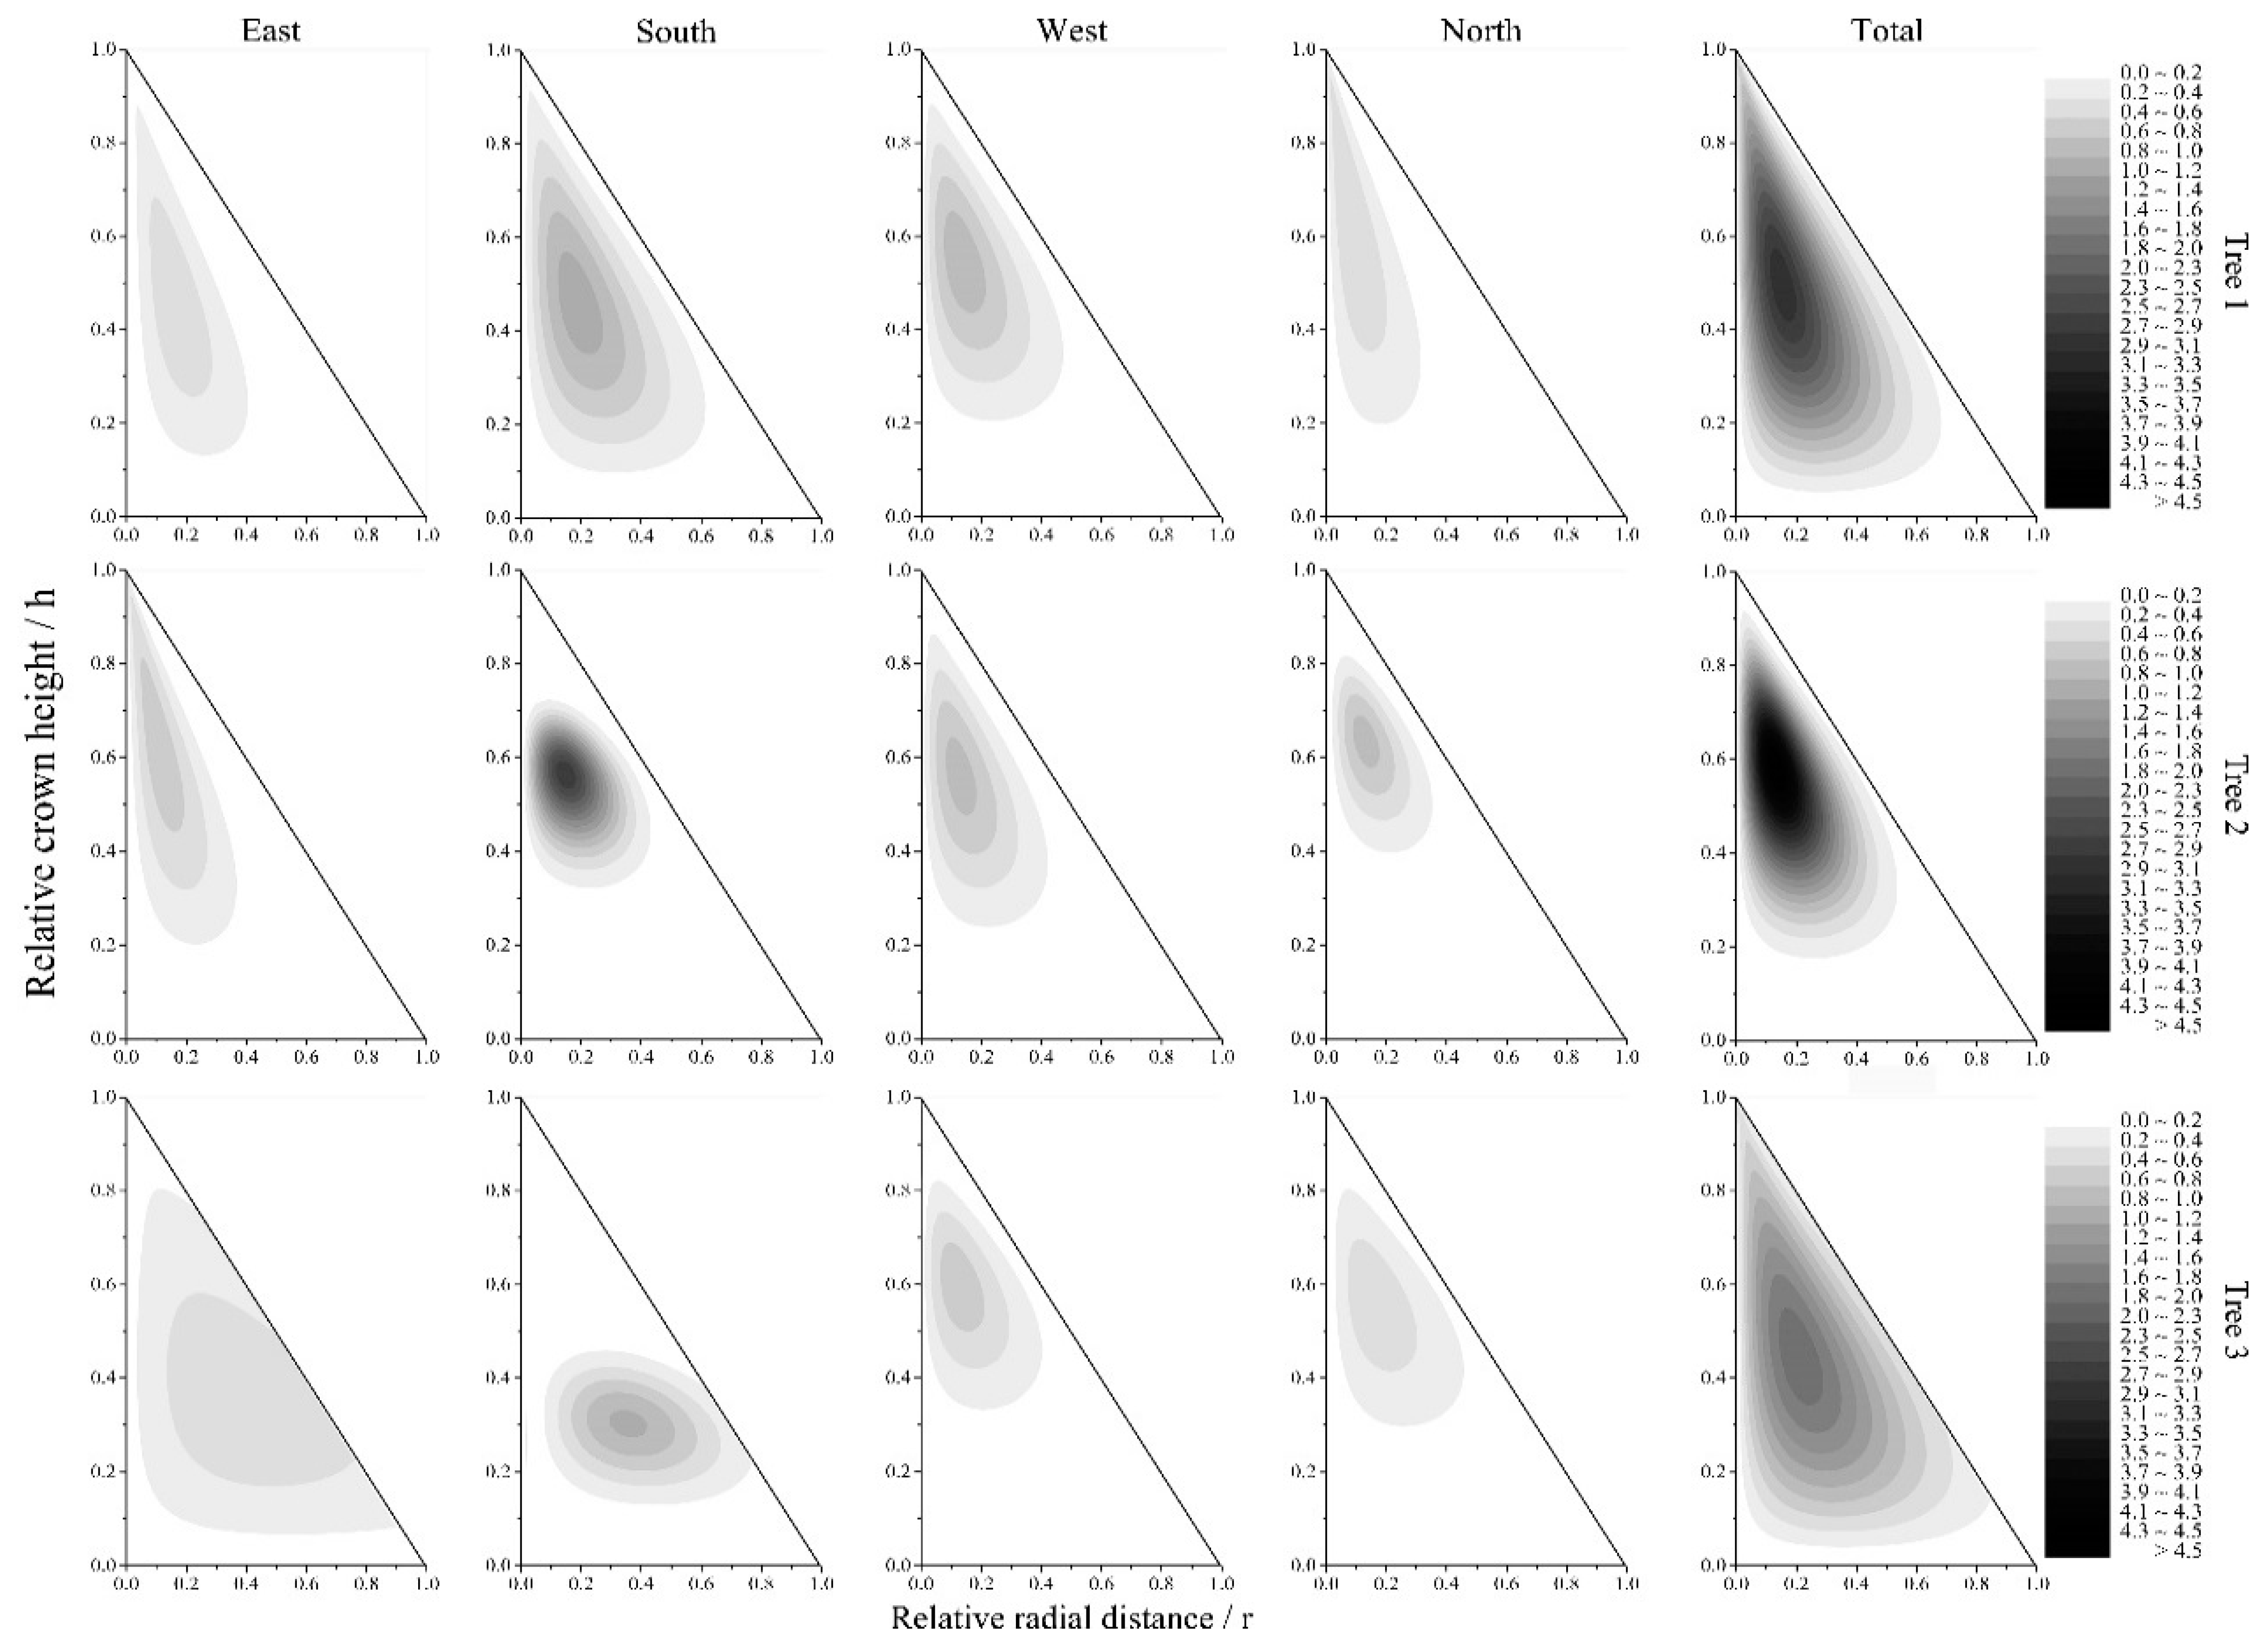
The parameter estimates and the goodness of fit (R2 and RMSE) of the two-dimensional regression model of directional and total NA for three sample trees are presented in Table 4. The large R2 values and small RMSE values reflect that the two-dimensional regression models could fit the two-dimensional NA patterns well. The predicted two-dimensional patterns of the directional and total NA for the three sample trees are shown in Figure 9. The two-dimensional patterns of the NA exhibited an obvious difference among the three sample trees. Although most of the NA was concentrated in the middle of the vertical direction and inside the horizontal direction in both tree 1 and tree 3, the degree of concentration of tree 1 was stronger than that of tree 3. However, the two-dimensional NA pattern of tree 2 exhibited a more obvious upper shift and an inside shift than that exhibited by tree 1 and tree 3. Different crown directions generally exhibited different two-dimensional NA distribution patterns, which was mainly reflected in the concentration degree and concentration position. For tree 1, there was no significant difference in the positions of NA concentration among the four crown directions, and the concentration degrees were stronger in the south and west directions than in the east and north directions. For tree 2, the positions of NA concentration among the four crown directions were also similar, but the concentration degrees were stronger in the south and north directions than in the east and west directions. For tree 3, the positions of NA concentration in the east and south directions were lower in the vertical direction and the middle in the horizontal direction, but the positions of NA concentration in the west and north directions were in the upper part in the vertical direction and inside in the horizontal direction. The degrees of NA concentration were also markedly different in the different directions and descended in the order of south, west, north and east.
4. Discussion
In previous studies, the foliage area or foliage mass of the sub-regions within the crown or the whole crown were mainly obtained by either of two methods: (1) calculated using the foliage removed from sample branches [3,27,31,38] or; (2) estimated by establishing regression models at the branch level [4,8,9,12,15,16,29,30]. The estimations could be accumulated to the desired scale. Regression models have been proven to perform well [4,16] but validations at large scales, such as sub-regions within crowns or whole crowns, still could not be conducted due to the lack of actual measurement data for all branches. For the L. olgensis tree species, there are usually small branches (delayed by one or more years behind the main branches, BIPs) in nodal/internodal pseudowhorls that have proportions of branches and needles that are abnormal compared with the main branches. This phenomenon was also reported in Schneider et al. [9], who found that nodal foliage was more abundant than internodal foliage. The BIPs were generally ignored when selecting branch samples, and consequently, the estimation of the needle mass of these BIPs usually has a large error.
Many previous studies have suggested that the foliage distribution usually exhibited a unimodal curve [31,56] and was not distributed symmetrically within the crown [57]. Some of these studies suggested that the vertical distribution of foliage was skewed upward toward the top of the crown [8,16,25,31,57]. In contrast, others reported that the center of the foliage was located below the crown midpoint [7,15,38]. Foliage development is predominantly dependent on light [22,25,56], which is closely associated with the growing space [38]. In this study, the competitive pressure of tree 1 (CCI = 0.27) and tree 3 (CCI = 0.55) were relative low compared to tree 2 (CCI = 1.10) (Table 1). Thus, the vertical distribution of the NA for t58ree 1 and tree 3 exhibited a downward shift (Figure 4a,c), which was a direct result of the long and wide crowns that were permitted by the ample space and light resources. This result accorded with the results of other works [38]. However, the center of the NA for tree 2 shifted upward significantly toward the top of the crown (Figure 4b) with increased competition. This discrepancy probably arose because of the stronger competition in the lower crown [31], which lead to an appropriate assignment of the NA to favorable light environments in response to shading by competitors in crowded stands [25]. This result appears to be consistent with the results of previous studies that suggested that foliage was typically shifted upward in crowns growing in dense stands relative to the foliage distribution in crowns growing in open stands [25,30,38]. In summary, the differences in the vertical foliage distribution are related to the strategies used to capture light [25].
Our results showed that different crown directions also showed different amounts of plasticity in the shift in foliage distribution within the crown. The CNAs in the south and west crowns were higher than those in the north and east, respectively, for tree 1 and tree 2 (Figure 5a,b), which was consistent with the local sunshine duration that descended in the south, west, east and north [58]. Gao et al. [40] found a similar relationship when modeling crown profiles and suggested that it is necessary to consider the differences caused by different directions when analyzing the crown structure. However, the CNAs in the east and south were greater than those in the west and north (Figure 5c), which was probably caused by dense stands [59]. In our study, we only identified the trees whose crown overlapped with the target tree as the competitors, but some neighboring trees whose crown did not overlap with the target tree may also have intercepted the light [49], and consequently influenced the NA distribution, especially in dense stands.
Both horizontal foliage distribution and vertical distribution play important roles in the determination of light interception [33]. The plasticity of horizontal foliage distribution is also an important component in the adaptive response to stand competition [27]. Our results showed that the peaks of the NA were usually concentrated inside the crown (Figure 7), which was in accordance with other studies on Tsuga heterophylla, Pseudotsuga menziesii and Abies grandis [20], Pinus taeda [10], Cunninghamia lanceolata [21] and L. occidentalis [27]. However, the center of the NA shifted toward the outside with the increase in stand density (Figure 7, Table 3), which was consistent with the results of previous studies that suggested that branches in the shade extend laterally to expose themselves to more sunlight [10,16]. Our results showed that the difference in the horizontal distribution of the NA among different directions was obvious (Figure 7). A similar finding was reported in a L. occidentalis study, in which the horizontal foliage distribution along a branch was significantly different at different directions within the crown [27]. In most species, horizontal foliage distribution also depends on the vertical branch position in the crown, total crown length and social position [10,20,32]; however, all of the factors are related to maximizing the use of light resources.
Wang and Jarvis [1] first simulated the two-dimensional patterns of the LAD by combining the β distribution functions of vertical and horizontal distributions. Similarly, we established a two-dimensional model of the NA (Equation (4)) by combining the Weibull distribution functions of the vertical and horizontal distributions, which demonstrated good performance (Table 4). The predicted two-dimensional patterns of the total NA (Figure 9) showed that the center of the NA usually shifted toward the outside with the increase in RDINC, which was consistent with the results of previous studies [10,20,27], indicating that trees tended to maximize the light available to the needles in the lower crown by minimizing self-shading. The center of the NA shifted upward in the crown (Figure 9) with an increase in CCI (Table 1), which is probably because the competition between trees became stronger. Trees in open stands easily obtain ample space and light resources for branch development, which results in a wider development of branches in low crowns. For individual trees, the two-dimensional pattern of NA also varied with different crown directions, and the difference became more obvious with the increase in stand density (Figure 9). As a result, stronger competition usually caused a more nonuniform distribution of needles to allow more light to penetrate deep into the crown. Thus, the skewed pattern of the NA within a crown reflected the excellent adaptability of the trees.
To date, there have been many studies on foliage distribution but some of them have made a mistake about the meaning of the term “distribution”. Generally, the foliage distribution should be described by probability distribution functions (β distribution function, Weibull distribution function, etc.) that have fixed endpoints (0, 1) which correspond to the top and bottom of a live crown. However, some studies have used the distribution functions only as equations and fit the foliage distribution using a nonlinear regression [10,21,27,29,31]. The parameter estimation methods used for distribution functions and regression equations are the maximum likelihood estimation and nonlinear least squares, respectively, which are different from each other. In our opinion, it is more reasonable to refer to the “vertical or horizontal patterns of foliage” rather than “vertical or horizontal distributions of foliage” when using a regression method. In this study, we used the Weibull distribution function, which has a cumulative distribution form, in order to uniformly characterize the spatial distributions of the NA, including the vertical/horizontal distribution and cumulative vertical/horizontal distribution. A two-dimensional model for the NA was similarly established based on the Weibull distribution function to describe the two-dimensional patterns of NA within the crown.
5. Conclusions
The vertical and horizontal distributions of NA were simulated by the Weibull distribution function, and the cumulative Weibull distribution function was used to simulate the cumulative vertical and horizontal distributions of the NA. All of the above distributions performed well. A two-dimensional NA model was also established based on the Weibull distribution function and exhibited a good fitting result. For a closed stand, the center of the NA generally showed an upward shift in the vertical direction in the crown. This phenomenon became more obvious with the increase in competition. Most of the NA was concentrated inside the crown in the horizontal direction, but the center shifted outward with the increase in competition. The cumulative vertical and horizontal distributions varied quite obviously among the different crown directions. This difference was mainly associated with the light conditions. The two-dimensional NA patterns showed that the center of the NA generally shifted outward with the increase in RDINC. Stronger competition will lead to a more concentrated and more skewed two-dimensional NA pattern. The competition from competitors is the core driver in determining the spatial distribution of the NA, which implied that artificial pruning should be guided by competition. The branches dealing with strong competition generally have smaller NA and consequently less photosynthate. Thus they should be pruned as soon as possible, which may effectively reduce the damage of knots on wood quality.
Author Contributions
Q.L. undertook data analysis and wrote most of the paper. Q.L. and L.X. collected and analyzed the data. F.L. supervised and coordinated the research paper, designed and installed the experiment, made some measurements, and contributed to the writing of the paper.
Funding
This research received no external funding.
Acknowledgments
This research was financially supported by National Natural Science Foundation of China, Project# 31570626 and the Ministry of Science and Technology of the People’s Republic of China Project# 2015BAD09B01. The authors thank the teachers and students of the Department of Forest Management, Northeast Forestry University (NEFU), China, who provided and collected the data for this study. We express our appreciation to all the anonymous reviewers for their constructive comments on the manuscript.
Conflicts of Interest
The authors declare no conflict of interest.
References
- Wang, Y.P.; Jarvis, P.G. Influence of crown structural properties on PAR absorption, photosynthesis, and transpiration in Sitka spruce: Application of a model (MAESTRO). Tree Physiol. 1990, 7, 297–316. [Google Scholar] [CrossRef]
- Vose, J.M.; Sullivan, N.H.; Clinton, B.D.; Bolstad, P.V. Vertical leaf area distribution, light transmittance, and application of the Beer-Lambert Law in four mature hardwood stands in the southern Appalachians. Can. J. For. Res. 1995, 25, 1036–1043. [Google Scholar] [CrossRef]
- Fiora, A.; Cescatti, A. Vertical foliage distribution determines the radial pattern of sap flux density in Picea abies. Tree Physiol. 2008, 28, 1317–1323. [Google Scholar] [CrossRef] [PubMed]
- Weiskittel, A.R.; Kershaw, A.J., Jr.; Hofmeyer, P.V.; Seymour, R.S. Species differences in total and vertical distribution of branch- and tree-level leaf area for the five primary conifer species in Maine, USA. For. Ecol. Manag. 2009, 258, 1695–1703. [Google Scholar] [CrossRef]
- Perttunen, J.; Sievänen, R.; Nikinmaa, E.; Saarenmaa, H.; Väkevä, J. LIGNUM: A Tree Model Based on Simple Structural Units. Ann. Bot. 1996, 77, 87–98. [Google Scholar] [CrossRef] [Green Version]
- Kershaw, J.A.J.; Maguire, D.A. Influence of vertical foliage structure on the distribution of stem cross-sectional area increment in western hemlock and balsam fir. For. Sci. 2000, 46, 86–94. [Google Scholar]
- Mäkelä, A.; Vanninen, P. Vertical structure of Scots pine crowns in different age and size classes. Trees 2001, 15, 385–392. [Google Scholar] [CrossRef]
- Kantola, A.; Mäkelä, A. Crown development in Norway spruce [Picea abies (L.) Karst.]. Trees 2004, 18, 408–421. [Google Scholar] [CrossRef]
- Schneider, R.; Fortin, M.; Berninger, F.; Ung, C.H.; Swift, D.E.; Zhang, S.Y. Modeling Jack Pine (Pinus banksiana) Foliage Density Distribution. For. Sci. 2011, 57, 180–188. [Google Scholar]
- Xu, M.; Harrington, T.B. Foliage biomass distribution of loblolly pine as affected by tree dominance, crown size, and stand characteristics. Can. J. For. Res. 1998, 28, 887–892. [Google Scholar] [CrossRef]
- Kull, O.; Broadmeadow, M.; Kruijt, B.; Meir, P. Light distribution and foliage structure in an oak canopy. Trees 1999, 14, 55–64. [Google Scholar] [CrossRef]
- Luo, Y.; Medlyn, B.; Hui, D.; Ellsworth, D.; Reynolds, J.; Katul, G. Gross primary productivity in duke forest: Modeling synthesis of CO2 experiment and eddy—flux data. Ecol. Appl. 2001, 11, 239–252. [Google Scholar]
- Law, B.E.; Cescatti, A.; Baldocchi, D.D. Leaf area distribution and radiative transfer in open-canopy forests: Implications for mass and energy exchange. Tree Physiol. 2001, 21, 777–787. [Google Scholar] [CrossRef]
- Ellsworth, D.S.; Reich, P.B. Canopy structure and vertical patterns of photosynthesis and related leaf traits in a deciduous forest. Oecologia 1993, 96, 169–178. [Google Scholar] [CrossRef]
- Maguire, D.A.; Bennett, W.S. Patterns in vertical distribution of foliage in young coastal Douglas—fir. Can. J. For. Res. 1996, 26, 1991–2005. [Google Scholar] [CrossRef]
- Utsugi, H.; Araki, M.; Kawaski, T.; Ishizuka, M. Vertical distributions of leaf area and inclination angle, and their relationship in a 46-year-old Chamaecyparis obtusa stand. For. Ecol. Manag. 2006, 225, 104–112. [Google Scholar] [CrossRef]
- Li, F.R.; Wang, Z.F. Studies on the effective crown development of Larix olgensis (I)—Determination of the effective crown. J. Northeast. For. Univ. 1996, 24, 1–8. (In Chinese) [Google Scholar]
- Oliver, C.D.; Larson, B.C. Forest Stand Dynamics; John Wiley & sons, Inc.: New York, NY, USA, 1996. [Google Scholar]
- Liu, Q.; Dong, L.H.; Li, F.L. Modeling net CO2 assimilation (AN) within the crown of young planted Larix olgensis trees. Can. J. For. Res. 2018, 48, 1085–1098. [Google Scholar] [CrossRef]
- Kershaw, J.A., Jr.; Maguire, D.A. Crown structure in western hemlock, Douglas-fir, and grand fir in western Washington: Horizontal distribution of foliage within branches. Can. J. For. Res. 1996, 26, 128–142. [Google Scholar] [CrossRef]
- Zhang, X.Q.; Zhao, D.S.; Xu, D.Y. Spatial distribution and seasonal changes of needle—Leaf area density within 17-year-old Chinese Fir Crown. For. Res. 1999, 12, 612–619. (In Chinese) [Google Scholar]
- Weiskittel, A.R.; Maguire, D.A.; Garber, S.M.; Kanaskie, A. Influence of Swiss needle cast on foliage age class structure and vertical distribution in Douglas-fir plantations of north coastal Oregon. Can. J. For. Res. 2006, 36, 1497–1508. [Google Scholar] [CrossRef]
- Vose, J.M. Patterns of leaf area distribution within crowns of nitrogen and phosphorus—Fertilized loblolly pine trees. For. Sci. 1988, 34, 564–573. [Google Scholar]
- Yang, X.; Miller, D.R.; Montgomery, M.E. Vertical distributions of canopy foliage and biologically active radiation in a defoliated/refoliated hardwood forest. Agric. For. Meteorol. 1993, 67, 129–146. [Google Scholar] [CrossRef]
- Yang, X.; Witcosky, J.J.; Miller, D.R. Vertical overstory canopy architecture of temperate deciduous hardwood forests in the eastern United States. For. Sci. 1999, 45, 349–358. [Google Scholar]
- Saito, S.; Sato, T.; Kominami, Y.; Nagamatsu, D.; Kuramoto, S.; Sakai, T.; Tabuchi, R.; Sakai, A. Modeling the vertical foliage distribution of an individual Castanopsis cuspidata (Thunb.) Schottky, a dominant broad-leaved tree in Japanese warm-temperate forest. Trees 2004, 18, 486–491. [Google Scholar] [CrossRef]
- Williams, G.M.; Nelson, A.S. Spatial variation in specific leaf area and horizontal distribution of leaf area in juvenile western larch (Larix occidentalis, Nutt.). Trees 2018, 32, 1621–1631. [Google Scholar] [CrossRef]
- Gupta, A.K.; Nadarajah, S. Handbook of Beta Distribution and its Applications; Statistics: A Series of Textbooks and Monographs; Marcel Dekker, Inc.: New York, NY, USA, 2004. [Google Scholar]
- Gillespie, A.R.; Allen, H.L.; Vose, J.M. Amount and vertical distribution of foliage of young loblolly pine trees as affected by canopy position and silvicultural treatment. Can. J. For. Res. 1994, 24, 1337–1344. [Google Scholar] [CrossRef]
- Keyser, T.; Smith, F.W. Influence of crown biomass estimators and distribution on canopy fuel characteristics in ponderosa pine stands of the Black Hills. For. Sci. 2009, 56, 156–165. [Google Scholar]
- Ex, S.; Smith, F.W.; Keyser, T.L. Characterizing crown fuel distribution for conifers in the interior we. Can. J. For. Res. 2015, 45, 950–957. [Google Scholar] [CrossRef]
- Temesgen, H.; Lemay, V.M.; Cameron, I.R. Bivariate distribution functions for predicting twig leaf area within. Can. J. For. Res. 2003, 33, 2044–2051. [Google Scholar] [CrossRef]
- Oker-Blom, P. Relationship between radiation interception and photosynthesis in forest canopies: Effect of stand structure and latitude. Ecol. Model. 1989, 49, 73–87. [Google Scholar] [CrossRef]
- Rauscher, H.M.; Isebrands, J.G.; Host, G.E.; Dickson, R.E.; Dickmann, D.I.; Crow, T.R.; Michael, D.A. ECOPHYS: An ecophysiological growth process model for juvenile poplar. Tree Physiol. 1990, 7, 255–281. [Google Scholar] [CrossRef]
- Host, G.E.; Rauscher, H.M.; Isebrands, J.G.; Michael, D.A. Validation of photosynthate production in ECOPHYS, an ecophysiological growth process model of Populus. Tree Physiol. 1991, 7, 283–296. [Google Scholar] [CrossRef]
- Zhang, X.Q.; Xu, D. Eco-physiological modelling of canopy photosynthesis and growth of a Chinese fir plantation. For. Ecol. Manag. 2003, 173, 201–211. [Google Scholar] [CrossRef]
- Zhang, X.Q.; Xu, D. Modeling radiation transfer within the canopy of a Chinese fir plantation. For. Ecol. Manag. 2002, 170, 107–116. [Google Scholar] [CrossRef]
- Garber, S.M.; Maguire, D.A. The response of vertical foliage distribution to spacing and species composition in mixed conifer stands in central Oregon. For. Ecol. Manag. 2005, 211, 341–355. [Google Scholar] [CrossRef]
- Salemaa, M.; Lindgren, M. Crown Condition; Springer Netherlands, Inc.: Berlin, Germany, 2000. [Google Scholar]
- Gao, H.L.; Dong, L.H.; Li, F.R. Modeling variation in crown profile with tree status and cardinal directions for planted Larix olgensis Henry trees in Northeast China. Forests 2017, 8, 1–15. [Google Scholar]
- Marshall, J.D.; Rehfeldt, G.E.; Monserud, R.A. Family differences in height growth and photosynthetic traits in three conifers. Tree Physiol. 2001, 21, 727–734. [Google Scholar] [CrossRef] [Green Version]
- Piboule, A.; Collet, C.; Frochot, H.; Dhôte, J.F. Reconstructing crown shape from stem diameter and tree position to supply light models. I. Algorithms and comparison of light simulations. Ann. For. Sci. 2005, 62, 645–657. [Google Scholar] [CrossRef] [Green Version]
- Zhu, J.J.; Liu, Z.G.; Wang, H.X.; Yan, Q.L.; Fang, H.Y.; Hu, L.; Yu, L.Z. Effects of site preparation on emergence and early establishment of Larix olgensis, in montane regions of northeastern China. New For. 2008, 36, 247–260. [Google Scholar] [CrossRef]
- Wei, H.X.; Xu, C.Y.; Hawkins, B.J.; Ma, L.; Jiang, L. Organic amendment and inorganic fertilization affect soil properties and quality of Larix olgensis bareroot stock. New For. 2012, 43, 155–168. [Google Scholar] [CrossRef]
- Peng, W.; Pukkala, T.; Jin, X.J.; Li, F.R. Optimal management of larch (Larix olgensis A. Henry) plantations in Northeast China when timber production and carbon stock are considered. Ann. For. Sci. 2018, 75, 63. [Google Scholar] [CrossRef]
- Qi, L.Z.; Liu, J.Y.; Liu, G.F.; Fang, J.S.; Dong, J.L.; Zheng, X.X.; Hong, Q.X. The variation of strobiles and cones and seeds of Larix olgensis. J. Northeast. For. Univ. 1995, 23, 7–13. (In Chinese) [Google Scholar]
- Zhu, Y.; Dumroese, R.; Pinto, J.; Li, G.L.; Liu, Y. Fall fertilization enhanced nitrogen storage and translocation in Larix olgensis seedlings. New For. 2013, 44, 849–861. [Google Scholar] [CrossRef]
- Luca, T.H.D. Relationship of 0.5MK2SO4 extractable anthrone-reactive carbon to indices of microbial activity in forest soils. Soil Biol. Biochem. 1998, 30, 1293–1299. [Google Scholar] [CrossRef]
- Pretzsch, H.; Biber, P.; Ďurský, J. The single tree-based stand simulator SILVA: Construction, application and evaluation. For. Ecol. Manag. 2002, 162, 3–21. [Google Scholar] [CrossRef]
- Cluzeau, C.; Goff, N.L.; Ottorini, J.M. Development of primary branches and crown profile of Fraxinus excelsior. Can. J. For. Res. 1994, 24, 2315–2323. [Google Scholar] [CrossRef]
- Liu, Z.; Jin, G.; Qi, Y. Estimate of leaf area index in an old-growth mixed broadleaved-Korean pine forest in northeastern China. PLoS ONE 2012, 7, e32155. [Google Scholar]
- Liu, Z.; Chen, J.M.; Jin, G.; Qi, Y.J. Estimating seasonal variations of leaf area index using litterfall collection and optical methods in four mixed evergreen–deciduous forests. Agric. For. Meteorol. 2015, 209–210, 36–48. [Google Scholar] [CrossRef]
- Wang, X.C.; Janssens, I.A.; Yuste, J.C.; Ceulemans, R. Variation of specific leaf area and upscaling to leaf area index in mature Scots pine. Trees 2006, 20, 304–310. [Google Scholar]
- Fellner, H.; Dirnberger, G.F.; Sterba, H. Specific leaf area of European Larch (Larix decidua Mill.). Trees 2016, 30, 1237–1244. [Google Scholar] [CrossRef]
- Li, F.R.; Jia, W. Modeling Locational distribution of Branches within the Crowns of Larix olgensis Trees in China. J. Korean For. Soc. 2004, 93, 335–343. [Google Scholar]
- Čermák, J.; Roberto, T.; Nadezhda, N.; Raschi, A. Stand structure and foliage distribution in Quercus pubescens and Quercus cerris forests in Tuscany (central Italy). For. Ecol. Manag. 2008, 255, 1810–1819. [Google Scholar] [CrossRef]
- Massman, W.J. Foliage distribution in old—growth coniferous tree canopies. Can. J. For. Res. 1982, 12, 10–17. [Google Scholar] [CrossRef]
- Zeng, L.H.; Song, K.S.; Zhang, B.; Wang, Z.M. Spatial-temporal changes of sunshine hours in growing season over Northeast China from 1960 to 2008a. Soil Crop 2010, 26, 363–370. (In Chinese) [Google Scholar]
- Zhang, W.Z.; Shen, H.L. Needle area distribution of trees in different growth classes from young and middle-aged plantations of pinus sylvestris var. mongolica. J. Northeast. For. Univ. 2011, 39, 43–45. (In Chinese) [Google Scholar]
Figure 1.
A schematic diagram of the identification of competitors relative to the target tree.

Figure 2.
A schematic diagram of the crown attributes of an L. olgensis tree and the principle of sub-region division.
Figure 2.
A schematic diagram of the crown attributes of an L. olgensis tree and the principle of sub-region division.

Figure 3.
Description of the observed NA and corresponding estimated NA for three sample trees.

Figure 4.
Vertical distribution of predicted needle area (NA), according to RDINC at intervals of 0.1 in different directions for three sample trees: (a) tree 1; (b) tree 2 and (c) tree 3.
Figure 4.
Vertical distribution of predicted needle area (NA), according to RDINC at intervals of 0.1 in different directions for three sample trees: (a) tree 1; (b) tree 2 and (c) tree 3.

Figure 5.
Cumulative vertical distribution of the predicted NA, according to the relative depth into the crown (RDINC) at intervals of 0.1, in different directions for three sample trees: (a) tree 1; (b) tree 2 and (c) tree 3.
Figure 5.
Cumulative vertical distribution of the predicted NA, according to the relative depth into the crown (RDINC) at intervals of 0.1, in different directions for three sample trees: (a) tree 1; (b) tree 2 and (c) tree 3.

Figure 6.
Description of the observed NA and corresponding estimated NA for three sample trees.

Figure 7.
Horizontal distribution of the predicted NA, according to the relative distance from the bole (RD) at intervals of 0.1 in different directions, for three sample trees: (a) tree 1; (b) tree 2 and (c) tree 3.
Figure 7.
Horizontal distribution of the predicted NA, according to the relative distance from the bole (RD) at intervals of 0.1 in different directions, for three sample trees: (a) tree 1; (b) tree 2 and (c) tree 3.

Figure 8.
Cumulative horizontal distribution of the predicted NA according to the RD at intervals of 0.1 in different directions for three sample trees: (a) tree 1; (b) tree 2 and (c) tree 3.
Figure 8.
Cumulative horizontal distribution of the predicted NA according to the RD at intervals of 0.1 in different directions for three sample trees: (a) tree 1; (b) tree 2 and (c) tree 3.

Figure 9.
The results of the simulation of a two-dimensional NA for the whole and different directions of crowns for three sample trees.
Figure 9.
The results of the simulation of a two-dimensional NA for the whole and different directions of crowns for three sample trees.


Table 1.
Attributes of the plots, sample trees, and corresponding competitors for the L. olgensis plantation.
Table 1.
Attributes of the plots, sample trees, and corresponding competitors for the L. olgensis plantation.
| Plots | Sample Trees | Competitors | ||||||||||||
|---|---|---|---|---|---|---|---|---|---|---|---|---|---|---|
| Plot No. | Dg | BA | Tree No. | DBH | H | CW | CL | Competitor No. | DBH | H | CW | CL | RAN | CCI |
| (cm) | (m2 ha−1) | (cm) | (m) | (m) | (m) | (cm) | (m) | (m) | (m) | (°) | ||||
| 1 | 9.9 | 68.1 | 1 | 10.8 | 10.3 | 1.7 | 8.9 | 1 | 7.5 | 7.6 | 1.1 | 5.5 | 56 | 0.126 |
| 2 | 9.5 | 8.2 | 1.1 | 5.8 | 354 | 0.022 | ||||||||
| 3 | 11.8 | 10 | 1.4 | 8.5 | 150 | 0.122 | ||||||||
| 2 | 10.6 | 87.3 | 2 | 11.2 | 10.5 | 1.5 | 8.5 | 1 | 11.9 | 10.4 | 2 | 7.4 | 185 | 0.386 |
| 2 | 8 | 10 | 1.2 | 5.9 | 226 | 0.107 | ||||||||
| 3 | 9.4 | 9.2 | 1.1 | 5.2 | 290 | 0.250 | ||||||||
| 4 | 12.3 | 10.3 | 1.4 | 7.6 | 0 | 0.143 | ||||||||
| 5 | 10 | 5.6 | 1.3 | 3.7 | 50 | 0.060 | ||||||||
| 6 | 7.1 | 8.4 | 1.1 | 6 | 90 | 0.154 | ||||||||
| 3 | 9.6 | 84.6 | 3 | 10.9 | 10.8 | 1.6 | 7.9 | 1 | 14.7 | 12 | 1.8 | 9.4 | 85 | 0.122 |
| 2 | 9.8 | 9.7 | 1.3 | 7.1 | 120 | 0.024 | ||||||||
| 3 | 14.9 | 9.2 | 1.7 | 7.2 | 153 | 0.001 | ||||||||
| 4 | 12.2 | 8.9 | 1.8 | 7.1 | 0 | 0.006 | ||||||||
| 5 | 12.2 | 8.6 | 1.8 | 7.3 | 240 | 0.253 | ||||||||
| 6 | 9.2 | 8.4 | 1.4 | 6.2 | 310 | 0.077 | ||||||||
| 7 | 11.2 | 8.9 | 1.3 | 5.9 | 0 | 0.068 | ||||||||
Note: Tree No. = tree number, Dg = quadratic mean diameter, BA = basal area per ha, DBH = diameter at breast height, H = tree height, CW = mean value of crown width of four directions, CL = crown length, RAN = relative azimuth of competitors to target tree, CCI = crown competition index of competitors.
Table 2.
Parameter estimates and Chi-square test of the Weibull function fitted to the vertical distribution of NA in different directions.
Table 2.
Parameter estimates and Chi-square test of the Weibull function fitted to the vertical distribution of NA in different directions.
| Tree No. | Direction | Parameters | χ2 | χ2 a = 0.05 | RDINC Value of Maximum NA | |
|---|---|---|---|---|---|---|
| b | c | |||||
| 1 | East | 0.615 | 3.129 | 1.516 | 11.070 | 0.57 |
| South | 0.645 | 3.162 | 6.909 | 11.070 | 0.60 | |
| West | 0.631 | 2.823 | 3.421 | 11.070 | 0.54 | |
| North | 0.589 | 2.551 | 1.635 | 11.070 | 0.51 | |
| Total | 0.628 | 2.925 | 7.859 | 11.070 | 0.55 | |
| 2 | East | 0.485 | 2.472 | 2.560 | 9.488 | 0.40 |
| South | 0.504 | 3.293 | 6.825 | 11.070 | 0.45 | |
| West | 0.484 | 2.777 | 2.761 | 12.592 | 0.42 | |
| North | 0.382 | 3.208 | 1.630 | 9.488 | 0.35 | |
| Total | 0.479 | 2.851 | 7.063 | 12.592 | 0.41 | |
| 3 | East | 0.655 | 3.365 | 2.716 | 11.070 | 0.60 |
| South | 0.695 | 4.529 | 10.437 | 11.070 | 0.68 | |
| West | 0.492 | 3.153 | 3.073 | 9.488 | 0.45 | |
| North | 0.601 | 2.939 | 1.548 | 11.070 | 0.54 | |
| Total | 0.623 | 3.191 | 6.587 | 11.070 | 0.56 | |
Note: Tree No. = tree number, RDINC = relative depth into crown, NA = needle area.
Table 3.
Parameter estimates and Chi-square test of the Weibull function fitted to the horizontal distribution of NA in different directions.
Table 3.
Parameter estimates and Chi-square test of the Weibull function fitted to the horizontal distribution of NA in different directions.
| Tree No. | Direction | Parameters | χ2 | χ2 a = 0.05 | RD Value of Maximum NA | |
|---|---|---|---|---|---|---|
| b | c | |||||
| 1 | East | 0.282 | 2.276 | 1.974 | 5.991 | 0.22 |
| South | 0.353 | 1.851 | 0.541 | 7.815 | 0.23 | |
| West | 0.332 | 1.736 | 0.304 | 7.815 | 0.20 | |
| North | 0.242 | 1.749 | 1.887 | 7.815 | 0.15 | |
| Total | 0.335 | 1.670 | 7.467 | 9.488 | 0.19 | |
| 2 | East | 0.304 | 1.770 | 1.493 | 7.815 | 0.19 |
| South | 0.382 | 1.899 | 2.185 | 7.815 | 0.26 | |
| West | 0.310 | 1.752 | 2.880 | 9.488 | 0.19 | |
| North | 0.286 | 2.177 | 2.730 | 5.991 | 0.22 | |
| Total | 0.333 | 1.775 | 5.985 | 9.488 | 0.21 | |
| 3 | East | 0.379 | 1.944 | 0.792 | 9.488 | 0.26 |
| South | 0.369 | 1.996 | 0.711 | 5.991 | 0.26 | |
| West | 0.270 | 1.766 | 0.317 | 5.991 | 0.17 | |
| North | 0.334 | 1.808 | 0.309 | 7.815 | 0.21 | |
| Total | 0.351 | 1.827 | 1.565 | 9.488 | 0.23 | |
Note: Tree No. = tree number, RD = ratio of the projective length from the tip to stem junction to the crown width, NA = needle area.
Table 4.
Fitted results of a two-dimensional model of the directional and total NA for three planted L. olgensis trees.
Table 4.
Fitted results of a two-dimensional model of the directional and total NA for three planted L. olgensis trees.
| Tree No. | Directions | Estimated Coefficients | R2 | RMSE | ||||
|---|---|---|---|---|---|---|---|---|
| a0 | c1 | b1 | c2 | b2 | ||||
| 1 | East | 0.100 | 2.218 | 0.598 | 2.168 | 0.403 | 0.884 | 0.062 |
| South | 0.203 | 2.487 | 0.563 | 1.957 | 0.503 | 0.663 | 0.231 | |
| West | 0.170 | 3.255 | 0.611 | 1.798 | 0.466 | 0.618 | 0.179 | |
| North | 0.102 | 2.392 | 0.795 | 1.814 | 0.355 | 0.794 | 0.089 | |
| Total | 0.129 | 2.478 | 0.610 | 1.869 | 0.454 | 0.790 | 0.440 | |
| 2 | East | 0.120 | 2.681 | 0.744 | 2.078 | 0.397 | 0.611 | 0.163 |
| South | 0.493 | 7.193 | 0.577 | 2.198 | 0.446 | 0.824 | 0.275 | |
| West | 0.143 | 3.535 | 0.617 | 1.846 | 0.441 | 0.605 | 0.149 | |
| North | 0.156 | 5.834 | 0.657 | 2.112 | 0.481 | 0.930 | 0.036 | |
| Total | 0.756 | 4.241 | 0.617 | 2.046 | 0.436 | 0.942 | 0.403 | |
| 3 | East | 0.086 | 1.856 | 0.533 | 1.579 | 1.107 | 0.538 | 0.179 |
| South | 0.230 | 3.820 | 0.329 | 2.319 | 0.626 | 0.518 | 0.206 | |
| West | 0.146 | 4.433 | 0.634 | 1.768 | 0.498 | 0.870 | 0.078 | |
| North | 0.107 | 3.599 | 0.613 | 1.761 | 0.559 | 0.585 | 0.119 | |
| Total | 0.356 | 2.164 | 0.590 | 1.833 | 0.574 | 0.617 | 0.500 | |
Note: Tree No. = tree number, RDINC = relative depth into crown, NA = needle area. R2 = coefficient of determination, RMSE = root mean square error.
© 2019 by the authors. Licensee MDPI, Basel, Switzerland. This article is an open access article distributed under the terms and conditions of the Creative Commons Attribution (CC BY) license (http://creativecommons.org/licenses/by/4.0/).
Share and Cite
MDPI and ACS Style
Liu, Q.; Xie, L.; Li, F. The Spatial Distribution of the Needle Area of Planted Larix olgensis Trees. Forests 2019, 10, 28. https://doi.org/10.3390/f10010028
AMA Style
Liu Q, Xie L, Li F. The Spatial Distribution of the Needle Area of Planted Larix olgensis Trees. Forests. 2019; 10(1):28. https://doi.org/10.3390/f10010028
Chicago/Turabian StyleLiu, Qiang, Longfei Xie, and Fengri Li. 2019. "The Spatial Distribution of the Needle Area of Planted Larix olgensis Trees" Forests 10, no. 1: 28. https://doi.org/10.3390/f10010028
Note that from the first issue of 2016, this journal uses article numbers instead of page numbers. See further details here.