Article

Stocks and Stoichiometry of Soil Organic Carbon, Total Nitrogen, and Total Phosphorus after Vegetation Restoration in the Loess Hilly Region, China

1
State Key Laboratory of Soil Erosion and Dryland Farming on Loess Plateau, Institute of Soil and Water Conservation, Chinese Academy of Sciences and Ministry of Water Resources, Yangling 712100, China
2
Institute of Soil and Water Conservation, Northwest A&F University, Yangling 712100, China
3
Institute of College of Natural Resources and Environment, University of Chinese Academy of Sciences, Beijing 100049, China
*
Author to whom correspondence should be addressed.
Forests 2019, 10(1), 27; https://doi.org/10.3390/f10010027
Submission received: 17 November 2018 / Revised: 21 December 2018 / Accepted: 27 December 2018 / Published: 3 January 2019
(This article belongs to the Special Issue Nutrient Cycling in Forest Ecosystems)

Abstract

:
The Loess Plateau is an important region for vegetation restoration in China; however, changes in soil organic carbon (SOC), soil nutrients, and stoichiometry after restoration in this vulnerable ecoregion are not well understood. Typical restoration types, including orchardland, grassland, shrubland, and forestland, were chosen to examine changes in the stocks and stoichiometry of SOC, soil total nitrogen (TN), and soil total phosphorus (TP) at different soil depths and recovery times. Results showed that SOC stocks first increased and then stabilized in orchardland, grassland, and shrubland at 0–30 cm depths, while in forestland, SOC stocks gradually increased. Soil TN stocks first increased and then decreased in orchardland, shrubland, and forestland with restoration age at 0–30 cm depths, while soil TP stocks showed little variation between restoration types; at the same time, the overall C:N, C:P, and N:P ratios increased with restoration age. In the later stages of restoration, the stocks of SOC and soil TN at 0–30 cm soil depths were still lower than those in natural grassland and natural forest. Additionally, the SOC, soil TN, and soil TP stocks and the C:N, C:P, and N:P ratios decreased with soil depth. The forestland had the highest rate of change in SOC and soil TN stocks, at 0–10 cm soil depth. These results indicate a complex response of SOC, soil TN, and soil TP stocks and stoichiometry to vegetation restoration, which could have important implications for understanding C, N, and P changes and nutrient limitations after vegetation restoration.

1. Introduction

Soil is an important component of terrestrial ecosystems and the main source of the nutrients required for plant growth and development. Soil organic carbon (SOC), soil total nitrogen (TN), and soil total phosphorus (TP) are the main structural and nutritional components of soil and are also the main limiting factors in terrestrial ecosystems [1]. Soil organic C, soil TN, and soil TP stocks reflect the potential of the soil to provide nutrients to vegetation. These elements continuously circulate between the layers of the soil (the biogeochemical cycles of C, N, and P), which ensures a smooth flow of energy and maintains the stability of ecosystems [2]. The availabilities of soil TN and soil TP are major factors regulating the carbon balance of the ecosystem. Elemental stoichiometry is an important indicator reflecting the C, N, and P cycles in soil and the accumulation and balance of nutrients in ecosystems, and it can help to determine the responses of ecological processes to global changes [3].
Vegetation restoration has received intensive interest because of its potential influence on global C and N cycling, soil quality improvement, land management, and regional economic development [4]. Land use change in the form of vegetation restoration plays an important role in improving the ecological environment and function of ecosystems and can also improve soil quality and soil nutrient cycling. Improved soil quality will, in turn, affect plant production and ecosystem function.
A large number of related studies have shown that stocks and stoichiometry of SOC, soil TN, and soil TP are closely related to land use type [5,6], and nutrient inputs and outputs are considered to be the main factors affecting soil nutrient content [7,8,9]. Some studies have found that vegetation restoration can promote photosynthesis, soil nutrient accumulation, and microbial activity [10,11,12], and increase the stoichiometry of SOC, soil TN, and soil TP [9]. However, other studies have indicated that land use change can lead to decreases in soil nutrient contents [13]. Studies estimating the impact of land use on the stocks and stoichiometry of SOC, TN, and TP have mainly focused on the topsoil (0–20 cm), as this is considered to be the most active soil layer in terms of natural and anthropogenic disturbances [14]. Recent studies have shown that the nutrient content of deep soils may also vary greatly with land use [14,15]. Therefore, understanding how C, N, and P stocks and stoichiometry change in soil with land use changes can clarify soil nutrient availability and nutrient cycling and balance mechanisms, and is of great significance for regional ecosystem health assessments.
The Loess Plateau, China, is located in a semi-arid/semi-humid climate zone which has undergone serious soil erosion. It is an ecologically fragile area and a key area for soil and water conservation efforts in China. Before the 1950s, extreme weather such as droughts, heavy rain, hailstorms, strong winds, and dust storms occurred frequently in this area, resulting in serious soil erosion. In addition, as a result of long-term and unsustainable land use, vegetation has been destroyed over large areas due to grazing and farming. The large-scale cultivation of sloping cropland further aggravated the soil erosion. The amount of nitrogen, phosphorus, and potassium lost from slope farmland has been estimated at 12.7 million tons per year [16]. Vegetation restoration was implemented in the 1970s in this region. In order to control soil erosion and improve ecosystem function, ecological restoration and environmental reconstruction work has been carried out in which slope cropland (slope > 25°) has been converted into orchardland, grassland, shrubland, and forestland. After decades of continuous efforts, vegetation coverage has increased, and the ecological environment has been greatly improved [17]. The sequestration and stoichiometry of SOC, soil TN, and soil TP varies among different vegetation types and restoration ages; therefore, its effect on soil physicochemical properties varies as well. It is important, therefore, to clarify annual and vertical variations in the SOC, soil TN, and soil TP stocks and stoichiometry in soils with different vegetation types in the Loess Hilly Region, China.
In order to better understand the SOC processes, carbon budget of the soil, and soil fertility issues after afforestation, we addressed the following questions: (1) How have stocks of SOC, soil TN, and soil TP, and their ratios, changed across the Loess Hilly Region, China, after decades of vegetation restoration? (2) Are these changes associated with soil depth? (3) How do these changes vary with restoration type? We further hypothesized that (1) as litter inputs to the soil increase with restoration age, stocks of SOC and soil TN increase, whereas soil TP stocks do not significantly change since P stocks are primarily affected by parent minerals. The change rate will be greatest for SOC, followed by soil TN, and then soil TP, causing an increase in the C:N, C:P, and N:P ratios with restoration age; (2) vegetation restoration affects stocks of SOC, soil TN, and soil TP at the soil surface more than at greater soil depths; and (3) due to differences in the litter produced by different vegetation, root secretions and soil microorganisms will also vary between restoration types, resulting in differences in stocks and ratios of SOC, soil TN, and soil TP.

2. Materials and Methods
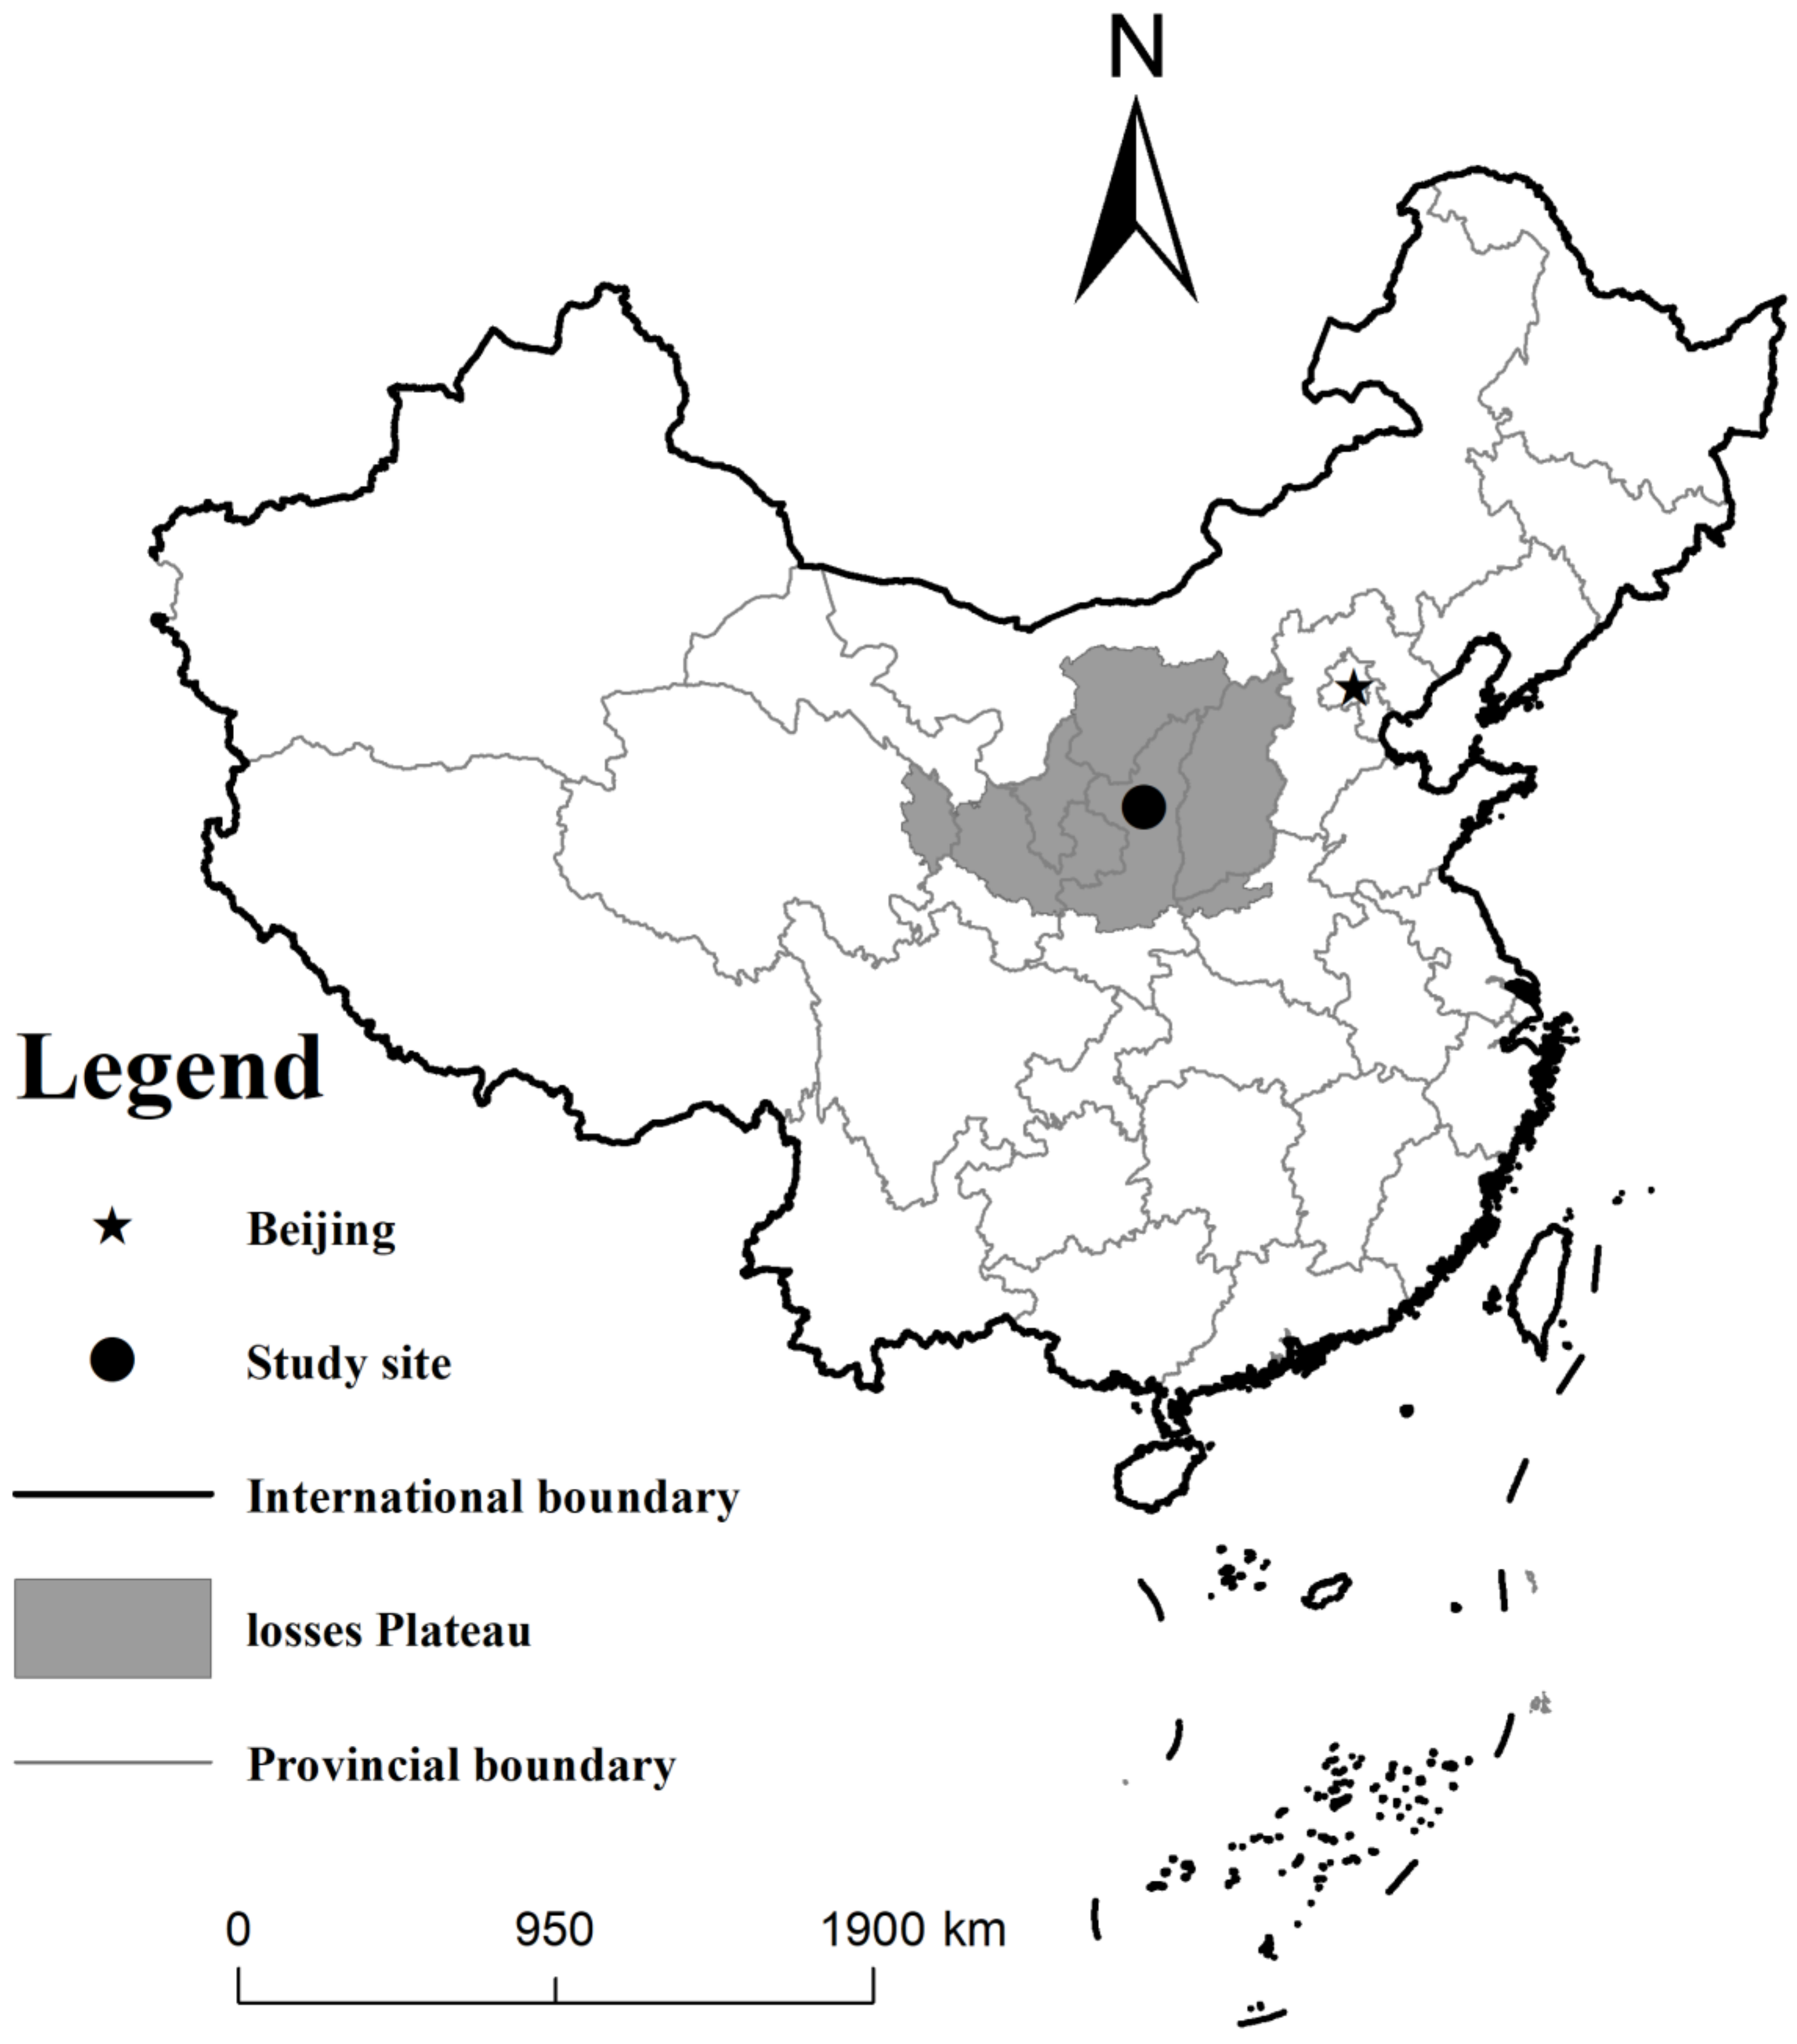
2.1. Study Area

The study area was located in Ansai County, Shanxi Province, China in the center of the Loess Plateau (Figure 1). This region has a warm temperate and semi-arid climate with an annual average temperature of 8.8 °C. Annual precipitation is approximately 500 mm, 60% of which falls between July and September, and the frost-free period is 157 days. The soil is mainly composed of Huangmian soil developed on wind-deposited loessial parent material. This type of soil is characterized by weak cohesion, which has made it prone to severe soil erosion. The sand (2.00–0.02 mm grain size), silt (0.02–0.002 mm), and clay (<0.002 mm) contents are 65%, 24%, and 11%, respectively. The soil bulk density (BD) and soil pH of the tillage layer range from 1.15 to 1.35 g cm−3 and 8.4 to 8.6, respectively.

2.2. Soil Sampling and Laboratory Analyses

With the aim to examine changes in the stocks and stoichiometry of soil organic carbon (SOC), soil total nitrogen (TN), and soil total phosphorus (TP) after vegetation restoration in different restoration types, this study adopted a “space for time” approach. A total of 82 sites representing four restoration types were selected based on vegetation type, topographic features, and restoration age, comprising 9 sites of orchardland (5, 10, and 20 years), 34 sites of grassland (2, 5, 8, 11, 15, 18, 26, and 30 years), 24 shrubland (5, 10, 20, 30, 36, and 47 years), and 15 forestland (5, 10, 20, 37, and 56 years). In addition, we selected three slope cropland sites, which were studied at 0 years. Because the four restoration areas were transformed from croplands, four natural grassland sites (age > 50 years) and nine natural forest sites (age > 100 years) were selected as controls (Table S1). Three 10 × 10 m plots were chosen in each orchardland, three 2 × 2 m plots in each grassland (grassland and natural grassland), three 10 × 10 m plots in each shrubland, and three 20 × 20 m plots in each forestland type (forestland and natural forest). Each plot was at least 50 m from the other plots. A total of 15 soil samples were collected from five soil depths (0–10, 10–20, 20–30, 30–50, and 50–100 cm) in a random sampling design using a soil drilling sampler (4 cm inner diameter). Soil samples from each plot from the same soil depth were mixed to form one sample. These soil samples were brought back to the laboratory and then divided into two parts. One part of the sample was naturally air-dried, plant roots and other impurities were removed, and then the SOC, soil TN, and soil TP were measured. The other part was stored in a refrigerator at 4 °C until further analysis of other indicators, which are not presented in this paper.
The soil bulk density (BD) of each depth was measured using the cutting ring method. The SOC was determined using the H2SO4–K2Cr2O7 method [18]. The soil TN was measured using the Kjeldahl method [19], and the soil TP was determined colorimetrically using the ammonium molybdate method [20].

2.3. Calculation of SOC, Soil TN, and Soil TP Stocks

The stocks of SOC, soil TN, and soil TP from five soil depths of 0–10, 10–20, 20–30, 30–50, and 50–100 cm in different restoration types were selected in our study to research the carbon budget of the soil and soil fertility issues after afforestation. The SOC, soil TN, and soil TP stocks (Mg ha−1) were calculated as follows:
SOCi stock = SOCi × BDi × Di/10,
Soil TNi stock = soil TNi × BDi × Di/10,
Soil TPi stock = soil TPi × BDi × Di/10,
where SOCi is the soil organic carbon content of the ith layer of soil (g kg−1), soil TNi is the soil total N content of the ith layer of soil (g kg−1), soil TPi is the soil total P content of the ith layer of soil (g kg−1), BDi is the soil bulk density of the ith layer of soil (g cm−3), and Di is the soil depth of the ith layer of soil (cm).

2.4. Statistical Analyses

Two-way ANOVAs were used to determine the effects of restoration age, soil depth, and their interaction on SOC, soil TN, and soil TP stocks and C:N, C:P, and N:P ratios. An independent samples t-test was used to compare the SOC, soil TN, and soil TP stocks and the C:N, C:P, and N:P ratios from sites grassland30, natural grassland, shrubland47, forestland56, and natural forest (p < 0.05). Before ANOVA analyses, we performed tests for normality and homogeneity of variance. In order to compare the effects of vegetation type, we selected SOC, soil TN, and soil TP contents and stoichiometry for the same or similar years from the four restoration types: orchardland (5 years, 10 years, 20 years), grassland (5 years, 11 years as 10 years, 18 as 20 years), shrubland (5 years, 10 years), and forestland (5 years, 10 years). In addition, we selected the SOC, soil TN, and soil TP contents from different soil depths as the rate of change with recovery years and compared the SOC, soil TN, and soil TP sequestration rates between different restoration types. All statistical analyses were conducted using SPSS 21.0 (SPSS Inc., Chicago, IL, USA). Figures were drawn using Origin 9.0.

3. Results

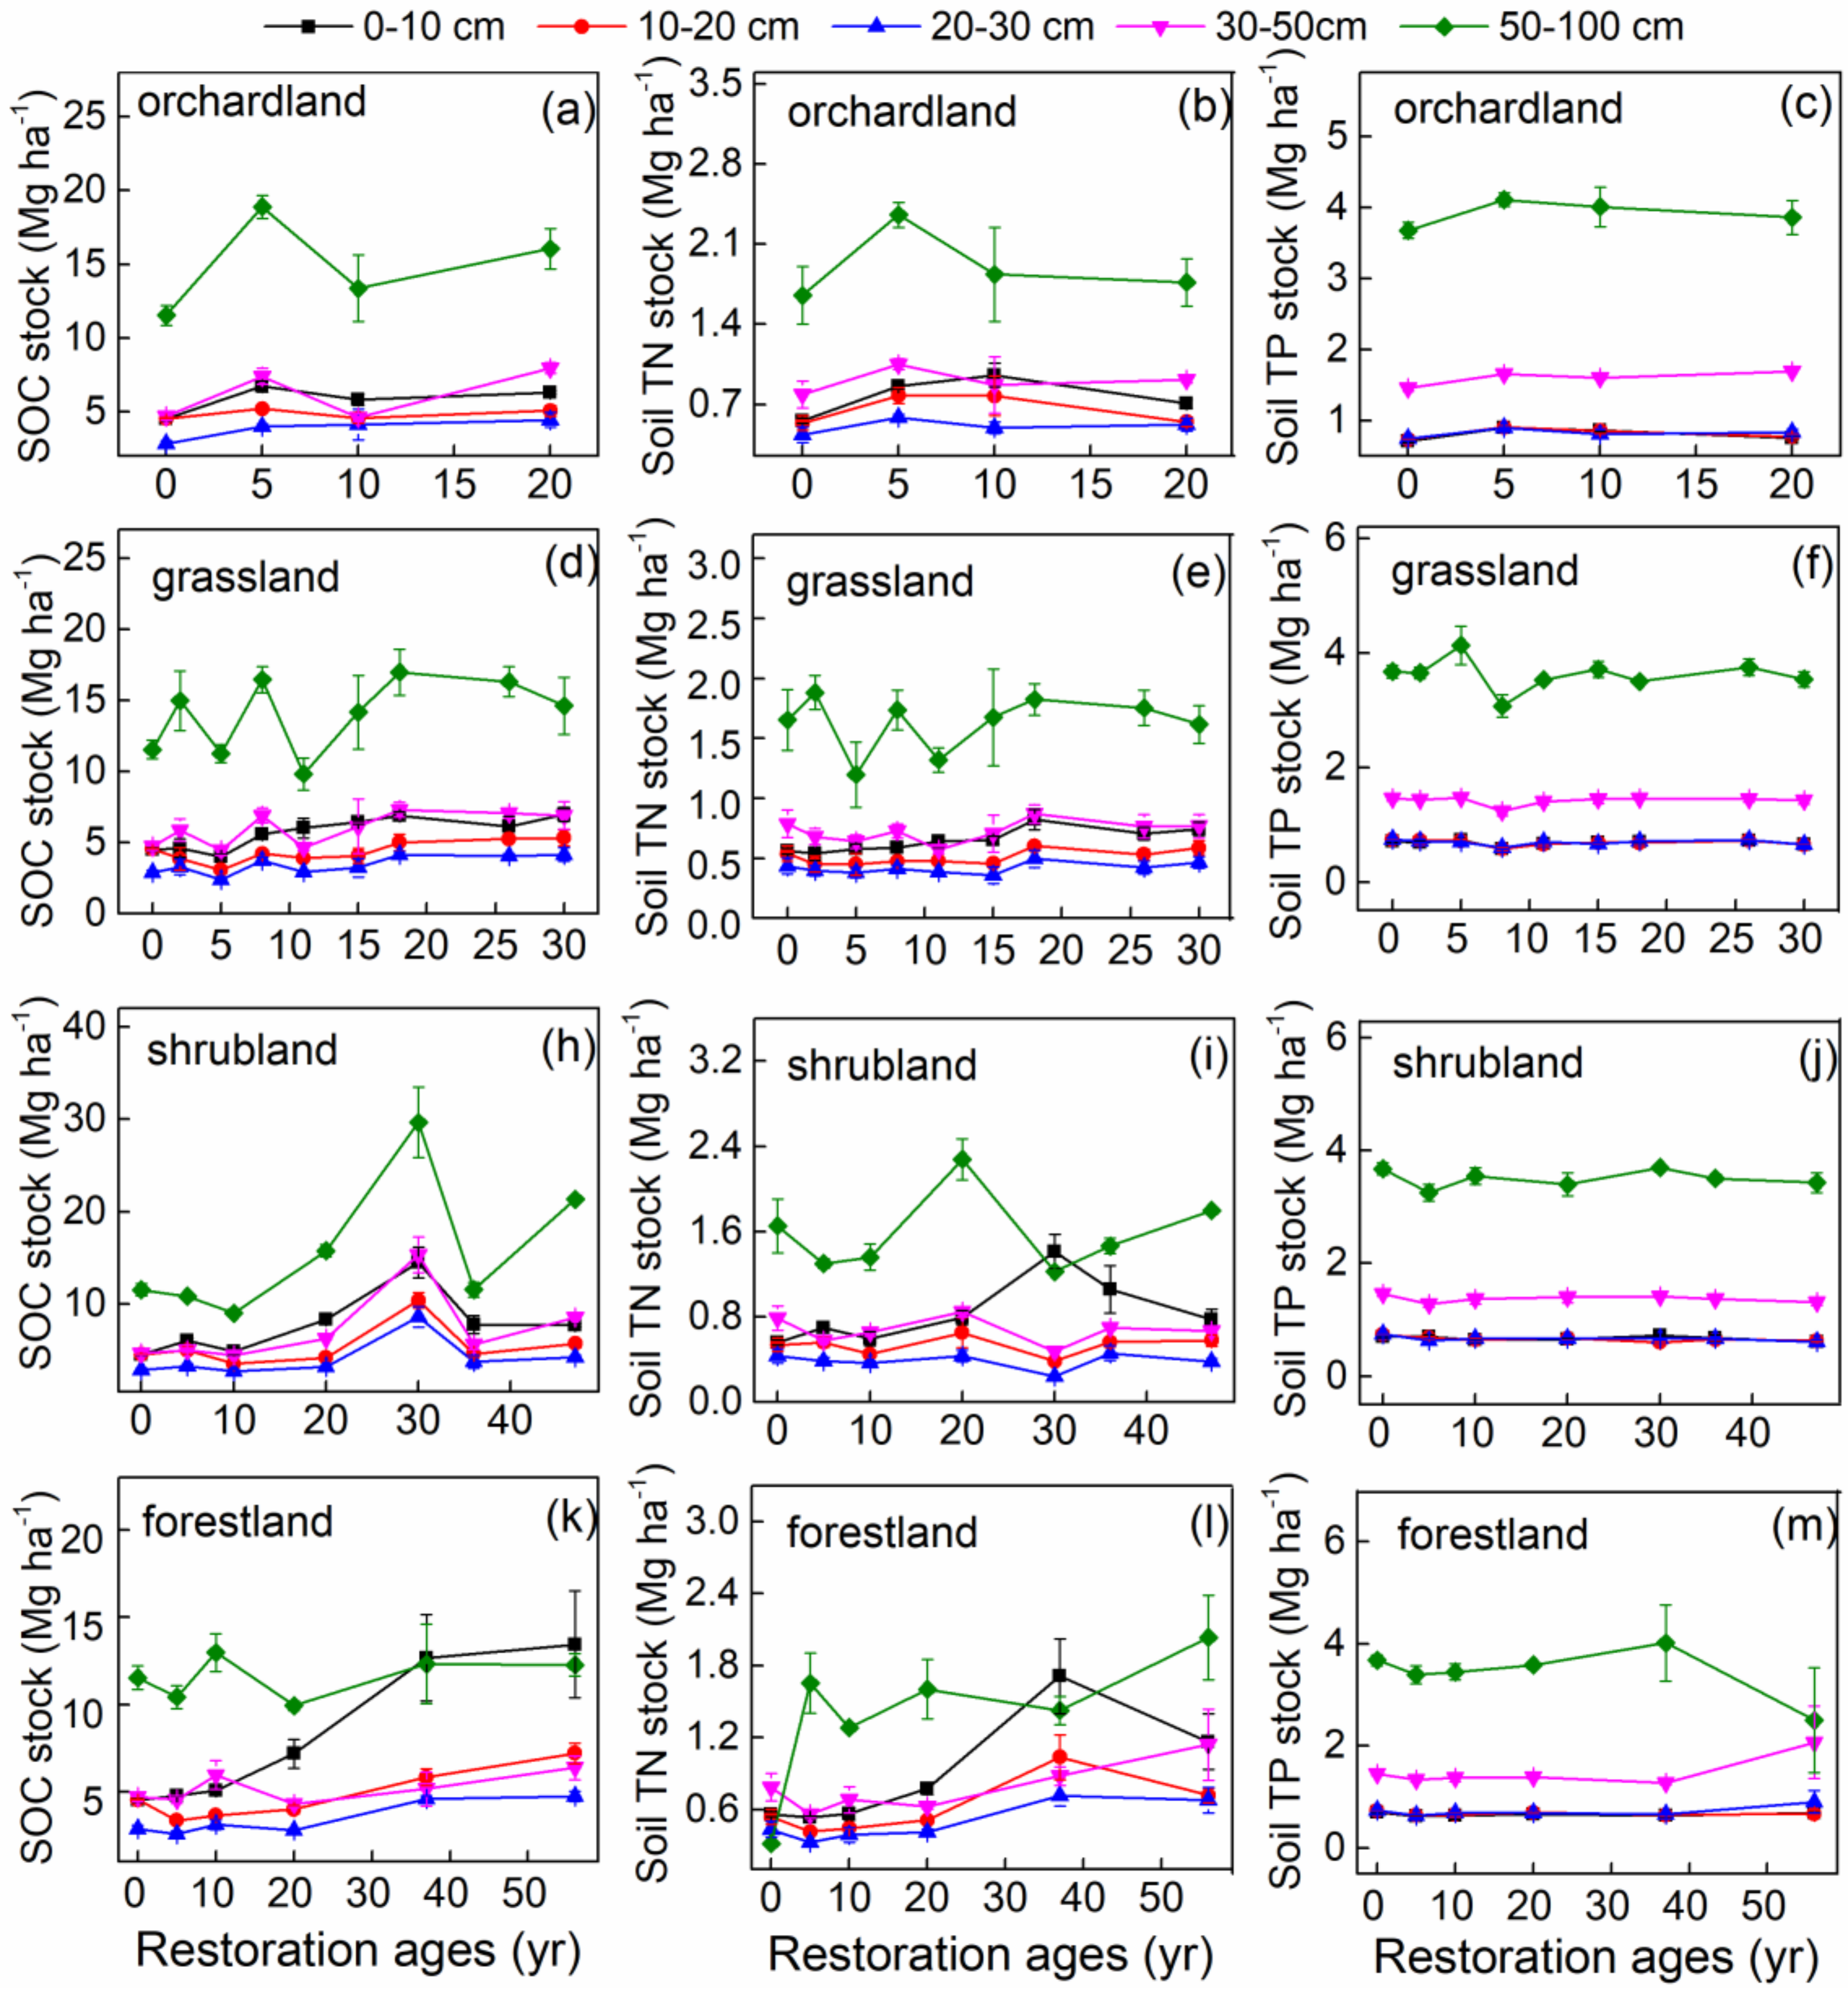
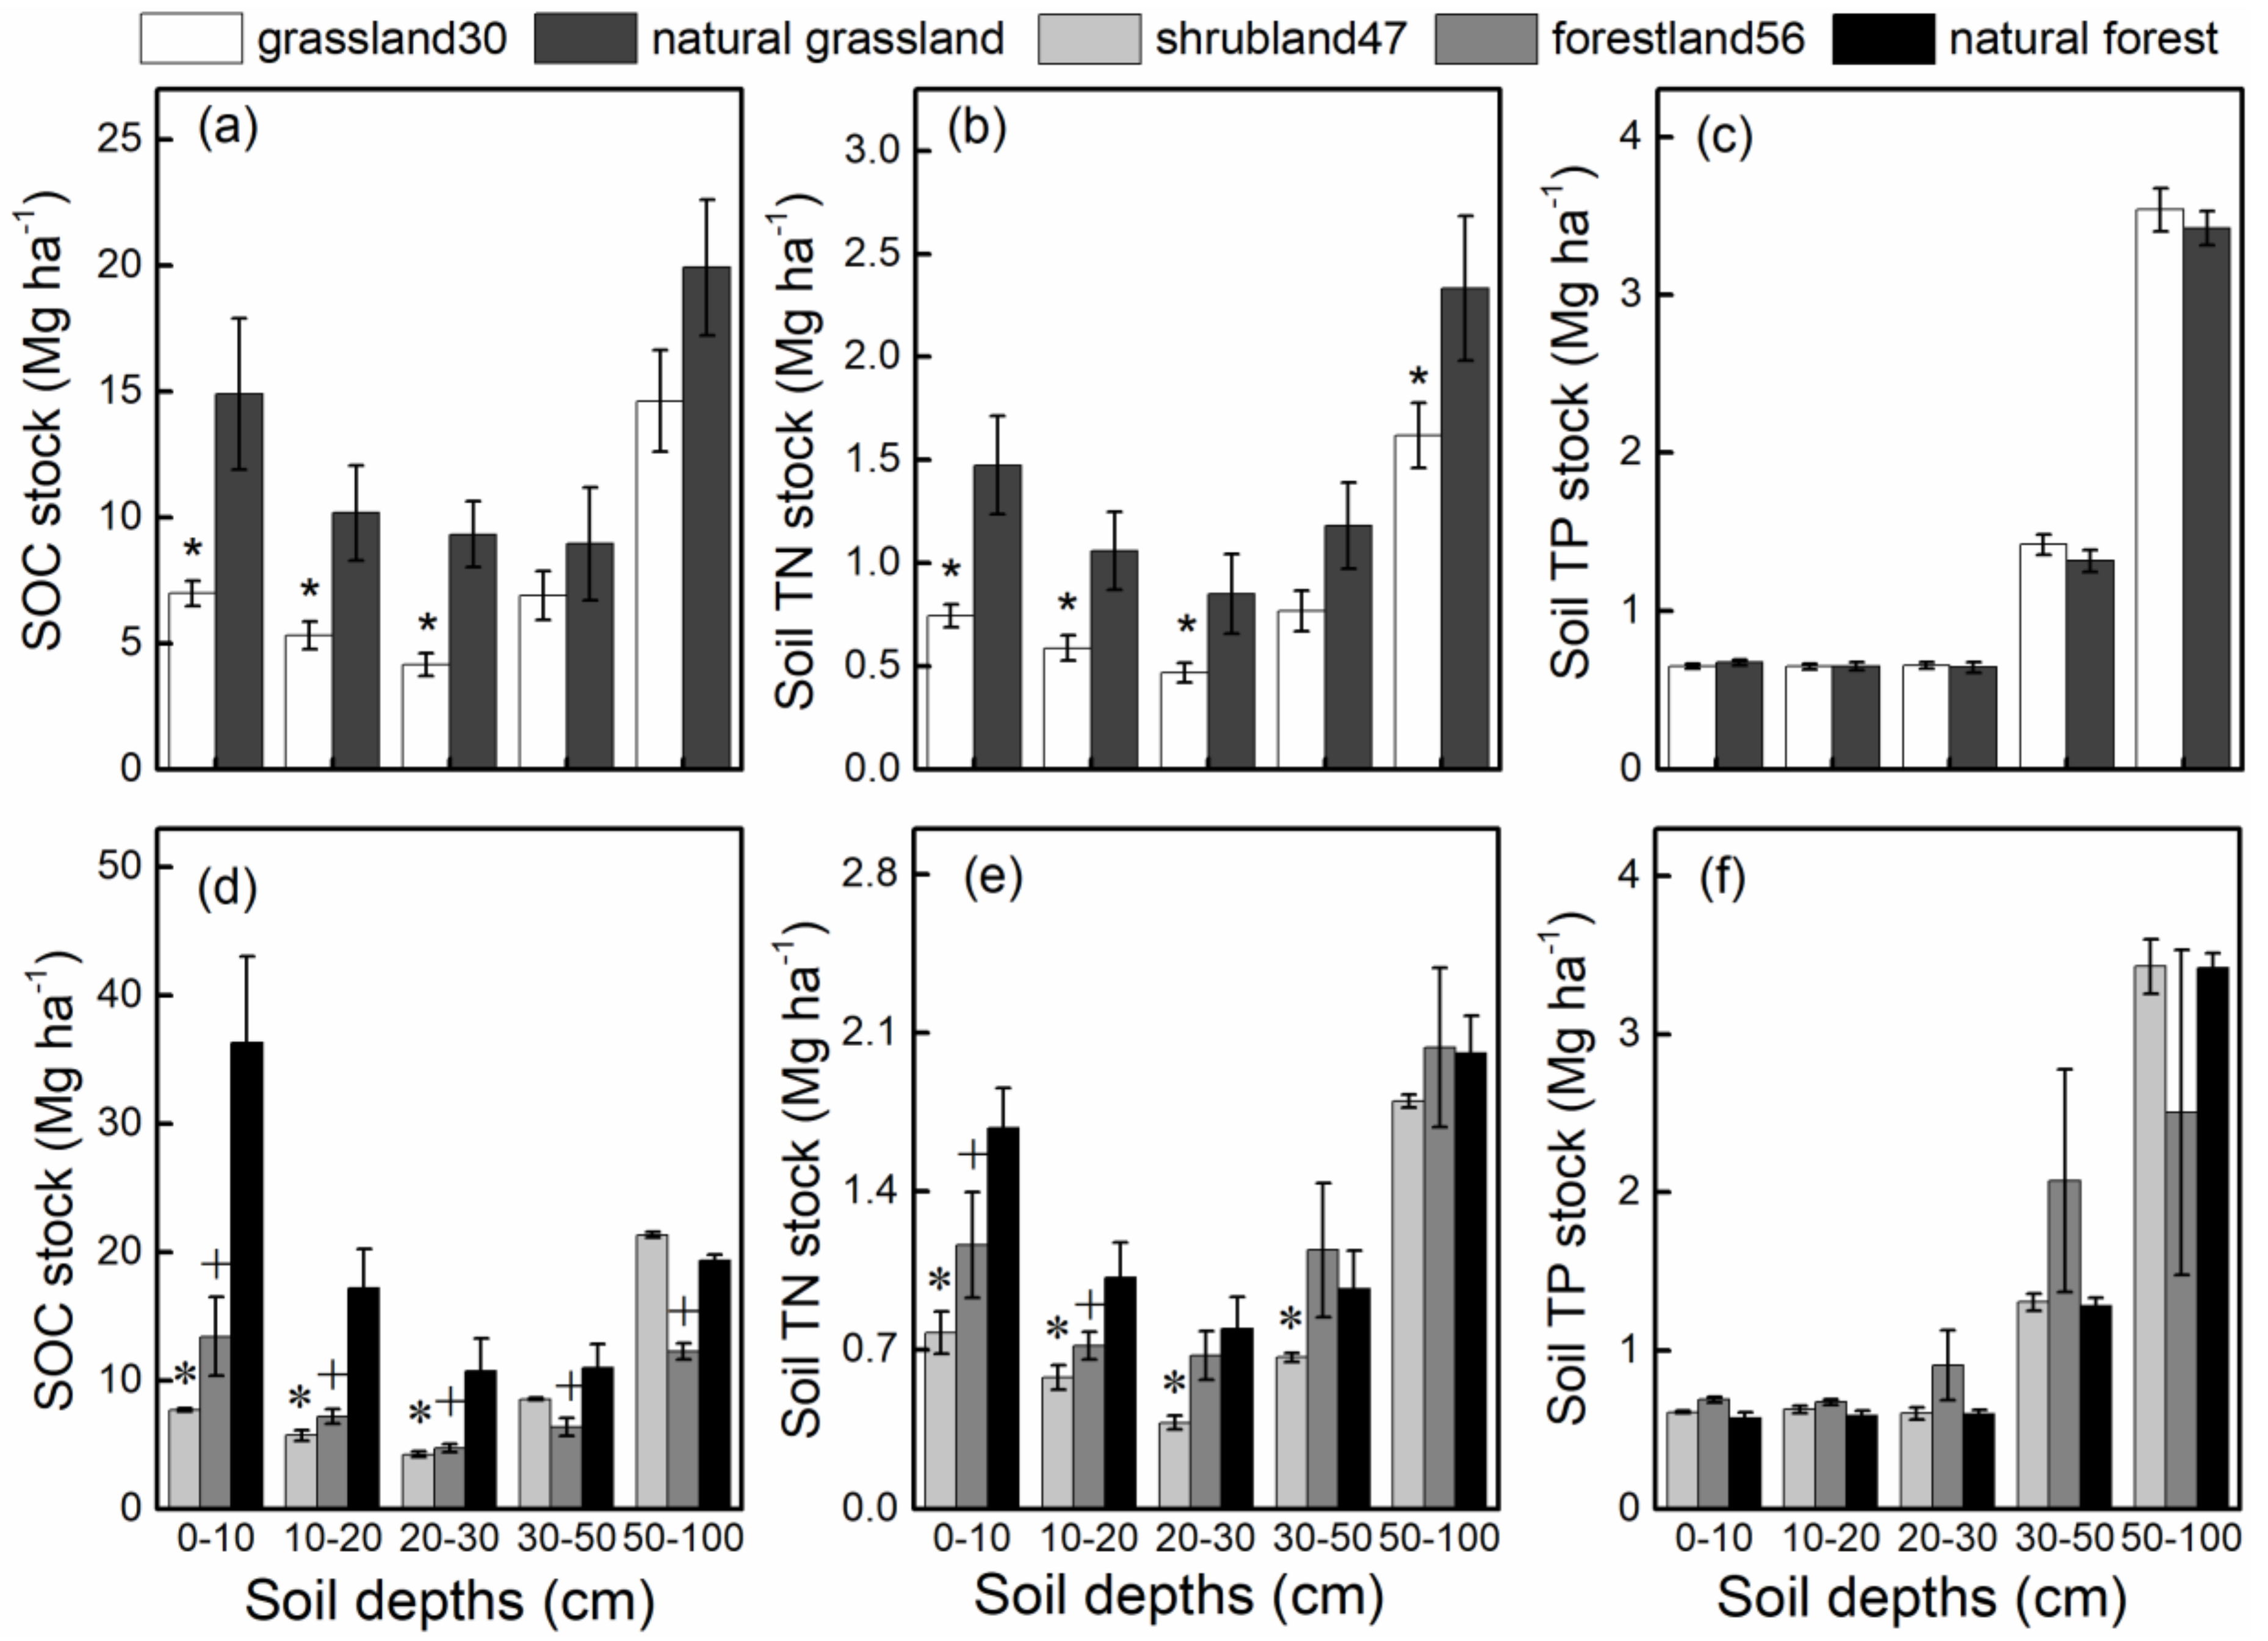
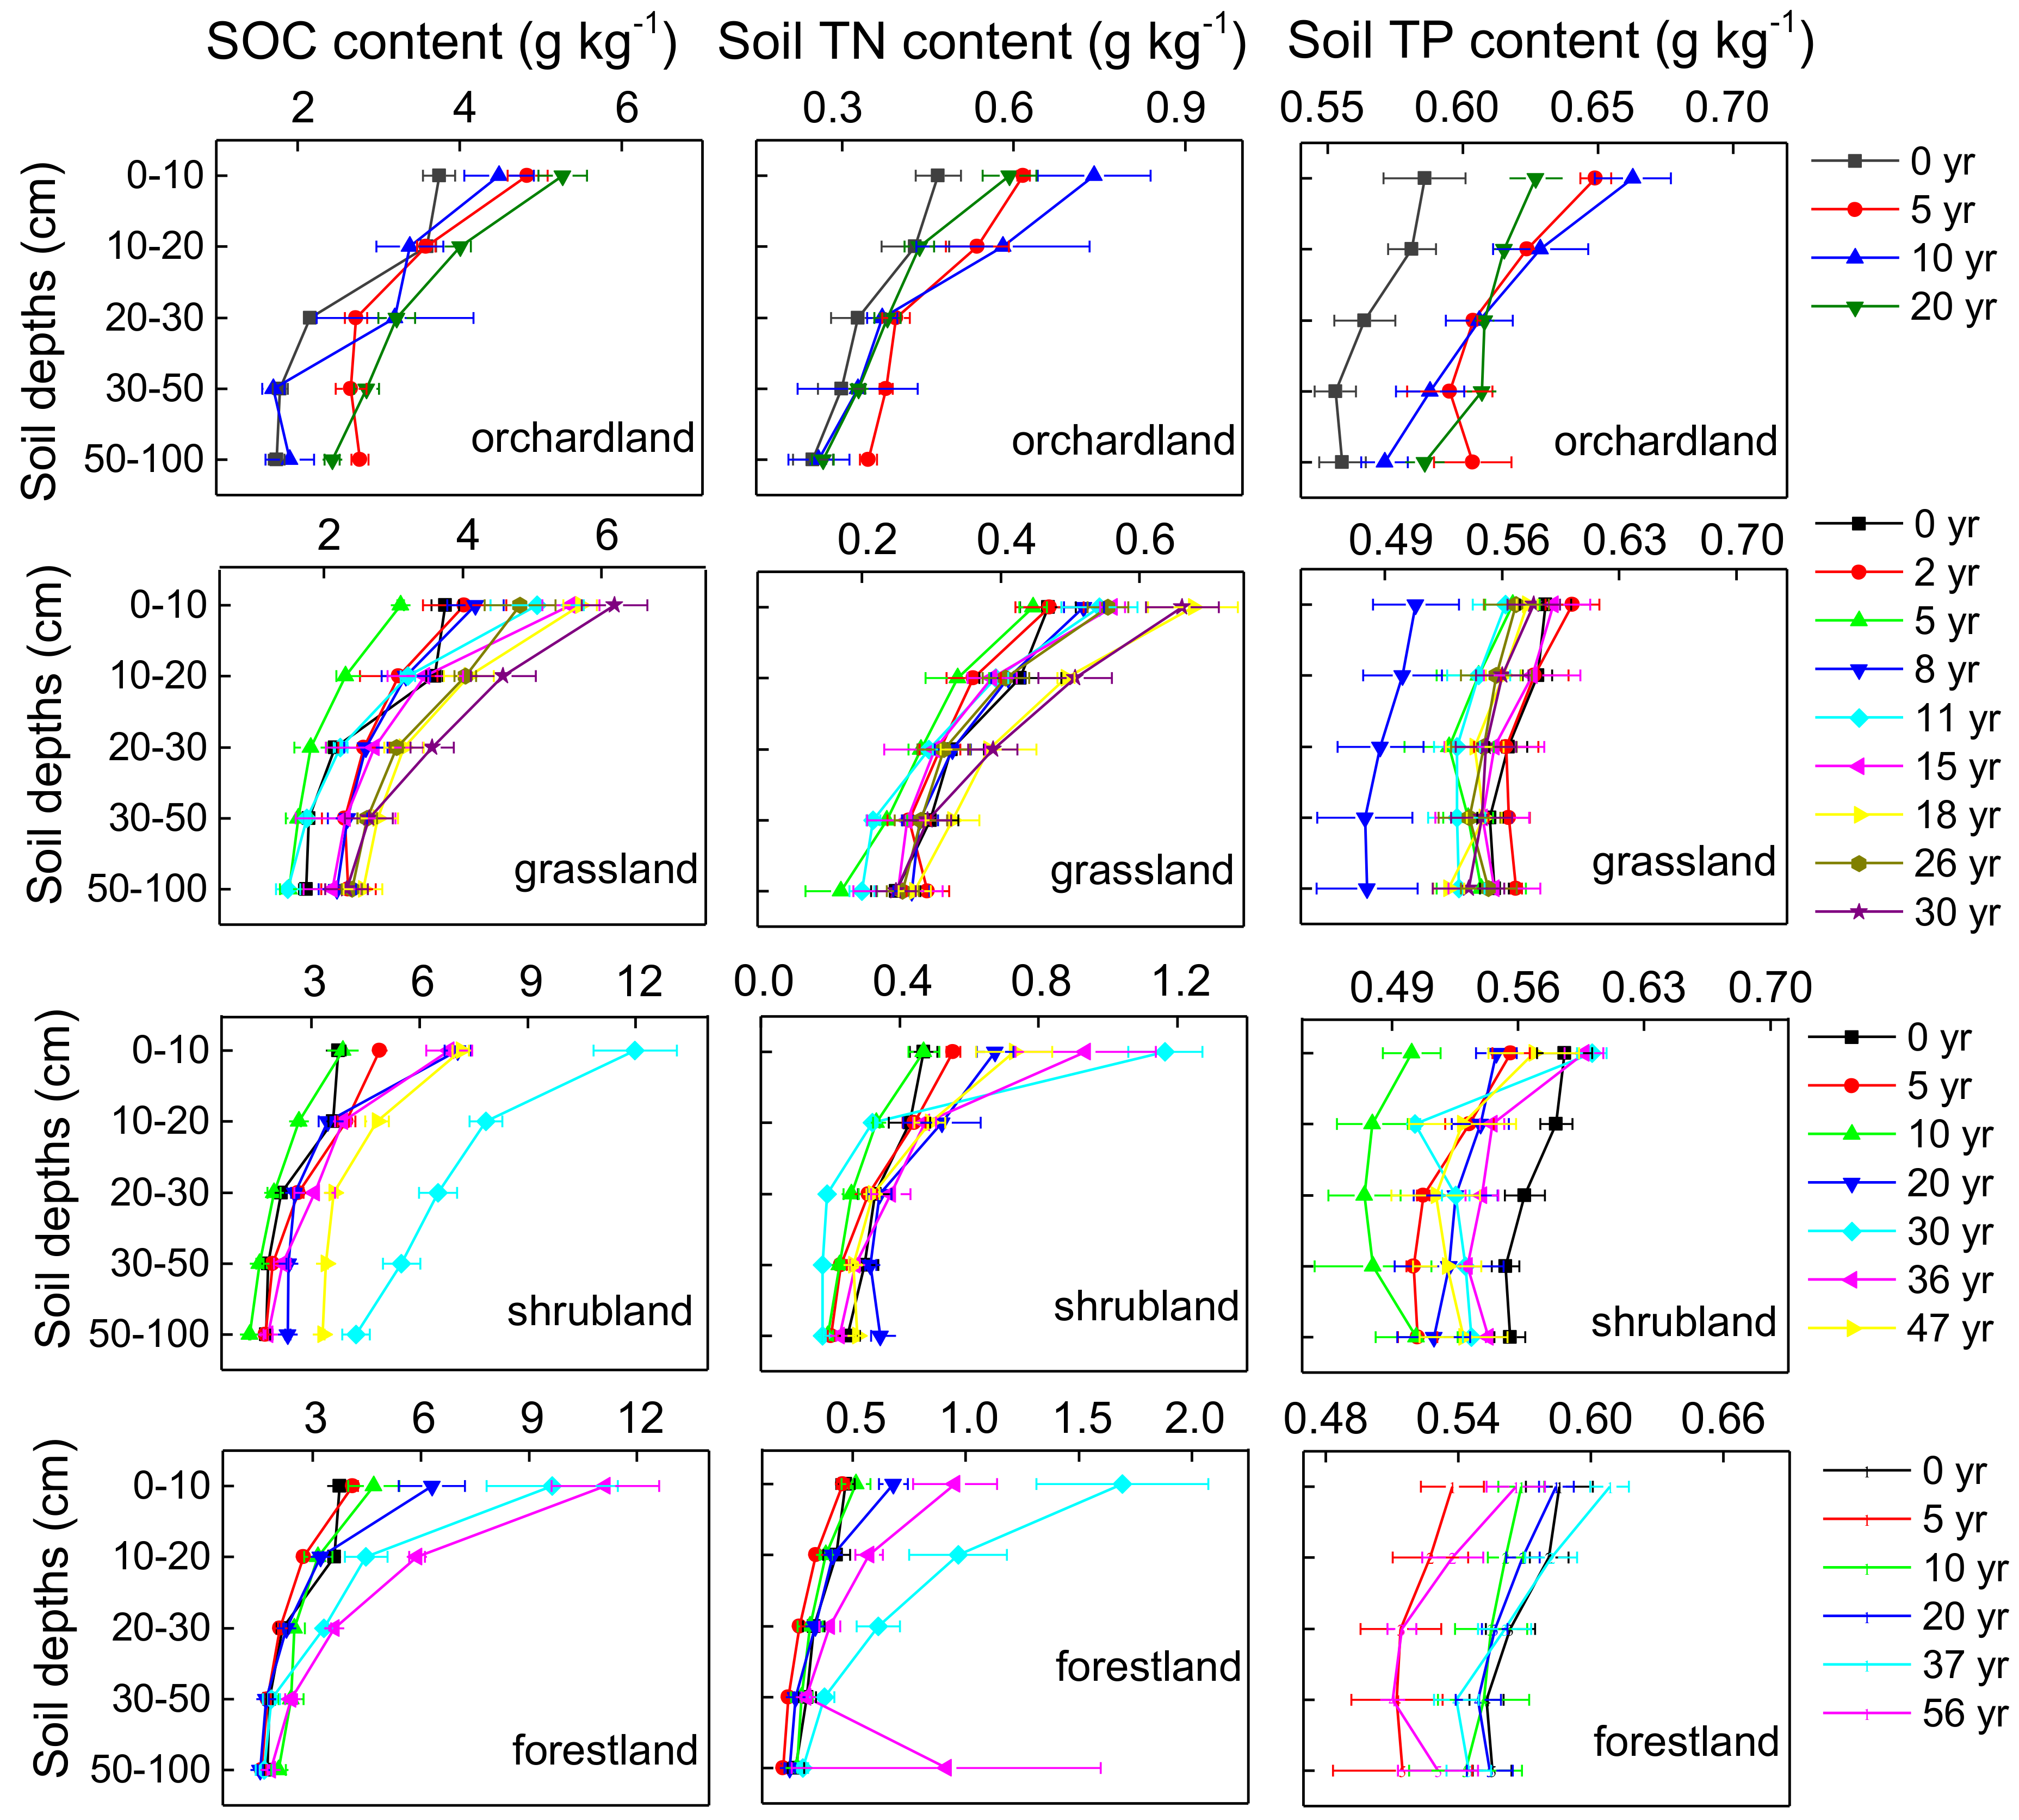
3.1. SOC, Soil TN, and Soil TP Stocks in Different Restoration Types

Restoration age had a significant effect on SOC and soil TN stocks (p < 0.01) (Table S2). In orchardland, the SOC stocks of the soil at 0–30 cm depth first increased and then stabilized after 5 years; the soil TN stock at the same depth first increased and then decreased with restoration age. The soil TP stocks at 0–100 cm depth showed no significant change with restoration age (Figure 2a–c). In grassland, the SOC and soil TN stocks at 0–30 cm depth first increased and then stabilized after 18 years, and the soil TP stocks at 0–100 cm depth showed no significant change with different restoration ages (Figure 2d–f). In shrubland, the SOC stocks at 0–50 cm depth and soil TN at 0–10 cm increased at first, peaked after 5 years, and then stabilized after 30 years; the soil TP stocks at 0–100 cm depth showed no significant change (Figure 2h–j). In forestland, the SOC at 0–50 cm gradually increased, and the soil TN stocks increased before peaking after 37 years, then decreased with restoration age; the soil TP stock at 0–100 cm depth showed no significant change (Figure 2k–m). In addition, SOC and soil TN stocks from the 0–30 cm soil layer of grassland30 were significantly lower than those in natural grassland (Figure 3a,b). SOC and soil TN stocks at 0–30 cm soil depth in shrubland47, as well as SOC stocks at 0–100 cm depth and soil TN stocks at 0–20 cm depth in forestland56, were significantly lower than those in natural forest (Figure 3d,e). The soil TP stocks at all soil depths showed no significant differences between grassland30 and natural grassland, shrubland47 and natural forest, or forestland56 and natural forest (Figure 3c,f).

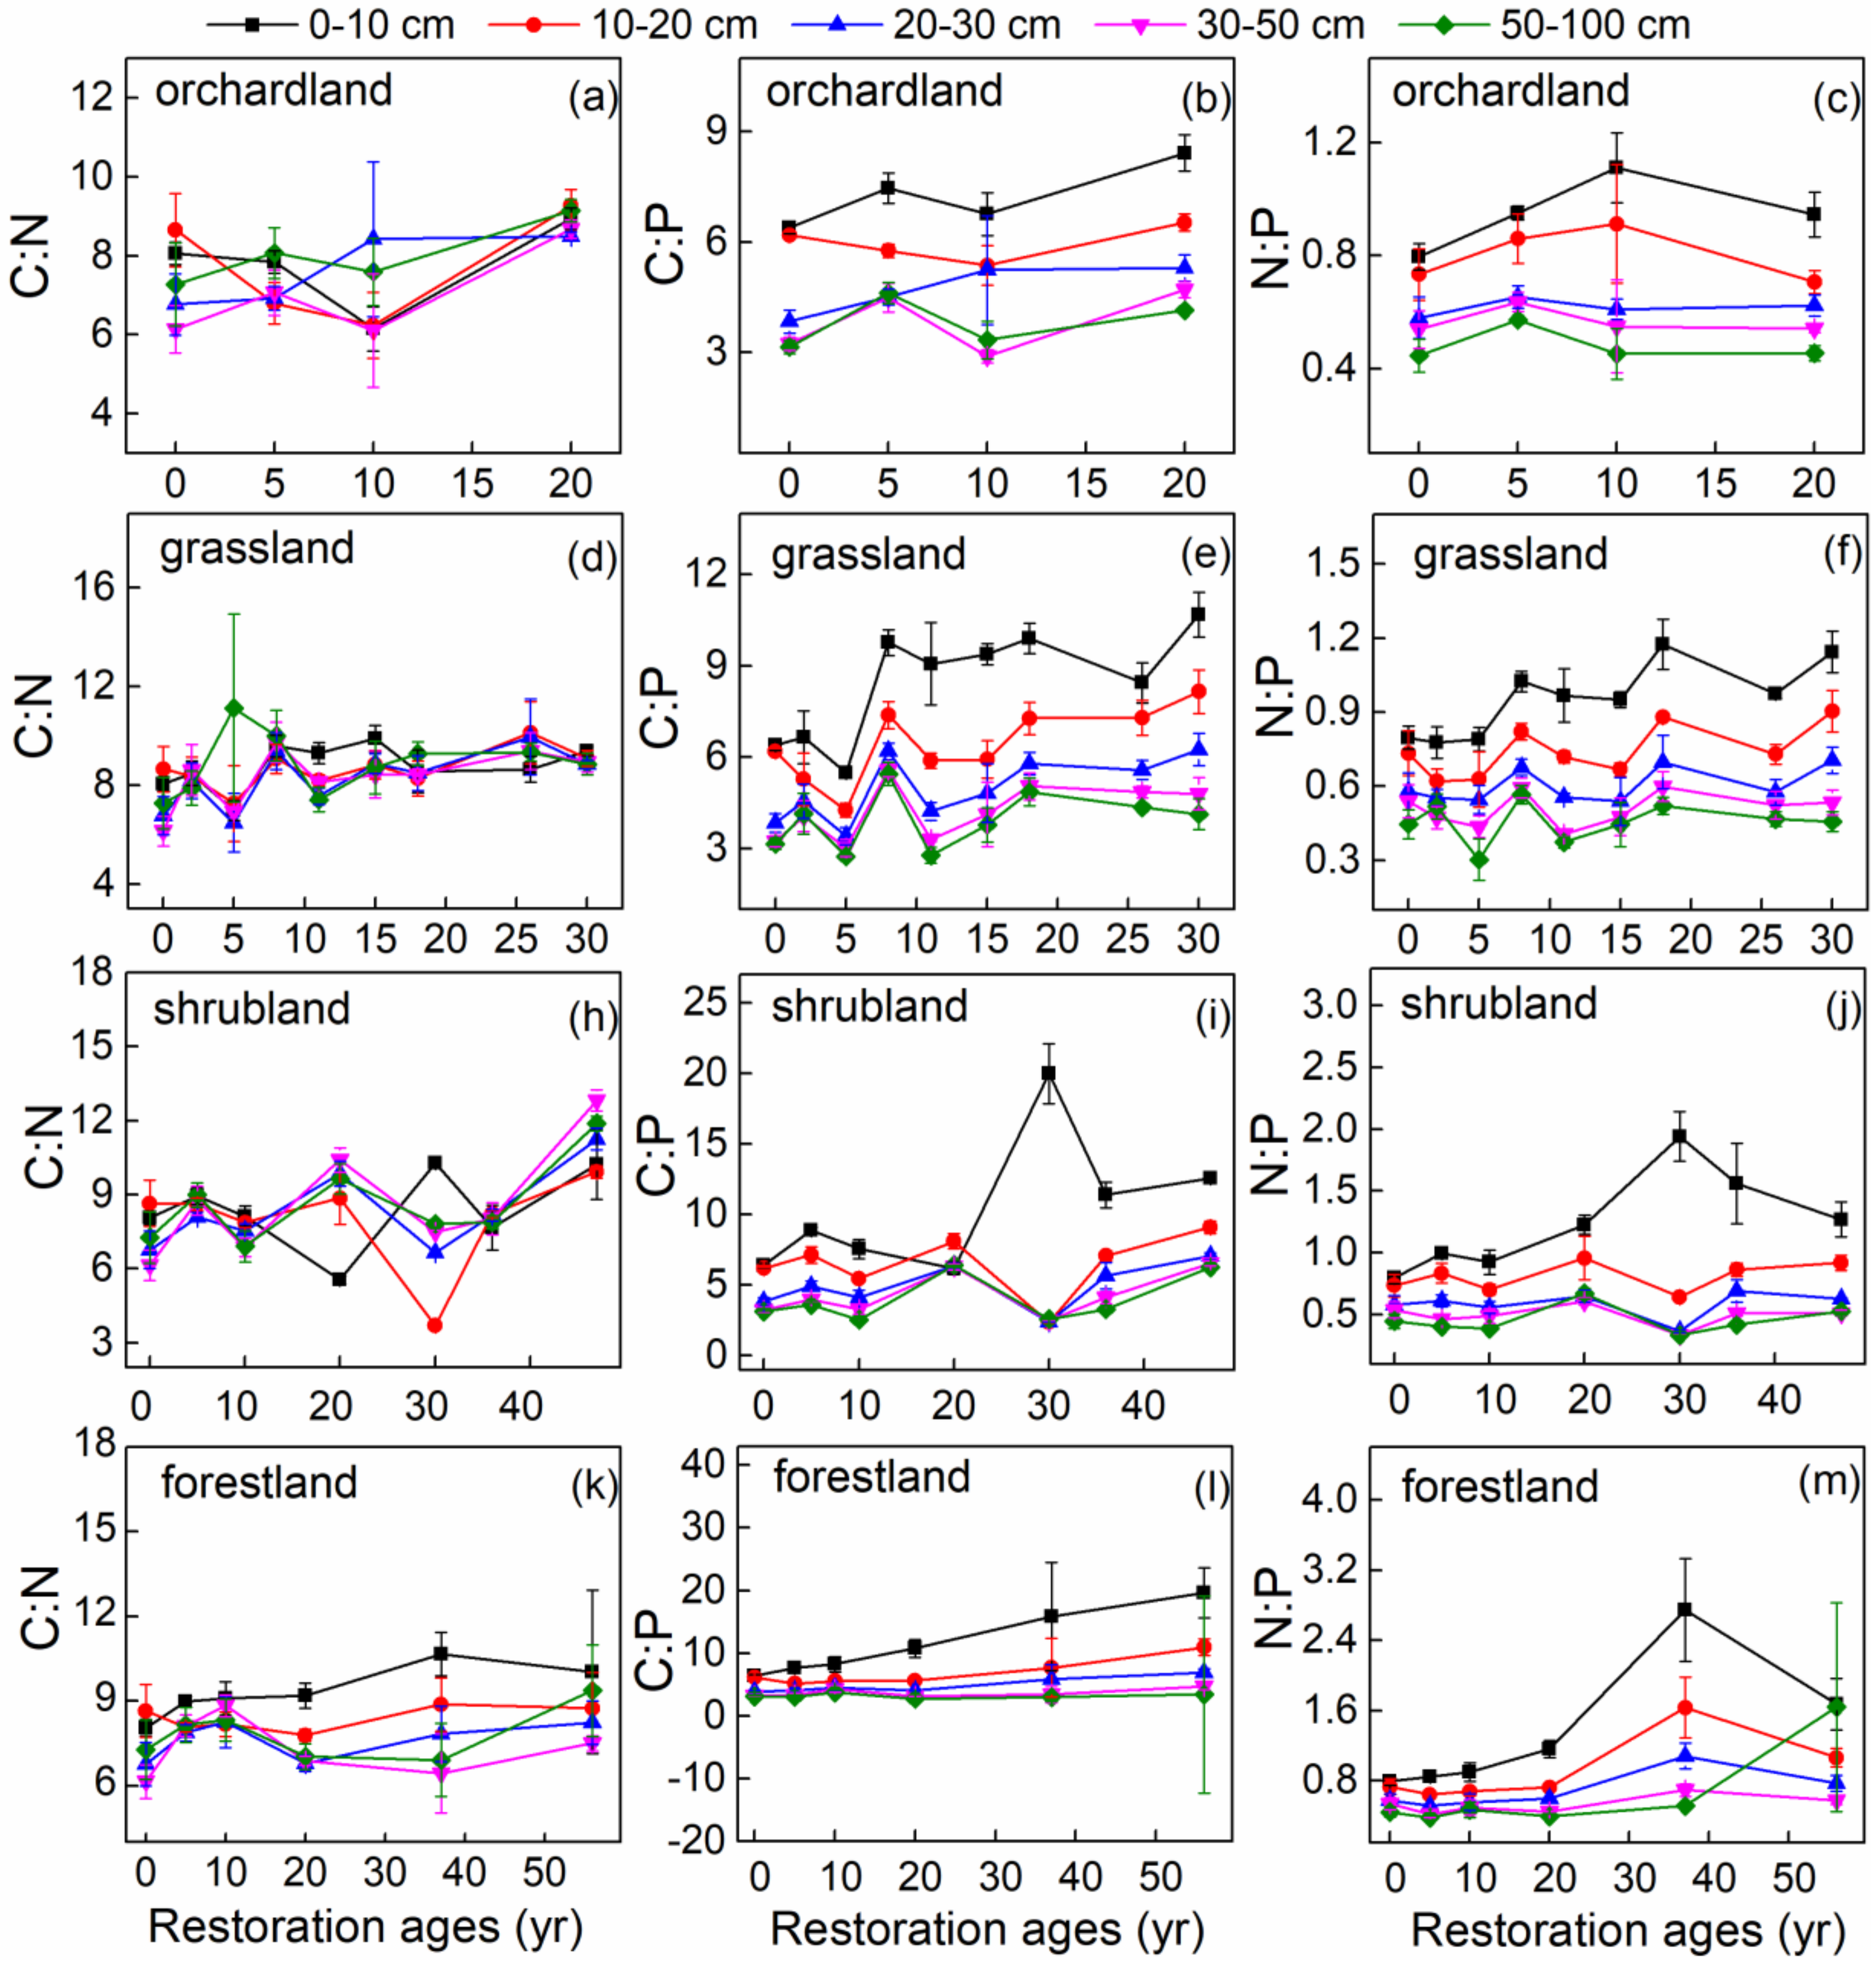
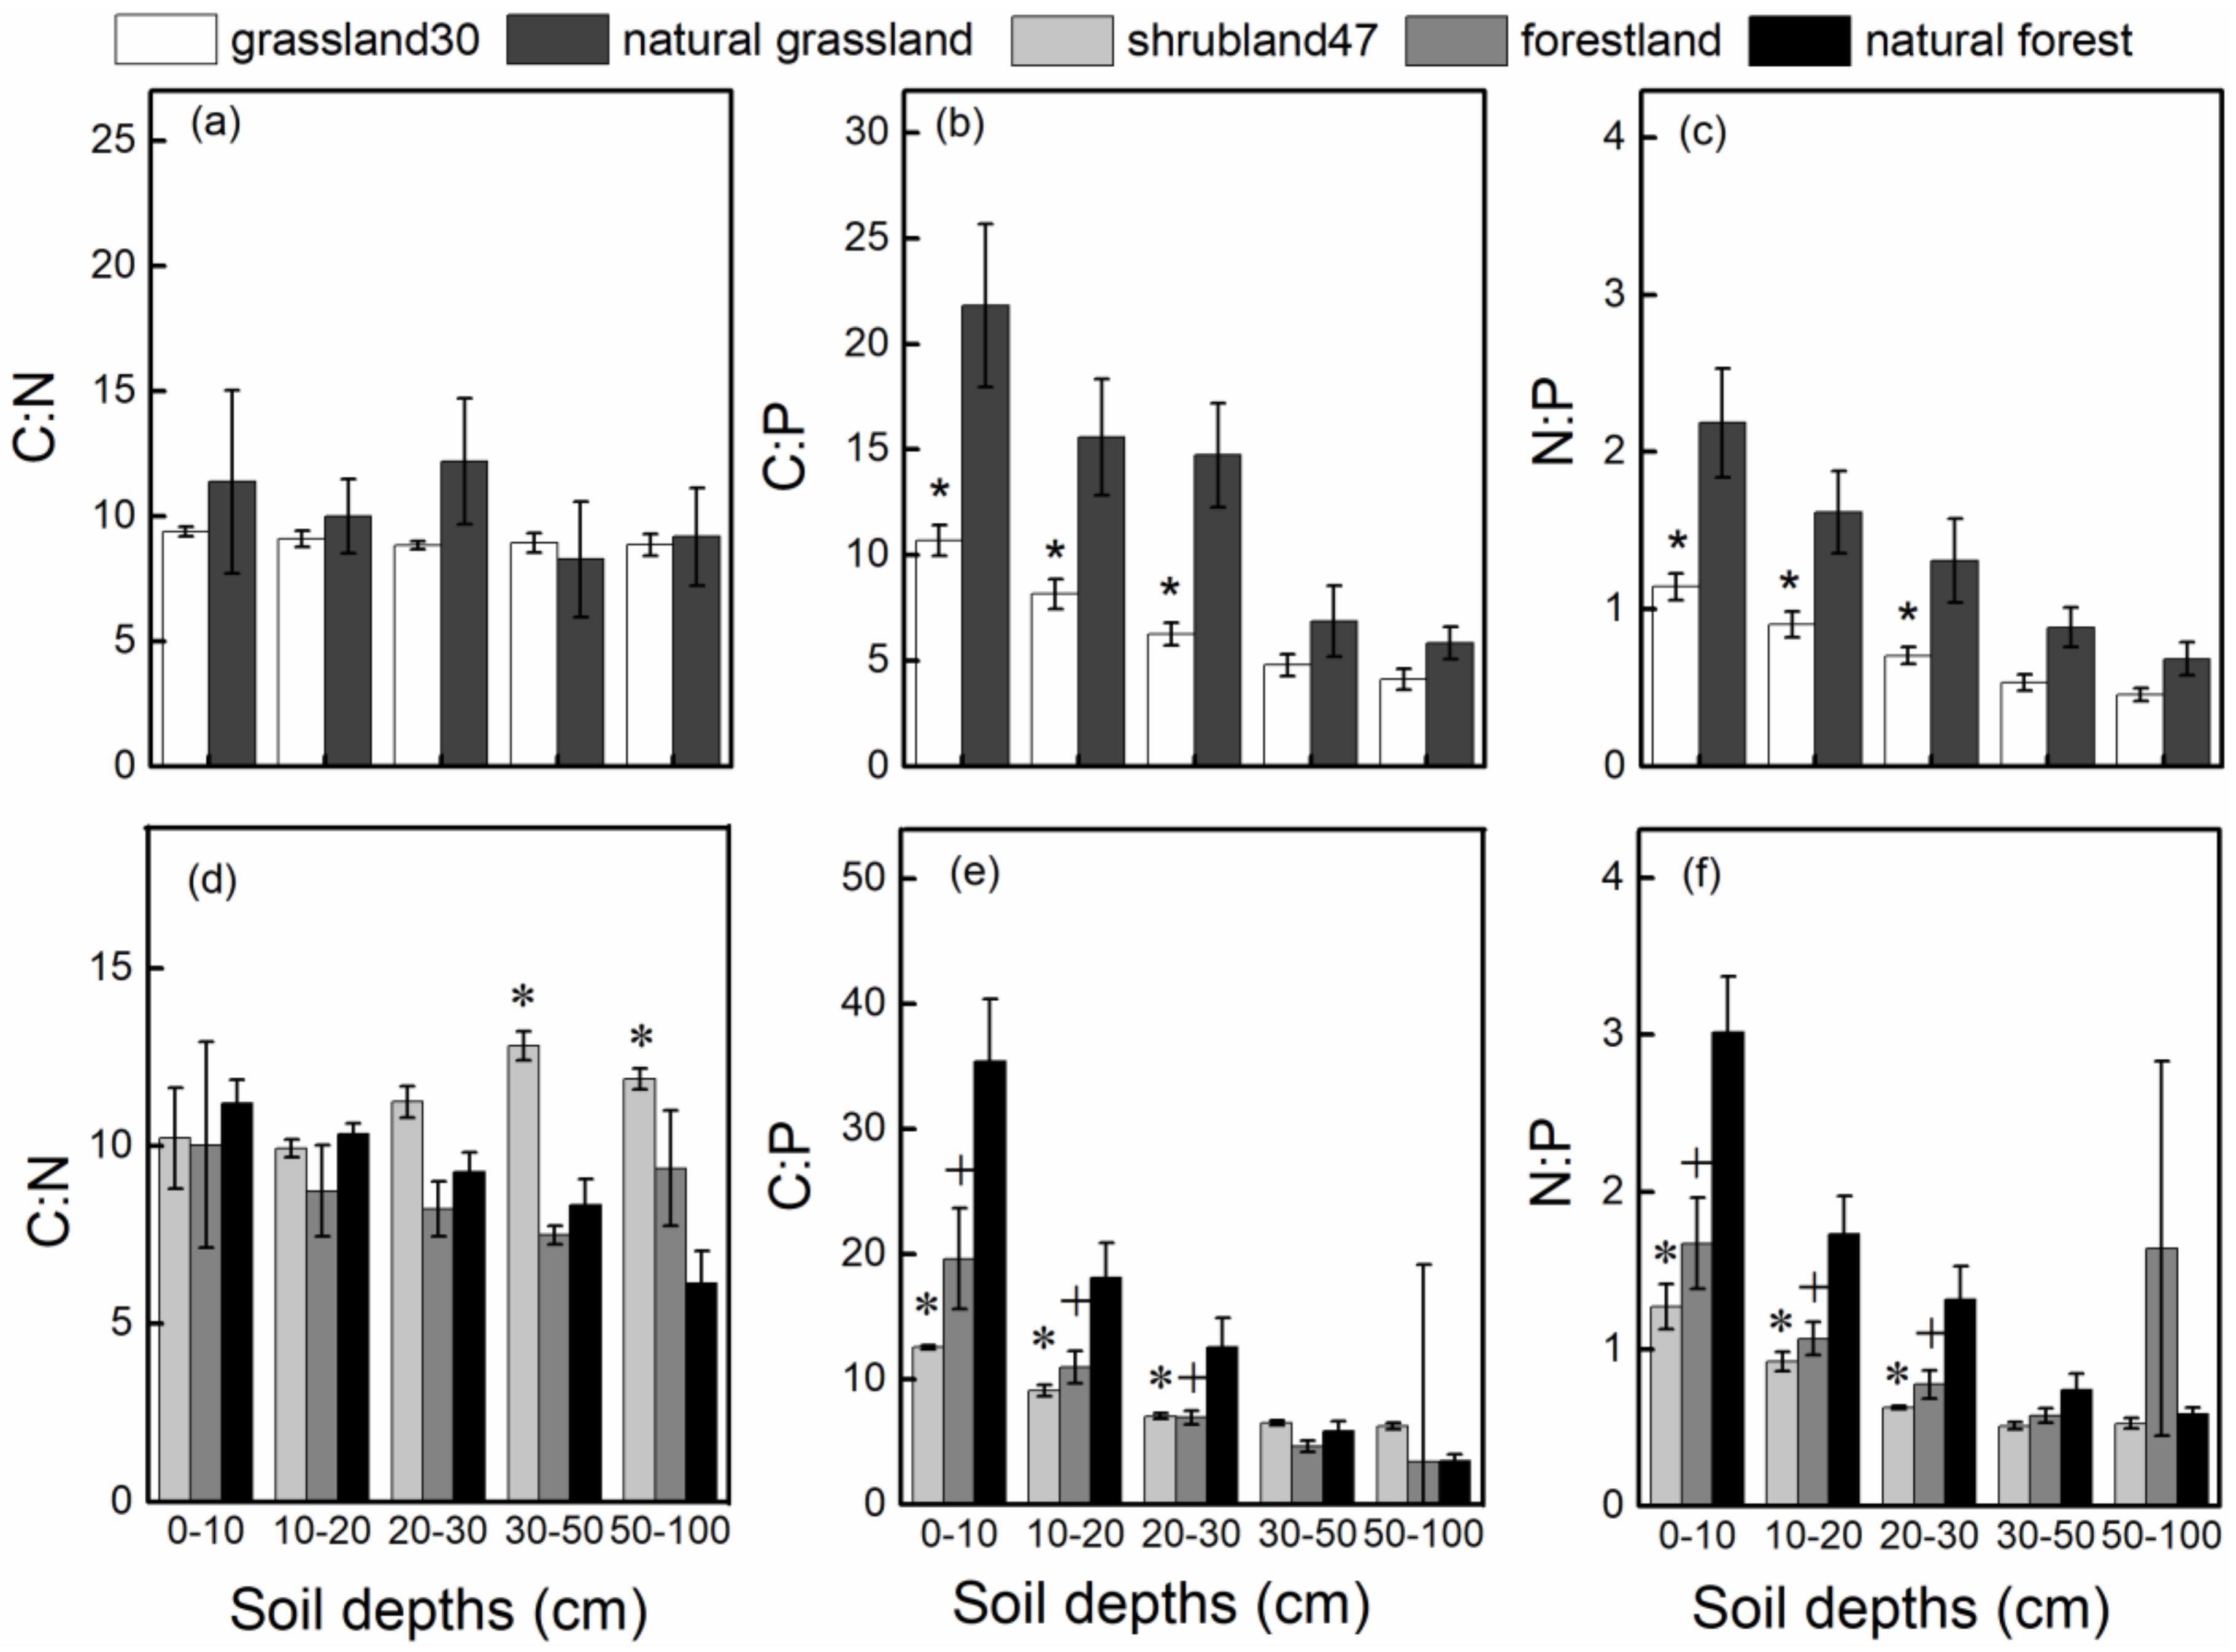
3.2. Changes in SOC, Soil TN, and Soil TP Stoichiometry

In orchardland, the C:N ratio at 0–100 cm depth showed no obvious changes with restoration age, but there was an overall increasing trend (Figure 4a, Table S3). The C:P ratio at 0–30 cm increased, while the N:P ratio at 0–20 cm first increased and then decreased after 10 years of restoration (Figure 4b,c). In grassland, the C:N ratio at 0–100 cm showed an overall increasing trend with restoration age (Figure 4d, Table S3); the C:P and N:P ratios in soils of 0–30 cm depth gradually increased with restoration age (Figure 4e,f). In shrubland, the C:N ratio at 0–100 cm showed little variation with restoration age, but the overall trend was an increase (Figure 4h, Table S3); the C:P and N:P ratios at 0–10 cm depth first increased, then peaked at 30 years, before decreasing again with restoration age (Figure 4i,j). In forestland, the C:N ratio at 0–100 cm depth showed little change with restoration age, but the overall trend was an increase (Figure 4k, Table S3). The C:P ratio in soils of 0–100 cm depth gradually increased with restoration age (Figure 4l), and the N:P ratio at 0–50 cm first increased, then peaked at 37 years before decreasing again with restoration age (Figure 4m).
The C:P and N:P ratios at 0–30 cm in grassland30 were significantly lower than those in natural grassland (Figure 5b,c), and the C:P and N:P ratios at 0–30 cm depth in shrubland47 and forestland56 were significantly lower than those in natural forest (Figure 5e,f). In addition, the C:N ratio decreased with soil depth in forestland (Figure 4k). Overall, the C:P and N:P ratios gradually decreased with soil depth in the three land types (Figure 4b,c,e,f,i,j,l,m).

4. Discussion

4.1. Restoration Ages Altered SOC, Soil TN, and Soil TP Stocks and Stoichiometry

Our results showed that the SOC stocks at 0–30 cm soil depth in orchardland, grassland, and shrubland first increased and then stabilized with restoration age, while the SOC stocks at 0–50 cm in forestland gradually increased with restoration age. SOC is mainly derived from surface litter, root secretions, and animal residues [21,22]. After vegetation restoration, a large input of litter and organic matter can enhance the accumulation of SOC [23], and with an improvement in soil structure, the levels of surface runoff, soil erosion, and soil nutrient loss may be reduced [24]. In addition, soil microbial activity is strengthened as restoration age increases [25], and soil nutrient conversion and storage are further enhanced. However, vegetation restoration involves the coordinated development of the plant community and soil environment, and the plant community structure, soil structure, and microbial diversity reach a stable level as restoration age increases [26,27,28]. However, in forestland, SOC stocks had not reached a steady level at 57 years, and when these stocks may stabilize needs to be evaluated. In our study, the soil TN stocks at 0–30 cm depth decreased in the later stages of orchardland, shrubland, and forestland restoration. Plants may enter a senescence phase, and the soil nitrogen nutrients absorbed during the plant growth process are then fed back to the soil by litter; thus, the nitrogen absorption rate is lower than the release rate, resulting in the soil TN stock decreasing [29]. We also found that soil TP stocks did not significantly change with restoration age, in contrast to the results of some previous studies [30]. Soil TP is mainly influenced by parent material, land use, and biogeochemical processes in the soil [31,32]. As the parent material and climate were similar for all vegetation types, the variability and migration rate of TP were not as obvious as those of SOC and soil TN, and restoration age had little effect on soil TP. Within the range of restoration ages that we studied, the SOC and soil TN stocks in grassland, shrubland, and forestland at 0–30 cm soil depth failed to reach the stock levels found in natural grassland or natural forest. Severe soil erosion and lack of water are typical characteristics of the Loess Plateau, which may lead to the loss of soil nutrients [24,33]. Additionally, soil tillage can also cause soil nutrient loss by affecting the soil physical structure and microbial activity [34].
The C:N ratio increased with restoration age after vegetation restoration. The main factors affecting the C:N ratio are changes in the SOC and soil TN contents [35]. Both SOC and soil TN contents increased overall with restoration age (Table S3), and the rate of increase of SOC was greater than that of soil TN; consequently, the C:N ratio increased (Table S3). A previous study showed that the C:N ratio was negatively correlated with the rate of decomposition of organic matter [36], so the decomposition rate of organic matter increases with restoration age. The C:P ratio indicates the availability of soil TP in the soil [37], We found that the rate of increase of SOC was also greater than that of soil TP, resulting in an increase in the C:P ratio with restoration age (Table S3). In addition, the rate of increase of soil TN was greater than that of soil TP, resulting in an increase in the N:P ratio with restoration age (Table S3). The N:P ratio was reduced in the later stages of restoration, which may be related to the lower soil TN content (Figure S1). Soil N and soil TP are essential mineral nutrients for plant growth and common limiting elements in ecosystems, and the N:P ratio is a predictor of nutrient limitation [38]. In the grassland, shrubland, and forestland types, the N:P ratio at 0–30 cm soil depth in the later stages of recovery was lower than those of natural grassland and natural forest, which may result from the more alkaline soil and lower soil TN content in the Loess Plateau Region; the soil TP content did not differ significantly between the restoration and control sites. In the grassland, shrubland, and forestland restoration types, the C:P ratio in the 0–30 cm soil layer was lower than those of natural grassland and natural forest at the later stages of recovery, which may be related to the lower SOC content in restoration soils than in natural soils.

4.2. Vertical Distribution of Stocks and Stoichiometry of SOC, Soil TN, and Soil TP

Soil depth is an important factor influencing SOC, soil TN, and soil TP distribution [39]. In our study, the SOC and soil TN stocks decreased with soil depth at all restoration ages in orchardland, grassland, shrubland, and forestland (Figure 6a,b,d,e,h,I,k,l), which is consistent with the results of previous studies [40,41]. Our study also revealed that the overall rates of SOC and soil TN content change decreased with soil depth in orchardland, grassland, shrubland, and forestland (Table S3), which indicated that the SOC and soil TN sequestration rates gradually decreased with soil depth. Meanwhile, SOC, soil TN, and soil TP were most sensitive to change in the surface soil (0–30 cm). The SOC and soil TN content at 0–30 cm represented more than 65% of the total SOC and soil TN stocks from 0–100 cm depth for all restoration types; the soil TP content at 0–30 cm represented more than 60% of the total soil TP stocks from 0–100 cm (Figure S1). Such differences in the SOC, soil TN, and soil TP profiles can be explained partly by root distribution. The surface soil is affected by external environmental factors, soil microorganisms, and the return of nutrients from surface litter, resulting in a concentration of nutrients in the surface soil [42]. With increasing soil depth, the input of organic matter is limited by the permeability of the soil, microbial decomposition activity, and root absorption [21,39]. Moreover, SOC and soil TN stocks are not only affected by soil parent material, but also by the decomposition of litter and absorption and utilization by plants [40], resulting in large spatial variability. While the soil TP content of orchardland and forestland decreased, it showed little variation with soil depth in grassland and shrubland (Figure 6c,f,j,m). Soil TP is mainly affected by the soil parent material, which, in this case, is a sedimentary mineral with low mobility in soil; therefore, there was little vertical variation in soil TP [43].
Our study found that the overall C:N ratio gradually decreased with soil depth. It may be that the surface SOC and soil TN contents were higher, but as the soil depth increased, the SOC content change was larger than that of the soil TN content. When the decomposition process occurs, easily decomposed material vanishes, and soil TN is immobilized in decayed products, leaving behind more durable material with slower decomposition rates in the deeper layers [44]. This results in a relatively lower C:N ratio in the deeper soil layers. There was a significant difference in the C:P and N:P ratios at different soil depths. It may be that the soil TP content is relatively stable at different soil depths, and the C:P ratio and N:P ratio are mainly affected by SOC and soil TN content, so they showed greater variation.

4.3. Effect of Restoration Type on SOC, Soil TN, and Soil TP Stocks and Stoichiometry.

Our study demonstrated that the SOC and soil TN stocks in the 0–20 cm soil layer at 5 years were highest in orchardland, which may be related to the use of fertilizer. In other years, SOC, soil TN, and soil TP stocks showed no difference between orchardland, grassland, shrubland, and forestland (Figure S2). However, the rate of SOC and soil TN change at 0–10 cm soil depth was the highest in forestland, while the rates of SOC and soil TN change at other depths varied among different restoration types (Table S3). The rapid increases in surface SOC and soil TN are closely related to the input of litter [45,46]. Guo et al. [46] showed that forest litter was 19 times greater in mass than that of shrubs in the Loess Plateau Region. At the same time, the presence of the higher amount of organic carbon over a long period of time indicated that forestland likely had developed a higher degree of humification. The long-term development of soil organic carbon stocks suggested that the afforestation improved the humification process. It has been shown that the process of humification in the soil is critical for the ecosystem, due to its strong contributions to the improvement of fertility and, hence, the storage of both carbon and nitrogen [47,48]. This also explains why the increase in SOC and soil TN in the topsoil of forests was higher than that of shrubs. As soil depth increases, root secretions and soil microorganisms are the main sources of soil nutrition [21,22]. There are significant differences in the effects of different plant roots and litters on the community composition of microorganisms [49], which may explain the large differences in the rates of SOC and soil TN change between different restoration types.
The C:N ratios of orchardland5 and grassland5 at 0–20 cm soil depth were lower than those of shrubland5 and forestland5, and the C:N ratio of orchardland10 was significantly lower than those of grassland10, shrubland10, and forestland10 (Figure S2). The C:N ratio of orchardland was lower than those of grassland, shrubland, and forestland, which may be related to anthropogenic N deposition in orchardland (Figure S2). The lower C:N ratio in grassland5 may occur because grassland retains more organic matter content and greater nutrient absorption takes place through plant roots [8]. There were no significant differences in the C:N ratio at other soil depths of orchardland, grassland, shrubland, and forestland as there were no significant differences in the stocks of SOC and soil TN (Figure S2). This finding is related to the nutrient conditions of the soil in the study area and the feedback between plant and soil, so the soil stoichiometric changes in different restoration types showed the same characteristics in the same environmental context. In addition, the overall C:P and N:P ratios of orchardland5 and shrubland5 at 0–20 cm soil depth were higher than those of grassland5 and forestland5, which is related to the relatively higher SOC and soil TN content in orchardland5 and shrubland5 (Figure S2). However, there were no significant differences in the C:P and N:P ratios at 30–100 cm soil depth between the four restoration types because there were no significant differences in the SOC, soil TN, and soil TP stocks of orchardland, grassland, shrubland, and forestland (Figure S2).

5. Conclusions

We examined the changes in SOC, soil TN, and soil TP stocks and stoichiometry at depths of 0–100 cm following vegetation restoration in the Loess Hilly Region. Our results revealed that the SOC stocks appeared to increase and reach stable levels. The soil TN stocks first increased and then decreased with restoration age, but they did not reach the levels seen in natural grassland or natural forest in the Loess Hilly Region in the absence of appropriate management. Soil TP stocks failed to improve substantially with restoration age. The C:N, C:P, and N:P ratios gradually increased with restoration age. At the same time, the SOC, soil TN, and soil TP stocks and the C:N, C:P, and N:P ratios decreased with soil depth. Reforested land had the highest sequestration rate of SOC and TN at 0–10 cm soil depth. The results of this study provide data for the assessment of the long-term SOC, soil TN, and soil TP stocks and stoichiometry after vegetation restoration under different restoration types in the Loess Hilly Region.

Supplementary Materials

The following are available online at https://www.mdpi.com/1999-4907/10/1/27/s1, Figure S1: Changes in soil organic carbon (SOC), soil total nitrogen (TN), and soil total phosphorus (TP) content with restoration age. Figure S2: Changes in content and stoichiometry of soil organic carbon (SOC), soil total nitrogen (TN), and soil total phosphorus (TP) for different vegetation types at 5, 10, and 20 years. Table S1: The details of the sample sites selected for the study. Table S2: F and sig values for independent factors (soil depth, restoration age) and their interactions. Table S3: The slope parameters of the linear regression models for soil organic carbon (SOC), soil total nitrogen (TN), and soil total phosphorus (TP) contents and C:N, C:P, and N:P ratios with recovery year at different soil depths under four restoration types.

Author Contributions

The research design was completed by H.X. and S.X. The manuscript was written by H.X. and Q.Q. The collection and analysis of soil samples were performed by H.X., P.L., Q.Q., Z.G. and E.W.

Funding

This research was funded by National Science and Technology Support Program (2015BAC01B03), Natural Science Foundation of China (41771557) and Foundation for Western Young Scholars, Chinese Academy of Sciences (XAB2015A05).

Acknowledgments

Many thanks to Juan Li, Dou Zhang and Zhao Fang for their technical assistance in the laboratory work. We would like to thank Mancai Guo and Minggang Wang for providing statistics assistance.

Conflicts of Interest

All the authors declare no conflicts of interest.

References

  1. Reed, S.C.; Yang, X.; Thornton, P.E. Incorporating phosphorus cycling into global modeling efforts: A worthwhile, tractable endeavor. New Phytol. 2015, 208, 324–329. [Google Scholar] [CrossRef] [PubMed]
  2. Lv, J.L.; Yan, M.J.; Song, B.L. Ecological stoichiometry characteristics of soil carbon, nitrogen, and phosphorus in an oak forest and a black locust plantation in the Loess hilly region. Acta Ecol. Sin. 2017, 10, 3385–3393, (In Chinese with English Abstract). [Google Scholar] [CrossRef]
  3. Rodríguez, E.S.; Lozano, Y.M.; Bardgett, R.D. Influence of soil microbiota in nurse plant systems. Funct. Ecol. 2016, 30, 30–40. [Google Scholar] [CrossRef]
  4. Rudel, T.K.; Coomes, O.T.; Moran, E.; Achard, F.; Angelsen, A.; Xu, J.; Lambin, E. Forest transitions: Towards a global understanding of land use change. Glob. Environ. 2005, 15, 23–31. [Google Scholar] [CrossRef]
  5. Winans, K.; Whalen, J.; Cogliastro, A.; Rivest, D.; Ribaudo, L. Soil Carbon Stocks in Two Hybrid Poplar-Hay Crop Systems in Southern Quebec, Canada. Forests 2014, 5, 1952–1966. [Google Scholar] [CrossRef] [Green Version]
  6. Jiang, P.; Chen, Y.; Cao, Y. C:N:P Stoichiometry and Carbon Storage in a Naturally-Regenerated Secondary Quercus variabilis Forest Age Sequence in the Qinling Mountains, China. Forests 2017, 8, 281. [Google Scholar] [CrossRef]
  7. Wang, W.; Sardans, J.; Zeng, C.; Zhong, C.; Li, Y.; Peñuelas, J. Responses of soil nutrient concentrations and stoichiometry to different human land uses in a subtropical tidal wetland. Geoderma 2014, 232–234, 459–470. [Google Scholar] [CrossRef]
  8. Gao, Y.; He, N.; Yu, G.; Chen, W.; Wang, Q. Long-term effects of different land use types on C, N, and P stoichiometry and storage in subtropical ecosystems: A case study in China. Ecol. Eng. 2014, 67, 171–181. [Google Scholar] [CrossRef]
  9. Zhao, F.; Sun, J.; Ren, C.; Kang, D.; Deng, J.; Han, X.; Yang, G.; Feng, Y.; Ren, G. Land use change influences soil C, N and P stoichiometry under ‘Grain-to-Green Program’ in China. Sci. Rep. 2015, 5, 10195. [Google Scholar] [CrossRef] [Green Version]
  10. Fang, J.; Chen, A.; Peng, C.; Zhao, S.; Ci, L. Changes in Forest Biomass Carbon Storage in China Between 1949 and 1998. Science 2001, 292, 2320–2322. [Google Scholar] [CrossRef]
  11. Post, W.M.; Kwon, K.C. Soil carbon sequestratrion and land-use change: Processes and potential. Glob. Environ. 2010, 6, 317–327. [Google Scholar] [CrossRef]
  12. Xiao, H.; Li, Z.; Dong, Y.; Chang, X.; Deng, L.; Huang, J.; Nie, X.; Liu, C.; Liu, L.; Wang, D.; et al. Changes in microbial communities and respiration following the revegetation of eroded soil. Agric. Ecosyst. Environ. 2017, 246, 30–37. [Google Scholar] [CrossRef]
  13. Yang, W.; Cheng, H.; Hao, F.; Ouyang, W.; Liu, S.; Lin, C. The influence of land-use change on the forms of phosphorus in soil profiles from the Sanjiang Plain of China. Geoderma 2012, 189–190, 207–214. [Google Scholar] [CrossRef]
  14. Liu, X.; Ma, J.; Ma, Z.; Li, L. Soil nutrient contents and stoichiometry as affected by land-use in an agro-pastoral region of northwest China. Catena 2017, 150, 146–153. [Google Scholar] [CrossRef]
  15. Li, C.; Zhao, L.; Sun, P.; Zhao, F.Z.; Kang, D.; Yang, G.H. Deep Soil C, N, and P Stocks and Stoichiometry in Response to Land Use Patterns in the Loess Hilly Region of China. PLoS ONE 2016, 11, e0159075. [Google Scholar] [CrossRef] [PubMed]
  16. Fei, W.; Rui, L.I.; Zhong, W. Problems and Proposals on Policy of Converting Cropland Into Forest and Grassland: A Case-based Study. Nat. Sci. Ed. 2003, 3, 60–65, (In Chinese with English Abstract). [Google Scholar] [CrossRef]
  17. Xin, Z.; Ran, L.; Lu, X.X. Soil Erosion Control and Sediment Load Reduction in the Loess Plateau: Policy Perspectives. Int. J. Water Resour. Dev. 2012, 28, 325–341. [Google Scholar] [CrossRef]
  18. Nelson, D.W.; Sommers, L.E. Total carbon, organic carbon and organic matter. In Methods of Soil Analysis Part 3—Chemical Methods. Chem. Microbiol. Prop. 1982. [Google Scholar] [CrossRef]
  19. Bremner, J.; Mulvaney, C. Nitrogen—total. Methods of Soil Analysis Chemical Methods Part. 1996, 72, 532–535. [Google Scholar] [CrossRef]
  20. Schimel, J.P.; Weintraub, M.N. The implications of exoenzyme activity on microbial carbon and nitrogen limitation in soil: A theoretical model. Soil Biol. Biochem. 2003, 35, 549–563. [Google Scholar] [CrossRef]
  21. Clemmensen, K.E.; Bahr, A.; Ovaskainen, O.; Dahlberg, A.; Ekblad, A.; Wallander, H.; Stenlid, J.; Finlay, R.D.; Wardle, D.A.; Lindahl, B.D. Roots and Associated Fungi Drive Long-Term Carbon Sequestration in Boreal Forest. Science 2013, 339, 1615–1618. [Google Scholar] [CrossRef] [PubMed]
  22. Fontaine, S.; Barot, S.; Barré, P.; Bdioui, N.; Mary, B.; Rumpel, C. Stability of organic carbon in deep soil layers controlled by fresh carbon supply. Nature 2007, 450, 277–280. [Google Scholar] [CrossRef] [PubMed]
  23. Yang, Y.; Luo, Y. Carbon:nitrogen stoichiometry in forest ecosystems during stand development. Glob. Ecol. Biogeogr. 2011, 20, 354–361. [Google Scholar] [CrossRef]
  24. Li, Z.; Liu, C.; Dong, Y.; Chang, X.; Nie, X.; Liu, L.; Xiao, H.; Lu, Y.; Zeng, G. Response of soil organic carbon and nitrogen stocks to soil erosion and land use types in the Loess hilly–gully region of China. Soil Tillage Res. 2017, 166, 1–9. [Google Scholar] [CrossRef]
  25. Leon, D.G.D.; Moora, M.; Öpik, M.; Neuenkamp, L.; Gerz, M.; Jairus, T.; Vasar, M.; Bueno, C.G.; Davison, J.; Zobel, M. Symbiont dynamics during ecosystem succession: Co-occurring plant and arbuscular mycorrhizal fungal communities. FEMS Microbiol. Ecol. 2016, 92, 1–9. [Google Scholar] [CrossRef]
  26. Hao, W.F.; Liang, Z.S.; Chen, C.G.; Tang, L. Study of species diversity evolvement process during vegetation restoration of abandoned farmland in the hilly loess plateau. Pratac. Sci. 2005, 22, 1–8, (In Chinese with English Abstract). [Google Scholar] [CrossRef]
  27. Novara, A.; Mantia, T.L.; Rühl, J.; Badalucco, L.; Kuzyakov, Y.; Gristina, L.; Laudicina, V.A. Dynamics of soil organic carbon pools after agricultural abandonment. Geoderma 2014, 235–236, 191–198. [Google Scholar] [CrossRef]
  28. O’Brien, S.L.; Jastrow, J.D. Physical and chemical protection in hierarchical soil aggregates regulates soil carbon and nitrogen recovery in restored perennial grasslands. Soil Biol. Biochem. 2013, 61, 1–13. [Google Scholar] [CrossRef]
  29. Jia, H.E.; Yu-Fu, H.U.; Shu, X.Y.; Wang, Q.; Jia, A.D.; Yan, X.; University, S.A. Effect of Salix cupularis plantations on soil stoichiometry and stocks in the alpine-cold desert of northwestern. Sin. Acta Agrestia Sin. 2018. (In Chinese with English Abstract). [Google Scholar] [CrossRef]
  30. Lane, P.N.J.; Noske, P.J.; Sheridan, G.J. Phosphorus enrichment from point to catchment scale following fire in eucalypt forests. Catena 2011, 87, 157–162. [Google Scholar] [CrossRef]
  31. Cheng, Y.; Li, P.; Xu, G.; Gao, H. Spatial distribution of soil total phosphorus in Yingwugou watershed of the Dan River, China. Catena 2016, 136, 175–181. [Google Scholar] [CrossRef]
  32. Kooijman, A.M.; Jongejans, J.; Sevink, J. Parent material effects on Mediterranean woodland ecosystems in NE Spain. Catena 2005, 59, 55–68. [Google Scholar] [CrossRef]
  33. Comino, J.R.; Sinoga, J.D.R.; González, J.M.S.; Guerra-Merchán, A.; Seeger, M.; Ries, J.B. High variability of soil erosion and hydrological processes in Mediterranean hillslope vineyards (Montes de Málaga, Spain). Catena 2016, 145, 274–284. [Google Scholar] [CrossRef]
  34. Duan, X.N.; Wang, X.K.; Lu, F.; Ouyang, Z.Y. Soil carbon sequestration and its potential by grassland ecosystems in China. Acta Ecol. Sin. 2008. (In Chinese with English Abstract). [Google Scholar] [CrossRef]
  35. Reich, P.B.; Oleksyn, J. Global patterns of plant leaf N and P in relation to temperature and latitude. Proc. Natl. Acad. Sci. USA 2004, 101, 11001–11006. [Google Scholar] [CrossRef] [PubMed] [Green Version]
  36. An, H.; Li, G.Q. Effects of grazing on carbon and nitrogen in plants and soils in a semiarid desert grassland, China. J. Arid Land 2015, 7, 341–349. [Google Scholar] [CrossRef]
  37. Yu, Y.F.; Peng, W.X.; Song, T.Q. Stoichiometric characteristics of plant and soil C, N and P in different forest types in depressions between karst hills, southwest China. Chin. J. Appl. Ecol. 2014, 25, 947–954, (In Chinese with English Abstract). [Google Scholar] [CrossRef]
  38. Chen, L.; Li, C.L. Research advances in ecological stoichiometry of marine plankton. Chin. J. Appl. Ecol. 2014, 25, 3047–3055, (In Chinese with English Abstract). [Google Scholar] [CrossRef]
  39. Berger, T.W.; Neubauer, C.; Glatzel, G. Factors controlling soil carbon and nitrogen stores in pure stands of Norway spruce (Picea abies) and mixed species stands in Austria. For. Ecol. Manag. 2002, 159, 3–14. [Google Scholar] [CrossRef]
  40. Liu, X.Z.; Zhou, G.Y.; Zhang, D.Q.; Liu, S.Z.; Chu, G.W.; Yan, J.H. N and P stoichiometry of plant and soil in lower subtropical forest successional series in southern China. J. Plant Ecol. 2010, 34, 64–71, (In Chinese with English Abstract). [Google Scholar] [CrossRef]
  41. Zeng, Q.; Liu, Y.; Fang, Y.; Ma, R.; Lal, R.; An, S.; Huang, Y. Impact of vegetation restoration on plants and soil C:N:P stoichiometry on the Yunwu Mountain Reserve of China. Ecol. Eng. 2017, 109, 92–100. [Google Scholar] [CrossRef]
  42. Barreto, P.A.B.; Gama-Rodrigues, E.F.; Fontes, A.G.; Polidoro, J.C.; Moço, M.K.S.; Machado, R.C.R.; Baligar, V.C. Distribution of oxidizable organic C fractions in soils under cacao agroforestry systems in Southern Bahia, Brazil. Agrofor. Syst. 2011, 81, 213–220. [Google Scholar] [CrossRef]
  43. Zhang, X. Ecological stoichiometry characteristics of robinia pseudoacacia forest soil in different latitudes of loess plateau. Acta Ecol. Sin. 2013, 50, 818–825. [Google Scholar] [CrossRef]
  44. Han, L.; Li, Z.; Ceng, Y. Carbon, nitrogen, and phosphorous stoichiometry of herbaceous plant leaf and soil in riparian zone of Taihu Lake basin, East China under effects of different land use types. Chin. J. Ecol. 2013, 32, 3281–3288, (In Chinese with English Abstract). [Google Scholar] [CrossRef]
  45. Vesterdal, L.; Ritter, E.; Gundersen, P. Change in soil organic carbon following afforestation of former arable land. For. Ecol. Manag. 2002, 169, 137–147. [Google Scholar] [CrossRef]
  46. Guo, S.L.; Ma, Y.H.; Che, S.G.; Sun, W.Y. Effects of artificial and natural vegetations on litter production and soil organic carbon change in loess hilly areas. Sci. Silvae Sin. 2009, 45, 14–18, (In Chinese with English Abstract). [Google Scholar] [CrossRef]
  47. Pizzeghello, D.; Francioso, O.; Concheri, G.; Muscolo, A.; Nardi, S. Land Use Affects the Soil C Sequestration in Alpine Environment, NE Italy. Forests 2017, 8, 197. [Google Scholar] [CrossRef]
  48. De Feudis, M.; Cardelli, V.; Massaccesi, L.; Lagomarsino, A.; Fornasier, F.; Westphalen, D.J.; Coccco, S.; Corti, G.; Agnelli, A. Influence of Altitude on Biochemical Properties of European Beech (Fagus sylvatica L.) Forest Soils. Forests 2017, 8, 213. [Google Scholar] [CrossRef]
  49. Cesarz, S.; Fender, A.C.; Beyer, F.; Valtanen, K.; Pfeiffer, B.; Gansert, D.; Hertel, D.; Leuschner, C. Roots from beech (Fagus sylvatica L.) and ash (Fraxinus excelsior L.) differentially affect soil microorganisms and carbon dynamics. Soil Biol. Biochem. 2013, 61, 23–32. [Google Scholar] [CrossRef]
Figure 1. The locations of study sites in Ansai County, Shanxi Province, China.
Forests 10 00027 g001
Figure 2. Changes in stocks of soil organic carbon (SOC), soil total nitrogen (TN), and soil total phosphorus (TP) with restoration age. Note: values are mean ± standard error.
Forests 10 00027 g002
Figure 3. Stocks of soil organic carbon (SOC), soil total nitrogen (TN), and soil total phosphorus (TP) at different soil depths in grassland at 30 years compared to those of natural grassland, and those of shrubland at 47 years and forestland at 56 years compared to those of natural forest. Note: values are mean ± standard error. (ac) means the SOC stock, Soil TN stock and Soil TP stock at different soil depths in grassland30 compared to those of natural grassland. (df) means the SOC stock, Soil TN stock and Soil TP stock at different soil depths in shrubland47 and forestland56 compared to those of natural forest * denotes significant differences between the natural grassland and grassland at 30 years after vegetation restoration (p < 0.05). * denotes significant differences between the natural forest and shrubland at 47 years after vegetation restoration (p < 0.05). + denotes significant differences between the natural forest and forestland at 56 years after vegetation restoration (p < 0.05).
Forests 10 00027 g003
Figure 4. Stoichiometric characteristics of soil organic carbon (SOC), soil total nitrogen (TN), and soil total phosphorus (TP) with restoration age. Note: values are mean ± standard error.
Forests 10 00027 g004
Figure 5. Stoichiometry of soil organic carbon (SOC), soil total nitrogen (TN), and soil total phosphorus (TP) at different soil depths in grassland at 30 years compared to that of natural grassland, and those of shrubland at 47 years and forestland at 56 years compared to that of natural forestland. Note: values are mean ± standard error. (ac) means the C:N, C:P and N:P at different soil depths in grassland30 compared to those of natural grassland. (df) means the C:N, C:P and N:P at different soil depths in shrubland47 and forestland56 compared to those of natural forest * denotes significant differences between the natural grassland and grassland at 30 years after vegetation restoration (p < 0.05). * denotes significant differences between the natural forest and shrubland at 47 years after vegetation restoration (p < 0.05). + denotes significant differences between the natural forest and forestland at 56 years after vegetation restoration (p < 0.05).
Forests 10 00027 g005
Figure 6. Vertical distributions of soil organic carbon (SOC), soil total nitrogen (TN), and soil total phosphorus (TP) contents for different vegetation types. Note: values are mean ± standard error.
Forests 10 00027 g006

