Effects of Topography on Tree Community Structure in a Deciduous Broad-Leaved Forest in North-Central China


Abstract
:1. Introduction
2. Methods
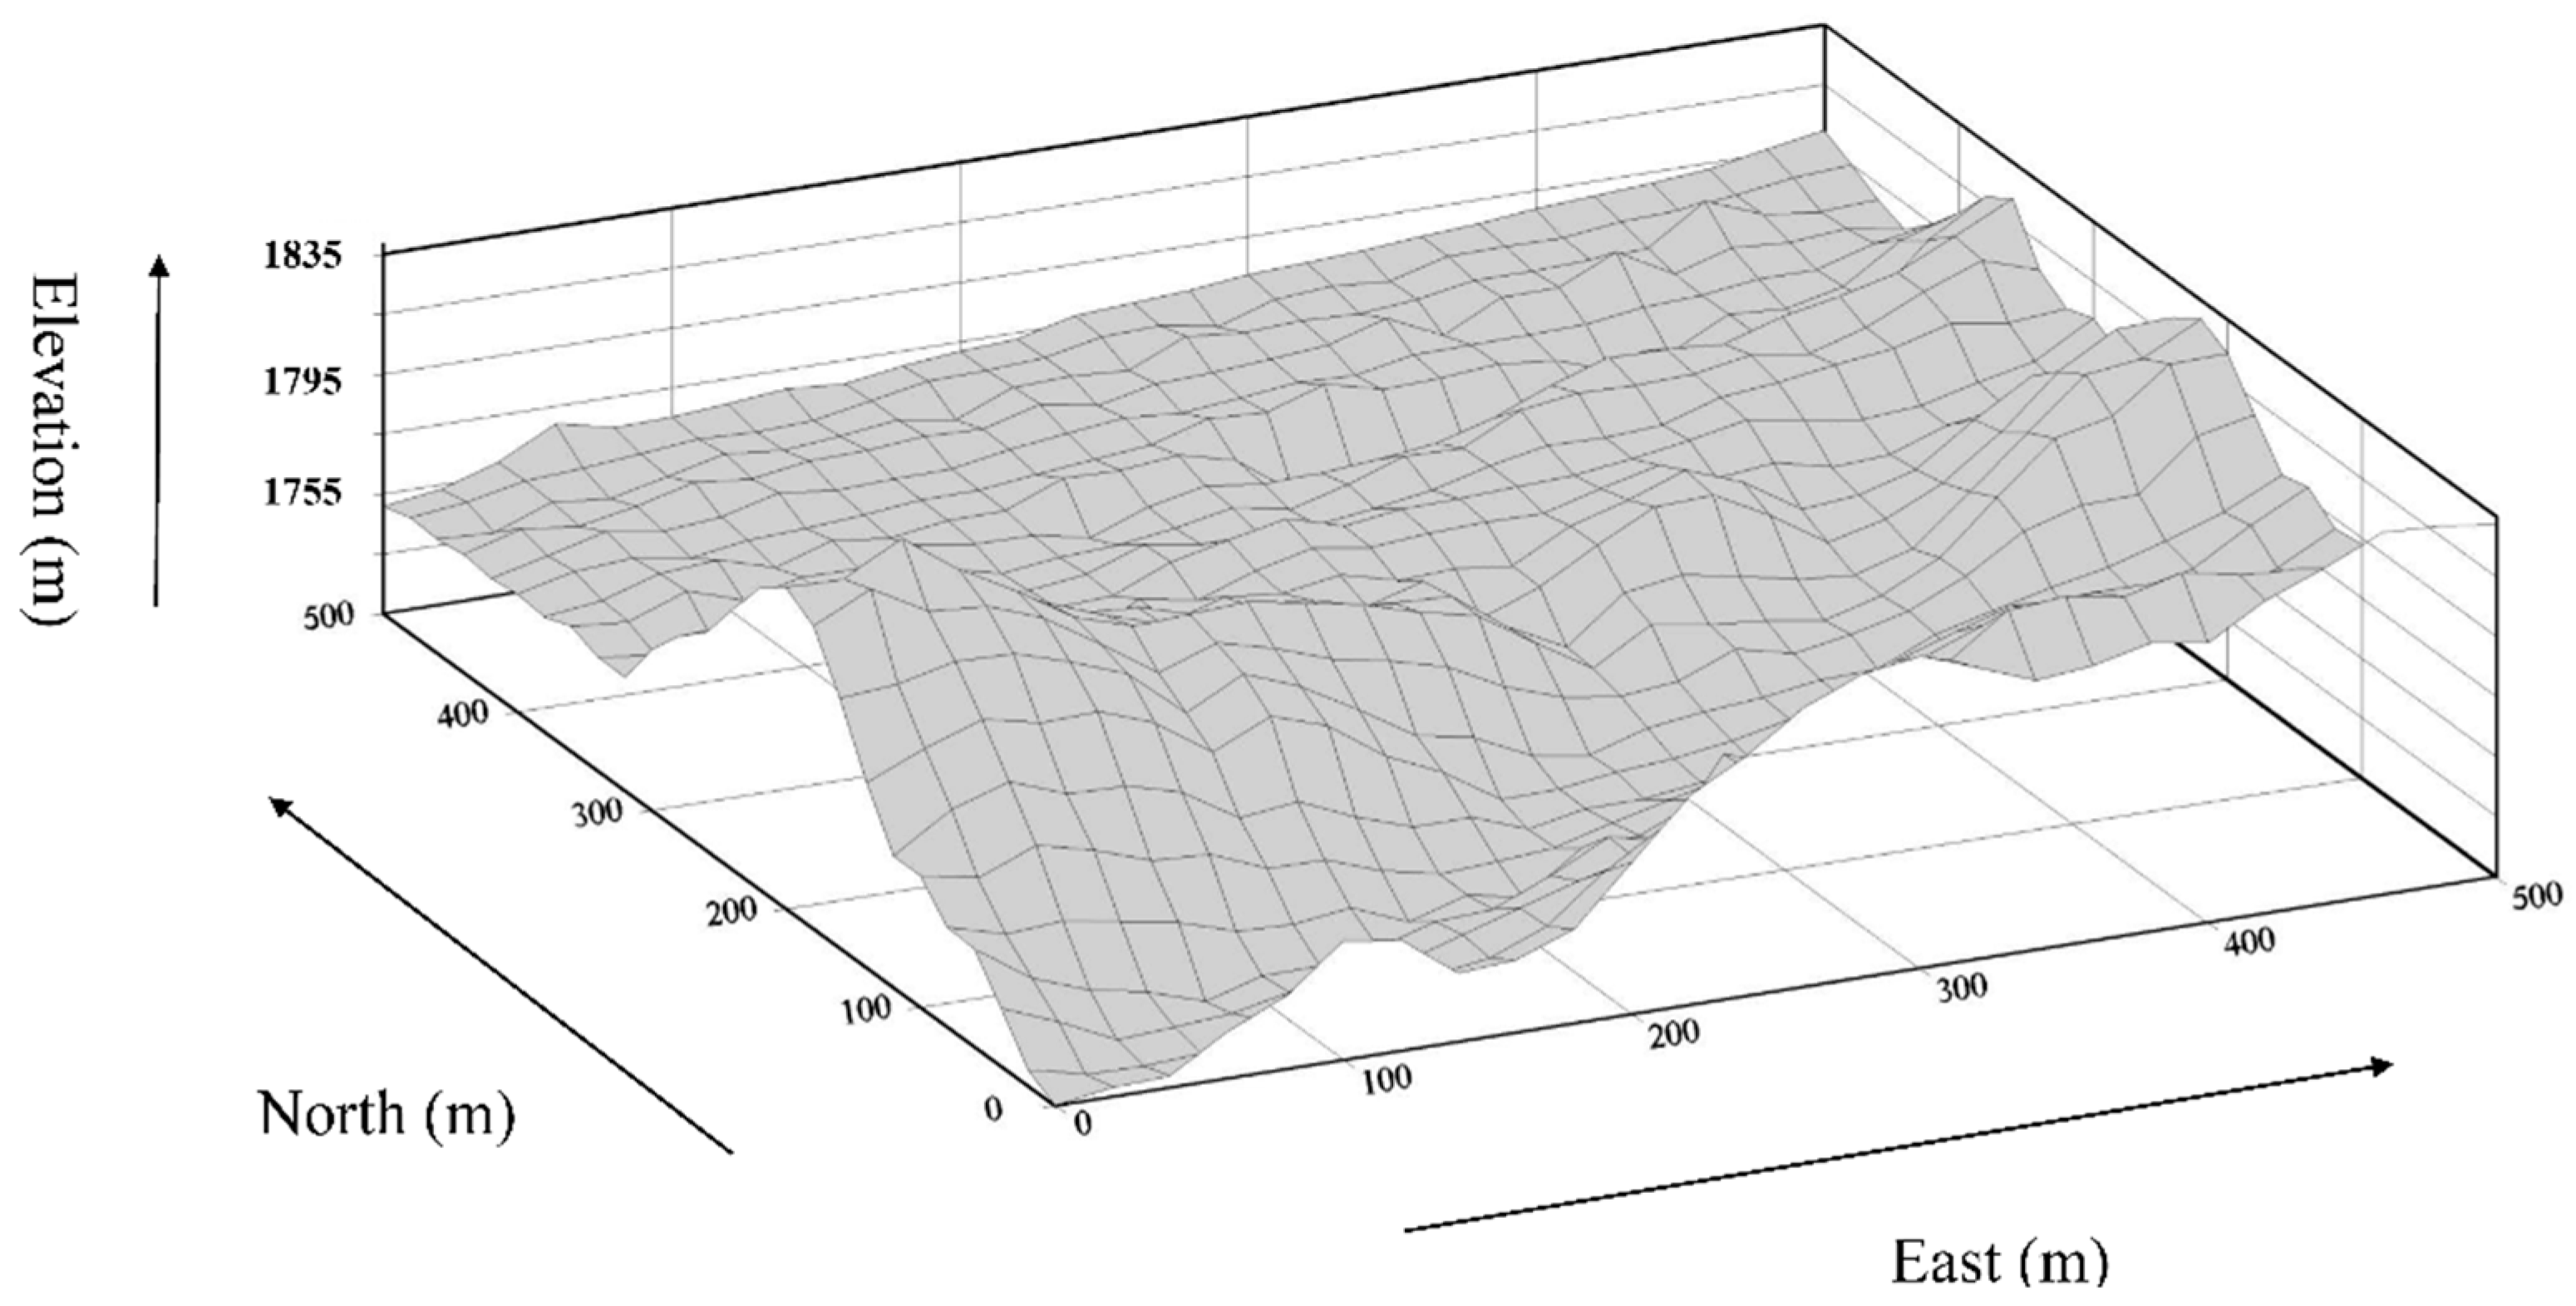
2.1. Study Site
2.2. Data Collection
2.3. Topographic Variables
3. Data Analyses
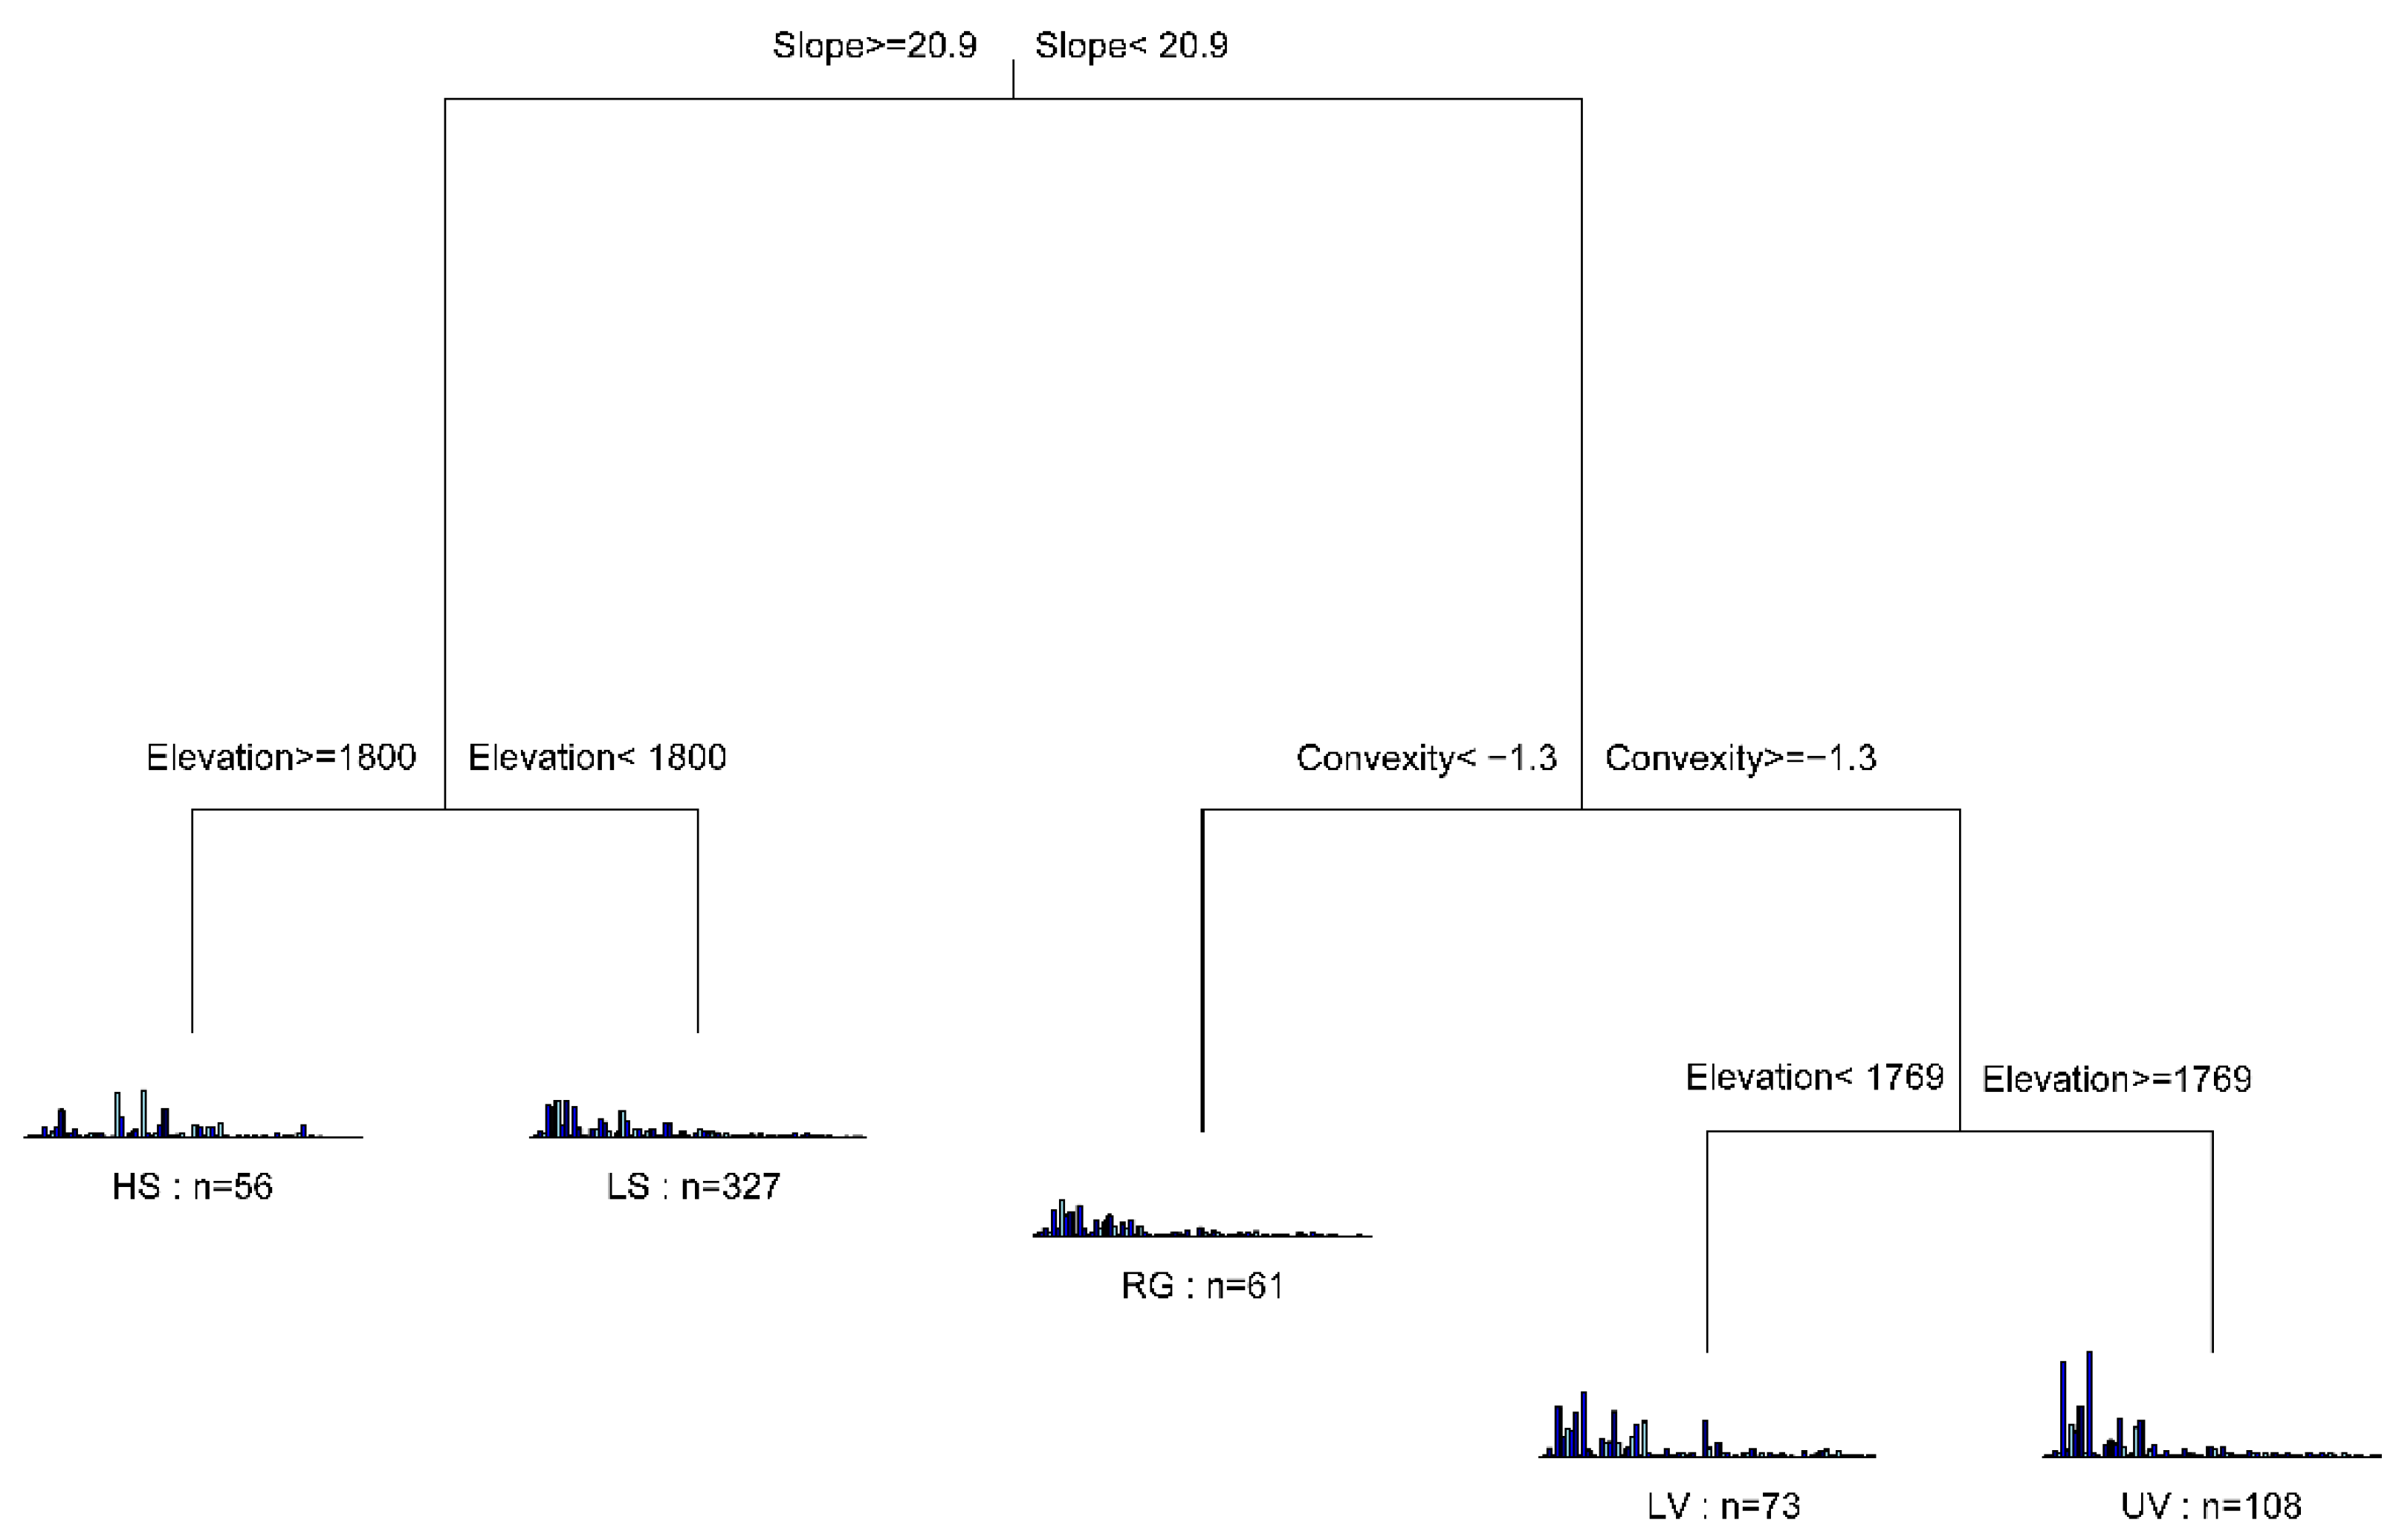
3.1. Habitat Definition
3.2. Habitat Associations across Life Stages
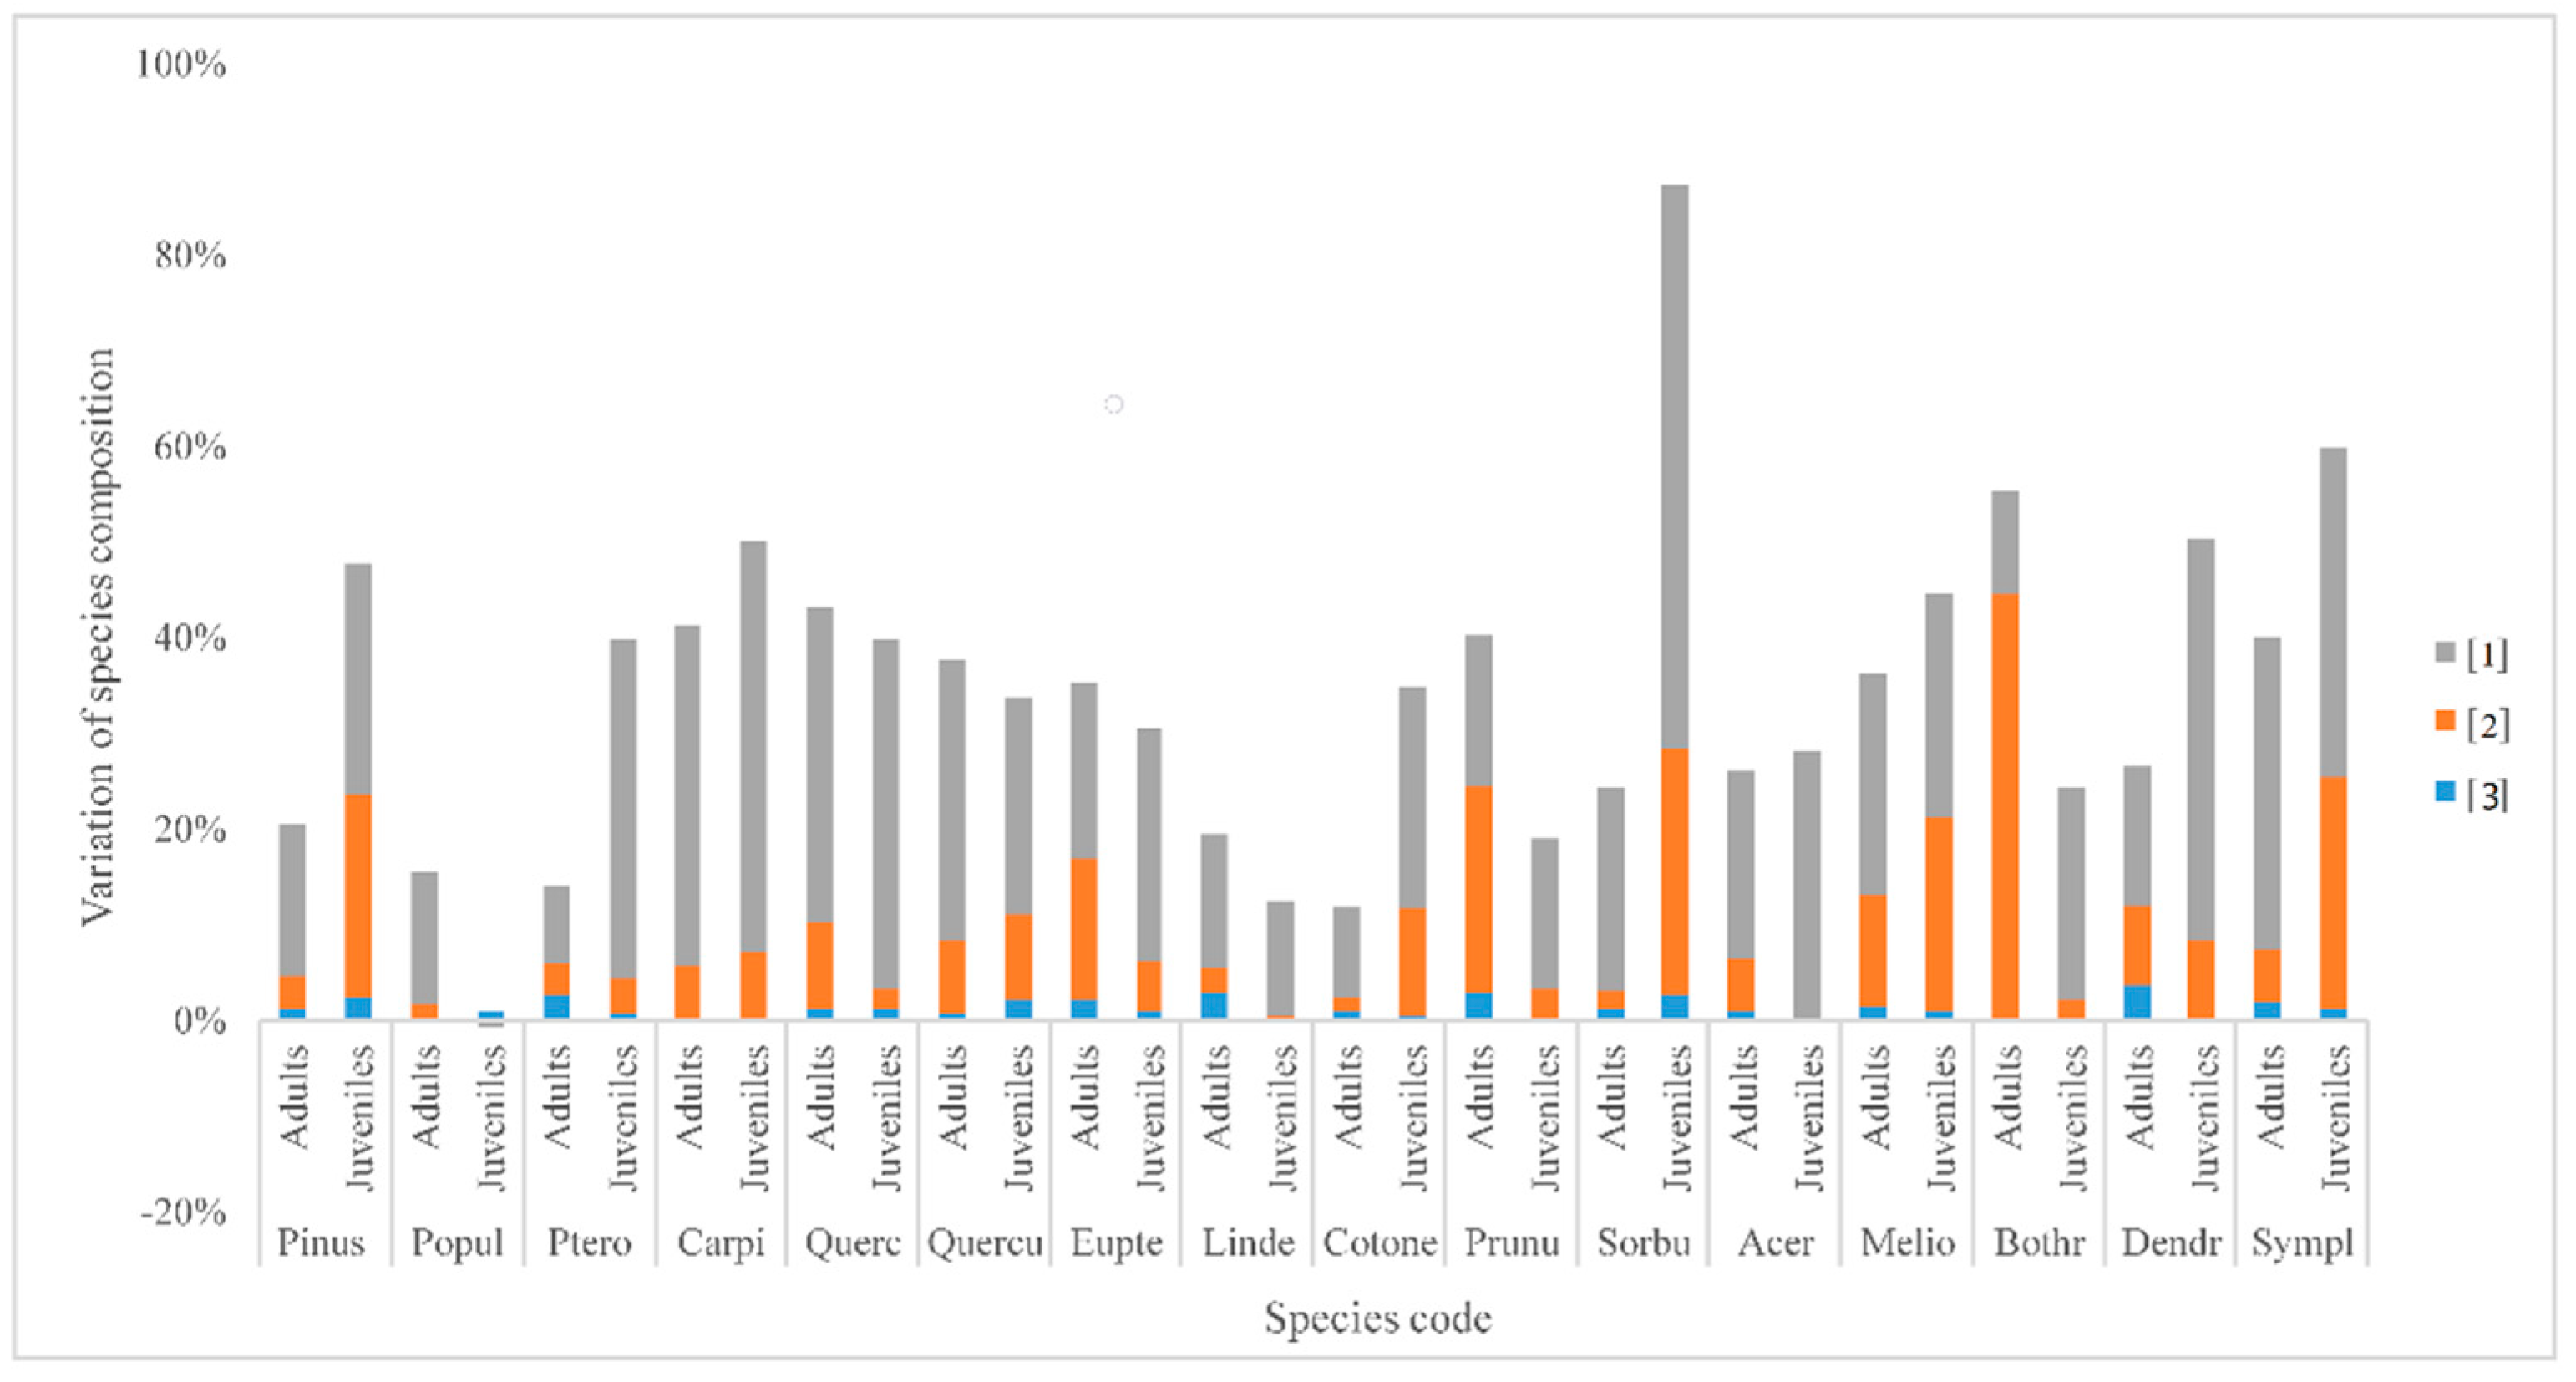
3.3. Variation Partitioning of Dominant Species
4. Results
4.1. Habitat Definition and Characteristics
4.2. Habitat Associations
4.3. Variation Partitioning
5. Discussion
5.1. Habitat Definition and Structure in the 25-ha Plot
5.2. Habitat Associations
5.3. The Contribution of Topographic and Spatial Variables to Species Distribution
6. Conclusions
Author Contributions
Funding
Acknowledgments
Conflicts of Interest
References
- Tilman, D. Resource competition and community structure. Monogr. Popul. Biol. 1982, 17, 1–296. [Google Scholar] [PubMed]
- Leibold, M.A.; McPeek, M.A. Coexistence of the niche and neutral perspectives in community ecology. Ecology 2006, 87, 1399–1410. [Google Scholar] [CrossRef]
- Keddy, P.A. Assembly and response rules: Two goals for predictive community ecology. J. Veg. Sci. 1992, 3, 157–164. [Google Scholar] [CrossRef]
- Legendre, P.; Mi, X.; Ren, H.; Ma, K.; Yu, M.; Sun, I.F.; He, F. Partitioning beta diversity in a subtropical broad-leaved forest of China. Ecology 2009, 90, 663–674. [Google Scholar] [CrossRef] [Green Version]
- Whittaker, R.H. Vegetation of the Great Smoky Mountains. Ecol. Monogr. 1956, 26, 1–69. [Google Scholar] [CrossRef]
- Daws, M.I.; Mullins, C.E.; Burslem, D.F.R.P.; Paton, S.R.; Dalling, J.W. Topographic position affects the water regime in a semideciduous tropical forest in Panamá. Plant Soil 2002, 238, 79–89. [Google Scholar] [CrossRef]
- Comita, L.S.; Condit, R.; Hubbell, S.P. Developmental changes in habitat associations of tropical trees. J. Ecol. 2007, 95, 482–492. [Google Scholar] [CrossRef] [Green Version]
- De’Ath, G. Multivariate regression trees: A new technique for modeling species-environment relationships. Ecology 2002, 83, 1105–1117. [Google Scholar] [CrossRef]
- Baldeck, C.A.; Harms, K.E.; Yavitt, J.B.; John, R.; Turner, B.L.; Valencia, R.; Navarrete, H.; Bunyavejchewin, S.; Kiratiprayoon, S.; Yaacob, A.; et al. Habitat filtering across tree life stages in tropical forest communities. Proc. Biol. Sci. 2013, 280, 20130548. [Google Scholar] [CrossRef] [PubMed]
- Harms, K.E.; Condit, R.; Hubbell, S.P.; Foster, R.B. Habitat associations of trees and shrubs in a 50-ha neotropical forest plot. J. Ecol. 2001, 89, 947–959. [Google Scholar] [CrossRef] [Green Version]
- Wang, Q.G.; Punchi-Manage, R.; Lu, Z.J.; Franklin, S.B.; Wang, Z.H.; Li, Y.Q.; Chi, X.L.; Bao, D.C.; Guo, Y.L.; Lu, J.M.; et al. Effects of topography on structuring species assemblages in a subtropical forest. J. Plant Ecol. 2017, 10, 440–449. [Google Scholar] [CrossRef]
- Webb, C.O.; Peart, D.R. Habitat associations of trees and seedlings in a Bornean rain forest. J. Ecol. 2000, 88, 464–478. [Google Scholar] [CrossRef] [Green Version]
- Baldeck, C.A.; Harms, K.E.; Yavitt, J.B.; John, R.; Turner, B.L.; Valencia, R.; Navarrete, H.; Davies, S.J.; Chuyong, G.B.; Kenfack, D.; et al. Soil resources and topography shape local tree community structure in tropical forests. Proc. Biol. Sci. 2013, 280, 20122532. [Google Scholar] [CrossRef] [PubMed]
- Kanagaraj, R.; Wiegand, T.; Comita, L.S.; Huth, A. Tropical tree species assemblages in topographical habitats change in time and with life stage. J. Ecol. 2011, 99, 1441–1452. [Google Scholar] [CrossRef] [Green Version]
- Punchi-Manage, R.; Getzin, S.; Wiegand, T.; Kanagaraj, R.; Gunatilleke, C.V.S.; Gunatilleke, I.A.U.N.; Wiegand, K.; Huth, A. Effects of topography on structuring local species assemblages in a Sri Lankan mixed dipterocarp forest. J. Ecol. 2013, 101, 149–160. [Google Scholar] [CrossRef]
- Webb, C.O.; Ackerly, D.D.; McPeek, M.A.; Donoghue, M.J. Phylogenies and community ecology. Annu. Rev. Ecol. Syst. 2002, 33, 475–505. [Google Scholar] [CrossRef]
- Gilbert, B.; Lechowicz, M.J. Neutrality, niches, and dispersal in a temperate forest understory. Proc. Natl. Acad. Sci. USA 2004, 101, 7651–7656. [Google Scholar] [CrossRef] [PubMed] [Green Version]
- Lan, G.Y.; Hu, Y.H.; Cao, M.; Zhu, H. Topography related spatial distribution of dominant tree species in a tropical seasonal rain forest in China. For. Ecol. Manag. 2011, 262, 1507–1513. [Google Scholar] [CrossRef]
- Liu, Y.U.; Linderholm, H.W.; Song, H.; Cai, Q.; Tian, Q.; Sun, J.; Chen, D.; Simelton, E.; Seftigen, K.; Tian, H.U.A.; et al. Temperature variations recorded inPinus tabulaeformistree rings from the southern and northern slopes of the central Qinling Mountains, central China. Boreas 2009, 38, 285–291. [Google Scholar] [CrossRef]
- Dang, H.S.; Jiang, M.X.; Zhang, Q.F.; Zhang, Y.J. Growth responses of subalpine fir (Abies fargesii) to climate variability in the Qinling Mountain, China. For. Ecol. Manag. 2007, 240, 143–150. [Google Scholar] [CrossRef]
- Yue, M.; Dang, G.; Gu, T. Vertical zone spectrum of vegetation in Foping National Reserve and the comparison with the adjacent areas. J. Wuhan Bot. Res. 2000, 18, 375–382. [Google Scholar]
- Zhang, K.R.; Dang, H.S.; Tan, S.D.; Wang, Z.X.; Zhang, Q.F. Vegetation community and soil characteristics of abandoned agricultural land and pine plantation in the Qinling Mountains, China. For. Ecol. Manag. 2010, 259, 2036–2047. [Google Scholar] [CrossRef]
- Du, X.C.; Ren, Y.; Dang, G.D.; Lundholm, J. Distribution and plant community associations of the understory bamboo Fargesia qinlingensis in the Foping National Nature Reserve, China. Ann. For. Sci. 2011, 68, 1197–1206. [Google Scholar] [CrossRef]
- Bagchi, R.; Henrys, P.A.; Brown, P.E.; Burslem, D.F.; Diggle, P.J.; Gunatilleke, C.V.; Gunatilleke, I.A.; Kassim, A.R.; Law, R.; Noor, S.; et al. Spatial patterns reveal negative density dependence and habitat associations in tropical trees. Ecology 2011, 92, 1723–1729. [Google Scholar] [CrossRef] [PubMed] [Green Version]
- Punchi-Manage, R.; Wiegand, T.; Wiegand, K.; Getzin, S.; Gunatilleke, C.V.S.; Gunatilleke, I.A.U.N. Effect of spatial processes and topography on structuring species assemblages in a Sri Lankan dipterocarp forest. Ecology 2014, 95, 376–386. [Google Scholar] [CrossRef] [PubMed]
- Yamakura, T.; Kanzaki, M.; Itoh, A.; Ohkubo, T.; Ogino, K.; Chai, E.O.K.; Seng, L.H.; Shaw, A.P. Topography of a Large-Scale Research Plot Established within a Tropical Rain Forest at Lambir, Sarawak. Tropics 1995, 5, 41–56. [Google Scholar] [CrossRef]
- Gower, J.C. Some Distance Properties of Latent Root and Vector Methods Used in Multivariate Analysis. Biometrika 1966, 53, 325–338. [Google Scholar] [CrossRef]
- Blanchet, F.G.; Legendre, P.; Borcard, D. Forward selection of explanatory variables. Ecology 2008, 89, 2623–2632. [Google Scholar] [CrossRef]
- Engelbrecht, B.M.; Comita, L.S.; Condit, R.; Kursar, T.A.; Tyree, M.T.; Turner, B.L.; Hubbell, S.P. Drought sensitivity shapes species distribution patterns in tropical forests. Nature 2007, 447, 80–82. [Google Scholar] [CrossRef] [Green Version]
- Helvey, J.D.; Hewlett, J.D.; Douglass, J.E. Predicting Soil Moisture in the Southern Appalachians. Soil Sci. Soc. Am. J. 1972, 36, 954–959. [Google Scholar] [CrossRef]
- Hewlett, J.D.; Hibbert, A.R. Moisture and Energy Conditions within a Sloping Soil Mass during Drainage. J. Geophys. Res. 1963, 68, 1081–1087. [Google Scholar] [CrossRef]
- Becker, P.; Rabenold, P.E.; Idol, J.R.; Smith, A.P. Water potential gradients for gaps and slopes in a Panamanian tropical moist forest’s dry season. J. Trop. Ecol. 1988, 4, 173–184. [Google Scholar] [CrossRef]
- Fotovat, A.; Naidu, R.; Sumner, M.E. Water:Soil ratio influences aqueous phase chemistry of indigenous copper and zinc in soils. Aust. J. Soil Res. 1997, 35, 687–709. [Google Scholar] [CrossRef]
- Gunatilleke, C.V.S.; Gunatilleke, I.A.U.N.; Esufali, S.; Harms, K.E.; Ashton, P.M.S.; Burslem, D.F.R.P.; Ashton, P.S. Species-habitat associations in a Sri Lankan dipterocarp forest. J. Trop. Ecol. 2006, 22, 371–384. [Google Scholar] [CrossRef]
- Lai, J.S.; Mi, X.C.; Ren, H.B.; Ma, K.P. Species-habitat associations change in a subtropical forest of China. J. Veg. Sci. 2009, 20, 415–423. [Google Scholar] [CrossRef]
- Hu, Y.H.; Sha, L.Q.; Blanchet, F.G.; Zhang, J.L.; Tang, Y.; Lan, G.Y.; Cao, M. Dominant species and dispersal limitation regulate tree species distributions in a 20-ha plot in Xishuangbanna, southwest China. Oikos 2012, 121, 952–960. [Google Scholar] [CrossRef]
- Zhang, Y. Shaanxi Forest; Xi’an Science and Technology Press: Xi’an, China, 1989. (In Chinese) [Google Scholar]
- Denslow, J.S.; Guzman, G.S. Variation in stand structure, light and seedling abundance across a tropical moist forest chronosequence, Panama. J. Veg. Sci. 2000, 11, 201–212. [Google Scholar] [CrossRef]
- Liu, Q.; Bi, L.; Song, G.; Wang, Q.; Jin, G. Species-habitat associations in an old-growth temperate forest in northeastern China. BMC Ecol. 2018, 18, 20. [Google Scholar] [CrossRef] [PubMed]
- Paoli, G.D.; Curran, L.M.; Zak, D.R. Soil nutrients and beta diversity in the Bornean Dipterocarpaceae: Evidence for niche partitioning by tropical rain forest trees. J. Ecol. 2006, 94, 157–170. [Google Scholar] [CrossRef]
- Borcard, D.; Legendre, P.; Drapeau, P. Partialling out the Spatial Component of Ecological Variation. Ecology 1992, 73, 1045–1055. [Google Scholar] [CrossRef] [Green Version]
- Svenning, J.C.; Kinner, D.A.; Stallard, R.F.; Engelbrecht, B.M.J.; Wright, S.J. Ecological determinism in plant community structure across a tropical forest landscape. Ecology 2004, 85, 2526–2538. [Google Scholar] [CrossRef]
- Chust, G.; Chave, J.; Condit, R.; Aguilar, S.; Lao, S.; Pérez, R. Determinants and spatial modeling of tree β-diversity in a tropical forest landscape in Panama. J. Veg. Sci. 2006, 17, 83–92. [Google Scholar] [CrossRef]


| Species | Species Code | Family | No of Juveniles | No of Adult | Branch Number | Basal Area (m2/ha) | Importance Value | Trees/ha |
|---|---|---|---|---|---|---|---|---|
| Quercus aliena | Querc | Fagaceae | 569 | 2625 | 515 | 0.923 | 14.3 | 153 |
| Sorbus alnifolia | Sorbu | Rosaceae | 1445 | 485 | 420 | 0.537 | 8.8 | 88 |
| Quercus spinosa | Quercu | Fagaceae | 569 | 968 | 1141 | 0.15 | 8.2 | 106 |
| Pterocarya insignis | Ptero | Juglandaceae | 370 | 115 | 201 | 0.135 | 6.5 | 21 |
| Populus purdomii | Popul | Salidaceae | 6 | 201 | 48 | 0.267 | 4.8 | 9 |
| Prunus conadenia | Prunu | Rosaceae | 141 | 1135 | 480 | 0.141 | 4.5 | 68 |
| Carpinus cordata | Carpi | Betulaceae | 953 | 358 | 489 | 0.195 | 3.8 | 60 |
| Pinus armandii | Pinus | Pinaceae | 236 | 676 | 28 | 0.132 | 3.5 | 47 |
| Bothrocaryum controversum | Bothr | Cornaceae | 66 | 727 | 112 | 0.0933 | 3.1 | 37 |
| Dendrobenthamia japonica | Dendr | Cornaceae | 2466 | 1013 | 1256 | 0.0735 | 2.7 | 173 |
| Euptelea pleiospermum | Eupte | Eupteleaceae | 231 | 385 | 550 | 0.0378 | 1.5 | 35 |
| Acer oliverianum | Acer | Aceraceae | 351 | 128 | 36 | 0.0011 | 1.2 | 22 |
| Lindera obtusiloba | Linde | Lauraceae | 147 | 470 | 211 | 0.0412 | 1.2 | 31 |
| Meliosma cuneifolia | Melio | Sabiaceae | 2075 | 650 | 3468 | 0.0241 | 1.1 | 131 |
| Symplocos paniculata | Sympl | Symplocaceae | 2984 | 743 | 992 | 0.0167 | 1 | 184 |
| Cotoneaster acutifolius | Cotone | Rosaceae | 1929 | 92 | 499 | 0.0028 | 1 | 89 |
| Total | 14,538 | 10,771 | 10,446 | 2.7705 | 67.2 | 1254 |
| Species | Habitat Association | ||
|---|---|---|---|
| Total | Juveniles | Adults | |
| Pinus armandii | LV− | HS+/RG− | RG− |
| Populus purdomii | HS− | ||
| Pterocarya insignis | HS−/RG+ | ||
| Carpinus cordata | HS− | ||
| Quercus aliena | UV+ | RG−/UV+ | |
| Quercus spinosa | HS+ | RG−/UV+ | HS+/RG− |
| Euptelea pleiospermum | LV−/UV− | LS+/RG−/LV− | LS+/RG−/LV−/UV− |
| Lindera obtusiloba | LV− | HS− | RG−/LV−/UV+ |
| Cotoneaster acutifolius | HS−/LS− | HS− | HS− |
| Prunus conadenia | UV+ | LS−/RG+ | |
| Sorbus alnifolia | LS−/UV+ | LS−/LV+/UV+ | |
| Acer oliverianum | LS+ | LV− | |
| Meliosma cuneifolia | HS− | HS−/LS+ | |
| Bothrocaryum controversum | HS−/UV+ | UV+ | |
| Dendrobenthamia japonica | UV+ | HS−/LS−/RG−/UV+ | UV+ |
| Symplocos paniculata | HS−/UV+ | HS−/UV+ | HS−/UV+ |
© 2019 by the authors. Licensee MDPI, Basel, Switzerland. This article is an open access article distributed under the terms and conditions of the Creative Commons Attribution (CC BY) license (http://creativecommons.org/licenses/by/4.0/).
Share and Cite
Shi, H.; Xie, F.; Zhou, Q.; Shu, X.; Zhang, K.; Dang, C.; Feng, S.; Zhang, Q.; Dang, H. Effects of Topography on Tree Community Structure in a Deciduous Broad-Leaved Forest in North-Central China. Forests 2019, 10, 53. https://doi.org/10.3390/f10010053
Shi H, Xie F, Zhou Q, Shu X, Zhang K, Dang C, Feng S, Zhang Q, Dang H. Effects of Topography on Tree Community Structure in a Deciduous Broad-Leaved Forest in North-Central China. Forests. 2019; 10(1):53. https://doi.org/10.3390/f10010053
Chicago/Turabian StyleShi, Hang, Fenglin Xie, Quan Zhou, Xiao Shu, Kerong Zhang, Chaoqi Dang, Shuiyuan Feng, Quanfa Zhang, and Haishan Dang. 2019. "Effects of Topography on Tree Community Structure in a Deciduous Broad-Leaved Forest in North-Central China" Forests 10, no. 1: 53. https://doi.org/10.3390/f10010053