The Microstructure and Mechanical Properties of Poplar Catkin Fibers Evaluated by Atomic Force Microscope (AFM) and Nanoindentation

 ,
, 
Abstract
:1. Introduction
2. Materials and Methods
2.1. Materials
2.2. Pretreatments
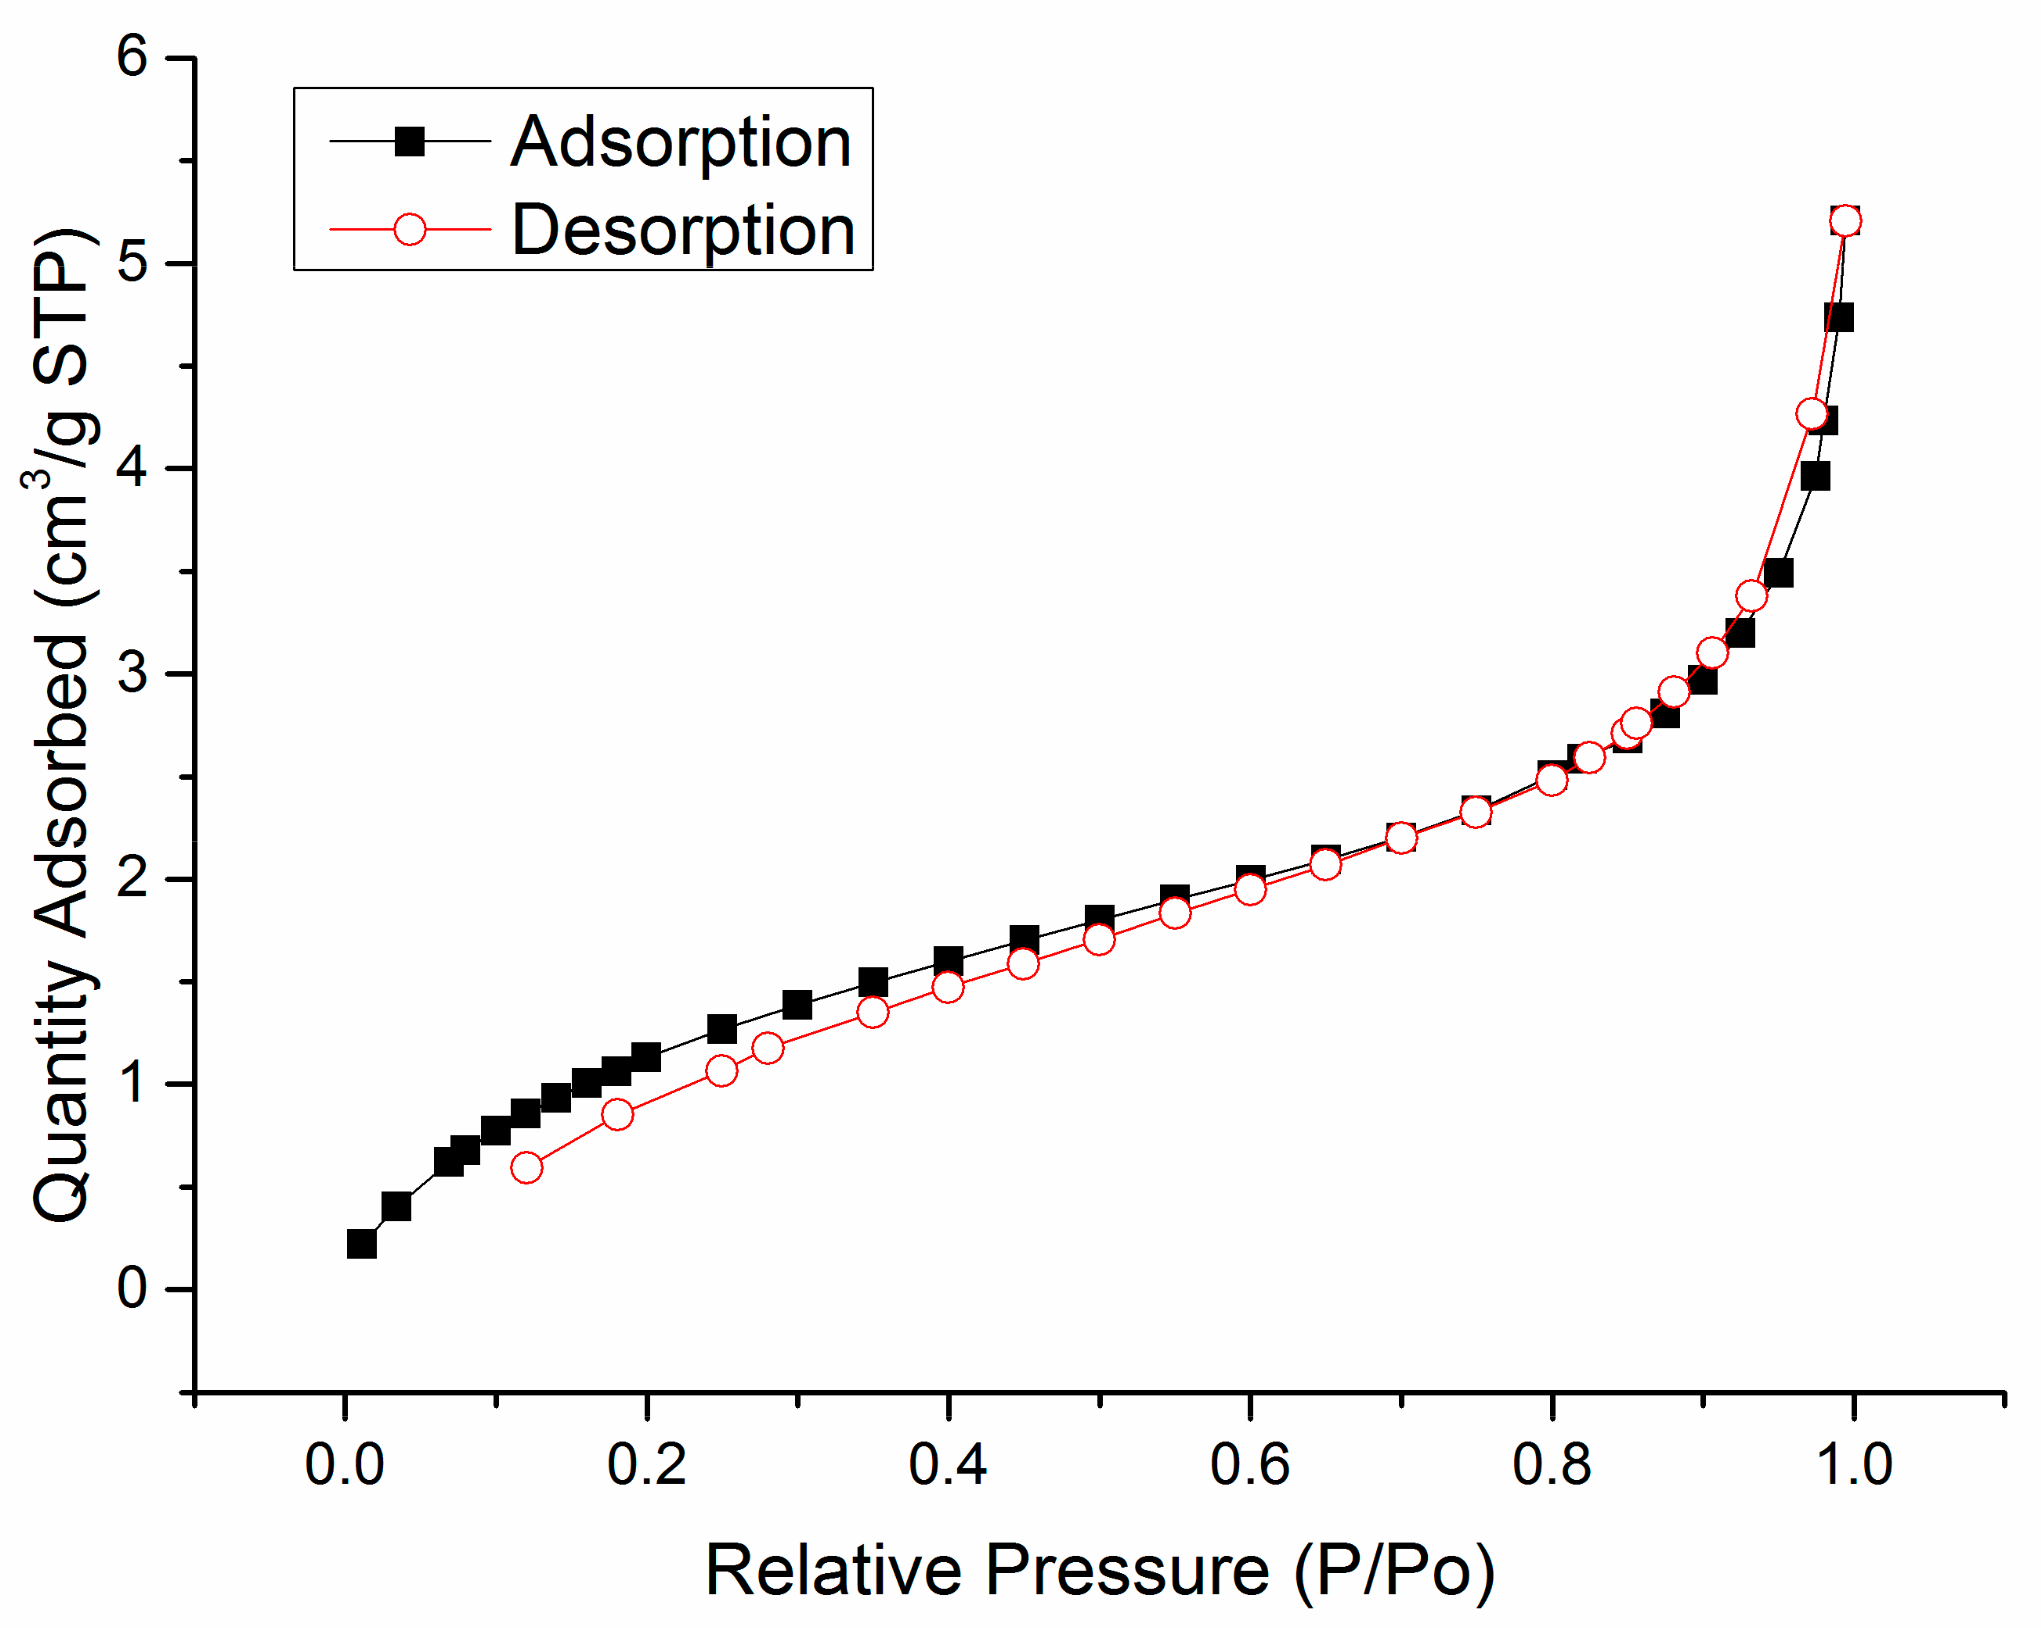
2.3. Specific Surface Area
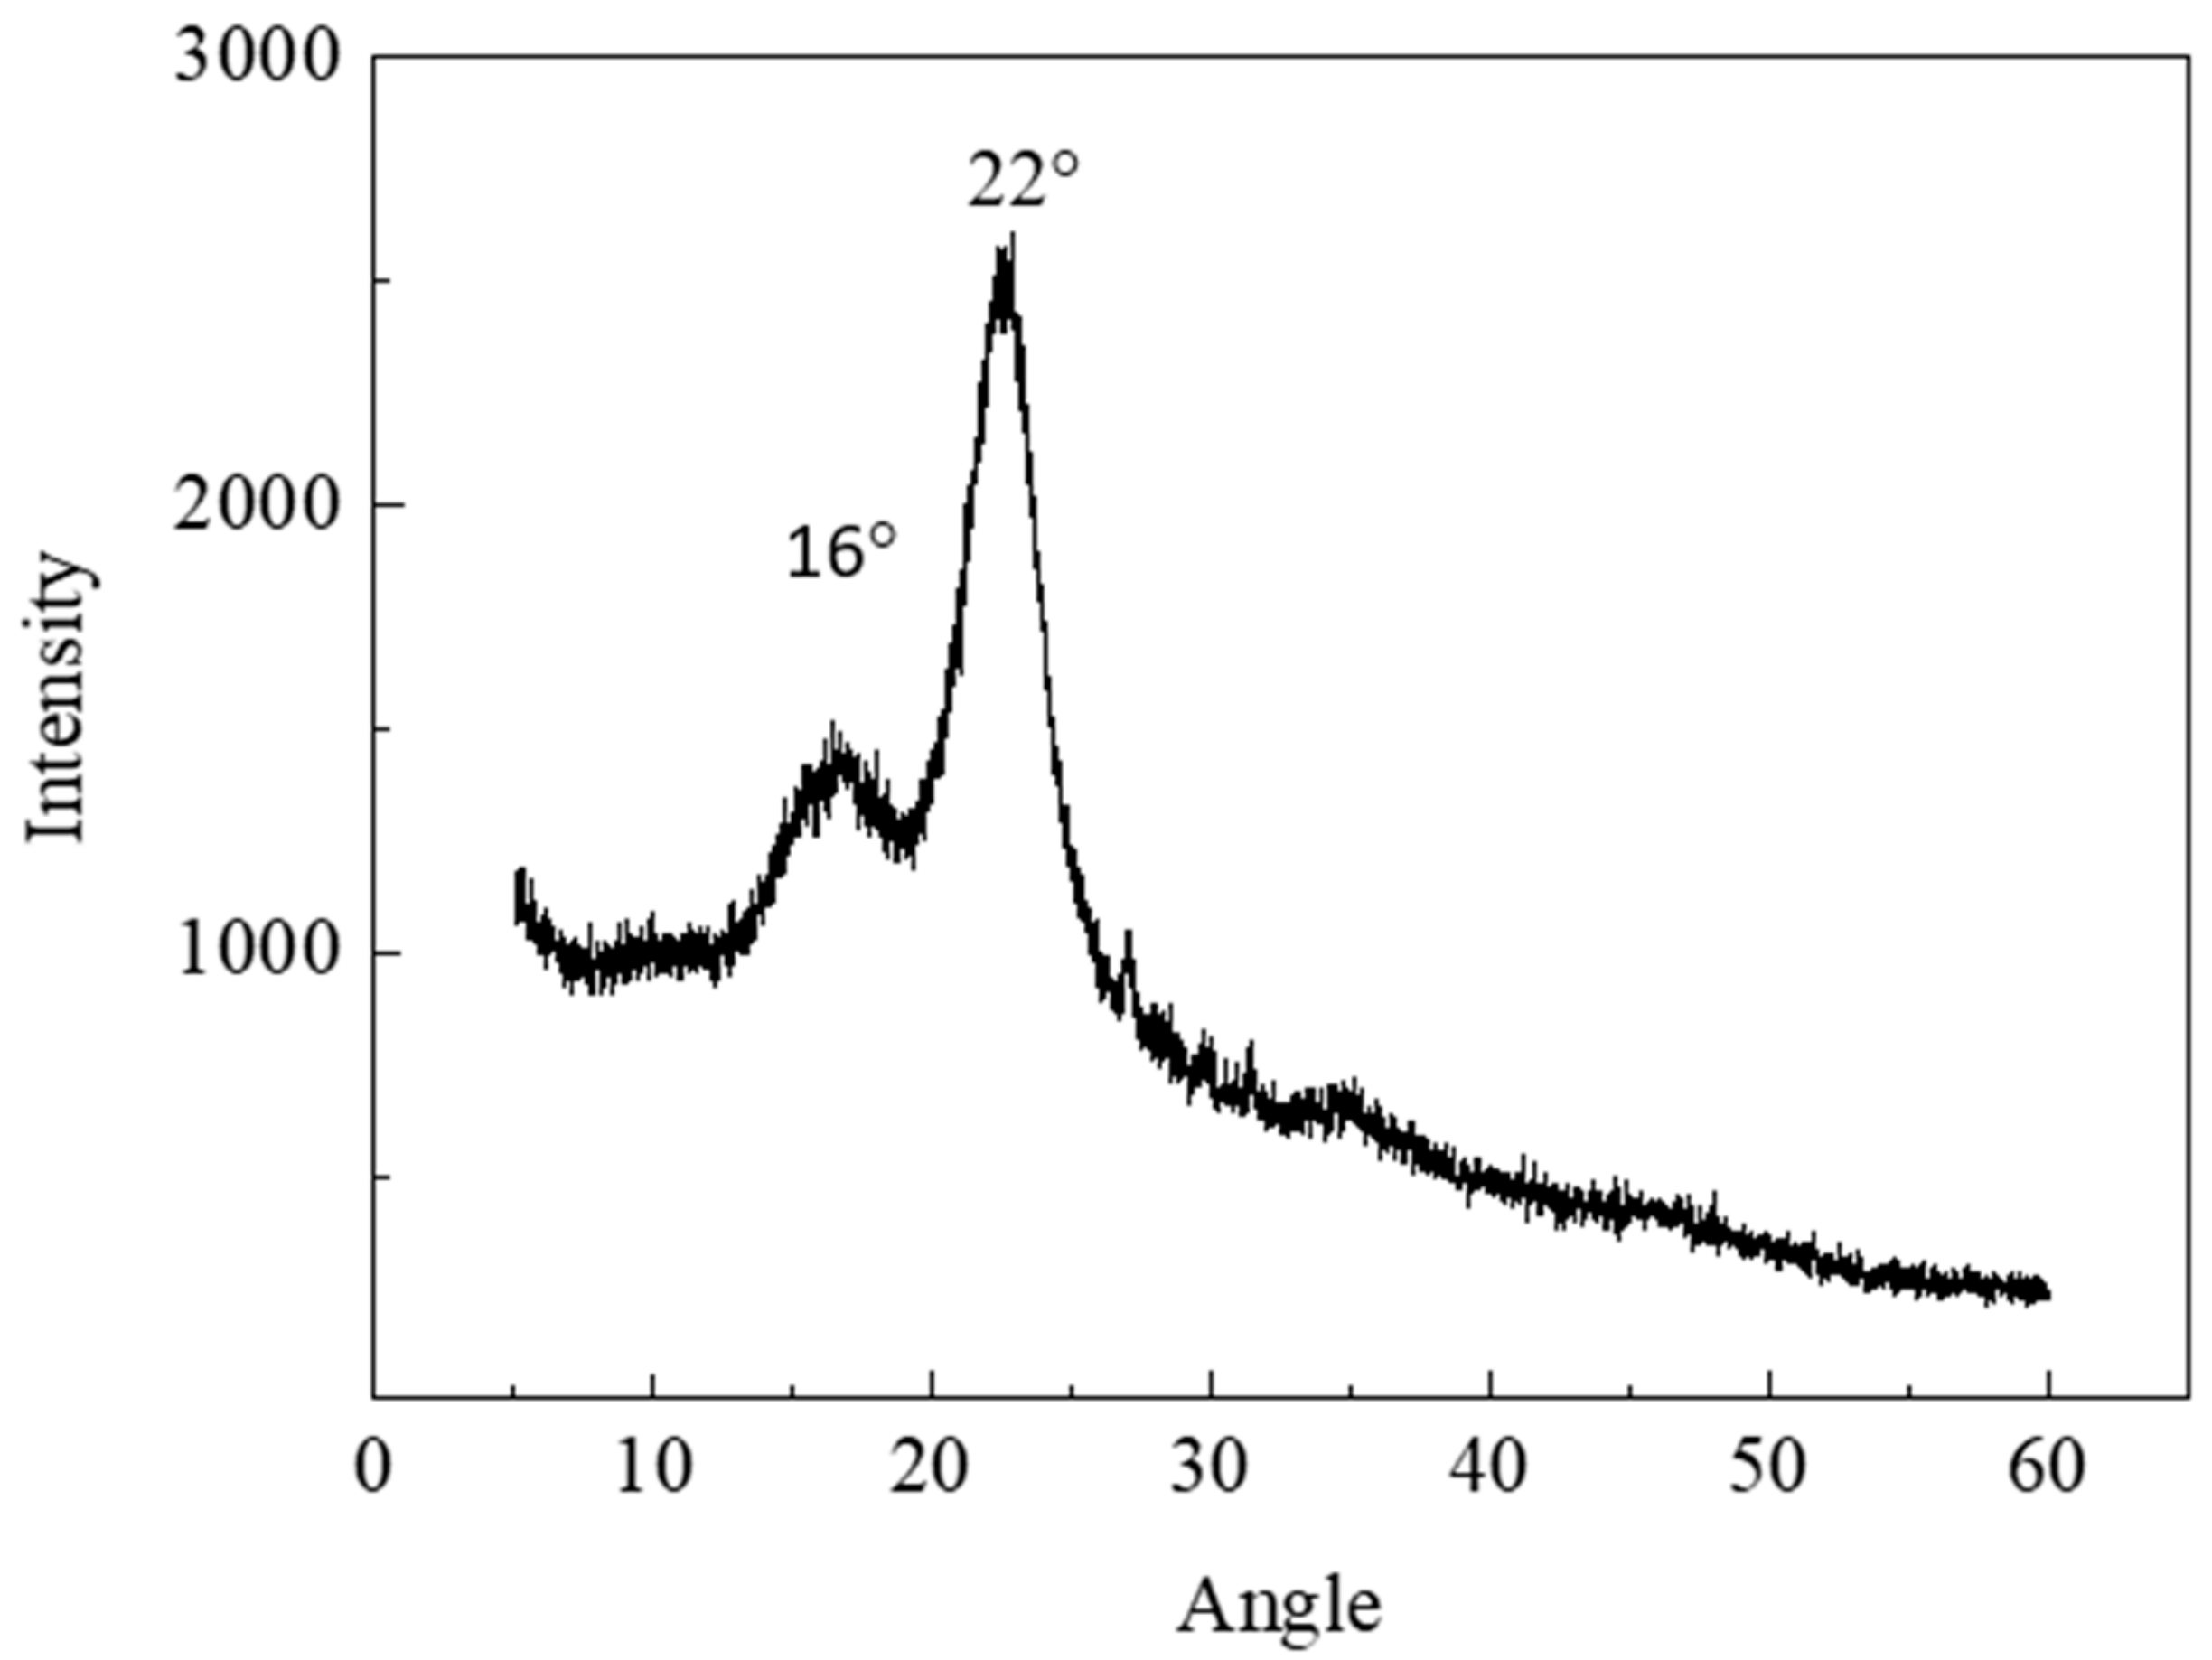
2.4. XRD
2.5. Micro-Morphology
2.6. AFM
2.7. FT-IR
2.8. In Situ Nanoindentation
3. Results and Discussion
3.1. Specific Surface Area
3.2. Crystallinity Analysis
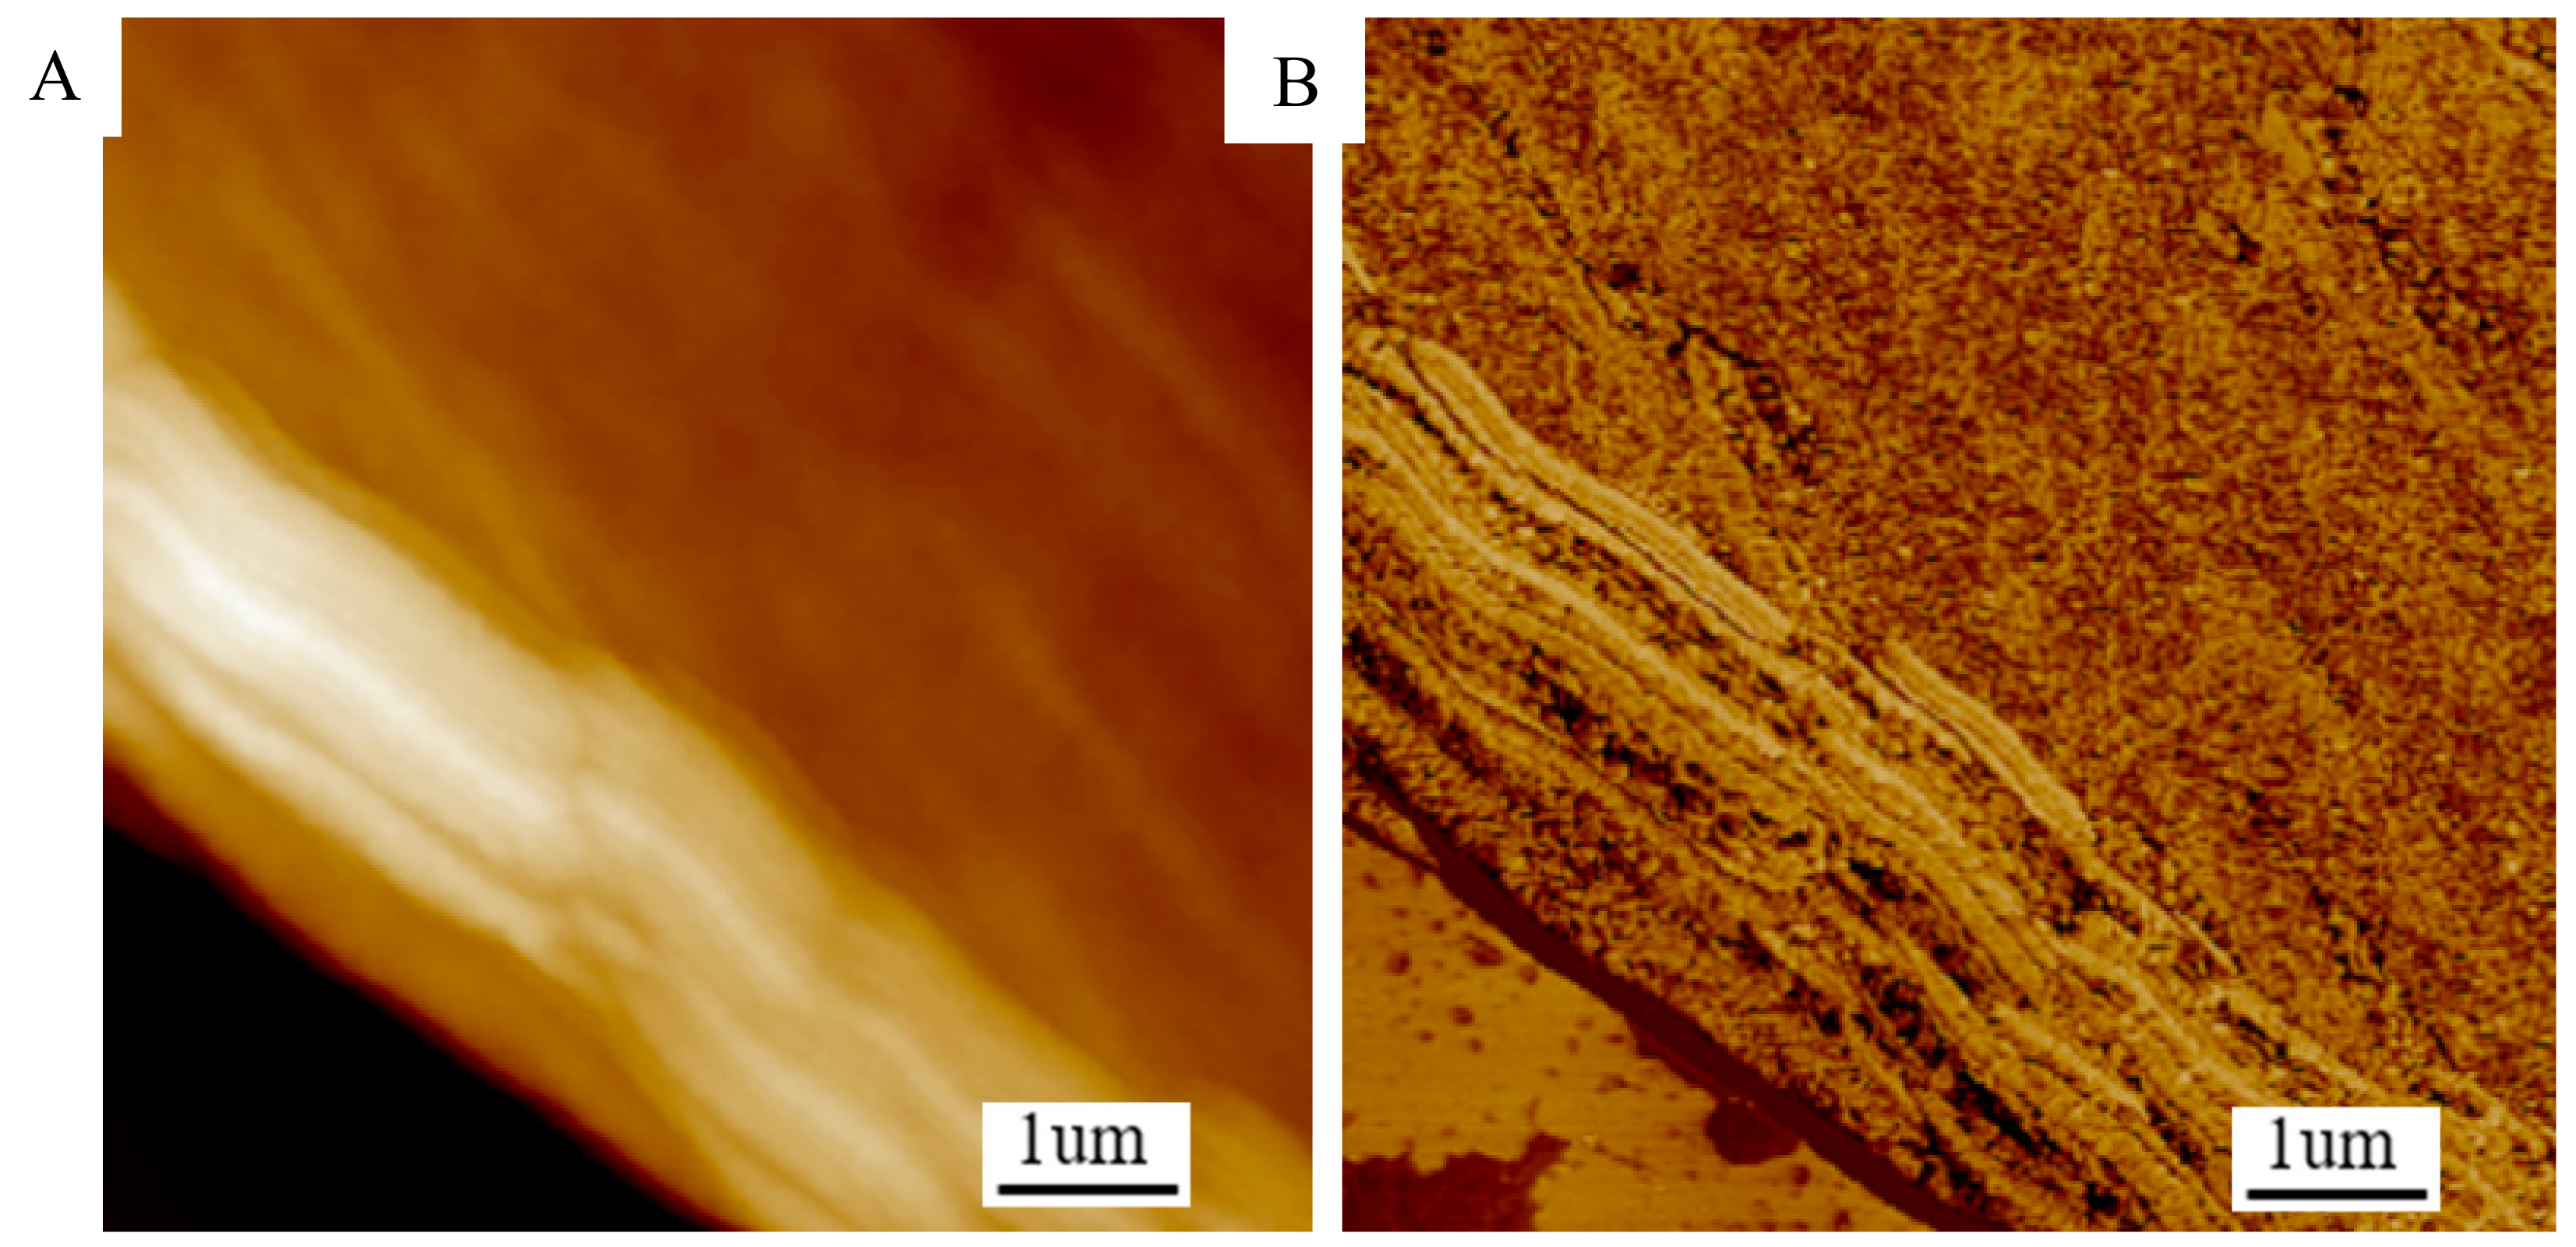
3.3. Microstructure of PCFs
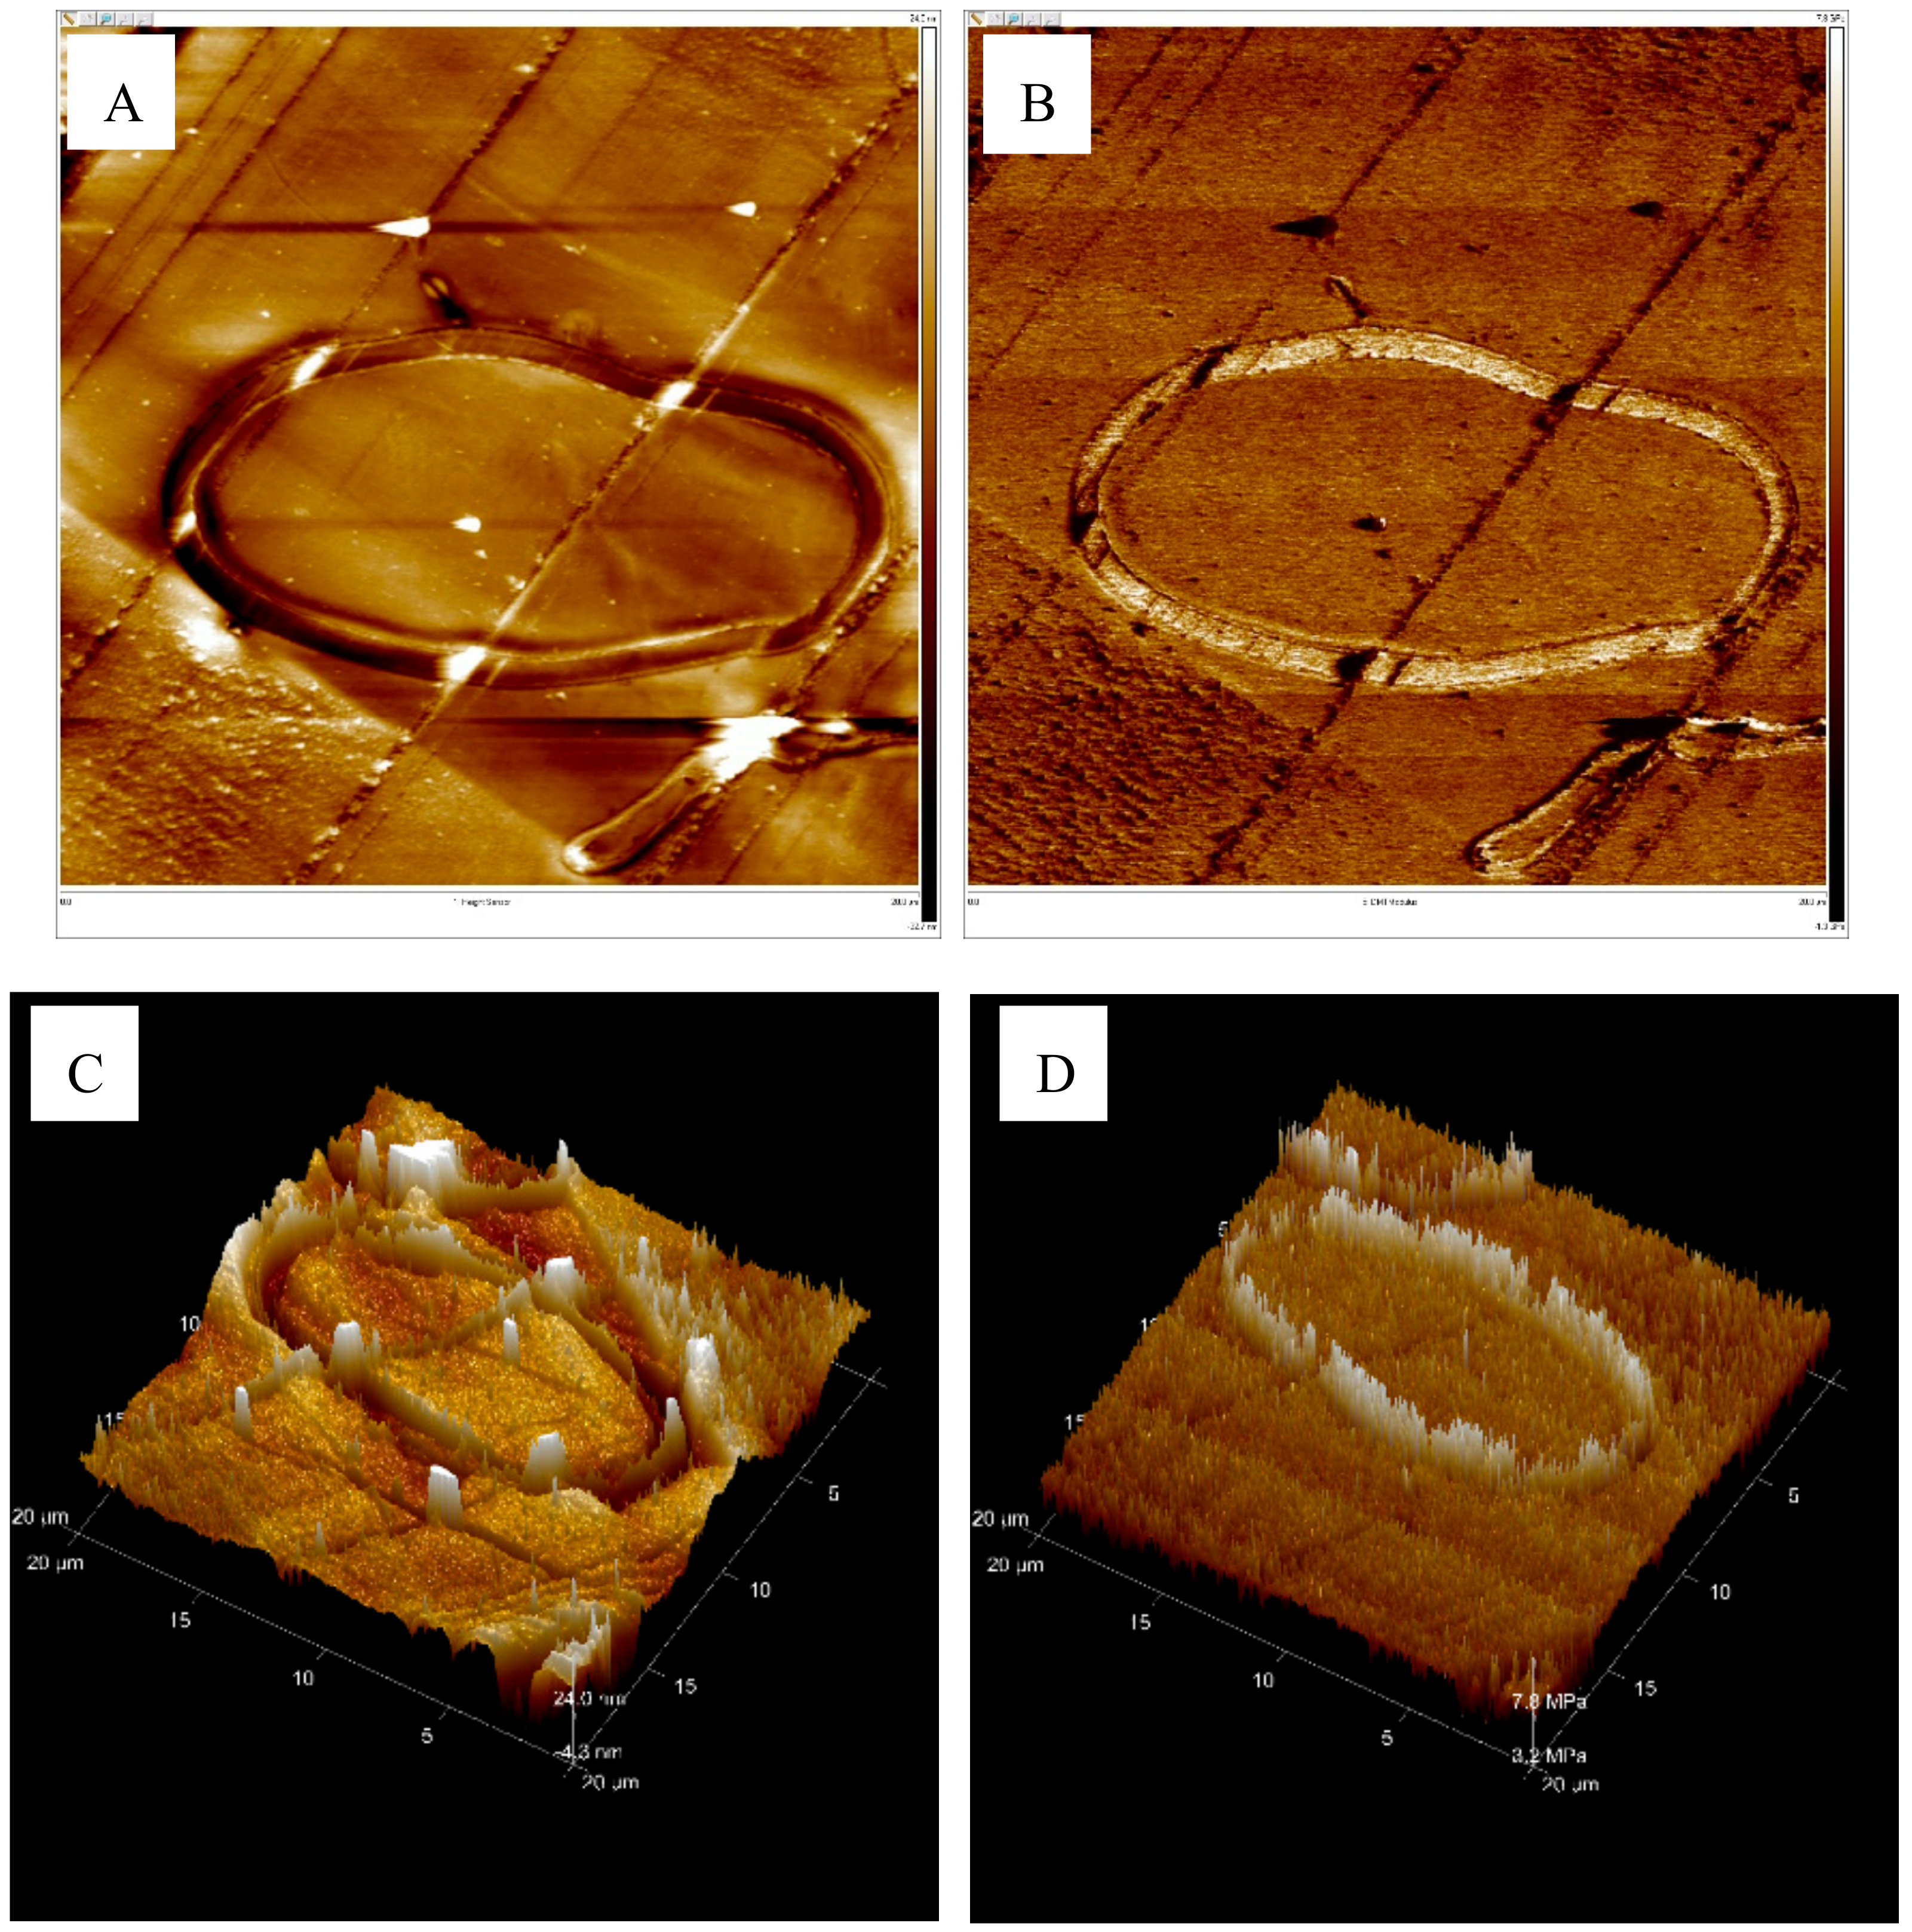
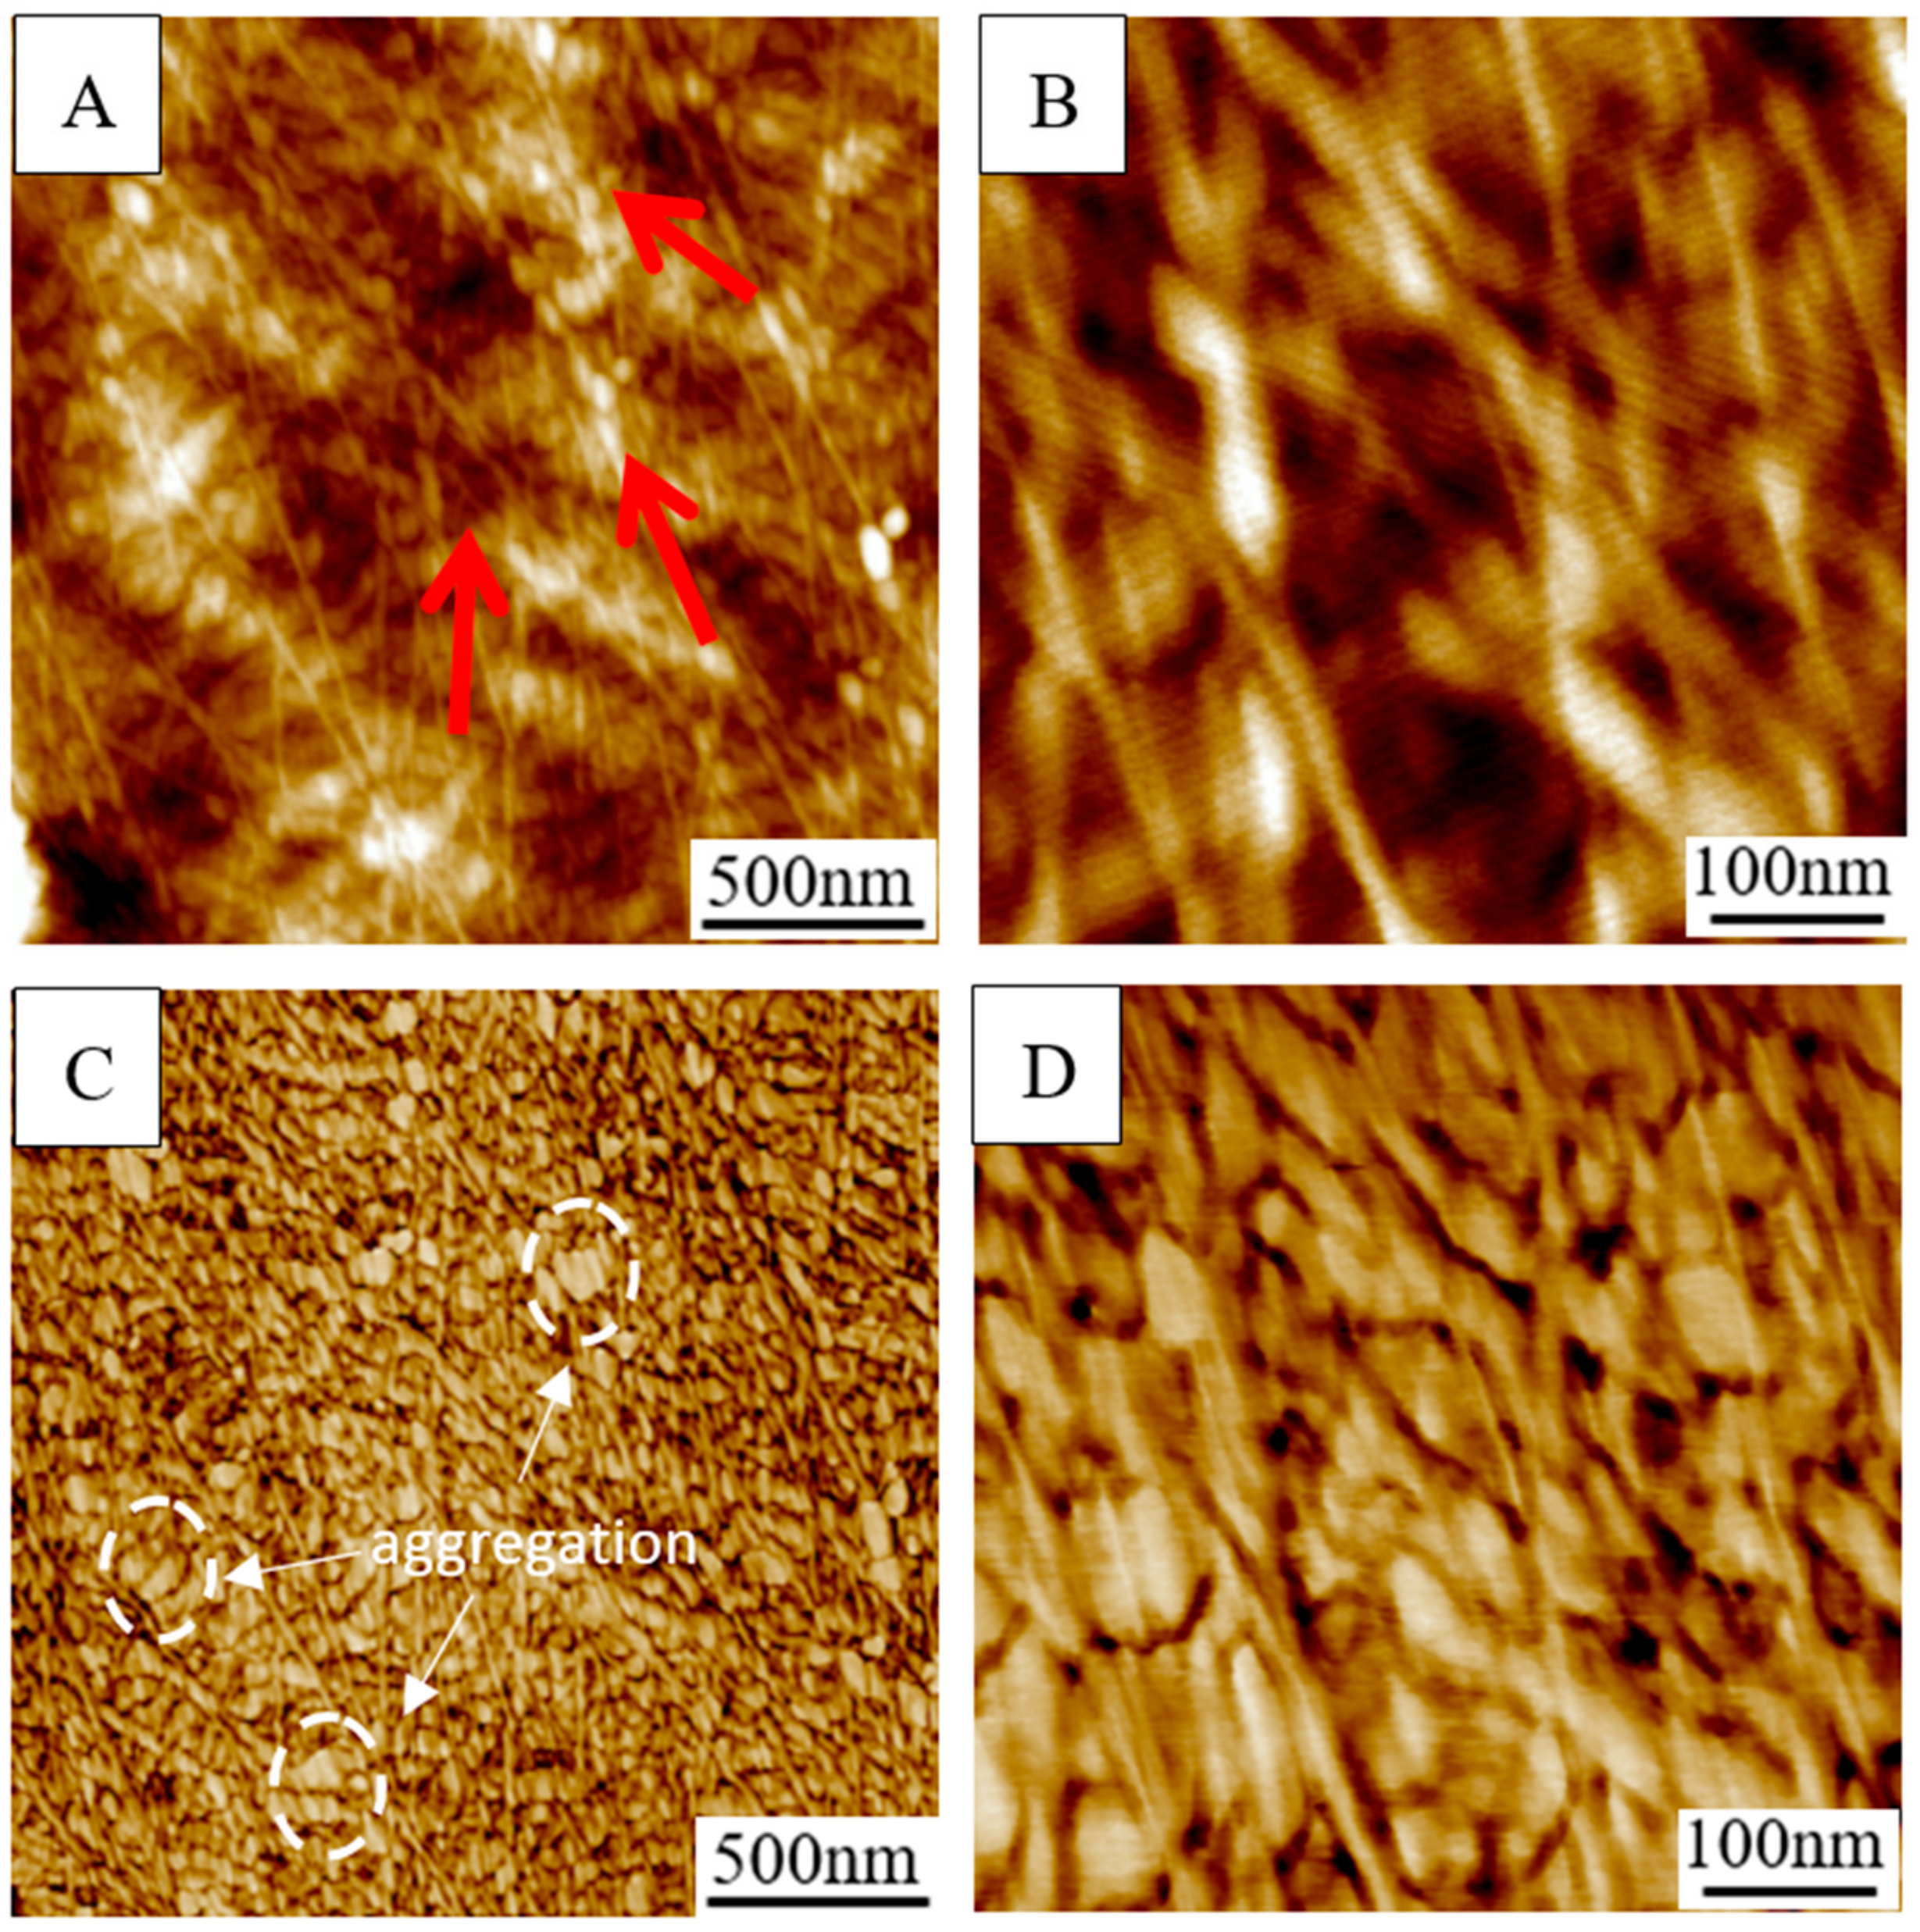
3.4. AFM Analysis
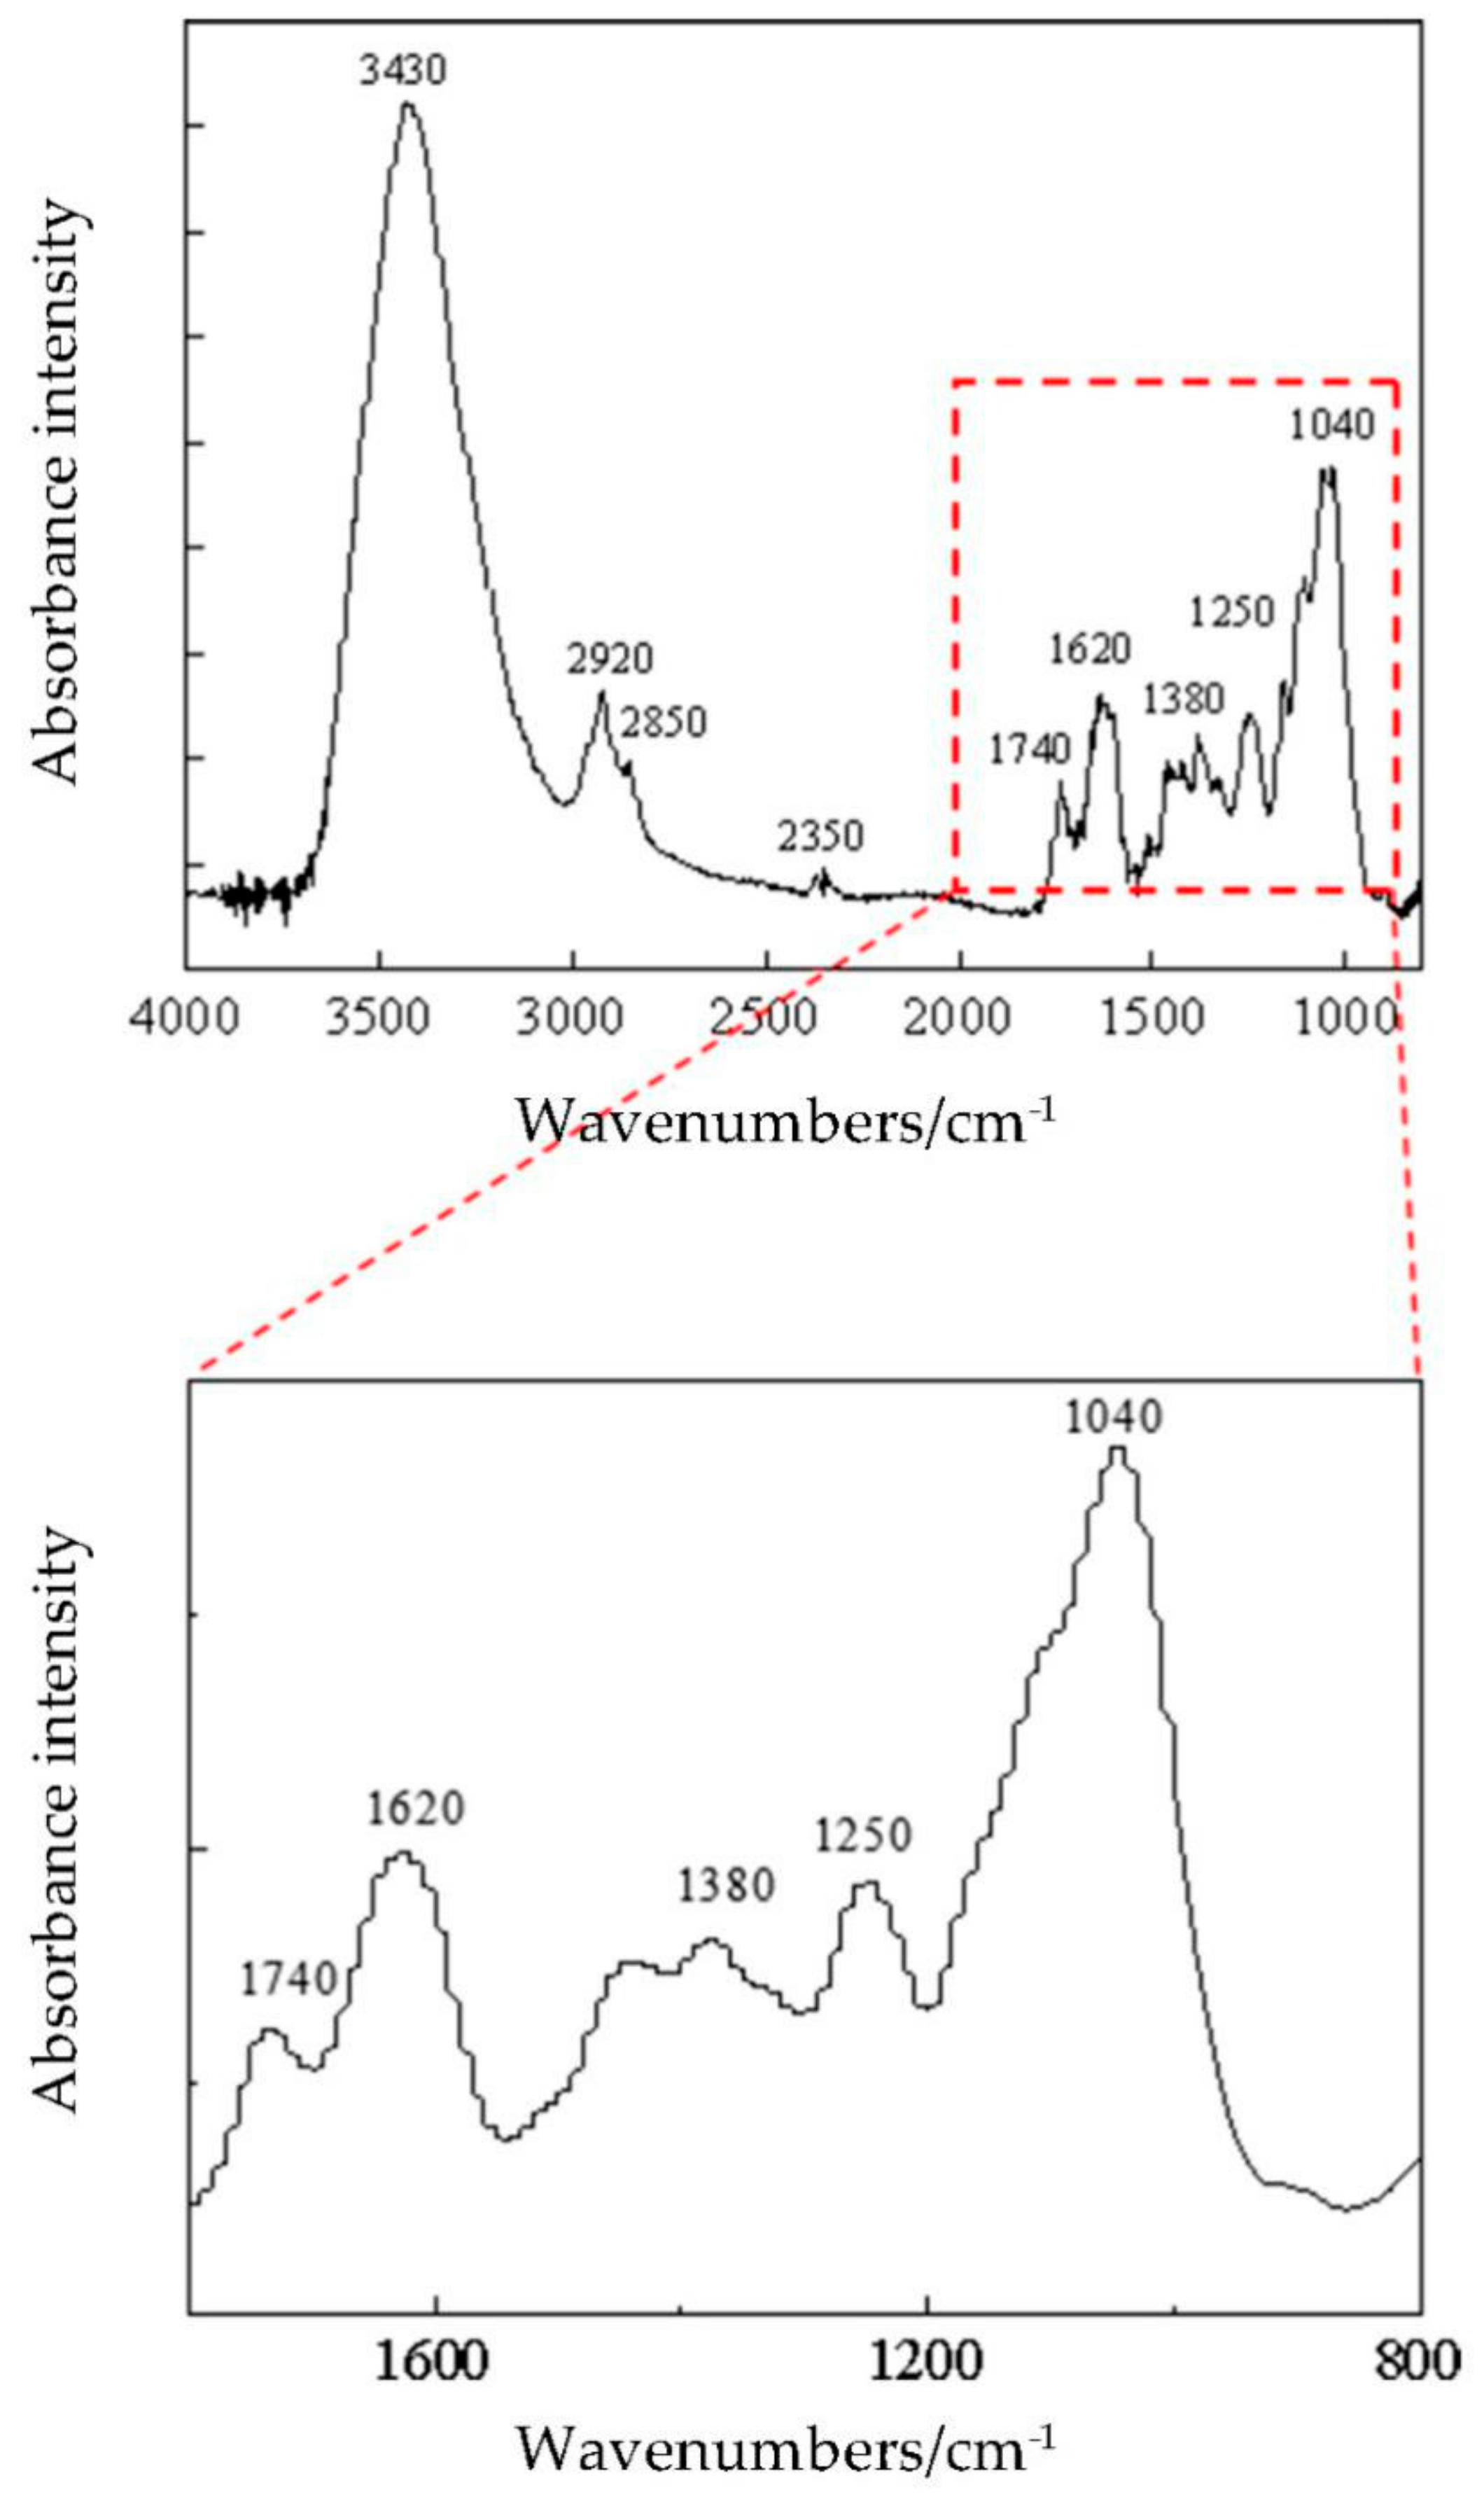
3.5. FT-IR Analysis
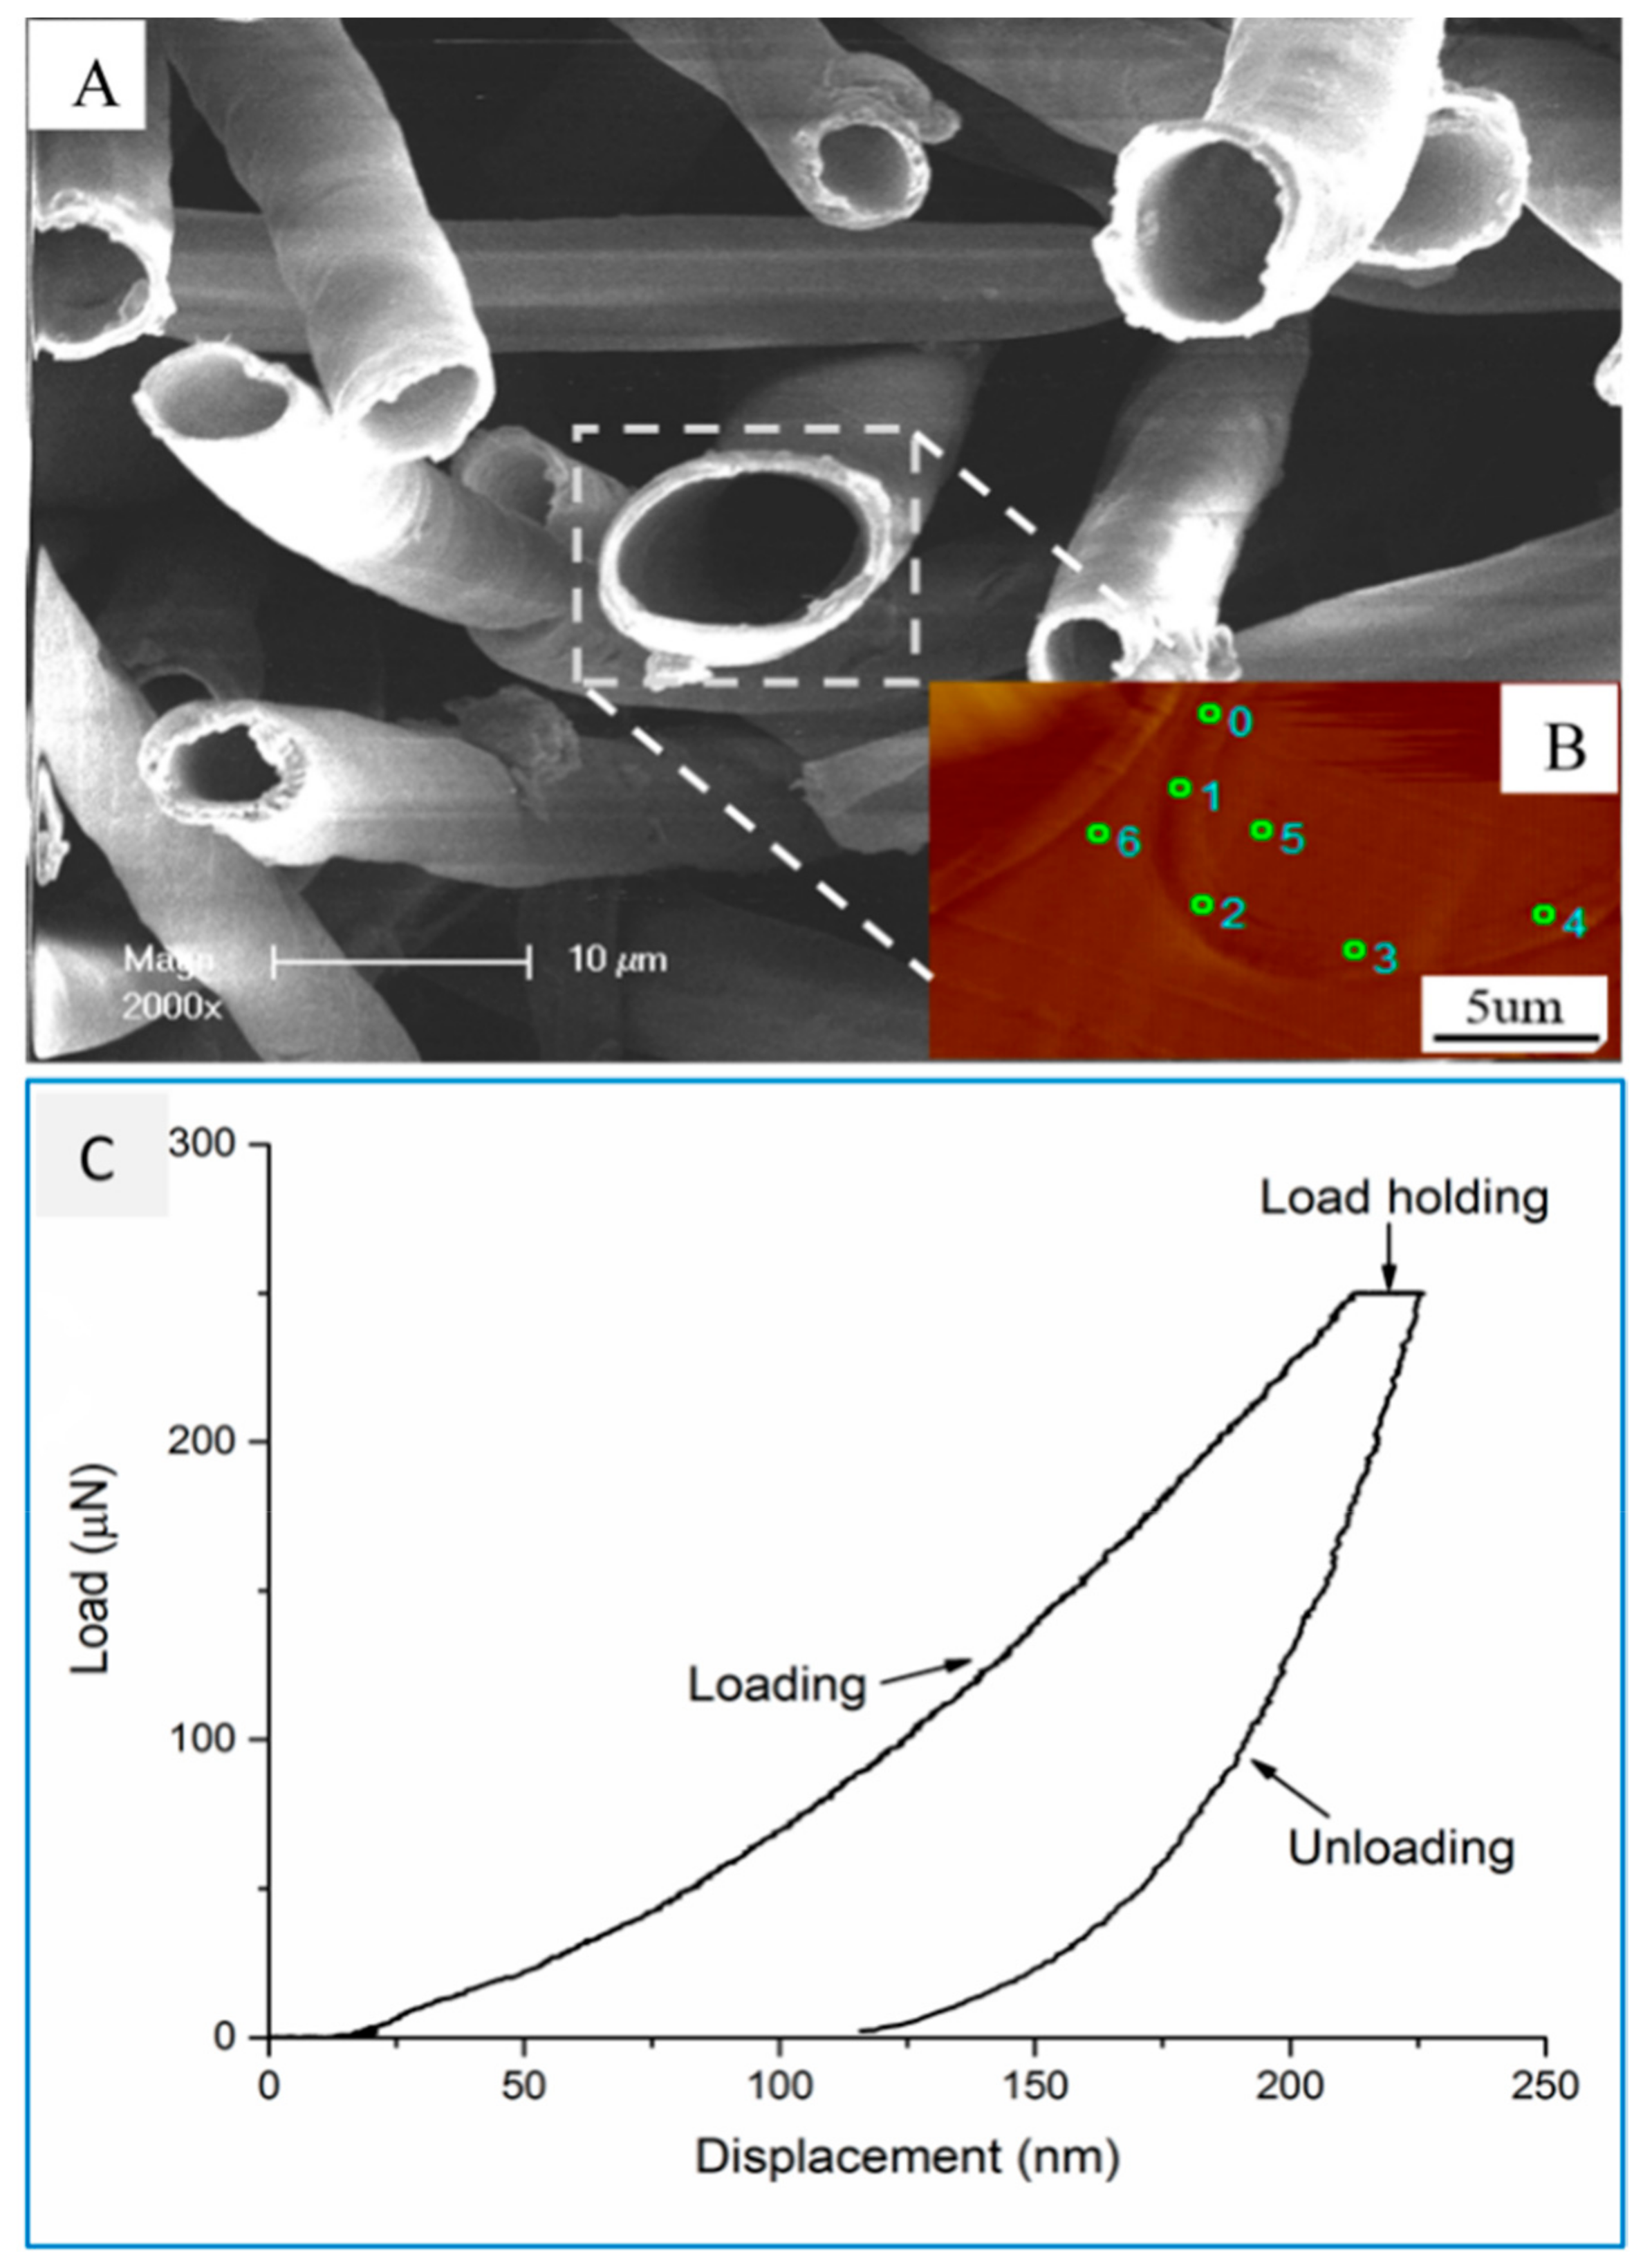
3.6. In Situ Nanoindentation
4. Conclusions
Author Contributions
Funding
Acknowledgments
Conflicts of Interest
References
- Kontturi, E.; Tammelin, T.; Oesterberg, M. Cellulose-model films and the fundamental approach. Chem. Soc. Rev. 2006, 35, 1287–1304. [Google Scholar] [CrossRef] [PubMed]
- Ye, D.Y.; Huang, H.H.; Fu, H.Q. Advances in cellulose chemistry. J. Chem. Eng. 2006, 57, 1782–1791. [Google Scholar]
- Chen, W.S.; Yu, H.P.; Lee, S.Y.; Wei, T.; Li, J.; Fan, Z. Nanocellulose: A promising nanomaterial for advanced electrochemical energy storage. R. Soc. Chem. 2018, 47, 2837–2872. [Google Scholar] [CrossRef] [PubMed]
- Siró, I.; Plackett, D. Microfibrillated cellulose and new nanocomposite materials: A review. Cellulose 2010, 17, 459–494. [Google Scholar] [CrossRef]
- Nogi, M.; Iwamoto, S.; Nakagaito, A.N.; Yano, H. Optically Transparent Nanofiber Paper. Adv. Mater. 2010, 21, 1595–1598. [Google Scholar] [CrossRef]
- Wang, X.; Zhan, T.Y.; Liu, Y.; Shi, J.T.; Pan, B.; Zhang, Y.L.; Cai, L.P.; Shi, S.Q. Large-scale transparent wood for energy-saving building applications. ChemSusChem 2018, 11, 4086–4093. [Google Scholar] [CrossRef]
- Minami, S.; Azuma, A. Various flying modes of wind-dispersal seeds. J. Theor. Biol. 2003, 225, 1–14. [Google Scholar] [CrossRef]
- Wu, F.; Zou, Y.M.; Long, S.H. Advances in plant cell wall research. Hunan Agric. Sci. 2010, 5, 14–16. [Google Scholar]
- Zhang, X.X.; Li, Z.Q.; Yu, Y.; Wang, H.K. Characterizations of poplar catkin fibers and their potential for enzymatic hydrolysis. J. Wood Sci. 2018, 64, 458–462. [Google Scholar] [CrossRef]
- Yin, C.Q.; Zhang, H.T. Morphological structure and application of poplar catkin fiber. Shandong Text. Econ. 2013, 37, 37–38. [Google Scholar]
- Cheng, X.; Hao, H.Q.; Peng, L. Progress in cellulose synthesis in plant cell walls. Acta Bot. Trop. 2011, 19, 283–290. [Google Scholar]
- Lu, Q.Q.; Liang, C.X. Composition of plant cell walls. World Biotechnol. 2016, 2, 302. [Google Scholar]
- Fei, B.H.; Zhang, B.; Yu, Y. Study on mechanical properties of masson pine fiber. Chinese J. Papermaking 2006, 4, 1–4. [Google Scholar]
- Wu, Y.; Wang, S.Q.; Zhou, D.G.; Xing, C.; Zhang, Y.; Pharr, G.M. Use of nanoindentation and SilviScan to determine the mechanical properties of ten hardwood species. Wood Fiber Sci. 2009, 44, 64–73. [Google Scholar]
- Yu, Y.; Jiang, Z.H.; Fei, B.H. Review on the mechanics of tracheid cell wall. For. Sci. 2003, 39, 133–139. [Google Scholar]
- Yu, Y.; Jiang, Z.H.; Ren, H.Q. Study on the influence factors of longitudinal zero distance tensile strength of needle tracheid. Chin. J. Papermak. 2007, 22, 72–76. [Google Scholar]
- Chen, H.; Tian, G.L.; Wu, Z.H.; Fei, B.H. Microfiber aggregates in pretreated bamboo fibers analyzed with Atomic Force Microscopy. Wood Fiber Sci. 2016, 48, 104–116. [Google Scholar]
- Chen, H.; Zhang, W.F.; Wang, H.K.; Wu, Y.; Zhong, T.H.; Fei, B.H. Effect of alkali treatment on wettability and thermal stability of individual bamboo fibers. J. Wood Sci. 2018, 24, 333–347. [Google Scholar] [CrossRef]
- Huang, C.X.; Ma, J.M.; Liang, C.; Li, X.; Yong, Q. Influence of sulfur dioxide-ethanol-water pretreatment on the physicochemical properties and enzymatic digestibility of bamboo residues. Bioresour. Technol. 2018, 263, 17–24. [Google Scholar] [CrossRef]
- Huang, C.X.; Tang, S.; Zhang, W.Y.; Tao, Y.H.; Lai, C.H.; Li, X.; Yong, Q. Unveiling the structural properties of lignin-carbohydrate complexes in bamboo residues and its functionality as antioxidants and immunostimulants. ACS Sustain. Chem. Eng. 2018, 6, 12522–12531. [Google Scholar] [CrossRef]
- Li, Z.Q.; Jiang, Z.H.; Fei, B.H.; Cai, Z.Y.; Pan, X.J. Comparison of bamboo green, timber and yellow in sulfite, sulfuric acid and sodium hydroxide pretreatments for enzymatic saccharification. Bioresour. Technol. 2014, 151, 91–99. [Google Scholar] [CrossRef] [PubMed]
- Ren, D.; Wang, H.K.; Yu, Z.X.; Wang, H.; Yu, Y. Mechanical imaging of bamboo fiber cell walls and their composites by means of peakforce quantitative nanomechanics (PQNM) technique. Holzforschung 2015, 69, 975–984. [Google Scholar] [CrossRef]
- Xiao, H. Structure and Properties of Woody Cotton Fibers and Theirs Oakage and Buoyancy Characteristics of Aggregates. Ph.D. Thesis, Shanghai Donghua University, Shanghai, China, 2005. [Google Scholar]
- Hao, Z.; Ying, S.; Xue, Z.; Pu, J.W. Efficient organic solvent system used to separate the cellulose and lignin of poplar. Int. J. Plant Res. 2014, 2, 1–4. [Google Scholar]
- Chen, H.; Tian, G.L.; Fei, B.H. Arrangement of Cellulose Microfibrils in Primary Cell Wall of Moso Bamboo Fiber Studied with AFM. Sci. Silvae Sin. 2014, 50, 90–94. [Google Scholar]
- Xiao, H. Basic structure and properties of kapok fiber. J. Text. 2005, 26, 4–6. [Google Scholar]
- Fernandes, A.N.; Thomas, L.H.; Altaner, C.M.; Callow, P.; Forsythd, V.T.; Apperley, D.C.; Kennedy, C.J.; Jarvish, M.C. Nanostructure of cellulose microfibrils in spruce wood. Proc. Natl. Acad. Sci. USA 2011, 108, 784–793. [Google Scholar] [CrossRef]
- Oliver, W.C.; Pharr, G.M. An improved technique for determining hardness and elastic modulus using load and displacement sensing indentation experiments. J. Mater. Res. 1992, 7, 1564–1583. [Google Scholar] [CrossRef]
- Salmén, L.; Burgert, I. Cell wall features with regard to mechanical performance. A review cost action E35 2004–2008: Wood machining-micromechanics and fracture. Holzforschung 2009, 63, 121–129. [Google Scholar]
- Burgert, I.; John, W.C. Dunlop micromechanics of cell wall smechanical integration of plant cells and plants. Signal. Commun. Plants 2011, 9, 7–52. [Google Scholar]
- Himmel, M.E.; Ding, S.Y.; Johnson, D.K.; Adney, W.S.; Nimlos, M.R.; Brady, J.W.; Foust, T.D. Biomass recalcitrance: Engineering plants and enzymes for biofuels production. Science 2007, 315, 804–807. [Google Scholar] [CrossRef]
- TAPPI standard T222 om-98. In Acid-Insoluble Lignin in Wood and Pulp; Technical Association of the Pulp and Paper Industry: Atlanta, GA, USA, 1998.
- Woodward, J.; Hayes, M.K.; Lee, N.E. Hydrolysis of cellulose by saturating and non-saturating concentrations of cellulase-implications for synergism. Nat. Biotechnol. 1988, 6, 301–304. [Google Scholar] [CrossRef]
- ASTM D1926-2000. In Standard Test Methods for Carboxyl Content of Cellulose; ASTM International: West Conshohocken, PA, USA, 2011.
- ASTM D4988-96. In Standard Test Method for Determination of Alkalinity of Paper as Calcium Carbonate (Alkaline Reserve of Paper); ASTM International: West Conshohocken, PA, USA, 2001.
- Rengasamy, R.S.; Das, D.; Karan, C.P. Study of oil sorption behavior of filled and structured fiber assemblies made from polypropylene, kapok and milkweed fibers. J. Hazard. Mater. 2011, 186, 526–532. [Google Scholar] [CrossRef] [PubMed]
- Yuan, S.S. Preparation and Properties of Cotton Pulp Nano-Cellulose Blend Membrane. Ph.D. Thesis, Qingdao University of Science and Technology, Qingdao, China, 2016. [Google Scholar]
- Schwanningera, M.; Rodriguesc, J.C.; Pereira, H.N. Nanocellulose: A promising nanomaterial for advanced electrochemical energy storage. Effects of short-time vibratory ball milling on the shape of FT-IR spectra of wood and cellulose. Vib. Spectrosc. 2004, 36, 23–40. [Google Scholar] [CrossRef]
- Segal, L.; Creely, J.J.; Martin, A.E. An empirical method for estimating the degree of crystallinity of native cellulose using the X-Ray diffractometer. Text. Res. J. 1959, 29, 786–794. [Google Scholar] [CrossRef]
- Jiang, Z.H.; Yu, W.J.; Yu, Y.L. Chemical composition Analysis and Surface performance characterization of Bamboo. J. Northeast For. Univ. 2006, 34, 1–2,6. [Google Scholar]
- Qiu, J.; Du, G.B.; Bao, K.Y. Studies on chemical constituents and fiber Morphology of artificial cultivated wood. J. Southwest For. Univ. 2003, 23, 81–83. [Google Scholar]
- Higuchi, T. Chemistry and biochemistry of bamboo. Bamboo J. 1987, 4, 132–145. [Google Scholar]
- Wang, Y.P.; Gao, X.S. Comparison of structure and Properties between Natural Bamboo Fiber and Bamboo Pulp Viscose Fiber. Plant Fibers Prod. 2006, 28, 97–100. [Google Scholar]
- Yu, Y.; Fei, B.H.; Zhang, B. Evaluation of wood tracheid longitudinal by zero-span stretching technique tensile strength. For. Sci. 2006, 42, 83–86. [Google Scholar]
- Wang, X.; Chen, X.; Xie, X.; Cai, S.; Yuan, Z.; Li, Y. Multi-scale evaluation of the effect of phenol formaldehyde resin impregnation on the dimensional stability and mechanical properties of Pinus Massoniana Lamb. Forests 2019, 10, 646. [Google Scholar] [CrossRef]
- Wang, X.; Wang, S.; Xie, X.; Zhao, L.; Deng, Y.; Li, Y. Multi-scale evaluation of the effects of nanoclay on the mechanical properties of wood/phenol formaldehyde bondlines. Int. J. Adhes. Adhes. 2017, 74, 92–99. [Google Scholar] [CrossRef]
- Wang, X.; Deng, Y.; Wang, S.; Liao, C.; Meng, Y.; Pham, T. Nanoscale Characterization of Reed Stalk Fiber Cell Walls. Bioresources 2013, 8, 1986–1996. [Google Scholar] [CrossRef]
- Wang, X.; Li, Y.; Deng, Y.; Yu, W.; Xie, X.; Wang, S. Contributions of the basic chemical components to the mechanical behaviour of wood fiber cell walls evaluated by nanoindentation. BioResources 2016, 11, 6026–6039. [Google Scholar] [CrossRef]
- Huang, C.; Wang, X.; Liang, C.; Jiang, X.; Yang, G.; Xu, J.; Yong, Q. A sustainable process for procuring biologically active fractions of high-purity xylooligosaccharides and water-soluble lignin from Moso bamboo prehydrolyzate. Biotechnol. Biofuels 2019, 12, 189. [Google Scholar] [CrossRef]
- Huang, C.; Sun, R.; Chang, H.M.; Yong, Q.; Jameel, H.; Phillips, R. Production of Dissolving Grade Pulp from Tobacco Stalk Through SO2-ethanol-water Fractionation, Alkaline Extraction, and Bleaching Processes. BioResources 2019, 14, 5544–5558. [Google Scholar]
- Yan, X.; Wang, L.; Qian, X. Effect of High-Temperature Calcined Wheat Straw Powder after Lignin Removal on Properties of Waterborne Wood Coatings. Coatings 2019, 9, 444. [Google Scholar] [CrossRef]


© 2019 by the authors. Licensee MDPI, Basel, Switzerland. This article is an open access article distributed under the terms and conditions of the Creative Commons Attribution (CC BY) license (http://creativecommons.org/licenses/by/4.0/).
Share and Cite
Wu, Y.; Wu, X.; Shi, T.; Chen, H.; Wang, H.; Sun, M.; Zhang, J. The Microstructure and Mechanical Properties of Poplar Catkin Fibers Evaluated by Atomic Force Microscope (AFM) and Nanoindentation. Forests 2019, 10, 938. https://doi.org/10.3390/f10110938
Wu Y, Wu X, Shi T, Chen H, Wang H, Sun M, Zhang J. The Microstructure and Mechanical Properties of Poplar Catkin Fibers Evaluated by Atomic Force Microscope (AFM) and Nanoindentation. Forests. 2019; 10(11):938. https://doi.org/10.3390/f10110938
Chicago/Turabian StyleWu, Yan, Xinyu Wu, Tianlin Shi, Hong Chen, Hankun Wang, Meng Sun, and Jilei Zhang. 2019. "The Microstructure and Mechanical Properties of Poplar Catkin Fibers Evaluated by Atomic Force Microscope (AFM) and Nanoindentation" Forests 10, no. 11: 938. https://doi.org/10.3390/f10110938