Article

Salinity Tolerance in Fraxinus angustifolia Vahl.: Seed Emergence in Field and Germination Trials

DAGRI—Department of Agricultural, Food and Forestry Systems, University of Florence, Via San Bonaventura, 13, 50145 Firenze, Italy
*
Author to whom correspondence should be addressed.
Forests 2019, 10(11), 940; https://doi.org/10.3390/f10110940
Submission received: 26 September 2019 / Revised: 18 October 2019 / Accepted: 21 October 2019 / Published: 23 October 2019
(This article belongs to the Special Issue Responses of Trees to Pollutants)

Abstract

:
The effect of salinity on seed germination/emergence in narrow-leaved ash (Fraxinus angustifolia) was studied both under field and laboratory conditions, in order to detect critical values to NaCl exposure. Research Highlights: Novel statistical methods in germination ecology has been applied (i) to determine the effects of chilling length and salinity (up to 150 mM NaCl) on Fraxinus angustifolia subsp. oxycarpa seed emergence, and (ii) to estimate threshold limits treating germination response to salinity as a biomarker. Background and Objectives: Salinity cut values at germination stage had relevant interest for conservation and restoration aims of Mediterranean floodplain forests in coastal areas subjected to salt spray exposure and/or saline water introgression. Results: Salinity linearly decreased germination/emergence both in the field and laboratory tests. Absence of germination was observed at 60 mM NaCl in the field (70–84 mM NaCl depending on interpolation model) and at 150 mM NaCl for 4-week (but not for 24-week) chilling. At 50 mM NaCl, germination percentage was 50% (or 80%) of control for 4-week (or 24-week) chilling. Critical values for salinity were estimated between freshwater and 50 (75) mM NaCl for 4-week (24-week) chilling by Bayesian analysis. After 7-week freshwater recovery, critical cut-off values included all tested salinity levels up to 150 mM NaCl, indicating a marked resumption of seedling emergence. Conclusions: Fraxinus angustifolia is able to germinate at low salinity and to tolerate temporarily moderate salinity conditions for about two months. Prolonged chilling widened salinity tolerance.

1. Introduction

Fraxinus angustifolia Vahl. (narrow-leaved ash) is a typical tree of hygrophilous mixed-hardwood forests of seasonally inundated wetlands along rivers and alluvial plains [1,2]. This tree species has been usefully employed in remediation [3,4] and urban greening programs [5,6,7] for its high ability to resist waterlogging [8], adverse conditions of soil contamination and for its moderate tolerance to salinity at seedling and tree stage [9,10,11], but nevertheless, in our knowledge, information on seed germination behavior under salinity conditions is still lacking.
Floodplain ashwoods are included in ″interest″ (Habitat 91F0—Riparian mixed forests along the great rivers) or ″priority″ (Habitat 91E0*—Alluvial forests) Natura 2000 lists under the European Union (EU) Habitats Directive (Annex I 92/43/EEC [12]), both relevant for conservation of vulnerable temporary water ecosystems in Mediterranean basin [13,14]. In this region and despite conservation efforts, contraction and degradation risk of wetlands and swamps are still ongoing processes, accounting more than 50% loss since 1900, with 10% decrease in recent times, from 1975 to 2005 [15,16,17,18]. In Europe, salinization affects 3.8 million ha [19,20], with a particularly severe wide spread of soil salinity along the coastlines, particularly in the Mediterranean [21], where further decline was projected for the mid- (2050) and late (2100) century [22]. The global conservation awareness for these ecosystems—which nowadays resulted in a protected status under the international biodiversity-related multilateral environmental agreements [23] for more than one third of swamps, flooded forests and coastal wetlands—might not be sufficient to prevent degradation risks arisen from interactions with large-scale processes, land-use changes and agricultural land-use intensification. Consequently, undertaking practice and policy actions to prevent wetland degradation and loss remains a focus of international processes, such as the Convention on Biological Diversity (CBD) Aichi Targets and the United Nations (UN) Sustainable Development Goals (SDGs). In coastal floodplains, human pressure, altered water flows, contaminants from internal urban and agricultural lands, and increased soil salinity [24,25,26] were particularly relevant, and science-based management options should be urgent [27] to face adverse climate-related impacts exacerbated by increasing human-induced pressures [28,29,30].
F. angustifolia coastal alluvial forests were mainly judged under ′unfavorable′ (habitat 91F0) or ′inadeguate′ (habitat 91E0*) states, following the 2007–2012 EU Habitat Directive Art. 17 assessment [31]. The major threats to this species were currently considered to be high fragmentation with connectivity loss among sites [32,33], potential susceptibility to diseases (e.g., ash dieback by Hymenoscyphus fraxineus [34]), changes in water regime, availability and quality due to pollution, salinity [35,36] and saltwater intrusion [20]. In ash species, the effect of salinity could also be increased by the interaction with several other environmental conditions, such as radiation [37], drought [38] and waterlogging [39].
As ensuring natural regeneration of mixed-species forests is a highly recommended silvicultural practice for the management of ecologically ′natural′ forests [40] also in marginal environments [41], this paper was aimed at evaluating seed germination/emergence under increasing salinity conditions (in field and laboratory), to estimate NaCl tolerance threshold values at this life stage in F. angustifolia. Moreover, novel statistical methods for germination ecology (based on survival analysis and hierarchical Bayesian analysis) have been applied to infer cut off values for salinity threshold.

2. Materials and Methods

2.1. Germination in Natural Environment

Within the coastal hygrophilous mixed-hardwood forest (43.69° N, 10.29° E; Natural Reserve “Lame di fuori”—a complex of 655 ha of swamps and marshes [42,43,44,45] in San Rossore Park, Tuscany, Italy), three sites were sampled at different distances from the seaside, which differed in soil salinity (Table 1). Sampled sites were dominated by F. angustifolia subsp. oxycarpa both in number (ntree = 54) and basal area (BA = 71%), associated with field elm (Ulmus minor, ntree = 38%; BA = 25%), black alder (Alnus glutinosa, ntree = 1%, BA = 2%), common hawthorn and common pear (together, ntree = 7%, BA = 1%). Average (±SD, standard deviation) for forest stand traits were: 18 (±1) m dominant height, 18 (±1) cm breast tree diameter, 51 (±1) years of age, 1104 (±267) trees ha−1 and 35 (±7) m2 ha−1 basal area. Narrow-leaved ash seedlings at cotiledon stage were counted at the end of June 2013 within 3 randomly placed (origin and direction) transects (40 m × 1 m) per site, not crossing each other. Ten soil cores per transect (0–20 cm, litter layer removed, spaced every 4 m) were sampled, air-dried and 2 mm sieved before laboratory analysis at 25 °C. Soil salinity determined by ECe (electrical conductivity of soil saturation extract [46]), then NaCl concentration derived by N a C l m M = 9.5 × E C e d S / m 1.1327 calibration equation. Soil samples had a sandy texture and pH (soil:water, 1:5 [47]) of 6.7 (coefficient of variation, CV = 10%).
All statistical analyses were performed in R environment [48]. Normality of data distribution was tested (Shapiro-Wilk W-test [49] by shapiro.test() R function [50]). As most of the variables were not normally distributed, comparisons among groups were performed by non-parametric Wilcoxon rank-sum test by the wilcox.test() R function [51], while mean, standard error (SE) and 95% confidence interval range (95% CI) were calculated by bootstrapping applying boot.ci() function in ′boot′ R package [52] along with the adjusted bootstrap percentile (BCa) method [53].

2.2. Germination Trials

A bulk of narrow-leaved ash samaras from San Rossore Park was tested for seed vitality by the TZ (tetrazolium) test [54,55]. Embryo development was assessed by embryo length to seed length ratio (E:S ratio) on 50 seeds. Samaras (intact pericarp) were manually graded to remove aborted seeds or empty samaras, soaked in water overnight, then moist-stratified at 4 °C (chilling effect, C) for four (C4) or 24 (C24) weeks. Germination took place at 15 °C/25 °C (16 h dark/ 8 h light) for a period of 8 weeks, testing a range of salinity up to 150 mM NaCl (nacl effect, Nx where x is NaCl in mM). Freshwater (control, N1) had naturally dissolved 1 mM NaCl together with other cations (1.5 mM Ca2+, 0.5 mM Mg2+ and 0.1 mM K+). The salinity levels were obtained by adding NaCl to freshwater up to the concentration (in mM) indicated by Nx subscript, that is N10, N50 and N150 for 4-week chilling (C4) and N50, N75, N100 and N150 for 24-week chilling (C24), respectively. About 200 samaras per treatment (224) were distributed in 8 germination boxes (Ø = 15 cm [56]). Germination was assessed weekly as ′visible germination′ (i.e., radicle protrusion > 1 cm [57]). At the end of the germination test, C4 samaras underwent a recovery germination test; samaras were rinsed three times for 10 min in flowing water, placed in N1, then followed for further 7 weeks.

2.3. Statistical Analysis

Seed germination was assessed by survival analysis [58], where the response in terms of germination was defined as time-to-event [59,60]. Respect to the classic approach of calculating germination capacity and other germination indexes, this method offered the advantage of a proper statistical handling for time-repeated measures (namely the weekly counts of germinated seeds) together with an evaluation of treatment effects over the entire trial period [61]. An event was defined as the change from ungerminated (value = 0) to germinated status (value = 1); only viable seeds (assessed by cut test) were included in the counts. For each samara, the response variable T ′time until an event occurred′ was counted in weeks since the beginning of the trial (germination- or recovery-test, respectively). The probability of germination per unit of time, f t , was calculated by T probability density function (PDF); while the probability of changing status (germinating) within time t   T t , F t ,   was given by the cumulative distribution function (CDF). Here, the survival function, S t = 1   F t , returned the probability of not germinating within time t , that is the probability that a seed had to remain in its original (ungerminated) state for a time longer than t   ( T > t ) .
The hazard rate of germinating, h , was defined as the probability that an ungerminated seed (until the beginning of a time interval) had to germinate in the successive time interval (i.e., the conditional rate of germinating). It followed that the hazard function, h t = f t / S t , returned the rate at which events occur for those seeds, that have not yet germinated at time t . The integral of h t over time gave the cumulative hazard rate function, H t ; the accumulated risk that a seed would face up to time t . Non-parametric methods were used for estimating both survival function S ^ t (Kaplan and Meier method, KM [62]) and cumulative hazard rate function H ^ t (Nelson–Aalen method, NA [63,64,65]). These non-parametric estimators did not assume any underlying distribution and they returned non-parametric maximum likelihood estimators (NPMLE) for survival and hazard functions, respectively, in right-censored data [66]. A 95% confidence interval (CI) for S ^ t was obtained by minimizing the likelihood function [67] within ′km.ci′ R package [68], then it was derived for H ^ t by log   S ^ t of 95% CI values. Hazard ratio (HR) could be interpreted as a relative measure of effects, as it compared survival between two treatments by S 0 t = S 1 t H R , where S 0 and S 1 are the survival probabilities in control and in an alternative treatment, respectively. Therefore, HR = 1 indicated no difference between treatments; HR values greater (or lower) than 1 indicated a higher (or lower) hazard of germinating in the control respect to the alternative treatment [69,70].
Chilling, salinity and their interaction effects on germination were tested by semi-parametric Cox proportional hazards regression model (Cox PH [71]), applying coxph() function in ′survival′ R package [72]. The Cox PH model had no assumption about the shape of the hazard function, but it assumed proportional hazards rates among treatments, no time change in tested variables, lack of influential observations and linearity. Assumptions were verified by plotting scaled Schoenfeld residuals [73] against time [74]. The significance of model terms (nacl, chilling, nacl × chilling) was assessed by Wald test; differences among treatment levels were compared by Peto-Peto-Prentice ggeneralized Wilcoxon test—this latter did not require a consistent hazard ratio over time, but only that H t curves did not cross [60].
Backward stepwise regression using drop1() R function and likelihood ratio (LRT) were used for model reduction. Differences in goodness of fit for each model were then performed by log-likelihood, Akaike information criterion (AIC) and Bayesian information criterion (BIC), using logLik() and stepAIC() functions in ′MASS′ R package, respectively [75]. In order to select the best model (most parsimonious; the simpler model with a high explanatory predictive power), the lowest (with difference exceeding 2) AIC (or BIC) and the highest likelihood values (LLV) were used. Cut off values for salinity in germination trials were determined fitting biomarker threshold models by ′bhm′ R package version 1.15 [76,77], treating germination/emergence response to salinity (nacl levels) as a biomarker. The aim of this hierarchical Bayesian method was to identify within the dataset a range of salinity (and its credible intervals), which were most likely to give a similar response to the best treatment in terms of germination probability. Variance inflaction factor (VIF = 1/(1−r2adj) was calculated to detect multi-collinearity amongst the predictor variables. VIF lower bound of 1 indicated no relationship between predictors; for VIF values till 2.5 collinearity was not an issue, becoming of concern above 2.5 (or 5) [69,70].

3. Results

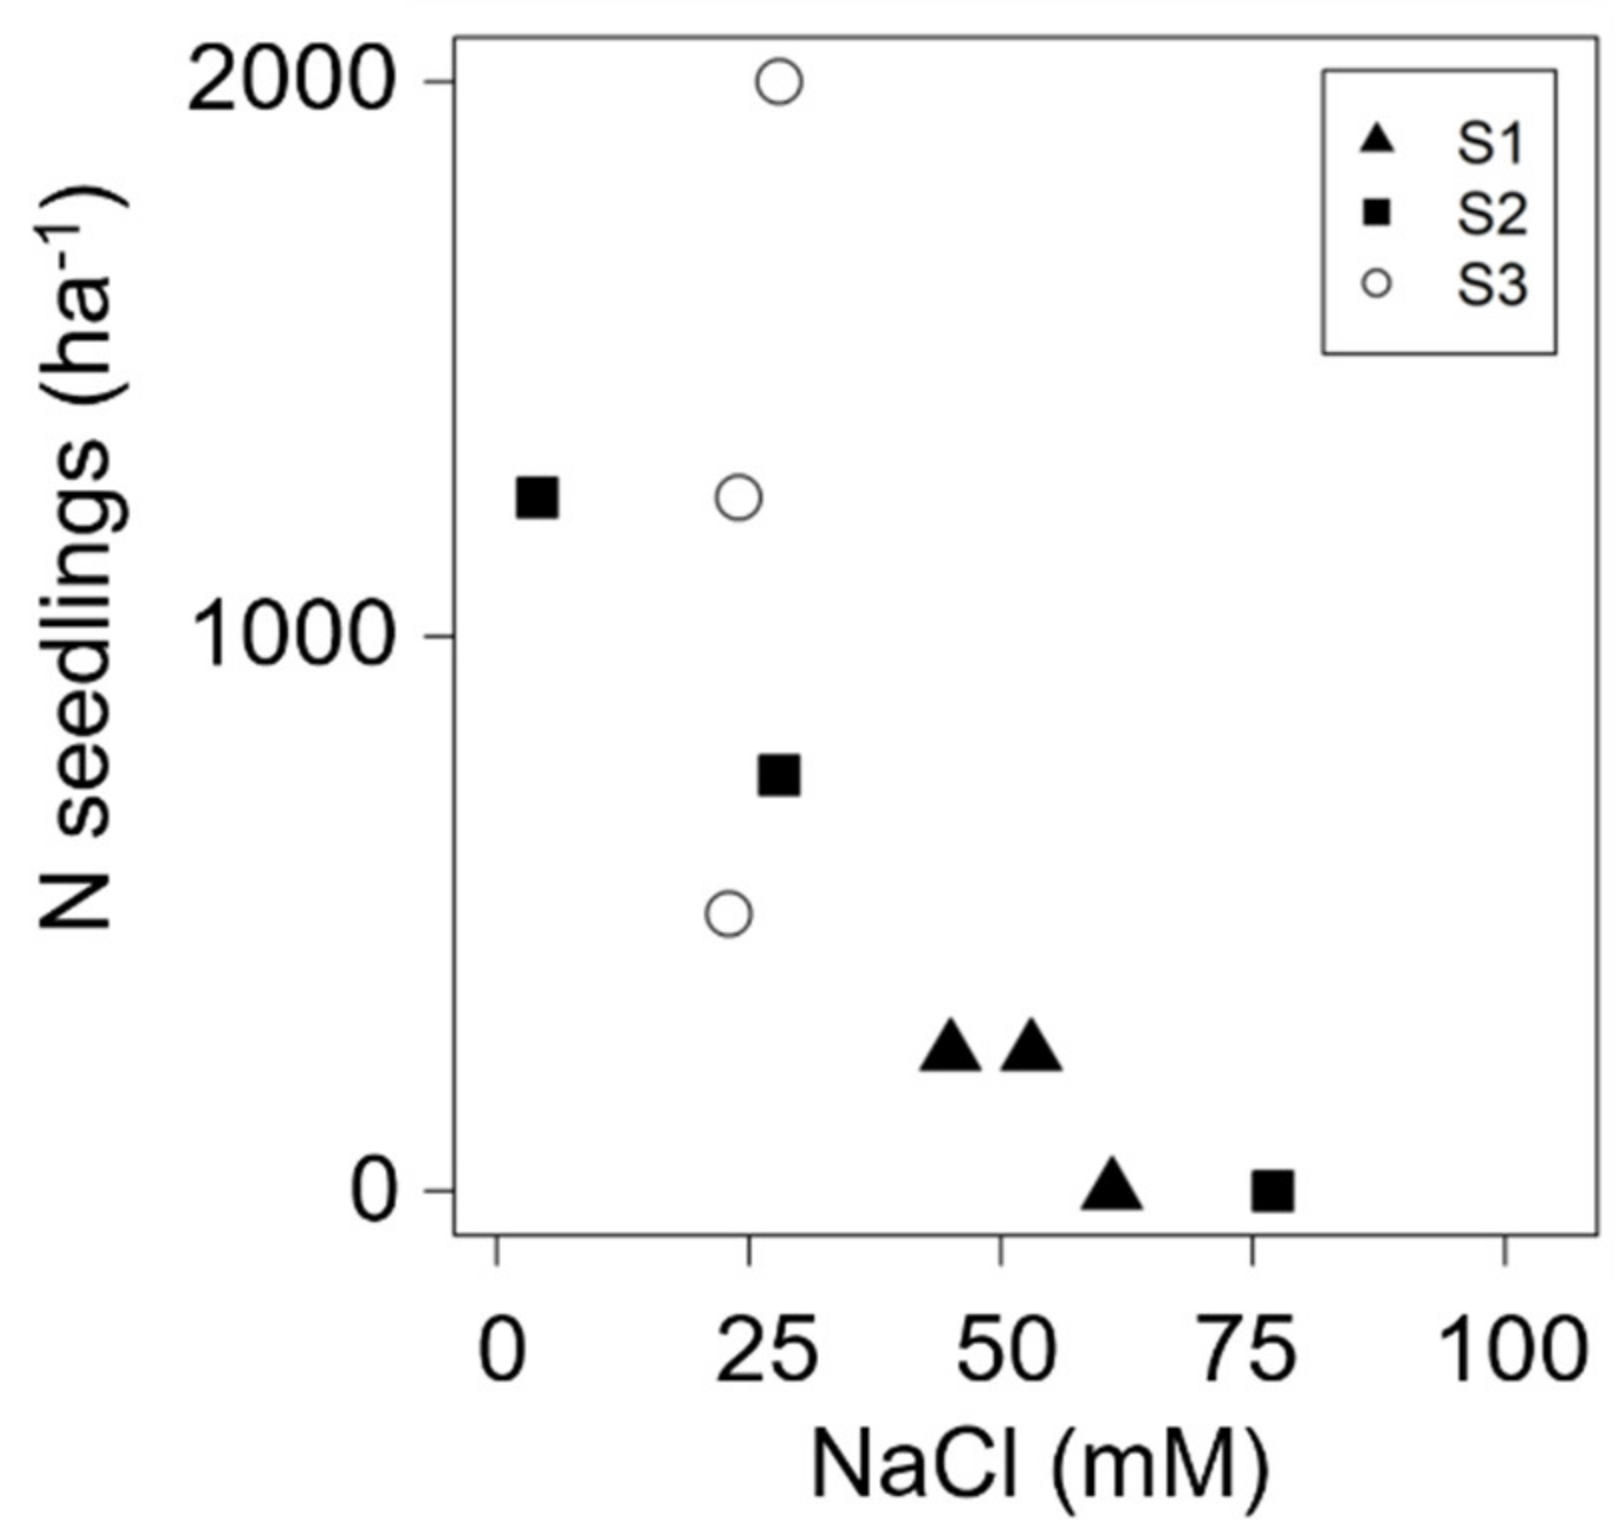
3.1. Seed Germination in Natural Environment

Soil salinity had an average ECe of 4.1 (±0.3 SE) dS m−1 and 40 (±2.4 SE) mM NaCl with a wide variability in S1 and S2 sites, both including values higher than 10 dS m−1 (Table 1). In transects, newly germinated seedlings were found up to 53 mM NaCl soil salinity, and no seedling was found above 60 mM NaCl. The relationship between seedling density and soil salinity could be explained by linear ( r a d j   2 = 0.466, p < 0.026, n transects = 9) or exponential ( r a d j 2 = 0.688, p < 0.003, n = 9) functions. The ratio between intercept (1532.7 ha−1) and slope (−22.0 ha−1 / mM NaCl) in linear interpolation estimated the absence of seedlings at 70 mM NaCl. Here, by leave-one-out validation procedure (i.e., removing one transect per time from the analysis), this estimate ranged between 65 and 73 mM NaCl and it had a bootstrapped 95% confidence interval range of 67–71 mM NaCl. An exponential model estimated the absence of seedlings at higher salinity (84 mM NaCl, Figure 1).

3.2. Seed Viability and Embryo Development

Seed lot had 70% viable, 22% non-viable, and 8% unclassified seeds (TZ test). Normality was observed only for embryo length in non-viable seeds and E:S ratio in viable seeds (W test, p > 0.14; p > 0.32, respectively). The two viability classes did not differ for seed and embryo development (Wilcoxon test: seed length, p > 0.14; embryo length, p > 0.63; E:S ratio, p > 0.77). Overall, seed and embryo length had an average of 17 mm (±0.27 SE; min–max: 10–22) and 12 mm (±0.23 SE; min–max: 6–15), respectively, with E:S ratio of 0.7 (±0.01 SE; min–max: 0.4–0.9). Prediction of embryo length by seed length was poor, even if significant (r2adj < 0.14, p < 0.004). E:S ratio was more influenced by embryo length increase (slope = 0.038, r2adj = 0.39, r = +0.63, p < 0.000), than by seed length decrease (slope = −0.023, r2adj = 0.19; r = −0.45, p < 0.000).

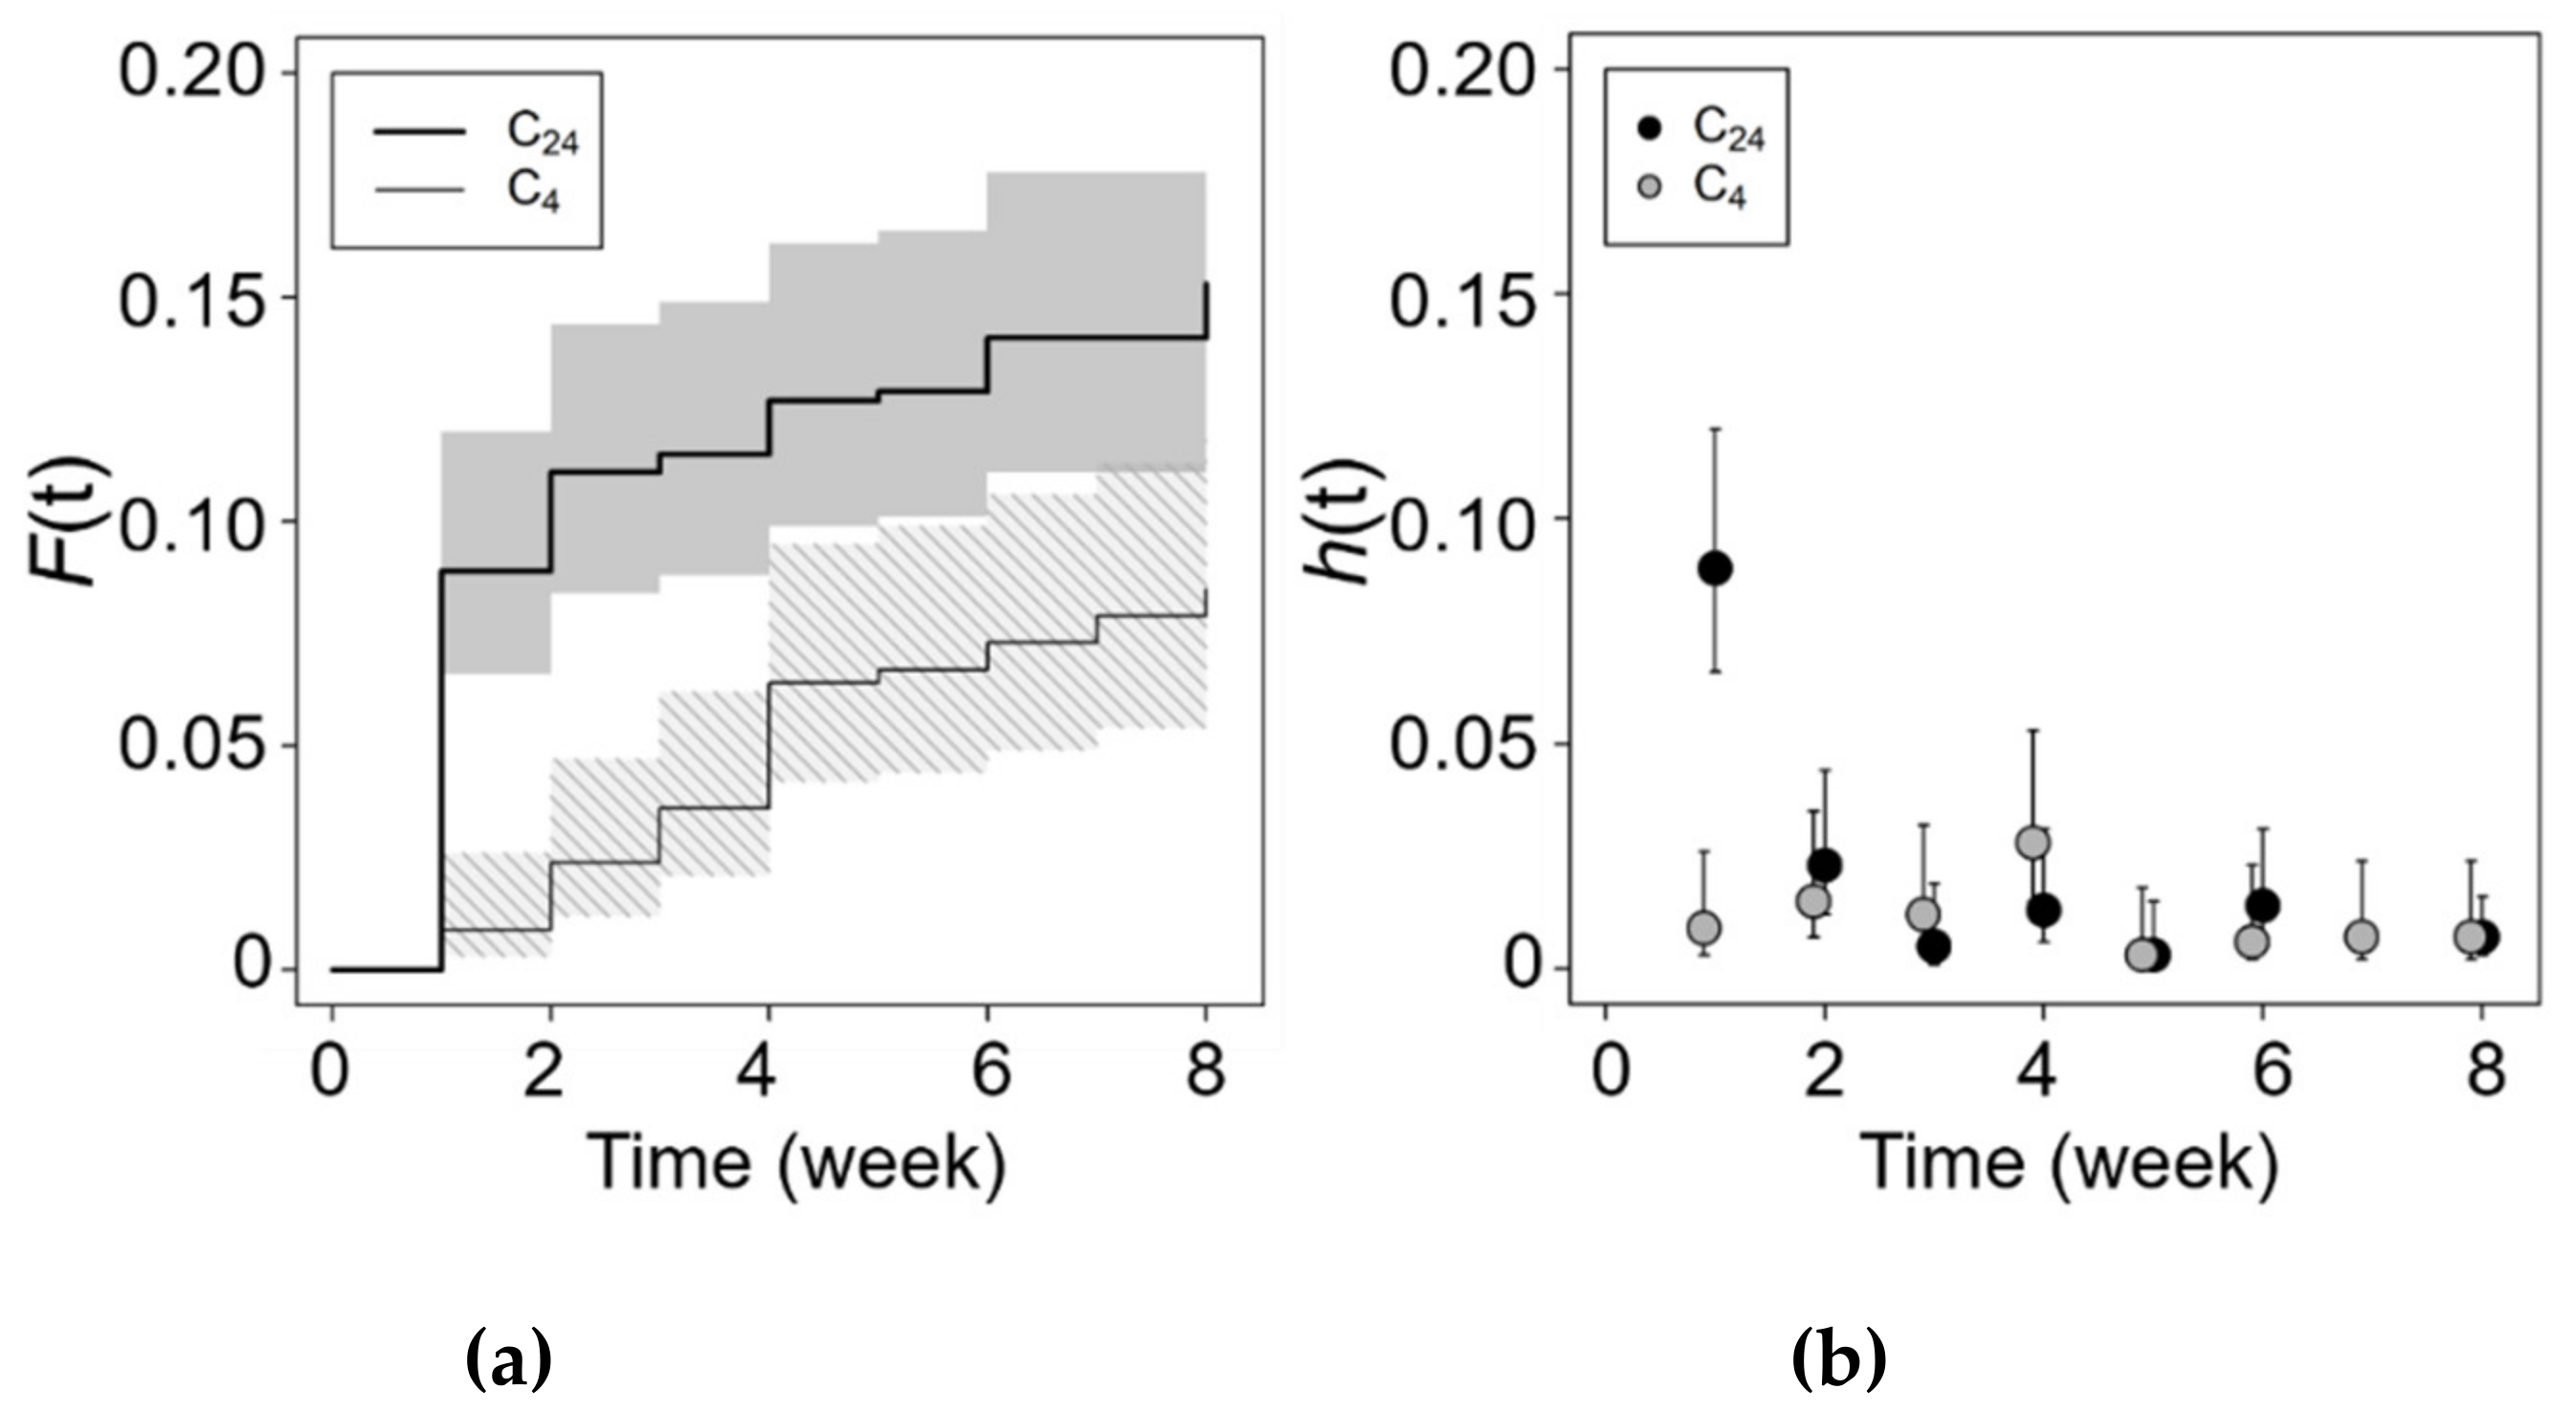
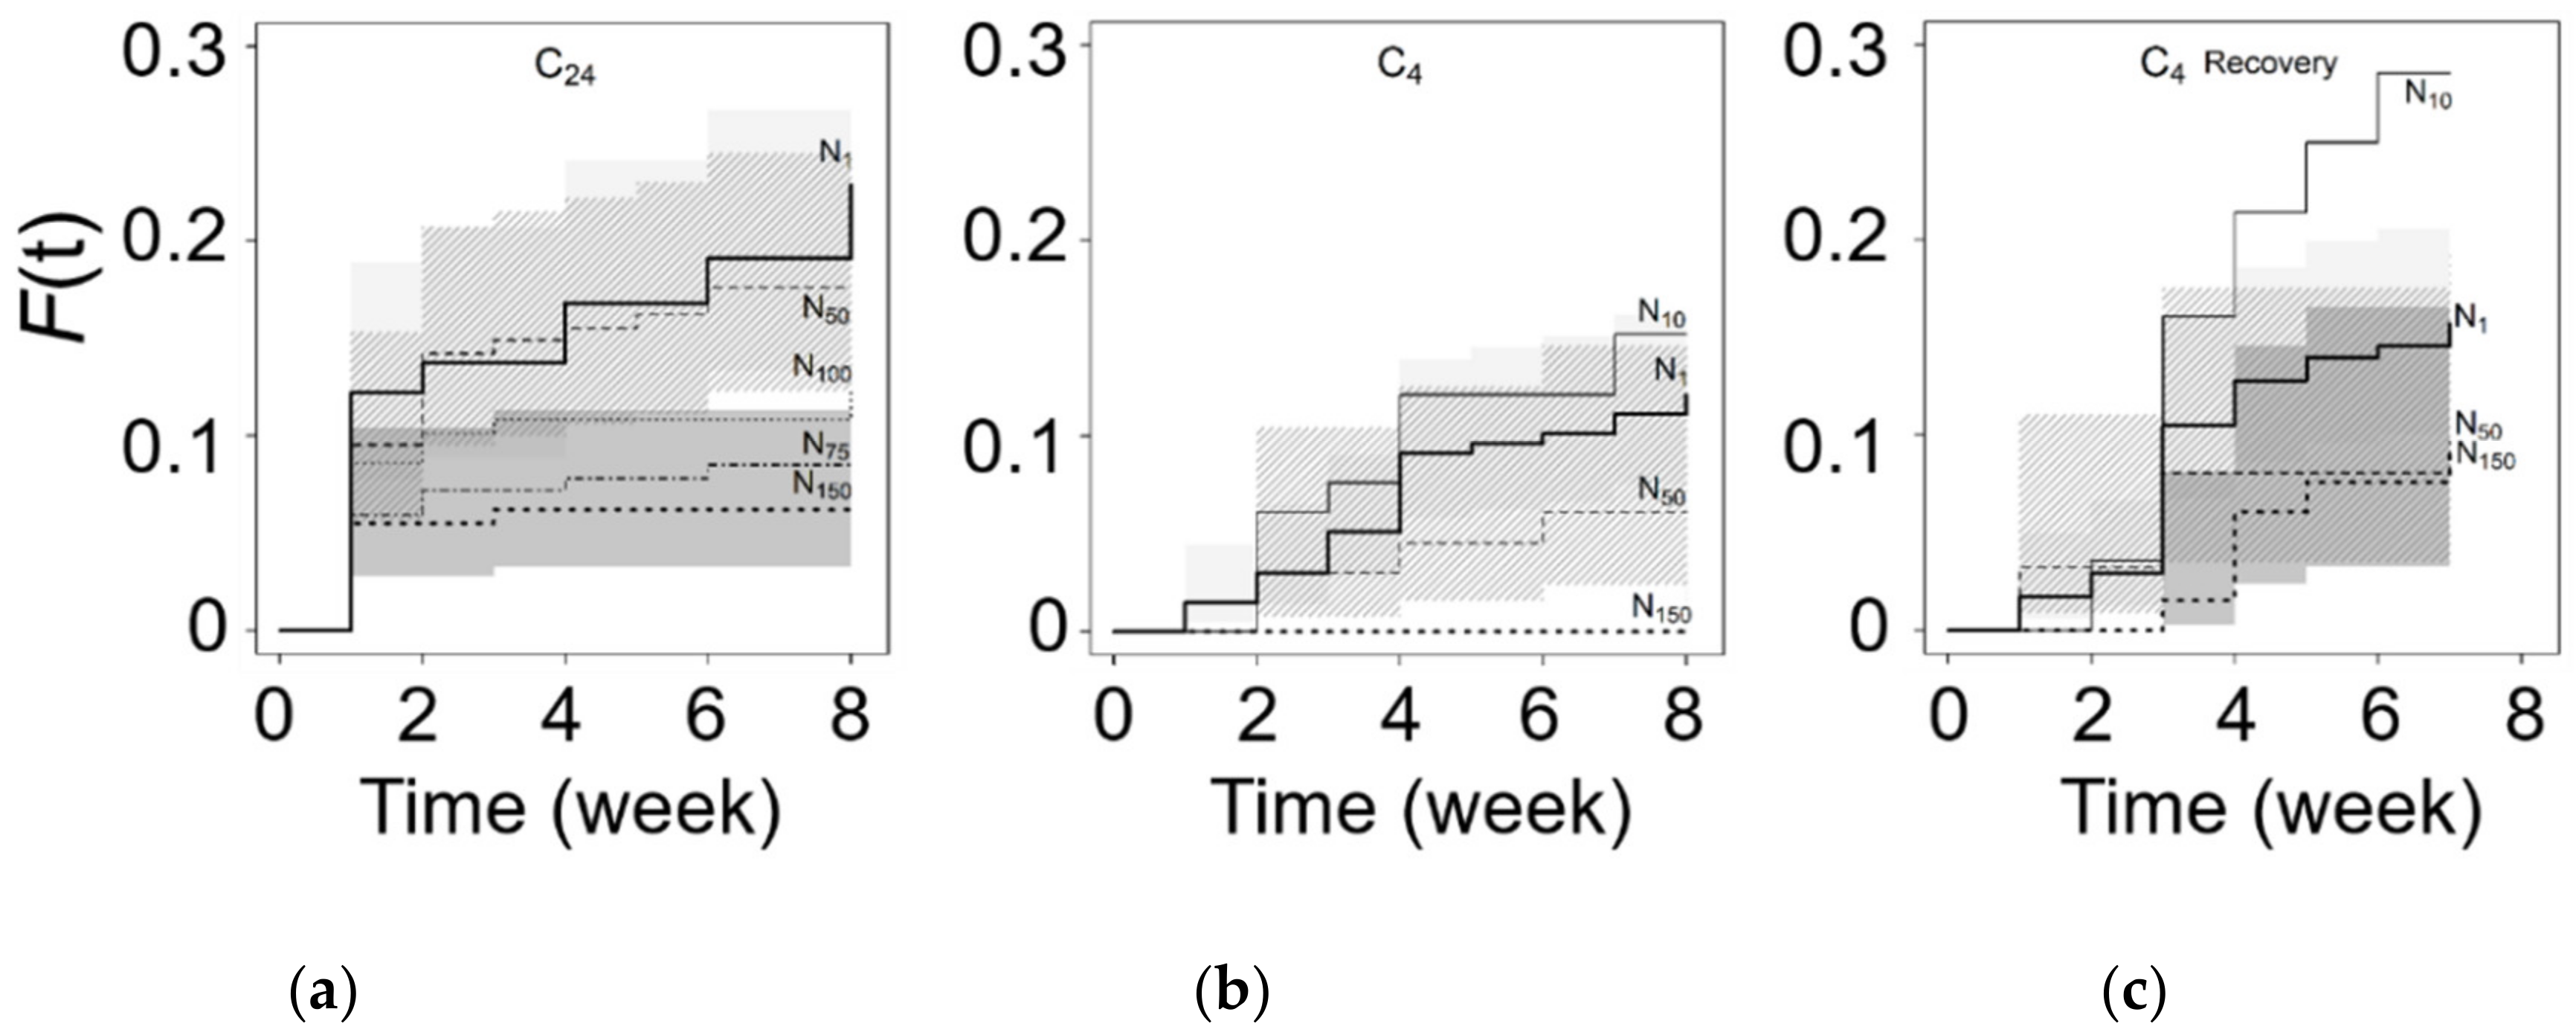
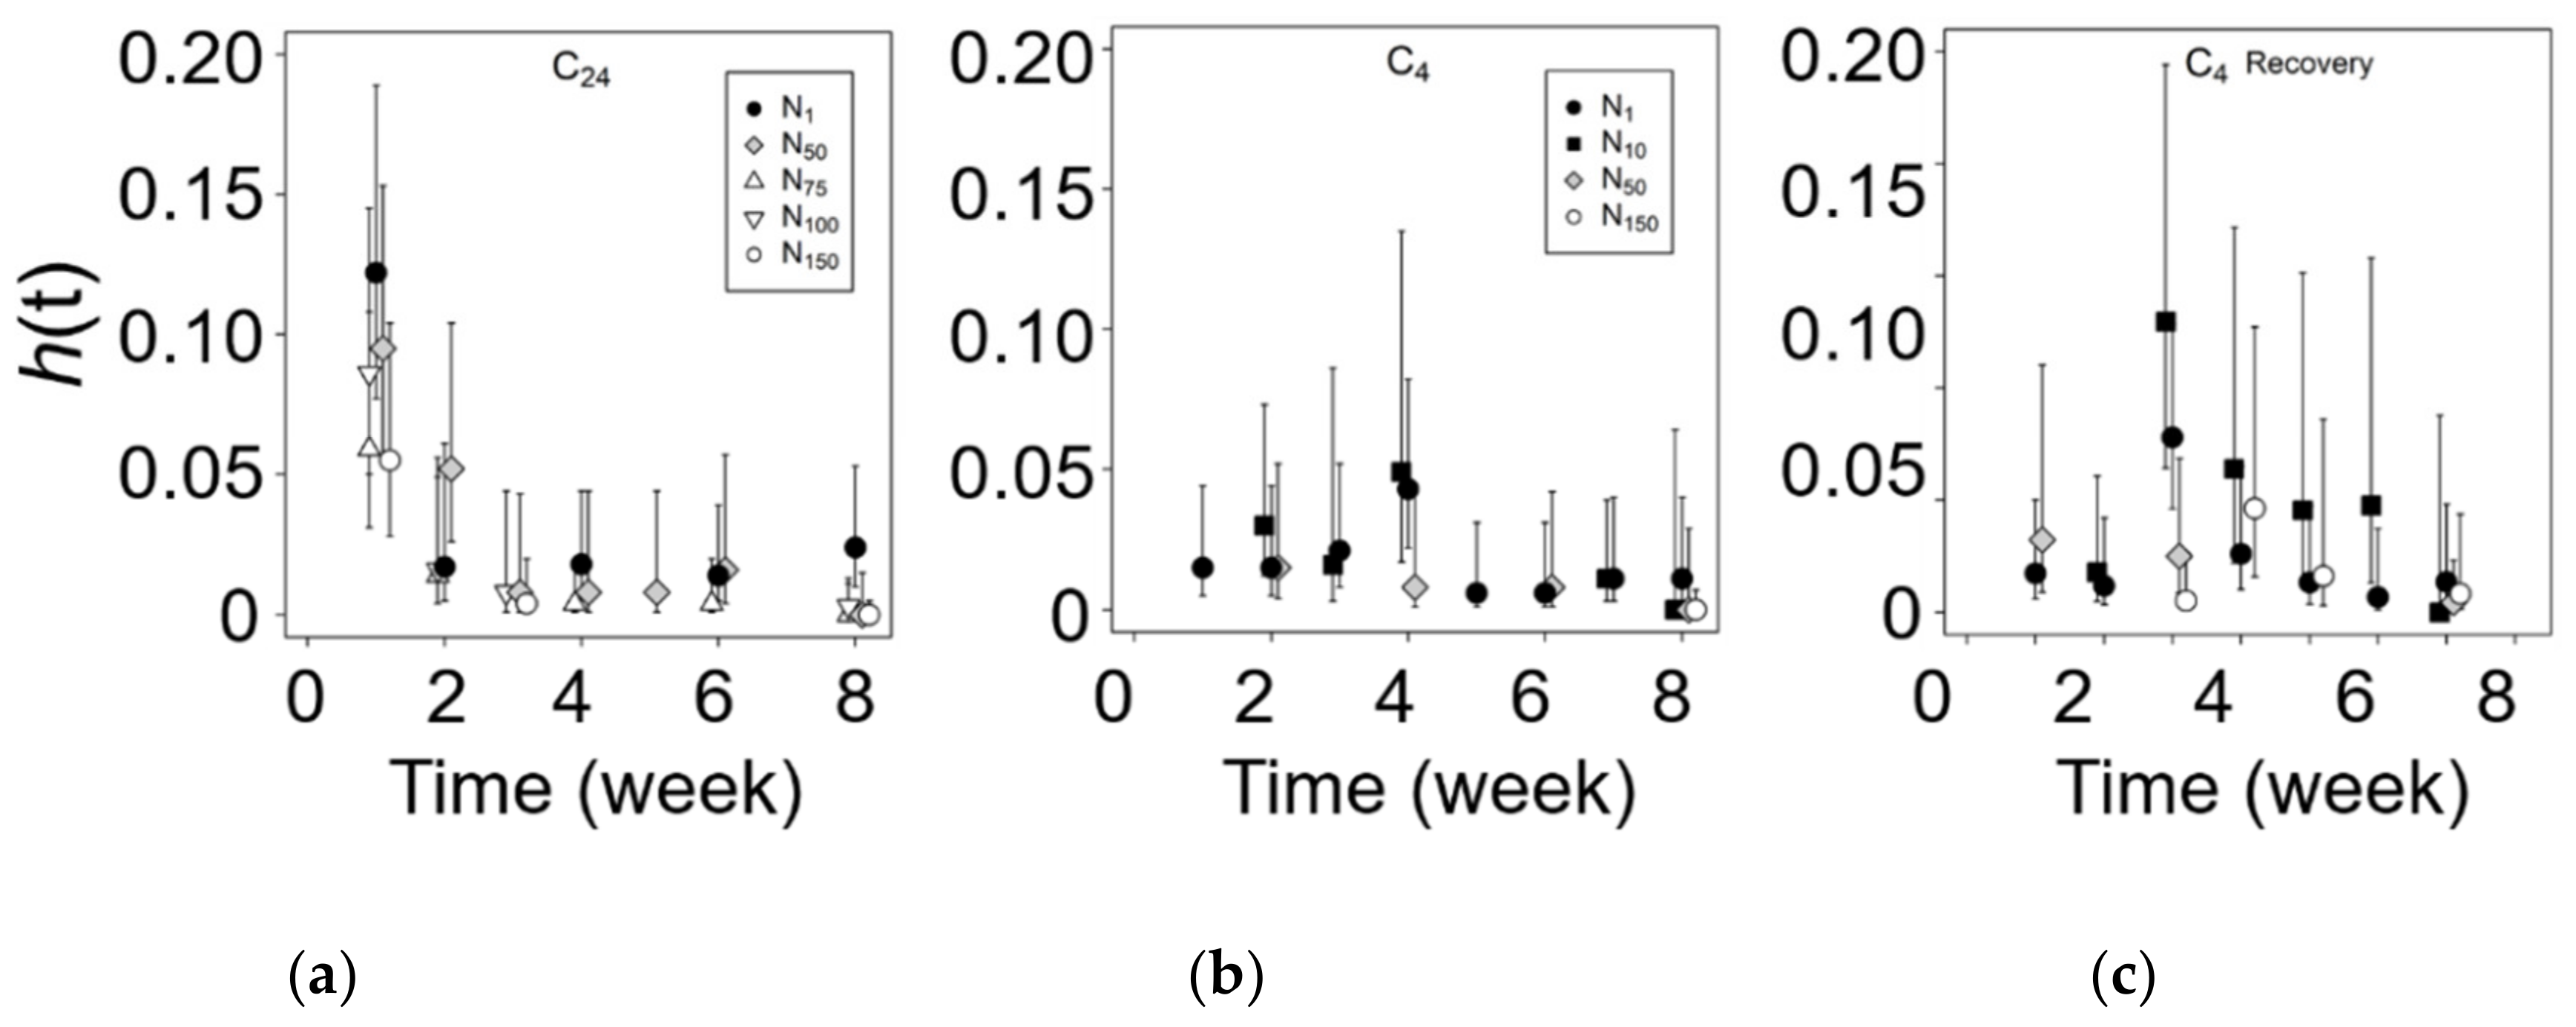
3.3. Chilling and Salinity Effect in Germination

After 8 weeks, germination was higher in C24 than in C4 ( F ^ , 15% vs. 9%, p < 0.01; Figure 2a). Longer chilling treatment showed a marked higher germination hazard rate in the first week, while, thereafter, similar hazard rates indicated comparable germination between chilling treatments (Figure 2b). Final germination percentage ( F ^ ) decreased with salinity, ranging from 0% to 12% in C4, and from 6% to 23% in C24 (Figure 3a,b). Highest and promptest germination was observed in C24 at low salinity (≤50 mM NaCl). Complete absence of germination occurred only for C4 at 150 mM NaCl. C24 strongly germinated during the first-week, when hazard rate was more than 10 times higher with respect to what observed in C4 or at any other time in the trial (Figure 2 and Figure 4a,b). C24 first week germination was linearly and positively related to final F ^ values (Figure 5a), and it had a marked effect on final F ^ value, particularly at high salinity (up to 89% of F ^ at 150 mM NaCl), representing almost all observed events, while at low salinity (≤50 mM NaCl) it contributed only 53% of F ^   (Figure 5a inset).
By contrast, the quicker chilling length, C4, showed germination during the first week only in control (hazard rate, h = 1.5%), and about 3 to 4 weeks were needed to reach at least 50% of F ^ for low salinity levels up to 50 mM NaCl. Apart from this initial difference, since the second week forward hazard rates did not significantly differ between chilling treatments at any salinity level (paired Wilcoxon test, p > 0.43), showing a ratio not different from unit both for control (N1, h C 4 / h C 24 ± SE: 1.04 ± 0.38, p > 0.43) and common salinity levels, obtained by pooling N1, N50 and N150 together ( h C 4 / h C 24   ± SE: 1.27 ± 0.33, p > 0.59).
Salinity (nacl) and chilling length (chilling) tested by Cox PH model were significant, without a significant interaction effect (Table 2). Hierarchical Bayesian model ‘bhm’ and LRT analysis confirmed these results (Table 2 and Table 3). In comparing models, interaction was not significant (as shown by p-value >0.05 for likelihood ratio and AIC values below 2). Moreover, several other statistics pointed out to the exclusion of interaction from model: nacl × chilling interaction vs. nacl VIF values well above the suggested 2.5 threshold [69], and BIC better goodness of fit for nacl + chilling model (Table 3). When individually considered, nacl contributed more than chilling to model goodness of fit (Table 3).
In the Cox PH model the assumption of proportional hazard held for nacl (p > 0.93) and interaction effect (p > 0.53), but not for chilling (p < 0.004), mainly because of the high hazard rate during the first week in C24 for any of the salinity levels (Figure 4a,b; Table 4). PH assumption rejection for chilling suggested to test salinity effect under conditions that met such assumptions; either by excluding first week germination from data analysis, or by separately evaluating nacl effect within C4 and C24. The former analysis showed that, after the first week, hazard became proportional for all effects. In doing so, only nacl (but not chilling nor interaction) remained significant under Cox PH model (p < 0.030, Table 2). ′bhm′, LRT, AIC and BIC analyses confirmed this result, indicating that most of the differences between chilling treatments were in the first week (Table 2 and Table 3), as also shown by time trends for survival and hazard rate (Figure 2).
C24 showed germination also at 150 mM NaCl (6.2%), with cumulative germination curve, F t , statistically not significantly different from moderate–high salinity (N75, p > 0.44; N100, p > 0.08), but highly different from low salinity levels (N50, p < 0.003; control, N1, p < 0.000). At low salinity (N1 and N50) no difference in germination curves was observed between these two levels (p > 0.29), both showing higher germination respect to moderate and high salinities (p < 0.023, Table 4, Figure 3).
Salinity negatively influenced germination independently from chilling treatment, being nacl effect highly significant (p < 0.010) over and within each chilling level (Table 2 and Table 3). Comparing the two chilling lengths (C24 vs. C4), longer chilling resulted in an overall higher germination (generalized Wilcoxon test, p < 0.004), also confirmed within each salinity level (N1, p < 0.006; N50, p < 0.020; N150, p < 0.040). The salinity levels (in common over chilling treatments) showed similar germination curves for N1 and N50 (p > 0.58), both higher than N150 (p < 0.000). Within C4, 150 mM NaCl failed to germinate and significantly (p < 0.05) differed from all the other salinity levels; while at low salinity (≤50 mM NaCl) no statistically significant difference was observed between nacl levels (N1 vs. N10, p > 0.52; N1 vs. N50, p > 0.17; N10 vs. N50, p > 0.09; Table 4, Figure 3). Aggregating C24 data in three salinity ranges of 50 mM NaCl–low, moderate, and high; (0, 50], (50, 100] and (100, 150]—germination in low salinity was higher (p < 0.001) with respect to each of the other two classes, being the last two ones not statistically different (p > 0.15). Applying ′bhm′ model in order to determine cut off values for conditions that could be interpreted as homogenous, the range between 1 mM to 50 mM NaCl was inferred for (i) all data pooled together and (ii) C4, while C24 had a wider salinity range from 1 to 75 mM NaCl (Table 2).

3.4. Recovery from Salt Stress

In recovery, C4 final germination was highest under 10 mM NaCl ( F ^ = 29%) followed by control (16%), 50 mM NaCl (10%) and 150 mM NaCl (Table 4, Figure 3). Samaras in high salinity (N150) did not germinate until the third week in freshwater, with a peak of hazard rate in the fourth week ( h = 4.6%). Salinity was not significant (but close to critical value) in survival analysis, by contrast with ′bhm′ (p < 0.021, Table 2), AIC and BIC (chi square p < 0.037, Table 3) analysis, even if AIC and BIC values were only slightly higher than the threshold value of 2 (AIC, 2.3; BIC, 2.7).
Salinity at 10 mM NaCl had a higher germination probability curve respect to any other nacl treatment (Wilcoxon test, Figure 3c) without statistically significant difference among these latter ones (i.e., 1, 50 and 150 mM NaCl, Table 4). Cut off values for salinity during recovery (determined by ′bhm′ and including confidence intervals) extended over the full salinity range tested—from control up to 150 mM NaCl.
An overall evaluation, which included the 15 weeks of germination and recovery tests (G+R), again showed the highly significant effect of salinity (by Cox PH model, ′bhm′, AIC, BIC and LRT; Table 2 and Table 3). Highest germination ( F ^ ) was achieved at 10 mM NaCl (N10, 39%), followed by control (N1, 26%), low (N50, 15%) and high (N150, 9%) salinity (Table 4). Overall, salinity at 10 mM NaCl did not differ (p < 0.05) from control, while it was statistically higher from N50 and N150 salinity levels. Control F ^ was higher only respect to high salinity (N150), while N50 and N150 did not differ (Table 4). The cut off values inferred by ′bhm′ did not substantially deviate from the results obtained by the recovery test. Since germination-test beginning, two peaks of germination had been observed in control and 10 mM NaCl treatment, namely at the 4th and 11th weeks (i.e., the 3rd week of recovery, Figure 4b,c).
The negative trend between salinity and F ^   had comparable slopes among trials. It should be noted that relationship between salinity and F ^ was significant only for C24 and C4 germination (r2adj > 0.77; 0.76, respectively, both p < 0.05), but not for recovery (r2adj = 0.37, p > 0.10), nor germination + recovery (r2adj = 0.47, p > 0.20) trials. In all salinity levels, final F ^ for C4(G+R) was greater than C4 and similar to C24 (as inferred by 95% CI range, Table 4). In control (intercept in Figure 5b) C24 > C4 and C24 ≈ C4(R) < C4(G+R), highlighting the effects of chilling and recovery on germination.

4. Discussion

4.1. Chilling Effect

The comparison of the two chilling lengths confirmed that northern Tuscany (Italy) F. angustifolia population had an intermediate physiological seed dormancy (PD, following the Baskin and Baskin definition [78,79]), and took advantage of a prolonged chilling period. The time required to break germination has a central role not only for physiological dormancy classification, but also to prevent freshly matured seed from germinating under otherwise favourable conditions, such as under warm autumn days in Mediterranean climate [80,81]. The two chilling lengths tested in this study were placed to either side of recommended values (4–26 weeks) for F. angustifolia [79] and intermediate PD species (1–6 months [78]). In control, 24-week long chilling resulted in nearly double germination probability (23%) with respect to 4-week chilling (12%), and this latter treatment needed almost double the period of time (15 instead to 8 weeks) to reach similar values to the former. Seed dormancy was mainly attributed to seed coat, as F. angustifolia isolated embryos could grow and develop into seedling [82]. The observed low germination, even in freshwater conditions, could partly be explained by the choice of not having applied two dormancy-breaking procedures, that is (i) after-ripening freshly harvested mature seeds in a relatively dry state (effective also for this species [83]) and (ii) to remove pericarp before dormancy-release treatments [79,84]. Both choices were justified by the purpose of investigating germination response to chilling and salinity in conditions similar to those experienced by seeds after dispersal in the natural environment.
F. angustifolia populations showed a decrease of dormancy from northern to southern Italian provenances [85], without chilling requirement in Sicily [83]. At the northern geographical range (41°–43° Lat. N), lack of cold stratification resulted in low germination percentage (below 25% after 7–8 weeks) for Spanish [86], French [87], and Turkish [88] provenances, suggesting that origin site temperature or other environmental cues might play a role in dormancy levels [89,90]. Assuming a linear increase germination with chilling length for our seed lot in freshwater conditions, germination probability would be reduced to F ^ = 10% without chilling (intercept) with a germination increase of 0.54% per chilling week (slope), not so much lower than what was inferred from the Turkish provenances dataset (0.8%–1.4% per week) [88].
Chilling promotes germination, as soon as temperature (and light) conditions returned favourable (as evidenced by C24 high germination rate during the first-week, Figure 1), allowing emergence also in the sub-optimal conditions given by salinity. Most of the chilling effect was detected in the first week. Excluding first-week emergence from data analysis both Bayesian and survival analysis showed comparable germination between the two chilling lengths (Table 2). A week of high germination rate could result in an effective mechanism to escape the negative effect of salinity for a higher fraction of seeds. In several plant species (salt-intolerant glycophytes included), cold stratification under freshwater conditions induced emergence under saline conditions [91]. Cold stratification might induce several physiological changes involved in germination under salty conditions, such as higher seed imbibition [92,93], changes in enzyme kinetics or activities [94,95], and/or storage protein degradation [96,97].

4.2. Salinity Effect in Laboratory and in the Field

Salinity reduced seed germination in plants [98,99,100,101], even in halophytes [102,103,104], delaying or preventing germination beyond tolerance limits [105]. Although the issue of critical values’ determination for salinity is complex and controversial—due to the diversity of saline environments and responses induced by salts, such as: osmotic and oxidative stresses, ion-toxicity and/or nutritional disorder [106]—generalized relationships between germination curves and salinity were suggested. Following the Läuchli and Grattan classification [107], a delay in germination onset (without differences in rate and thus in final germination percentage) sorted ′moderate′ from ′low′ salinity levels, while a further delay along with significant final germination percent reduction characterized ′high′ salinity levels. This scheme might not be confirmed by C24 results (which did not show any delay in germination onset; or at least it was limited to 1 week, where only a reduction of final germination with 75 mM NaCl and beyond was observed, Figure 3a). On the other hand, a ′moderate′ salinity effect up to 50 mM NaCl resulted in C4 treatment, suggesting the important role of chilling to overcome dormancy and saline stress (Figure 3b).
In our dataset, seed germination was progressively reduced under salinity conditions and marked reduction of seed germination over 50 (75) mM NaCl was highlighted both under laboratory (Cox PH and hierarchical Bayesian analysis) and natural environment conditions (where according to the interpolation equations the absence of seedlings should be estimated in the range from 65 to 84 mM NaCl, Figure 1), indicating that this species might complete germination under ′low′ to ′moderate′ salt stress [108]. Even if in this study seedling sampling was performed over a short time-period, the comparison of seed germination response to salinity in natural environment and germination tests resulted useful to infer tolerance levels over a wide range of environmental conditions. It has often been pointed out that salt tolerance of plants is difficult to quantify in natural environment, because it may vary with environmental conditions, plant life stage, and genotype [109,110]. Sampling newly germinated seedling in the forest surely had the advantage to return results based on effective environmental conditions, but nevertheless such trials had several cons in identifying cause-effect relationships (e.g., [111]). Time and space variability in abiotic or biotic factors and conditions (apart from salinity) might strongly influence results; here, site vicinity (below 1 km), similar soil and stand conditions could at least in part minimize this problem. On the other hand, estimates obtained by standard laboratory germination tests may not reflect seedling emergence in the field [112], and the extrapolation of monosaline response (such as NaCl) to field salinity conditions might be only speculative [113]. The critical values found in our study were similar to those detected in F. rhynchophylla [114] and slightly lower than what was reported for F. chinensis, which is able to retain 60% of control germination at 100 mM NaCl [115]. In F. angustifolia embryogenic callus culture growth, osmotic and ion-toxicity were evidenced at 100 mM NaCl [116].

4.3. Recovery

A marked and positive influence of the period in freshwater was observed, which reduced, at least in part, the negative effects of salinity (even if Cox PH results applied to the entire trial, i.e., germination + recovery, should be interpreted with prudence, as salinity changed between germination and recovery trial for most treatments, infringing assumptions). Germination resumption under freshwater conditions might have adaptive consequences, as it prevents emergence under harsh environmental conditions, ensuring a higher chance for proper seedling establishment [117,118]. This species can tolerate up to 150 mM NaCl salt stress (at least for two months, (Figure 3a) and (Figure 5b), taking advantage of a prolonged chilling or recovery period, even if in both cases hazard rate for seed germination in high salinity remains low and about 25% and 50% of control values (Table 4). Low salt-stress exposure (10 mM NaCl)—a process known as salt acclimation [119]—improved germination particularly during recovery (Figure 3c). In Arabidopsis thaliana, exposure to these same NaCl concentration was found to trigger several physiological responses such as reactive oxygen species (ROS) increase, ROS-scavenging-enzyme activation, compatible solutes accumulation, and Na+, Cl, and K+ ion-content changes [120,121]. Germination kinetics during recovery from saline stress was similar among NaCl concentrations, and germination probability decrease with salinity was not significant in none of the applied statistical approaches, i.e., survival analysis, critical value determination by hierarchical Bayesian, and regression between final F ^ values vs. salinity. Moreover, the similar behavior among salt concentrations during recovery suggested that NaCl had a mainly osmotic effect (at least up to 150 mM and 2-month exposure). This was also confirmed by the observation that 4-week chilled seeds reached (at the end of recovery) similar final values to C24 for germination probability ( F ^ ) and hazard rate ( H ^ ) under all tested NaCl conditions. Thus, moderate–high salinity limited emergence, retaining seed viability. Seed germination resumed under favorable freshwater conditions, highlighting an escape mechanism [122], that might be positive to ensure seedling survival soon after emergence [112], and thus widening regeneration opportunities.

5. Conclusions

F. angustifolia moderate tolerance to salt spray and soil salinity at seedling and plant stage [9,10,11] could also be confirmed in germination/emergence stage, with absence of germination observed in the field at 60 mM NaCl and estimated at 70–84 mM NaCl depending on interpolation model. Even if a progressively reduction was observed in seed germination with salinity for F. angustifolia, emergence took place up to 50 (70) mM NaCl without a significant differences with respect to control. The potential toxicity of high salt levels, hyperosmotic stress, and related secondary stresses, such as oxidative damage [123,124] could be recovered up to the highest NaCl tested levels (150 mM NaCl) after about two months in freshwater conditions. Hence, from an ecological point of view, this study confirmed the importance for overcoming dormancy and complete germination in sub-optimal saline conditions by a prompt germination after (i) a prolonged cold and humid season or (ii) rainy periods such as to reduce soil salinity below threshold critical values.

Supplementary Materials

The following are available online at https://www.mdpi.com/1999-4907/10/11/940/s1.

Author Contributions

S.R. coordinated the overall project. A.P. followed germination tests. S.R., B.M., and S.M. analyzed data and wrote the manuscript.

Funding

This work was funded by Italian PRIN-MIUR (grant number 2012E3F3LK).

Acknowledgments

The authors are indebted to Paolo Cherubini (WSL, Swiss) and Andrea Bertacchi (Università di Pisa, Italy) for field trips, to ″Ente Parco Regionale Migliarino, San Rossore, Massaciuccoli″ for providing access to the study areas, and to the referees for their advices and contributions to the final version of the paper. We also thank Leonora Di Gesualdo for field help.

Conflicts of Interest

The authors declare no conflict of interest.

References

  1. Caudullo, G.; Houston Durrant, T. Fraxinus angustifolia in Europe: distribution, habitat, usage and threats. In European Atlas of Forest Tree Species; San-Miguel Ayanz, J., De Rigo, D., Caudullo, G., Houston Durrant, T., Mauri, A., Eds.; Publication Office of the European Union: Luxembourg, 2016; p. 97. ISBN 978-92-79-36740-3. [Google Scholar]
  2. Raddi, S. Fraxinus angustifolia. In Enzyklopädie der Holzgewächse Handb. und Atlas der Dendrologie; Wiley-VCH Verlag GmbH & Co KGaA: Weinheim, Germany, 2014; pp. 1–18. [Google Scholar]
  3. Pinheiro, J.C.; Marques, C.R.; Pinto, G.; Bouguerra, S.; Mendo, S.; Gomes, N.C.; Gonçalves, F.; Rocha-Santos, T.; Duarte, A.C.; Roembke, J.; et al. The performance of Fraxinus angustifolia as a helper for metal phytoremediation programs and its relation to the endophytic bacterial communities. Geoderma 2013, 202–203, 171–182. [Google Scholar] [CrossRef]
  4. Rosselli, W.; Keller, C.; Boschi, K. Phytoextraction capacity of trees growing on a metal contaminated soil. Plant Soil 2003, 256, 265–272. [Google Scholar] [CrossRef]
  5. Baycu, G.B.; Tolunay, D.; Özden, H.; Günebakan, S. Ecophysiological and seasonal variations in Cd, Pb, Zn, and Ni concentrations in the leaves of urban deciduous trees in Istanbul. Environ. Pollut. 2006, 143, 545–554. [Google Scholar] [CrossRef] [PubMed]
  6. Semenzato, P.; Cattaneo, D.; Dainese, M. Growth prediction for five tree species in an Italian urban forest. Urban For. Urban Green. 2011, 10, 169–176. [Google Scholar] [CrossRef]
  7. Roloff, A.; Korn, S.; Gillner, S. The Climate-Species-Matrix to select tree species for urban habitats considering climate change. Urban For. Urban Green. 2009, 8, 295–308. [Google Scholar] [CrossRef]
  8. Jaeger, C.; Gessler, A.; Biller, S.; Rennenberg, H. Differences in C metabolism of ash species and provenances as a consequence of root oxygen deprivation by waterlogging. J. Exp. Bot. 2009, 60, 4335–4345. [Google Scholar] [CrossRef] [Green Version]
  9. Miyamoto, S. Site Suitability Assessment for Irrigating Urban Landscapes with Water of Elevated Salinity in the Southwest Consolidated Final Report Part I. Water Quality and Plant Salt Tolerance; TWRI TR-416; Texas A&M University, AgriLife Research Center, Water Resources Institute: El Paso, TX, USA, 2011. [Google Scholar]
  10. Wu, L.; Guo, X.; Hunter, K.; Zagory, E.; Waters, R.; Brown, J. Studies of salt tolerance of landscape plant species and California native grasses for recycled water irrigation. Slosson Rep. 2001, 2000–2001, 1–14. [Google Scholar]
  11. Xie, Y.J.; Xu, S.; Han, B.; Wu, M.Z.; Yuan, X.X.; Han, Y.; Gu, Q.; Xu, D.K.; Yang, Q.; Shen, W.B. Evidence of Arabidopsis salt acclimation induced by up-regulation of HY1 and the regulatory role of RbohD-derived reactive oxygen species synthesis. Plant J. 2011, 66, 280–292. [Google Scholar] [CrossRef]
  12. European Commission. Interpretation Manual of European Union Habitats—EUR28; DG Environment B.3, Nature ENV.; European Commission: Brussels, Belgium, 2013; p. 144. [Google Scholar]
  13. Schwartz, S.S.; Jenkins, D.G. Temporary aquatic habitats: Constraints and opportunities. Acquat. Ecol. 2000, 34, 3–8. [Google Scholar] [CrossRef]
  14. Viciani, D.; Lastrucci, L.; Dell’Olmo, L.; Ferretti, G.; Foggi, B. Natura 2000 habitats in Tuscany (central Italy): Synthesis of main conservation features based on a comprehensive database. Biodivers. Conserv. 2014, 23, 1551–1576. [Google Scholar] [CrossRef]
  15. Gardner, R.C.; Barchiesi, S.; Beltrame, C.; Finlayson, C.; Galewski, T.; Harrison, I.; Paganini, M.; Perennou, C.; Pritchard, D.; Rosenqvist, A.; et al. State of the World’s Wetlands and Their Services to People: A Compilation of Recent Analyses; Ramsar Convention Secretariat: Gland, Switzerland, 2015. [Google Scholar]
  16. MedWet Secretariat. Wetlands for Sustainable Development in the Mediterranean Region. A Framework for Action 2016–2030, MedWet Secretariat: Palais de la Porte Dorée, Paris, France, 2016; ISBN 978-2-9554-6210-2.
  17. Ramsar Convention on Wetlands. Global Wetland Outlook: State of the World’s Wetlands and their Services to People; Dudley, N., Ed.; Ramsar Convention Secretariat: Gland, Switzerland, 2018. [Google Scholar]
  18. Davidson, N.C. How much wetland has the world lost? Long-term and recent trends in global wetland area. Mar. Freshw. Res. 2014, 65, 934–941. [Google Scholar]
  19. Jones, A.; Panagos, P.; Barcelo, S.; Bouraoui, F.; Bosco, C.; Dewitte, O.; Gardi, C.; Erhard, M.; Hervás, J.; Hiederer, R.; et al. The State of Soil in Europe; European Commission JRC-IES: Ispra, Italy, 2012; ISBN 978-92-79-22806-3. [Google Scholar]
  20. Tsanis, I.K.; Daliakopoulos, I.N.; Koutroulis, A.G.; Karatzas, G.P.; Varouchakis, E.; Kourgialas, N. Soil salinization. In Soil Threats in Europe; JRC Technical Report. EUR 27607; Stolte, J., Tesfai, M., Øygarden, L., Kværnø, S., Keizer, J., Verheijen, F., Panagos, P., Ballabio, C., Hessel, R., Eds.; Publications Office of the European Union: Luxembourg, 2015; pp. 104–117. [Google Scholar]
  21. Daliakopoulos, I.N.; Tsanis, I.K.; Koutroulis, A.; Kourgialas, N.N.; Varouchakis, A.E.; Karatzas, G.P.; Ritsema, C.J. The threat of soil salinity: A European scale review. Sci. Total Environ. 2016, 573, 727–739. [Google Scholar] [CrossRef]
  22. Lefebvre, G.; Redmond, L.; Germain, C.; Palazzi, E.; Terzago, S.; Willm, L.; Poulin, B. Predicting the vulnerability of seasonally-flooded wetlands to climate change across the Mediterranean Basin. Sci. Total Environ. 2019, 692, 546–555. [Google Scholar] [CrossRef] [PubMed]
  23. Juffe-Bignoli, D.; Burgess, N.D.; Bingham, H.; Belle, E.M.; De Lima, M.G.; Deguignet, M.; Bertzky, B.; Milam, A.N.; Martinez-Lopez, J.; Lewis, E.; et al. Protected Planet Report 2014; UNEP-WCMC: Cambridge, UK, 2014; ISBN 978-92-807-3416-4. [Google Scholar]
  24. Rundel, P.W. Landscape disturbance in Mediterranean-type ecosystems: An overview. In Landscape Disturbance and Biodiversity in Mediterranean-Type Ecosystems; Rundel, P.W., Montenegro, G., Jaksic, F.M., Eds.; Springer: Berlin/Heidelberg, Germany, 1998; pp. 3–22. ISBN 978-3-662-03543-6. [Google Scholar]
  25. Herbert, E.R.; Boon, P.; Burgin, A.J.; Neubauer, S.C.; Franklin, R.B.; Ardón, M.; Hopfensperger, K.N.; Lamers, L.P.M.; Gell, P. A global perspective on wetland salinization: Ecological consequences of a growing threat to freshwater wetlands. Ecosphere 2015, 6, art206. [Google Scholar] [CrossRef]
  26. Geijzendorffer, I.R.; Beltrame, C.; Chazee, L.; Gaget, E.; Galewski, T.; Guelmami, A.; Perennou, C.; Popoff, N.; Guerra, C.A.; Leberger, R.; et al. A more effective Ramsar Convention for the conservation of Mediterranean wetlands. Front. Ecol. Evol. 2019, 7, 1–6. [Google Scholar] [CrossRef]
  27. Zedler, J.B. What’s new in adaptive management and restoration of coasts and estuaries? Estuaries Coasts 2017, 40, 1–21. [Google Scholar] [CrossRef]
  28. Hoepffner, N.; Dowell, M.D.; Edwards, M.; Fonda-Umano, S.; Green, D.R.; Greenaway, B.; Hansen, B.; Heinze, C.; Leppänen, J.-M.; Lipiatou, E.; et al. Marine and Coastal Dimension of Climate Change in Europe Marine and Coastal Dimension of Climate Change in Europe; EUR 22554 EN; Hoepffner, N., Ed.; Institute for Environment and Sustainability: Ispra, Italy, 2006; ISBN 9279037471. [Google Scholar]
  29. IPCC. Summary for policymakers. In Climate Change 2014: Impacts, Adaptation, and Vulnerability. Part A: Global and Sectoral Aspects. Contribution of Working Group II to the Fifth Assessment Report of the Intergovernmental Panel on Climate Change; Field, C.B., Barros, V.R., Dokken, D.J., Mach, K.J., Mastrandrea, M.D., Bilir, T.E., Chatterjee, M., Ebi, K.L., Estrada, Y.O., Genova, R.C., et al., Eds.; Cambridge University Press: Cambridge, UK; New York, NY, USA, 2014. [Google Scholar]
  30. Amores, M.J.; Verones, F.; Raptis, C.; Juraske, R.; Pfister, S.; Stoessel, F.; Antón, A.; Castells, F.; Hellweg, S. Biodiversity impacts from salinity increase in a coastal wetland. Environ. Sci. Technol. 2013, 47, 6384–6392. [Google Scholar] [CrossRef] [PubMed]
  31. EEA Natura. Network Viewer. 2000. Available online: http://natura2000.eea.europa.eu/# (accessed on 10 August 2019).
  32. Levin, N.; Elron, E.; Gasith, A. Decline of wetland ecosystems in the coastal plain of Israel during the 20th century: Implications for wetland conservation and management. Landsc. Urban Plan. 2009, 92, 220–232. [Google Scholar] [CrossRef]
  33. Cosentino, B.; Colleges, W.S. Dispersal and wetland fragmentation. In The Wetland Book: I: Structure and Function, Management, and Methods; Finlayson, C.M., Everard, M., Irvine, K., McInnes, R.J., Middleton, B.A., van Dam, A.A., Davidson, N.C., Eds.; Springer: Dordrecht, The Netherlands, 2018; pp. 105–111. ISBN 9789048196593. [Google Scholar]
  34. Ghelardini, L.; Migliorini, D.; Santini, A.; Pepori, A.L.; Maresi, G.; Vai, N.; Montuschi, C.; Carrari, E.; Feducci, M.; Capretti, P.; et al. From the Alps to the Apennines: possible spread of ash dieback in Mediterranean areas. In Dieback of European Ash (Fraxinus spp.): Consequences and Guidelines for Sustainable Management; The Report on European Cooperation in Science & Technology (COST) Action FP1103 FRAXBACK; Vasaitis, R., Enderle, R., Eds.; SLU Service/Repro: Uppsala, Sweden, 2017; pp. 140–149. ISBN 978-91-576-8696-1. [Google Scholar]
  35. Ortega, M.; Velasco, J.; Millán, A.; Guerrero, C. An ecological integrity index for littoral wetlands in agricultural catchments of semiarid mediterranean regions. Environ. Manag. 2004, 33, 412–430. [Google Scholar] [CrossRef]
  36. Schuerch, M.; Spencer, T.; Temmerman, S.; Kirwan, M.L.; Wolff, C.; Lincke, D.; McOwen, C.J.; Pickering, M.D.; Reef, R.; Vafeidis, A.T.; et al. Future response of global coastal wetlands to sea-level rise. Nature 2018, 561, 231–234. [Google Scholar] [CrossRef]
  37. Fini, A.; Guidi, L.; Giordano, C.; Baratto, M.C.; Ferrini, F.; Brunetti, C.; Calamai, L.; Tattini, M. Salinity stress constrains photosynthesis in Fraxinus ornus more when growing in partial shading than in full sunlight: Consequences for the antioxidant defence system. Ann. Bot. 2014, 114, 525–538. [Google Scholar] [CrossRef]
  38. Hoeppner, S.S.; Shaffer, G.P.; Perkins, T.E. Through droughts and hurricanes: Tree mortality, forest structure, and biomass production in a coastal swamp targeted for restoration in the Mississippi River Deltaic Plain. Forest 2008, 256, 937–948. [Google Scholar] [CrossRef]
  39. Conner, W.H.; Mcleod, K.W.; Mccarron, J.K. Flooding and salinity effects on growth and survival of four common. Wetl. Ecol. Manag. 1997, 5, 99–109. [Google Scholar] [CrossRef]
  40. Bauhus, J.; Forrester, D.I.; Pretzsch, H.; Felton, A.; Pyttel, P.; Benneter, A. Silvicultural Options for Mixed-Species Stands. In Mixed-Species Forests; Pretzsch, H., Forrester, D.I., Bauhus, J., Eds.; Springer-Verlag GmbH: Berlin, Germany, 2017; pp. 433–501. ISBN 978-3-662-54551-5. [Google Scholar]
  41. Fady, B.; Aravanopoulos, F.A.; Alizoti, P.; Mátyás, C.; von Wühlisch, G.; Westergren, M.; Belletti, P.; Cvjetkovic, B.; Ducci, F.; Huber, G.; et al. Forest Ecology and Management Evolution-based approach needed for the conservation and silviculture of peripheral forest tree populations. For. Ecol. Manag. 2016, 375, 66–75. [Google Scholar] [CrossRef]
  42. Barducci, A.; Guzzi, D.; Marcoionni, P.; Pippi, I.; Raddi, S. PROBA contribution to wetland monitoring in the coastal zone of San Rossore Natural Park. In Proceedings of the European Space Agency, (Special Publication) ESA SP, Montreux, Switzerland, 23–27 April 2007. [Google Scholar]
  43. Bertacchi, A.; Lombardi, T.; Tomei, P.E. Le aree umide salmastre della Tenuta di San Rossore (PI): Zonazione e successione delle specie vegetali in relazione alla salinità del suolo. INTER NOS 2007, 1, 1–14. [Google Scholar]
  44. Sani, A.; Tomei, P.E. La vegetazione psammofila del litorale di San Rossore (Toscana settentrionale) e la sua importanza conservazionistica. Parlatorea 2006, 8, 99–119. [Google Scholar]
  45. Bertacchi, A. Dune habitats of the Migliarino—San Rossore—Massaciuccoli Regional Park (Tuscany-Italy). J. Maps 2017, 13, 322–331. [Google Scholar] [CrossRef]
  46. Rhoades, J.D.; Chanduvi, F.; Lesch, S. Soil salinity assessment. In Methods and Interpretation of Electrical Conductivity Measurements; FAO Irrigation and Darinage: Rome, Italy, 1999; ISBN 92-5-104281-0. [Google Scholar]
  47. ISO. Soil Quality—Determination of pH; ISO 10390; ISO: Geneva, Switzerland, 2005. [Google Scholar]
  48. RStudio Team. RStudio: Integrated Development for R. RStudio, Inc.: Boston, MA, USA; Available online: http://www.rstudio.com/ (accessed on 1 February 2019).
  49. Shapiro, S.S.; Wilk, M.B. An analysis of variance test for normality (complete sample). Biometrika 1965, 52, 591–611. [Google Scholar] [CrossRef]
  50. Royston, P. Remark AS R94: A Remark on Algorithm AS 181: The W-test for Normality. J. R. Stat. Soc. Ser. C (Appl. Stat.) 1995, 44, 547–551. [Google Scholar] [CrossRef]
  51. Wilcoxon, F. Individual comparisons by ranking methods. Biom. Bull. 1945, 1, 80–83. [Google Scholar] [CrossRef]
  52. Canty, A.; Ripley, B.; Bootstrap Functions. Package ‘boot’ R—Project. Available online: https://cran.r-project.org/web/packages/boot/boot.pdf (accessed on 23 October 2019).
  53. Canty, A.J. Resampling Methods in R: The boot Package. Newsl. R. Proj. 2002, 2, 2–7. [Google Scholar]
  54. ISTA. ISTA Working Sheets on Tetrazolium Testing 2003, 1st ed.; Including Supplements 2011; Testing, I.S., Ed.; ISTA: Bassersdorf, Switzerland, 2011; Volume 2, ISBN 3906549402. [Google Scholar]
  55. ISTA. International Rules for Seed Testing.; International Seed Testing Association: Bassersdorf, Switzerland, 2017; ISBN 2310-3655. [Google Scholar]
  56. Magini, E. Forest seed handling, equipment and procedures. Unasylva 1962, 64, 1–22. [Google Scholar]
  57. Bewley, J.D.; Bradford, K.J.; Hilhorst, H.W.M.; Nonogaki, H. Seeds: Physiology of Development, GERMINATION and dormancy, 3rd ed.; Springer: New York, NY, USA; Berlin/Heidelberg, Germany; Dordrecht, The Netherlands; London, UK, 2013; ISBN 9781461446934. [Google Scholar]
  58. Klein, J.P.; van Houwelingen, H.C.; Ibrahim, J.G.; Scheike, T.H. Handbook of Survival Analysis; CRC Press: Boca Raton, FL, USA; Taylor and Francis Group: Abingdon, UK, 2016; ISBN 9781466555679. [Google Scholar]
  59. Muenchow, G. Ecological use of failure time analysis. Ecology 1986, 67, 246–250. [Google Scholar] [CrossRef]
  60. 60. Kalbfleish, J.D.; Prentice, R.L. The Statistical Analysis Failure Time Data, 2nd ed.Kalbfleish, J.D., Prentice, R.L., Eds.; John Wiley & Sons: New York, NY, USA, 2011; ISBN 9781118031230. [Google Scholar]
  61. McNair, J.N.; Sunkara, A.; Frobish, D. How to analyse seed germination data using statistical time-to-event analysis: Non-parametric and semi-parametric methods. Seed Sci. Res. 2012, 22, 77–95. [Google Scholar] [CrossRef]
  62. Kaplan, E.L.; Meier, P. Nonparametric estimation from incomplete samples. J. ASA 1958, 53, 457–481. [Google Scholar]
  63. Nelson, W. Hazard plotting for incomplete failure data. J. Qual. Technol. 1969, 1, 27–52. [Google Scholar] [CrossRef]
  64. Nelson, W. Theory and applications of hazard plotting for censored failure data. Technometrics 1972, 14, 945–966. [Google Scholar] [CrossRef]
  65. Aalen, O. Nonparametric inference for a family of counting processes. Ann. Stat. 1978, 6, 701–726. [Google Scholar] [CrossRef]
  66. Zhou, M. Empirical Likelihood Method in Survival Analysis. Zhou, M., Ed.; Chapman and Hall, CRC: London, UK; New York, NY, USA, 2015; ISBN 9781466554931. [Google Scholar]
  67. Thomas, D.R.; Grunkemeier, G.L. Confidence interval estimation of survival probabilities for censored data. J. Am. Stat. Assoc. 1975, 70, 865–871. [Google Scholar] [CrossRef]
  68. Strobl, R.; Verbeke, T. Confidence Intervals for the Kaplan-Meier Estimator. Package ‘km.ci’ for RStudio. Available online: https://cran.r-project.org/web/packages/km.ci/km.ci.pdf (accessed on 23 October 2019).
  69. Allison, P.D. When Can You Safely Ignore Multicollinearity? Available online: https://statisticalhorizons.com/multicollinearity (accessed on 15 October 2019).
  70. Gerbing, D.W. R Data Analysis without Programming. Group, R.T.& F.: New York, NY, USA; London, UK, 2014; ISBN 9781317931669. [Google Scholar]
  71. Cox, D.R. Regression models and life-tables. J. R. Stat. Soc. Ser. B 1972, 34, 187–220. [Google Scholar] [CrossRef]
  72. Therneau, T.M.; Survival Analysis. RStudio Package ‘survival’. Available online: https://cran.r-project.org/web/packages/survival/survival.pdf (accessed on 23 October 2019).
  73. Grambsch, P.M.; Therneau, T.M. Proportional hazards tests and diagnostics based on weighted residuals. Biometrika 1994, 81, 515–526. [Google Scholar] [CrossRef]
  74. Hess, K.R. Graphical methods for assessing violations of the proportional hazards assumption in Cox regression. Stat. Med. 1995, 14, 1707–1723. [Google Scholar] [CrossRef]
  75. Ripley, B.; Venables, B.; Bates, D.M.; Hornik, K.; Gebhardt, A.; Firth, D. Package ‘MASS.’. Available online: https://cran.r-project.org/web/packages/MASS/MASS.pdf (accessed on 23 October 2019).
  76. Chen, B.E.; Jiang, W.; Tu, D. A hierarchical Bayes model for biomarker subset effects in clinical trials. Comput. Stat. Data Anal. 2014, 71, 324–334. [Google Scholar] [CrossRef]
  77. Fang, T.; Mackillop, W.; Jiang, W.; Hildesheim, A.; Wacholder, S.; Chen, B.E. A Bayesian method for risk window estimation with application to HPV vaccine trial. Comput. Stat. Data Anal. 2017, 112, 53–62. [Google Scholar] [CrossRef]
  78. Baskin, C.C.; Baskin, J.M. Seeds–Ecology, Biogeography, and, Evolution of Dormancy and Germination, 2nd ed.; Academic Press: San Diego, CA, USA, 2014; ISBN 978-0-12-416677-6. [Google Scholar]
  79. Piotto, B.; Di Noi, A. Seed Propagation of Mediterranean TREES and shrubs. APAT, Ed.; IGER SRL: Roma, Italy, 2003; ISBN 88-448-0081-0. [Google Scholar]
  80. Carta, A.; Bedini, G.; Mu, J.V. Comparative seed dormancy and germination of eight annual species of ephemeral wetland vegetation in a Mediterranean climate. Plant Biol. 2013, 214, 339–349. [Google Scholar] [CrossRef]
  81. Carta, A.; Hanson, S.; Müller, J.V. Plant regeneration from seeds responds to phylogenetic relatedness and local adaptation in Mediterranean Romulea (Iridaceae) species. Ecol. Evol. 2016, 6, 4166–4178. [Google Scholar] [CrossRef]
  82. Raquin, C.; Jung-Muller, B.; Dufour, J.; Frascaria-Lacoste, N. Rapid seedling obtaining from European ash species Fraxinus excelsior (L.) and Fraxinus angustifolia (Vahl.). Ann. For. Sci. 2002, 59, 219–224. [Google Scholar] [Green Version]
  83. Lombardo, G.; Scialabba, A.; Schicchi, R. Seed cryopreservation of Fraxinus angustifolia Vahl. Afr. J. Biotechnol. 2013, 12, 1930–1936. [Google Scholar] [Green Version]
  84. French, D.; Meilan, R. Germination trials for Asian and North American ash species. Tree Plant Notes 2013, 56, 27–34. [Google Scholar]
  85. Piotto, B.; Piccini, C. Influence of pretreatment and temperature on the germination of Fraxinus angustifolia seeds. Seed Sci. Technol. 1998, 26, 799–812. [Google Scholar]
  86. Cabra-Rivas, I.; Castro-Díez, P. Potential germination success of exotic and native trees coexisting in central Spain riparian forests. Int. J. Ecol. 2016, 2016, 7614683. [Google Scholar] [CrossRef]
  87. Gérard, P.R.; Fernández-Manjarrés, J.F.; Bertolino, P.; Dufour, J.; Raquin, C.; Frascaria-Lacoste, N. New insights in the recognition of the European ash species Fraxinus excelsior L. and Fraxinus angustifolia Vahl as useful tools for forest management. Ann. For. Sci. 2006, 63, 733–738. [Google Scholar] [CrossRef]
  88. Tilki, F.; Çiçek, E. Effects of stratification, temperature and storage on germination in three provenances of Fraxinus angustifolia subsp. oxycarpa seeds. Turk. J. Agric. For. 2005, 29, 323–330. [Google Scholar]
  89. He, H.; De Souza Vidigal, D.; Basten Snoek, L.; Schnabel, S.; Nijveen, H.; Hilhorst, H.; Bentsink, L. Interaction between parental environment and genotype affects plant and seed performance in Arabidopsis. J. Exp. Bot. 2014, 65, 6603–6615. [Google Scholar] [CrossRef] [PubMed] [Green Version]
  90. Née, G.; Xiang, Y.; Soppe, W.J.J. The release of dormancy, a wake-up call for seeds to germinate. Curr. Opin. Plant Biol. 2017, 8–14. [Google Scholar] [CrossRef] [PubMed]
  91. Zhang, L.; Tian, C.; Wang, L. Cold stratification pretreatment improves salinity tolerance in two wheat varieties during germination. Seed Sci. Technol. 2018, 46, 87–92. [Google Scholar] [CrossRef]
  92. Meng, H.; Wang, X.; Tong, S.; Lu, X.; Hao, M. Seed germination environments of Typha latifolia and Phragmites australis in wetland restoration. Ecol. Eng. 2016, 96, 194–199. [Google Scholar]
  93. Bungard, R.A.; McNeil, D.; Morton, J.D. Effects of chilling, light and nitrogen-containing compounds on germination, rate of germination and seed imbibition of Clematis vitalba L. Ann. Bot. 1997, 79, 643–650. [Google Scholar] [CrossRef]
  94. Chen, S.; Chou, S.; Tsai, C.; Hsu, W.; Baskin, C.C.; Baskin, J.M.; Chien, C.; Kuo-Huang, L. Plant physiology and biochemistry effects of moist cold stratification on germination, plant growth regulators, metabolites and embryo ultrastructure in seeds of Acer morrisonense (Sapindaceae). Plant Physiol. Biochem. 2015, 94, 165–173. [Google Scholar] [CrossRef]
  95. Miransari, M.; Smith, D.L. Plant hormones and seed germination. Environ. Exp. Bot. 2014, 99, 110–121. [Google Scholar] [CrossRef]
  96. Gai, Y.P.; Li, X.Z.; Ji, X.L.; Wu, C.A.; Yang, G.D.; Zheng, C. Chilling stress accelerates degradation of seed storage protein and photosynthetic protein during cotton seed germination. J. Agron. Crop Sci. 2008, 194, 278–288. [Google Scholar] [CrossRef]
  97. Einali, A.L.I.R.; Sadeghipour, H.R. Alleviation of dormancy in walnut kernels by moist chilling is independent from storage protein mobilization. Tree Physiol. 2007, 27, 519–525. [Google Scholar] [CrossRef]
  98. Peel, M.D.; Waldron, B.L.; Jensen, K.B.; Chatterton, N.J.; Horton, H.; Dudley, L.M. Screening for salinity tolerance in alfalfa: A repeatable method. Crop Sci. 2004, 44, 2049–2053. [Google Scholar] [CrossRef]
  99. Rajjou, L.; Duval, M.; Gallardo, K.; Catusse, J.; Bally, J.; Job, C.; Job, D. Seed germination and vigor. Annu. Rev. Plant Biol. 2012, 63, 507–533. [Google Scholar] [CrossRef] [PubMed]
  100. Zedler, J.B. Wetlands at your service: Reducing impacts of agriculture at the watershed scale. Front. Ecol. Environ. 2003, 1, 65–72. [Google Scholar] [CrossRef]
  101. Shumway, S.W.; Bertness, M. Salt stress limitation of seedling recruitment in a salt marsh plant community. Oecologia 1992, 92, 490–497. [Google Scholar] [CrossRef] [PubMed]
  102. Ungar, I.A. Halophyte seed germination. Bot. Rev. 1978, 44, 233–264. [Google Scholar] [CrossRef]
  103. Grigore, M.-N. Romanian Salt Tolerant Plants: Taxonomy and Ecology; TEHNOPRESS: Iasi, Romania, 2012; ISBN 978-973-702-923-2. [Google Scholar]
  104. González, M.B. Adaptation of halophytes to different habitats. In Seed Dormancy and Germination; IntechOpen: London, UK, 2019; pp. 1–23. [Google Scholar]
  105. Grigore, M.-N.; Toma, C. Anatomical Adaptations of Halophytes; Springer International Publishing: Cham, Switzerland, 2017; ISBN 978-3-319-66480-4. [Google Scholar]
  106. Liang, W.; Ma, X.; Wan, P.; Liu, L. Plant salt-tolerance mechanism: A review. Biochem. Biophys. Res. Commun. 2018, 495, 286–291. [Google Scholar] [CrossRef]
  107. Läuchli, A.; Grattan, S.R. Plant growth and development under salinity stress. In Advances in Molecular Breeding Toward Drought and Salt Tolerant Crops; Jenks, M.A., Hasegawa, P.M., Jain, S.M., Eds.; Springer: Dordrecht, The Netherlands, 2007; pp. 1–32. [Google Scholar]
  108. Polle, A.; Rennenberg, H. Physiological responses to abiotic and biotic stress in forest trees. Forests 2019, 10, 711. [Google Scholar] [CrossRef]
  109. Kozlowski, T.T. Responses of woody plants to flooding and salinity. Tree Physiol. Monogr. 1997, 1, 1–29. [Google Scholar] [CrossRef]
  110. Kozlowski, T.T. Responses of woody plants to human-induced environmental stresses: Issues, problems, and strategies for alleviating stress. CRC Crit. Rev. Plant Sci. 2000, 19, 91–170. [Google Scholar] [CrossRef]
  111. Gotelli, N.J.; Ellison, A.M. A Primer of Ecological Statistics; Sinauer: Sunderland, MA, USA, 2013; ISBN1 1605350648. ISBN2 9781605350646. [Google Scholar]
  112. Esechie, H.A.; Al-Saidi, A.; Al-Khanjari, S. Effect of sodium chloride salinity on seedling emergence in chickpea. J. Agron. Crop Sci. 2002, 188, 155–160. [Google Scholar] [CrossRef]
  113. Sosa, L.; Llanes, A.; Reinoso, H.; Reginato, M.; Luna, V. Osmotic and specific ion effexts on the germination of Prosopis strobulifera. Ann. Bot. 2005, 96, 261–267. [Google Scholar] [CrossRef]
  114. Hong, L.; Ping, C.; ZhaoHui, Z.; ShouWen, S.; PiJun, L.; BaoQing, W. Seeds germination of three common afforestating trees under salt and drought stress in Xinjiang. Acta Bot. Boreali-Occidentalia Sin. 2011, 31, 1466–1473. [Google Scholar]
  115. Zhang, Z.; Yu, F. Effects of Salt Stress on Seed Germination of Four Ornamental Non-halophyte Effects of Salt Stress on Seed Germination of Four Ornamental Non- halophyte Species. Int. J. Agric. Biol. 2019, 21, 47–53. [Google Scholar]
  116. Tonon, G.; Kevers, C.; Faivre-Rampant, O.; Graziani, M.; Gaspar, T. Effect of NaCl and mannitol iso-osmotic stresses on proline and free polyamine levels in embryogenic Fraxinus angustifolia callus. J. Plant Physiol. 2004, 161, 701–708. [Google Scholar] [CrossRef] [PubMed]
  117. Llanes, A.; Andrade, A.; Masciarelli, O.; Alemano, S.; Luna, V. Drought and salinity alter endogenous hormonal profiles at the seed germination phase. Seed Sci. Res. 2016, 26, 1–13. [Google Scholar] [CrossRef]
  118. Macovei, A.; Pagano, A.; Leonetti, P.; Carbonera, D.; Balestrazzi, A.; Araújo, S.S. Systems biology and genome-wide approaches to unveil the molecular players involved in the pre-germinative metabolism: Implications on seed technology traits. Plant Cell Rep. 2017, 36, 669–688. [Google Scholar] [CrossRef]
  119. Shen, X.; Wang, Z.; Song, X.; Xu, J.; Jiang, C.; Zhao, Y.; Ma, C.; Zhang, H. Transcriptomic profiling revealed an important role of cell wall remodeling and ethylene signaling pathway during salt acclimation in Arabidopsis. Plant Mol. Biol. 2014, 86, 303–317. [Google Scholar] [CrossRef]
  120. Sivritepe, N.; Sivritepe, H.O.; Eris, A. The effects of NaCl priming on salt tolerance in melon seedlings grown under saline conditions. Sci. Hortic. (Amsterdam) 2003, 97, 229–237. [Google Scholar] [CrossRef]
  121. Bajji, M.; Kinet, J.; Lutts, S. Osmotic and ionic effects of NaCl on germination, early seedling growth, and ion content of Atriplex halimus (Chenopodiaceae). Can. J. Bot. 2002, 80, 297–304. [Google Scholar] [CrossRef]
  122. Ievinsh, G. Biological basis of biological diversity: Physiological adaptations of plants to heterogeneous habitats along a sea coast. Acta Univ. Latv. 2006, 710, 53–79. [Google Scholar]
  123. Zhu, J.K. Salt and drought stress signal transduction in plants. Annu. Rev. Plant Biol. 2002, 53, 247–273. [Google Scholar] [CrossRef]
  124. Zhu, J.K. Abiotic stress signaling and responses in plants. Cell 2016, 167, 313–324. [Google Scholar] [CrossRef] [PubMed]
Figure 1. Salinity and seedling density at the three sites (S1–S3, see Table 1) in “Lame di fuori“.
Forests 10 00940 g001
Figure 2. Germination test; chilling treatments (C24 and C4) averaged over common salinity levels (N1, N50 and N150). (a) germination probability, F(t); (b) hazard rate, h(t). Mean ± 95% CI bands or bars calculated by boot.ci() function in ′boot′ R package. Values of h(t) = 0 (no germination) were not reported (e.g., C24 at week 7).
Forests 10 00940 g002
Figure 3. Cumulative germination probability, F (t), for different salinity (Nx; x = NaCl in mM) during germination (a, b) and recovery (c). Mean ± 95% confidence interval (CI) bands for N1 (light gray), N50 (diagonal stripes) and N150 (dark gray). Same symbols in all plots.
Forests 10 00940 g003
Figure 4. Hazard function, h(t), under different salinity during germination (a, b) and recovery (c). Mean ± 95% CI bars. Same symbols in all graphs. See Figure 2 for further methodological details.
Forests 10 00940 g004
Figure 5. (a) Salinity and C24 first-week germination probability, F week = 1 ; y = −0.04nsx +11.5**, r2adj = 0.633, p > 0.067, n = 5. Inset: salinity and relative germination risk for 1st week relative to final germination (in percent), %   final = 100 · F week = 1 / F ^ ; for 50–150 mM NaCl salinity range, y = 0.32* x + 40.3**, r2adj = 0.915, p < 0.029, nobs = 4. (b) Linear regression between salinity and F ^ in the trials (G = germination, R = recovery): solid bold, C24(G), r2adj = 0.77, p < 0.031*; dashed, C4, r2adj = 0.76, p < 0.034*; solid, C4(R), r2adj = 0.37, p < 0.105ns; densely dashed, C4(G+R), r2adj = 0.47, p < 0.197ns. * = p < 0.05, ** = p < 0.01.
Forests 10 00940 g005
Table 1. Descriptive statistics for soil salinity (0–20 cm) and number of Fraxinus angustifolia seedlings in “Lame di fuori“ sampling sites (S1–S3). Distance from seaside (m); N = number of samples (soil) or transects (seedlings). W = p-value for Shapiro–Wilk normality test. ECe (electrical conductivity of soil saturation extract) = soil ECEe min–max range in dS/m. % = fraction (in percent) on the total of saline (ECe ≥ 4 dS/m) soil samples.
Site(m)NMinimun–MaximumMean (SE)95% CIWECe%
soil (mM NaCl)
S18903032–9555 (2.6)a150–610.3453.1–10.296
S21210303–10238 (5.6)b28–500.0084.1–11.245
S316503018–4127 (0.8)b25–290.0092.7–4.47
Total1250903–10240 (2.4) 35–450.0012.7–11.248
seedlings (ha−1)
S1 30–500167 (96)b10–3330.001
S2 30–1500667 (226)ab167–10000.415
S3 30–25001250 (307)a583–17500.751
Total 90–2500694 (168) 389–10280.010
1 Wilcoxon test (different letters for p < 0.05).
Table 2. Summary table for Cox proportional hazards (PH) regression model and cut off values for nacl biomarker threshold (′bhm′) in germination (G) and recovery (R) trials. Cox proportional hazard assumption (PH p) rejected if p < 0.05 (in bold). Effects (Zi) tested by Wald and ′bhm′ tests (p < 0.05, in bold). Cut off values for nacl biomarker threshold (in mM NaCl) by ′bhm′ analysis and their 95% CI (in brackets).
TrialZiPH pWald p 1bhmpCut off Values (95% CI)
Complete dataset
Gnacl0.9300.0160.0111–50
(1-1) – (50-50)
chilling0.0040.0110.008
interaction0.5260.1550.218
1st week excluded
Gnacl0.5590.0300.0221–50
(1-1) – (50-50)
chilling0.3830.8300.585
interaction0.9040.6390.644
C24
Gnacl0.0140.0000.0001–75
(1-1) – (75-75)
C4
Gnacl0.6830.0090.0051–50
(1-1) – (50-50)
Rnacl0.1040.0570.02110–50
(1-10) – (50-150)
G + Rnacl0.0100.0010.0001–50
(1-1) – (10-150)
1p < 0.01 for Cox model (by likelihood ratio (LRT), Wald and logrank tests) in all trials except recovery (R: LRT, p < 0.050*; Wald, p < 0.057ns; logrank, p < 0.052ns).
Table 3. Model selection (best models in bold) by log-likelihood value (LLV), Akaike information criterion (AIC), Bayesian information criterion (BIC); df, degree of freedom. Likelihood ratio (LRT) p-value listed following the order of terms in model formula (significant terms in bold, p < 0.05).
Model 1dfLLV 2AICBICLRT p-Value
Complete dataset (Germination)
nacl + chilling + nacl × chilling1a3−906 a1818 31833 30.001, 0.011, 0.092
nacl + chilling2−907 a1819 4182940.000, 0.000
Nacl1−916 b183318380.000
Chilling1−923 d184818530.047
nacl × chilling1−922 c184618500.015
None0−925 e18501850
1st week excluded (Germination)
nacl + chilling + nacl × chilling1b3−473 a952 3967 30.003, 0.830, 0.626
nacl + chilling2−473 a951 4960 40.000, 0.605
nacl1−473 a9499540.000
chilling1−489 c9819860.034
Nacl × chilling1−479 b9599640.000
none0−492 d983983
C24 (Germination).
nacl1−609 a122012250.000
none0−618 b12361236
C4 (Germination)
nacl1−218 a4374420.000
none0−215 b451451
C4 (Recovery).
nacl1−317 a635.1637.40.037
none0−319 b637.4640.1
C4 (Germination + Recovery)
Nacl1−559 a112011250.000
none0−567 b11341134
1 VIF (variance inflaction factor), 1a(1b) nacl vs. chilling: 1.1 (1.2); nacl×chilling vs: nacl: 4.2 (4.0); chilling: 2.1 (2.2). 2 Best model selection by analysis of deviance; different letters for p < 0.05. 3 AIC (BIC) values after single term drop from model. Complete dataset (Germination): nacl × chilling, 1819 (1829); chilling, 1823 (1833); nacl, 1823 (1838). 1st week excluded (Germination) dataset: nacl × chilling, 951 (961); chilling, 950 (960); nacl, 959 (960). 4 AIC (BIC) values after single term drop from model. Complete dataset (Germination): chilling, 1833 (1838); nacl, 1848 (1852). 1st week excluded (Germination) dataset: chilling, 949 (954); nacl, 981 (986).
Table 4. Cumulative germination probability ( F ^ ) and cumulative hazard rate ( H ^ ) in percent along with their 95% CI range (in brackets). Differences between C24 and C4 for the same salinity levels (nacl, in mM) in bold (Wilcoxon p < 0.05); within each trial different letters for Wilcoxon p < 0.05. RR (= F ^ Nx / F ^ N 1 ) = relative risk respect to control.
chillingnacl F ^ (CI Range) H ^ (CI Range) RR
Germination
C24122.9 (16.5–30.8)25.0 (17.1–35.9)a1
5017.6 (12.3–24.5)18.7 (12.5–27.5)ab0.8
758.5 (5.0–14.0)8.7 (5.0–14.9)c0.4
10012.2 (7.8–18.7)12.6 (7.7–20.4)bc0.5
1506.2 (3.3–11.3)6.2 (3.2–19.1)c0.3
1+50+15015.3 (12.2–19.0)16.1 (12.5–20.6)
C4112.1 (8.3–17.4)12.8 (8.5–19.0)a1
1015.2 (8.4–25.7)16.0 (8.5–29.4)a1.3
506.1 (2.4–14.6)6.2 (2.4–15.7)a0.5
1500.00.0.b0
1+50+1508.5 (5.9–12.0)8.8 (6.1–12.7)
Recovery
C4115.7 (11.0–21.9)16.7 (11.3–24.3)b1
1028.6 (18.4–41.5)32.2 (19.1–52.3)a1.8
509.7 (4.5–19.6)10.0 (4.5–21.6)b0.6
1509.1 (4.2–18.5)9.4 (4.2–20.3)b0.6
1+50+15013.0 (9.7–17.3)13.4 (9.9–18.7)
Germination + Recovery
C4126.0 (20.4–32.6)29.6 (22.2–38.9)ab1
1039.4 (28.5–51.5)48.0 (31.7–70.4)a1.5
5015.2 (8.4–25.7)16.2 (8.6–29.5)bc0.6
1509.1 (4.2–18.4)9.4 (4.2–20.3)c0.3
1+50+15020.4 (16.4–25.1)22.5 (17.6–28.6)

