Article

Atypical Pattern of Soil Carbon Stocks along the Slope Position in a Seasonally Dry Tropical Forest in Thailand

by
Masamichi Takahashi
1,2,*,
Keizo Hirai
1,
Dokrak Marod
3,
Somchai Anusontpornperm
4,
Pitayakon Limtong
5,
Chaveevan Leaungvutivirog
5 and
Samreong Panuthai
6
1
Forestry and Forest Products Research Institute, 1 Matsunosato, Tsukuba, Ibaraki 305-8687, Japan
2
Japan International Forestry Promotion and Cooperation Center, Rinyu Bldg., 1-7-12 Koraku, Bunkyo-ku, Tokyo 112-0004, Japan
3
Faculty of Forestry, Kasetsart University, Chatuchak, Bangkok 10900, Thailand
4
Faculty of Agriculture, Kasetsart University, Chatuchak, Bangkok 10900, Thailand
5
Land Development Department, Chatuchak, Bangkok 10900, Thailand
6
National Park, Wildlife, and Plant Conservation Department, Chatuchak, Bangkok 10900, Thailand
*
Author to whom correspondence should be addressed.
Forests 2019, 10(2), 106; https://doi.org/10.3390/f10020106
Submission received: 28 December 2018 / Revised: 16 January 2019 / Accepted: 24 January 2019 / Published: 29 January 2019

Abstract

:
The pattern of soil carbon stock is atypical along the slope position in a seasonally dry tropical forest; the mean stock values increase from the lower, middle, to upper slopes, at 11.5, 13.2, and 15.5 kg m−2, respectively. In sloping landscapes, soil organic carbon tends to accumulate in lower slopes, but our previous soil respiration study suggested that soil carbon stock distribution along the slope position in seasonally dry tropical forests is atypical. The aims of this study were: (i) to examine whether the atypical pattern occurs widely in the watershed; and (ii) to examine the pattern of root development in the soil profile as a source of soil carbon. The density and stock of soil carbon in three soil layers (0–10, 10–30, and 30–100 cm) of 13 soil profiles were compared in different positions on the slope (upper, middle, and lower). Root biomass at each slope position was also determined. Soil carbon density in each layer increased significantly with an increase in the relative position of the slopes, particularly in the 10–30 cm soil layer. The density of medium root (3–10 mm in diameter) in the upper slopes was significantly higher than that in the middle and lower slopes, especially for 15–60 cm soil layers. The atypical pattern of soil carbon accumulation along the slope position occurred widely in the studied watershed and appeared to be caused by the development of root systems in deeply weathered soil under xeric soil conditions in the upper slopes. Roots of bamboo undergrowth may also contribute to soil carbon stabilization by reducing soil erosion in the surface soil.

Graphical Abstract

1. Introduction

Soil is the largest terrestrial carbon reservoir [1]; the distribution of soil organic carbon in terrestrial ecosystems has, therefore, attracted considerable interest from the perspective of global carbon budget study [2]. However, soil carbon stocks are highly variable, particularly in sloping landscapes such as hills and mountains.
In forest ecosystems, soil organic carbon tends to accumulate in the lower slopes because of deposition of eroded materials from upper slopes, large biomass production, and chemical stabilization by soil minerals [3,4]. For example, in the brown forest soils of Japan, the upper-slope stock is 17.2 kg C m−2 up to depths of 100 cm, whereas the lower-slope stock is 22.0 kg C m−2 [5]. Such general tendency has been reported in many countries, including a hill evergreen forest in North Thailand [6] and a mature mesophytic forest in Kentucky, USA [7]. However, an atypical tendency, i.e., high carbon stock in the upper slopes and vice versa, has sometimes been reported, for instance, in a lowland evergreen broad-leaved forest in Taiwan [8], seasonal dry tropical forest in India [9], and tropical forest in a steepland of Puerto Rico [10].
In our previous studies on soil respiration at different positions on the slope (lower, upper, and ridge) in a seasonally dry tropical forest in Thailand [11,12], we found that carbon release rates by heterotrophic respiration are lower, whereas those by root respiration are higher, in a ridge and an upper slope position than they are in a lower slope position. Further, the distribution of soil carbon stock was found to be atypical, in that the stock was larger in the ridge than in the lower slope, which could be attributed to the differences in carbon cycling among slope positions.
Our aim in this study was to examine the reasons for this atypical distribution of carbon stock. We speculated that the atypical pattern of soil carbon stock is distributed in the whole watershed because soil carbon cycling is restricted by the soil moisture conditions, which are influenced by the slope position of a small watershed unit [13,14]. We also assumed that root development, being responsive to soil moisture conditions, influences the variation in soil carbon accumulation. To verify these conjectures, we aimed to compare the densities and stocks of soil carbon and root biomass among different slope positions in a seasonally dry tropical forest.

2. Materials and Methods

2.1. Study Site

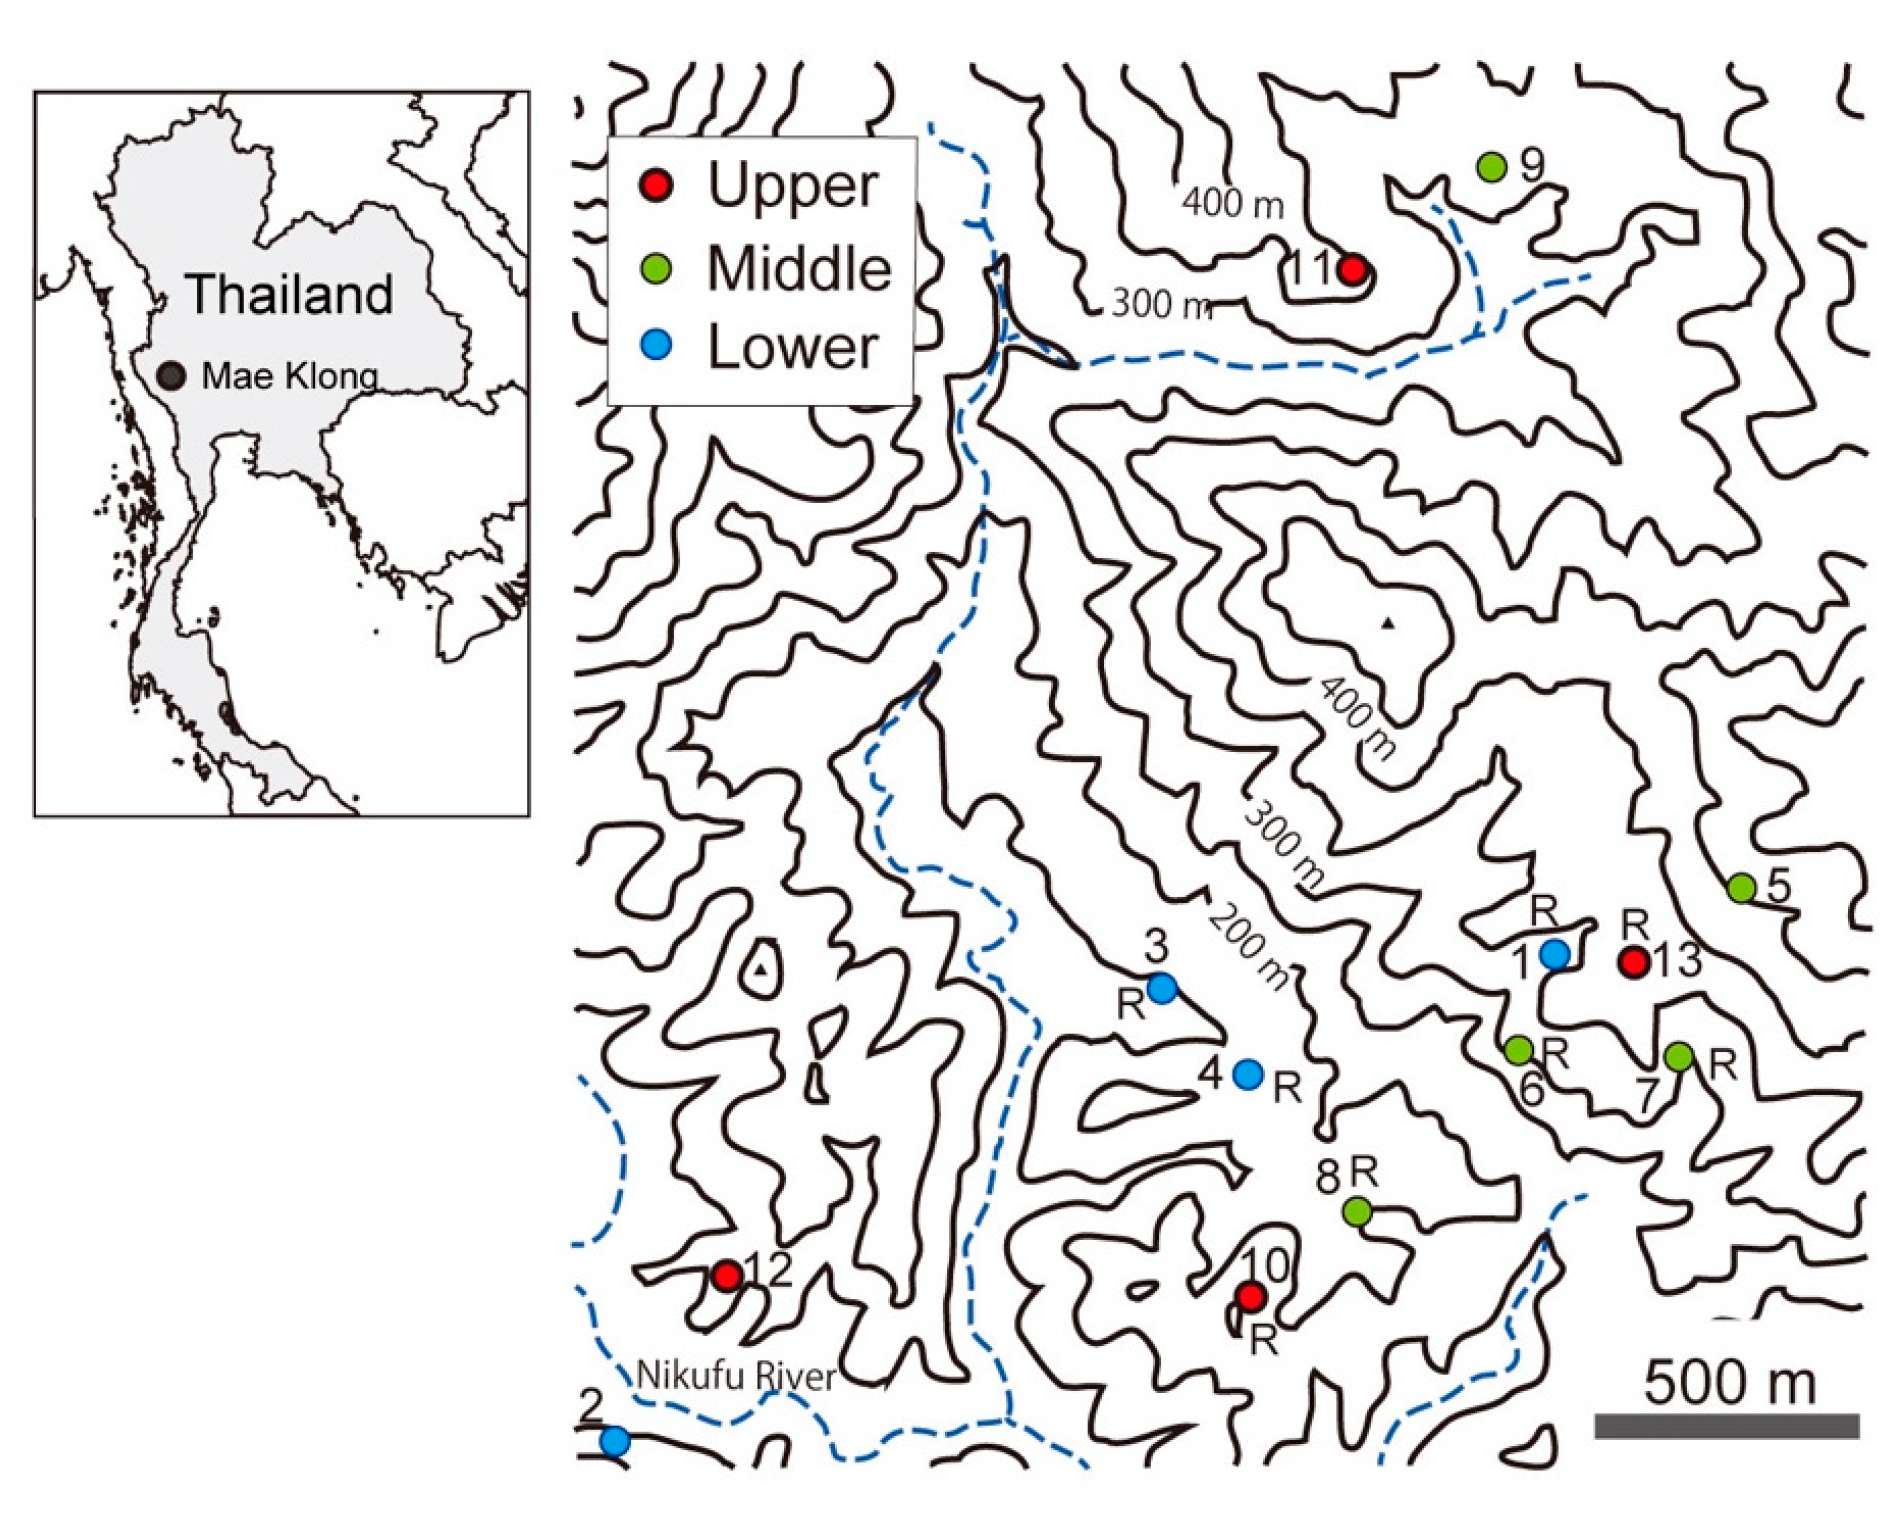
The soil survey was conducted at the Mae Klong Watershed Research Station (14°35′ N, 98°52′ E), Kanchanaburi Province, Thailand [12]. The annual mean air temperature and precipitation of the watershed are 25 °C and 1660 mm, respectively, and the rainy season is from April to October [15]. The average soil moisture contents (0–30 cm layer) in the upper and lower slopes were, respectively, 0.225 and 0.211 m3 m−3 in the rainy season and 0.127 and 0.157 m3 m−3 in the dry season [12]. The seasonally dry tropical forest is classified as mixed deciduous forest (MDF) type, in which the predominant tree species are Shorea siamensis, Vitex peduncularis, and Dillenia parviflora var. kerrii [16]. The understory vegetation is characterized by dense bamboo species [11]. The soil is deeply weathered and well drained, and the predominant soil types are Haplustalfs and Paleustalfs [17]. The contents (mean ± standard deviation) of clay, silt, and sand in the B horizons, regardless of the soil type, are 385 ± 140, 215 ± 109, and 398 ± 161 g kg−1, respectively [18]. The clay mineralogy primarily consists of kaolinite and small quantities of illite.

2.2. Soil Survey and Slope Positions

We used 13 soil profiles reported previously to calculate carbon stock in the soil [11,18,19,20]. The sites of soil pits were classified according to the relative height of the slope in a small watershed unit into upper, middle, and lower. These positions differ in the relative dryness of soil in the watershed. The locations of the soil sampling sites are shown in Figure 1.

2.3. Determination of the Density and Stock of Soil Carbon

Soil samples were collected from the soil horizons identified by the soil profile description. The dry bulk density of the soil horizon was measured in a cylindrical core (4 cm high × 100 cm2). Organic carbon concentration in the fine soil (<2 mm) was analyzed using a dry combustion method (Sumigraph NC-22F; Sumika Chemical Analysis Service, Ltd. Tokyo, Japan). All data are expressed on an oven-dry basis (105 °C) (Hot Air Circulating Oven, GT-150PS, ALP CO., Ltd, Tokyo, Japan).
Soil carbon density was calculated from the concentration of carbon and dry bulk density of the soil horizons as follows:
Soil carbon density (kgC m−3) = CC (kgC kg−1) × DBD (kg m−3),
where CC is the carbon concentration of the fine soil in the soil horizon, and DBD is the dry bulk density of the soil horizon.
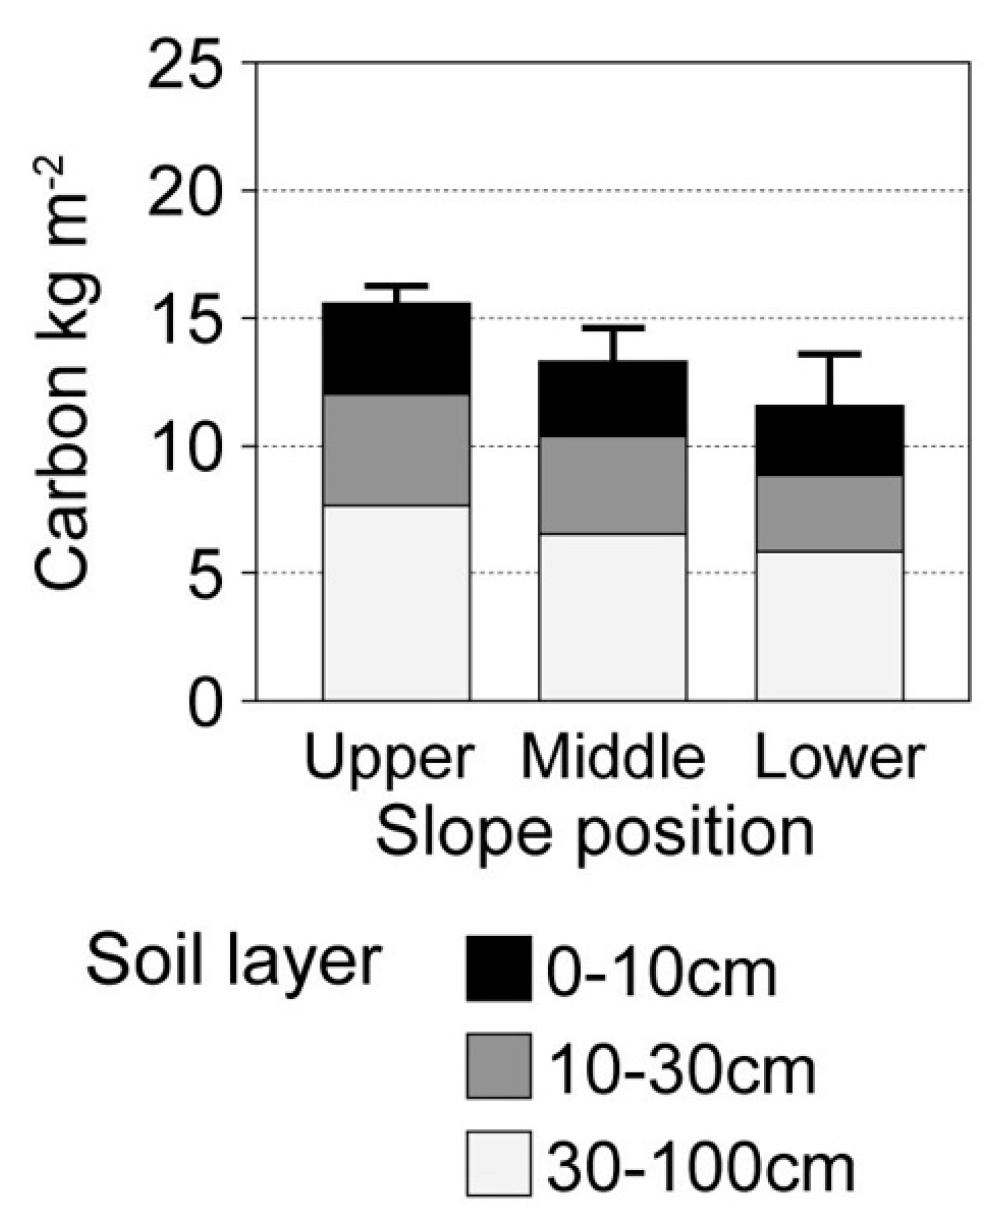
To compare uniform soil depths, carbon stock in the 0–10 cm (surface), 10–30 cm (subsurface), and 30–100 cm (deep) soil layers was calculated by apportioning the soil horizons. The volume of stones and gravel (>2 mm) was ignored, because their average volume was 0.013 m3 m−3, ranging from 0.001 to 0.030 m3 m−3, in the soil layers.

2.4. Root Density and Biomass Measurement

During the dry season, root density (dry root weight in a unit volume, kg m−3) and biomass (dry root weight in a sampling layer, kg m−2) within a 15 cm × 15 cm area in the 0–15, 15–30, 30–60, 60–90, and 90–120 cm soil layers was measured in triplicate in a soil profile using the method described by Takahashi et al. [12]. Dead roots were removed, and bamboo roots were separated by visual inspection. Measurements were performed at three soil profiles in the lower slopes, three profiles in the middle slopes, and two profiles in the upper slopes. The roots were divided according to their diameter into <1, 1–3, 3–5, 5–10, and >10 mm, and their dry weights at 70 °C were determined.

2.5. Statistical Analysis

The effects of soil layers and slope positions on mean carbon density, dry bulk density, and root density were assessed using two-way analysis of variance (ANOVA). The difference between the slope positions in total soil carbon stocks and root biomass in the soil profiles were analyzed using one-way ANOVA. Because of the differences in the number of pits at each slope position, type III sum of squares was used for the ANOVA. When the result of ANOVA detected a significant difference, a post-hot multiple comparison, the Shaffer’s modified sequentially rejective Bonferroni procedure, was performed. All statistical analyses were performed using R statistical software v. 3.4.0 [21].

3. Results

3.1. Density of Soil Carbon

We detected significant differences in mean soil carbon density among the slope positions and soil layers (Table 1). The carbon density in each layer increased with increasing slope positions throughout the soil profiles, but the 10–30 cm soil layers of the upper slopes showed relatively larger increments in the density. The ratios of carbon densities in the upper slopes to those in the lower slope positions were 1.30, 1.47, and 1.31 for the surface, subsurface, and deep layers, respectively. At all slope positions, carbon densities in the surface layers were three-fold higher than those in the deep layers.
The soil bulk density ranged from 977 to 1243 kg m−3; however, there were no significant differences among the means for each slope position (Table 1). There were significant differences in the vertical changes in bulk densities, with densities in the surface soil layers being lower in the upper and middle slopes (Appendix A, Table A1). Data on carbon stock in each soil layer and total carbon stock in each pit are provided in Appendix A (Table A2).

3.2. Density and Biomass of Roots

The root densities were significantly affected by the soil layers depth for all root diameter classes. On the other hand, slope positions had a significant effect only on medium roots (Table 2). The fine root (<3 mm in diameter) density was high in the 0–15 cm layer and decreased with soil depth for all slope positions. The density of medium roots was significantly higher in the upper position than in the middle and lower slopes, especially in the layers of 15–60 cm (Table 2 and Table A3). Coarse roots were abundant in the 0–60 cm range for the three slope positions; in deeper layers (60–120 cm), coarse roots were detected only in the middle slope position (Table 2). The total root biomass in the 0–120 cm depth range tented to be higher in the upper position than lower slopes, despite no significant difference being observed (p = 0.64); the average root biomass in the upper position was 56% higher than that in the lower slopes (Table 3). Bamboo roots, which are relatively hard, fine (<1 mm in diameter), and whitish, were distributed down to the deep layer, and their biomass composed almost half of fine root biomass. In the middle slopes, bamboo roots accounted for 69% of total fine roots throughout the soil profiles.

3.3. Stock of Soil Carbon

The total soil carbon stock up to depths of 100 cm ranged from 10.7 to 17.8 kg m−2, with an average of 13.4 kg m−2 (Appendix A, Table A2). The carbon stock increased significantly with an increase in slope position, with mean stock values in the lower, middle, and upper slopes being 11.5, 13.2, and 15.5 kg m−2, respectively (Figure 2).

4. Discussion

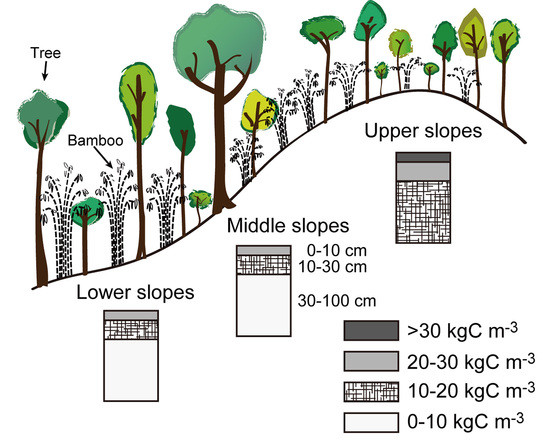
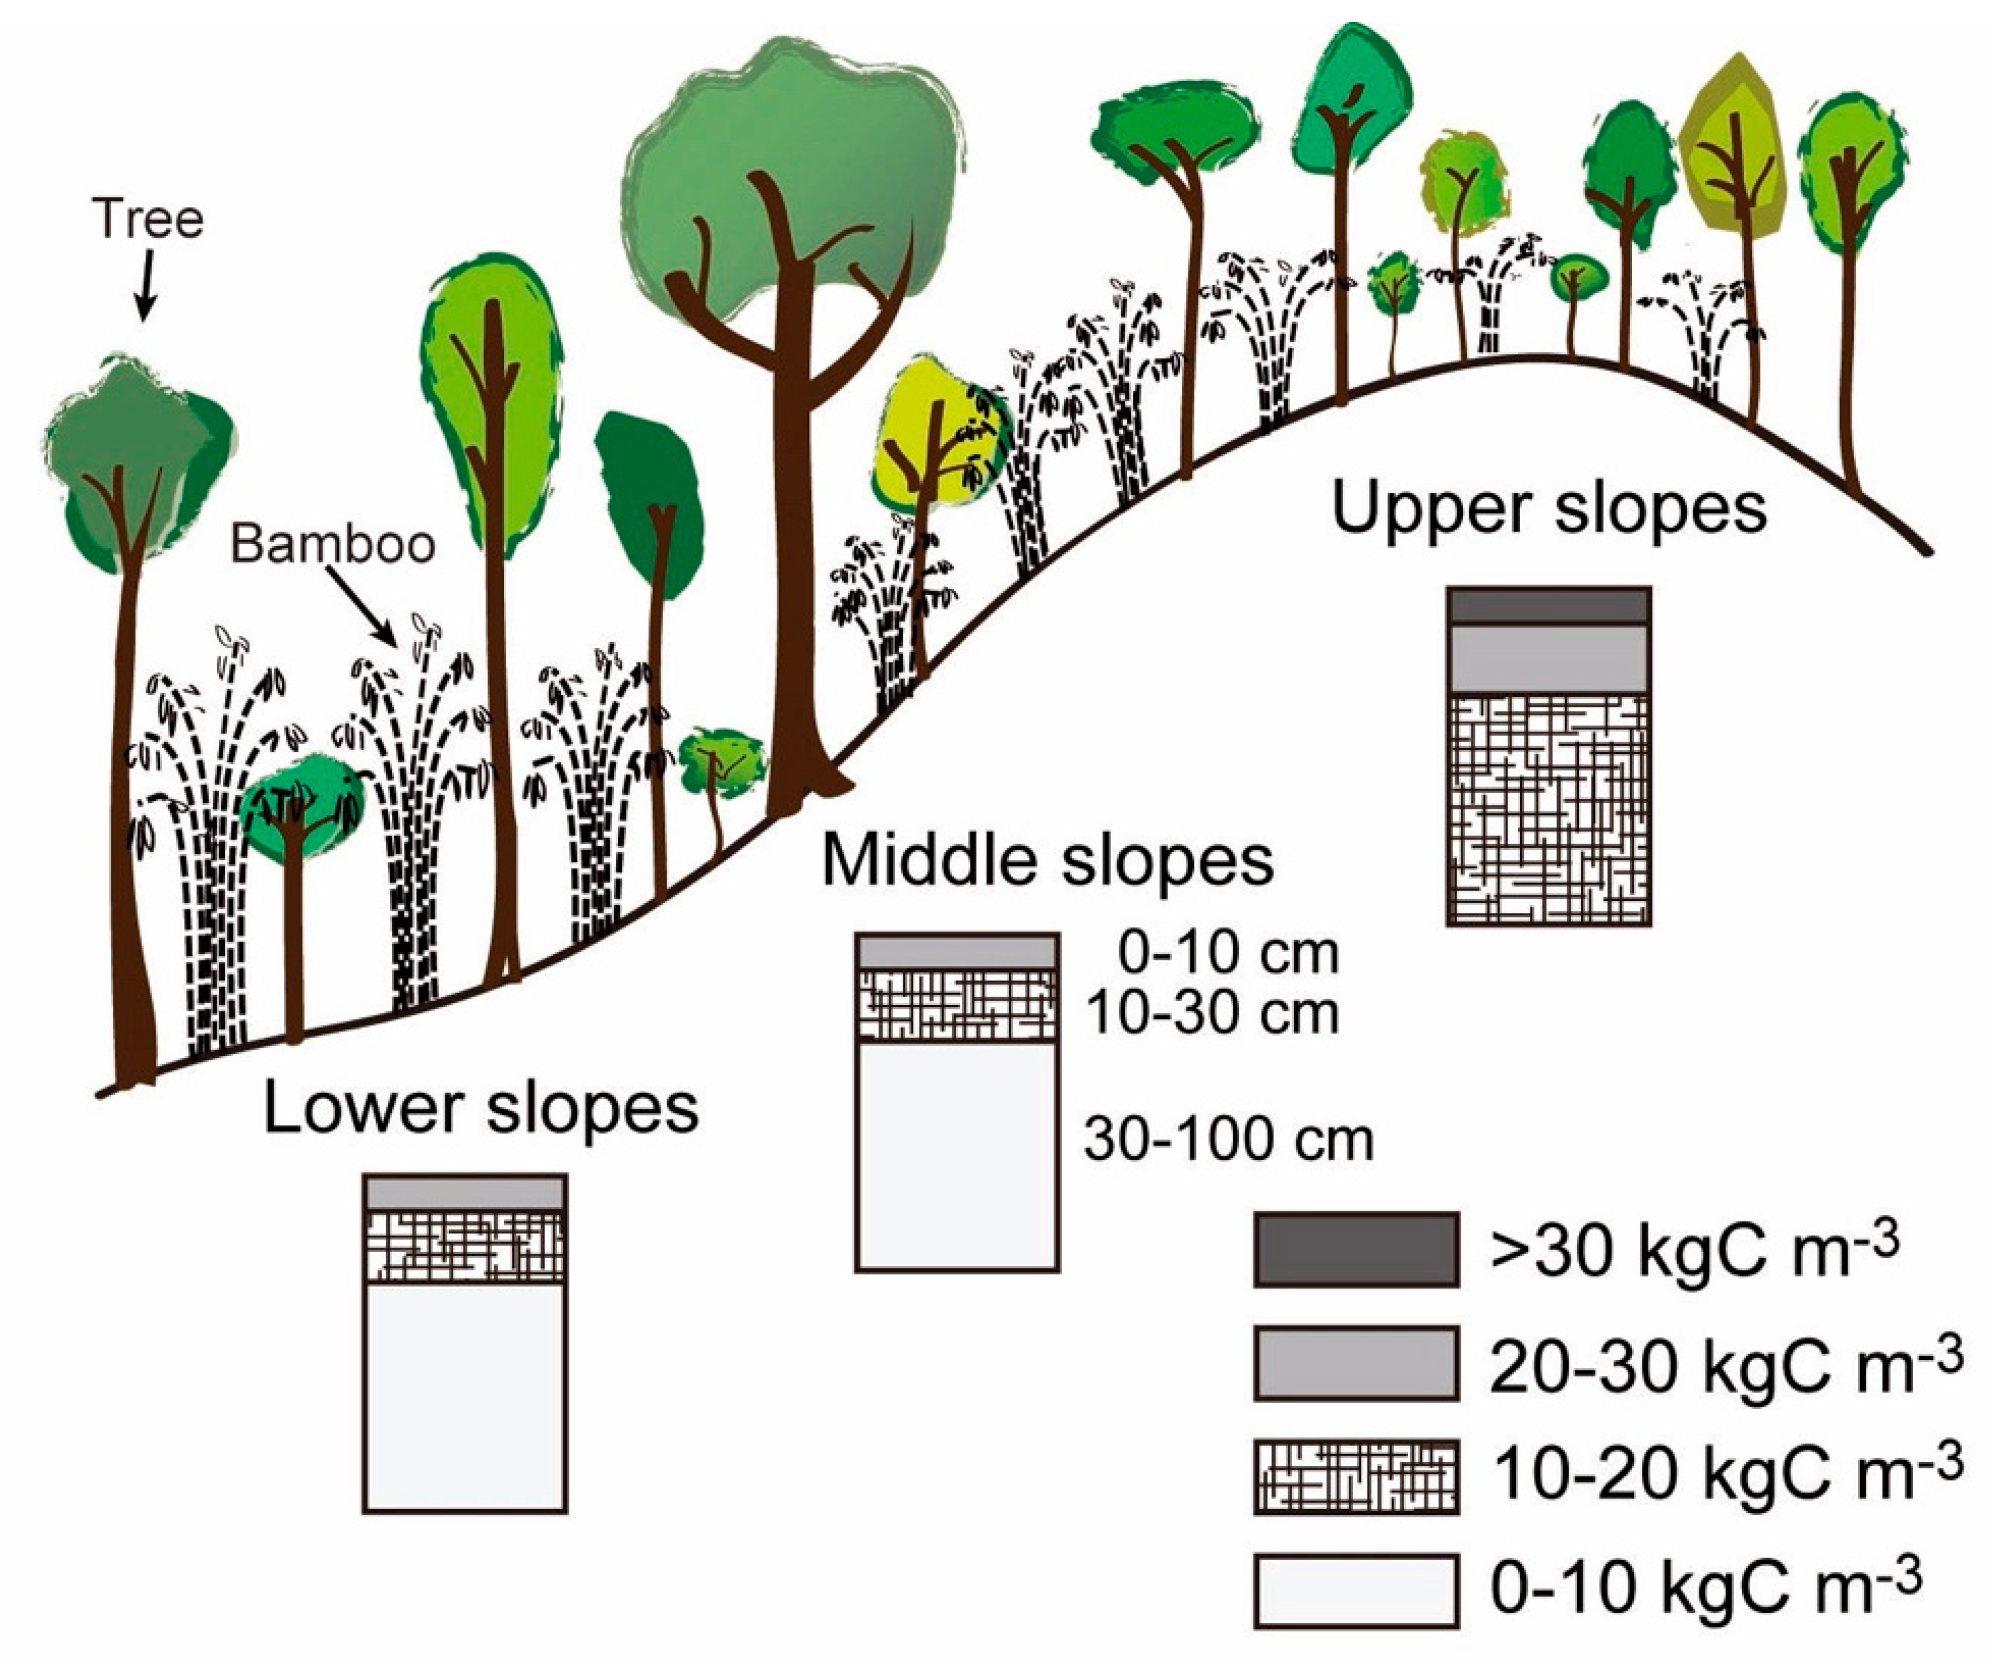
We speculated that the upper slopes (relatively drier sites) of a small watershed unit have higher soil carbon stocks than the lower slopes. We verified this hypothesis in the watershed where we carried out our study. This atypical pattern of soil carbon accumulation was probably because of the differences in soil carbon cycling along the hillslope, as observed in our previous soil respiration study [12].
Roots can be an important source, both directly and indirectly, of soil organic matter. In the present study, the average root density of the medium size class in the upper slopes was significantly higher than that in the middle and lower slopes. The development of root systems in the upper slopes might be induced by the responses of tree physiology to dry soil conditions. Under dry soil conditions, photosynthates are preferentially translocated to the belowground parts of plants, thus enhancing the development of long, large root systems that can obtain water from an extensive soil area [22,23]. Not only the fine roots with short turnover rates but also the coarse roots can be a source of carbon after their death. Indeed, biomass of the medium and coarse roots was abundant in the 15–60 cm layers, especially in the upper and middle slopes (Table 3). This high root biomass might contribute to relatively large carbon accumulation in the subsurface soil layers. Further, when coarse roots die and decompose, they create macropores in the soil, which have been recognized to constitute a pathway for carbon migration in deep soil layers [24]. In addition, root exudates and symbiotic fungi can also be sources of carbon in the soil [25,26].
Regarding root decomposition, Rasse et al. [27] reported that the mean residence time of soil carbon derived from roots is 2.4-fold longer than that derived from aboveground biomass. Furthermore, with respect to soil moisture conditions, Fujimaki et al. [28] showed that decomposition of the dead fine roots of Hopea ferrea was faster in a mesic site than in a xeric site in Northern Thailand. Thus, decomposition of roots is expected to be slow in the upper slopes, resulting in the accumulation of soil carbon.
From the perspective of evaluating soil carbon distribution, it is important to take into consideration soil erosion on a slope [3,29]. According to the erosion risk evaluated using the Universal Soil Loss Equation (USLE) [30], the C factor (a factor for the relative effectiveness of cover management in terms of preventing soil loss) is low in Thai forests, with values of 0.02 for MDFs and 0.015 for bamboo forests [31,32]. Zhou et al. [33] indicated that fibrous bamboo root systems that develop in the surface soil protect the soil from the risk of erosion. In Thailand, MDFs are often accompanied by bamboo undergrowth, which may also stabilize the surface soil via root development. Indeed, in the middle slopes, which are steeper than the upper and lower slopes, the abundant bamboo roots might play an important role in preventing sheet erosion. In addition, bamboo species enhance soil carbon sequestration via the occlusion of carbon in silica phytoliths [34]. Further study, however, is needed to examine the effects of bamboos in enhancing soil carbon accumulation via physical and chemical processes.
Low erosion risk will result in stable stand conditions, which might enable trees to develop large root systems in the soil. In Puerto Rican tabonuco forests, there is a high accumulation of soil carbon along ridges [10]; these are aged forests in which the stable conditions have allowed large root systems to form. In contrast, the forests on the slopes are young and accumulate low soil carbon because of erosion [10]. In Thailand, MDFs generally establish on deeply weathered and well-drained soils in limestone areas [35,36]. Thus, stable and deeply weathered soils might be a basic requirement for high accumulation of soil carbon by developing large root systems. Indeed, in the watershed, we observed that, if the soil is shallow on steep slopes or narrow ridges, the soil carbon stock is low, leading to the establishment of a different forest type, i.e., dry dipterocarp forest.

5. Conclusions

We detected atypical soil carbon accumulation patterns in an MDF in the Mae Klong Watershed, Thailand, wherein large soil carbon stocks accumulated in the upper slopes, while low carbon stocks were present in the lower slopes. This pattern can probably be attributed to differences in soil carbon cycling associated with the development of root systems and the decomposition of soil organic carbon, which is restricted by soil moisture gradient along slopes. Bamboo undergrowth may also contribute to soil carbon accumulation by decreasing the likelihood of surface soil erosion. The findings of the present study illustrate the trend in soil carbon densities along the hillslopes in the MDF in the watershed (Figure 3). The possibility that this atypical pattern of soil carbon distribution occurs in other MDFs needs to be examined further, because the floristics and structure of MDFs in Thailand vary with altitude, soil quality, and bamboo co-existence [36].

Author Contributions

Project administration and conceptualization, M.T., K.H., and P.L.; funding acquisition, M.T., K.H., and P.L.; soil survey, S.A., K.H., and M.T.; soil analysis, S.A., K.H., and C.L.; vegetation analysis, D.M.; project site administration, S.P.; and data analysis and writing, M.T.

Funding

The study was supported by the National Research Council of Thailand. The project was partly funded by JSPS KAKENHI 18255011. Data were compiled for the Global Environment Research Account for National Institutes (Advancement of East Asia Forest Dynamics Plot Network), Ministry of the Environment Japan.

Acknowledgments

The authors warmly thank K. Ishizuka, S. Kobayashi, T. Nakashizuka, U. Kutintara, C. Yarwudhi, and H. Tanaka for their valuable suggestions and support in the fieldwork. S. Yoshinaga helped to identify clay mineralogy.

Conflicts of Interest

The authors declare no conflict of interest.

Appendix A

Table A1. The p values of the multiple comparisons of factors, slope positions and soil layers, for soil carbon density and dry bulk density by the Shaffer’s modified sequentially rejective Bonferroni procedure.
FactorsCarbon Density
Slope positionMiddleLower
Upper0.0720.027
Middle 0.20
Carbon density
Soil layer10–30 cm30–100 cm
0–10 cm<0.0001<0.0001
10–30 cm <0.0001
Dry bulk density
Soil layer10–30 cm30–100 cm
0–10 cm0.0030.003
10–30 cm 0.44
Table A2. Soil carbon stocks in the surveyed soil pits. Soil pit numbers refer to those indicated in the map shown in Figure 1.
PositionPit No.LayerCarbon Stock (kg C m−2)
Lower20–10 cm3.35
10–30 cm3.01
30–100 cm5.29
0–100 cm11.65
30–10 cm2.45
10–30 cm2.60
30–100 cm5.72
0–100 cm10.76
40–10 cm2.62
10–30 cm2.98
30–100 cm6.76
0–100 cm12.36
90–10 cm2.76
10–30 cm2.71
30–100 cm6.15
0–100 cm11.62
Middle10–10 cm3.08
10–30 cm5.12
30–100 cm6.89
0–100 cm15.09
50–10 cm2.41
10–30 cm3.30
30–100 cm5.56
0–100 cm11.27
60–10 cm2.75
10–30 cm4.59
30–100 cm5.67
0–100 cm13.00
70–10 cm2.65
10–30 cm2.89
30–100 cm7.06
0–100 cm12.6
80–10 cm3.31
10–30 cm3.76
30–100 cm6.81
0–100 cm13.88
Upper100–10 cm2.85
10–30 cm4.56
30–100 cm7.27
0–100 cm14.67
110–10 cm4.35
10–30 cm4.79
30–100 cm7.28
0–100 cm16.42
120–10 cm4.01
10–30 cm4.65
30–100 cm9.12
0–100 cm17.78
130–10 cm2.92
10–30 cm3.43
30–100 cm6.81
0–100 cm13.15
Table A3. The p values of the multiple comparisons of factors, slope positions and soil layers, for root densities by the Shaffer’s modified sequentially rejective Bonferroni procedure.
RootFine Roots
Soil layer15–30 cm30–60 cm60–90 cm90–120 cm
0–15 cm0.001<0.001<0.0001<0.0001
15–30 cm 0.0030.00010.0001
30–60 cm 0.0040.004
60–90 cm 0.66
Middle roots
Slope positionMiddleLower
Upper0.040.04
Middle 0.86
Soil layer15–30 cm30–60 cm60–90 cm90–120 cm
0–15 cm0.180.420.060.03
15–30 cm 0.820.030.02
30–60 cm 0.140.09
60–90 cm 0.75
Coarse roots
Soil layer15–30 cm30–60 cm60–90 cm90–120 cm
0–15 cm0.310.980.050.07
15–30 cm 0.280.030.04
30–60 cm 0.060.08
60–90 cm 0.49

References

  1. Scharlemann, J.P.; Tanner, E.V.; Hiederer, R.; Kapos, V. Global soil carbon: Understanding and managing the largest terrestrial carbon pool. Carbon Manag. 2014, 5, 81–91. [Google Scholar] [CrossRef]
  2. Lal, R. Soil carbon sequestration to mitigate climate change. Geoderma 2004, 123, 1–22. [Google Scholar] [CrossRef]
  3. Berhe, A.A.; Harte, J.; Harden, J.W.; Torn, M.S. The significance of the erosion-induced terrestrial carbon sink. BioScience 2007, 57, 337–346. [Google Scholar] [CrossRef]
  4. Doetterl, S.; Stevens, A.; Six, J.; Merckx, R.; van Oost, K.; Pinto, M.C.; Casanova-Katny, A.; Muñoz, C.; Boudin, M.; Venegas, E.Z.; et al. Soil carbon storage controlled by interactions between geochemistry and climate. Nat. Geosci. 2015, 8, 780–783. [Google Scholar] [CrossRef]
  5. Morisada, K.; Ono, K.; Kanomata, H. Organic carbon stock in forest soils in Japan. Geoderma 2004, 119, 21–32. [Google Scholar] [CrossRef]
  6. Pampasit, S.; Khamyong, S.; Breulmann, G.; Ninomiya, I.; Ogino, K. Mineral Element Accumulation in Soils and Trees in Tropical Hill Evergreen Forest, Northern Thailand. Tropics 2000, 9, 275–286. [Google Scholar] [CrossRef]
  7. Thompson, J.A.; Kolka, R.K. Soil carbon storage estimation in a forested watershed using quantitative soil-landscape modeling. Soil Sci. Soc. Am. J. 2005, 69, 1086–1093. [Google Scholar] [CrossRef]
  8. Tsui, C.-C.; Chen, Z.-S.; Hsieh, C.-F. Relationships between soil properties and slope position in a lowland rain forest of southern Taiwan. Geoderma 2004, 123, 131–142. [Google Scholar] [CrossRef]
  9. Raghubanshi, A.S. Effect of topography on selected soil properties and nitrogen mineralization in a dry tropical forest. Soil Biol. Biochem. 1992, 24, 145–150. [Google Scholar] [CrossRef]
  10. Johnson, K.D.; Scatena, F.N.; Silver, W.L. Atypical soil carbon distribution across a tropical steepland forest catena. Catena 2011, 87, 391–397. [Google Scholar] [CrossRef]
  11. Takahashi, M.; Furusawa, H.; Limtong, P.; Sunanthapongsuk, V.; Marod, D.; Panuthai, S. Soil nutrient status after bamboo flowering and death in a seasonal tropical forest in western Thailand. Ecol. Res. 2007, 22, 160–164. [Google Scholar] [CrossRef]
  12. Takahashi, M.; Hirai, K.; Limtong, P.; Leaungvutivirog, C.; Panuthai, S.; Suksawang, S.; Anusontpornperm, S.; Marod, D. Topographic variation in heterotrophic and autotrophic soil respiration in a tropical seasonal forest in Thailand. Soil Sci. Plant Nutr. 2011, 57, 452–465. [Google Scholar] [CrossRef] [Green Version]
  13. Western, A.W.; Zhou, S.L.; Grayson, R.B.; McMahon, T.A.; Blöschl, G.; Wilson, D.J. Spatial correlation of soil moisture in small catchments and its relationship to dominant spatial hydrological processes. J. Hydrol. 2004, 286, 113–134. [Google Scholar] [CrossRef]
  14. Rosenbaum, U.; Bogena, H.R.; Herbst, M.; Huisman, J.A.; Peterson, T.J.; Weuthen, A.; Western, A.W.; Vereecken, H. Seasonal and event dynamics of spatial soil moisture patterns at the small catchment scale. Water Resour. Res. 2012, 48, W10544. [Google Scholar] [CrossRef]
  15. Panuthai, S.; Orasa, S.; Deesaeng, B.; Marod, D. Hydrological characteristics study of Maeklong head watershed on land use changes, Kanchanaburi province, Thailand. In Proceedings of the International Workshop on Ecological Knowledge for Adaptation on Climate Change, Sri Nakhon Khuen Khan Park, Samut Prakarn Province, Thailand, 2–3 December 2013; Aksornsiam Limited Company: Bangkok, Thailand, 2013; pp. 62–65. Available online: http://t-fern.forest.ku.ac.th/iDocument/inter_page15.pdf (accessed on 16 January 2019).
  16. Marod, D.; Kutintara, U.; Yarwudhi, C.; Tanaka, H.; Nakashizuka, T. Structural dynamics of a natural mixed deciduous forest in western Thailand. J. Veg. Sci. 1999, 10, 777–786. [Google Scholar] [CrossRef]
  17. Soil Survey Staff. Keys to Soil Taxonomy, 8th ed.; USDA Natural Resources Conservation Service: Washington, DC, USA, 1998.
  18. Anusontpornperm, S.; Kheoruenromne, I. Soil under various conditions of land use change from tropical forests. In Proceedings of the FORTROP’96: Tropical Forestry in the 21th Century, 25–28 November 1996; Kasetsart University: Bangkok, Thailand, 1996; Volume 2, pp. 156–170. [Google Scholar]
  19. Takahashi, M.; Hirai, K.; Limtong, P.; Leaungvutivirog, C.; Suksawang, S.; Panuthai, S.; Anusontpornperm, S.; Marod, D. Soil respiration in different ages of teak plantations in Thailand. JARQ 2009, 43, 337–343. [Google Scholar] [CrossRef]
  20. Hirai, K.; Takahashi, M.; Limtong, P.; Suksawang, S.; Toriyama, J.; Kiyono, Y.; Sato, T. The changes of soil carbon stock following forest degradation in tropical monsoon forest in southeast Asia. In Proceedings of the International Workshop on Ecological Knowledge for Adaptation on Climate Change, Sri Nakhon khuen khan Park, Samut Prakarn Province, Thailand, 2–3 December 2013; Aksornsiam Limited Company: Bangkok, Thailand, 2013; pp. 42–43. Available online: http://t-fern.forest.ku.ac.th/iDocument/inter_page10.pdf (accessed on 16 January 2019).
  21. R Core Team. R: A Language and Environment for Statistical Computing; R Foundation for Statistical Computing: Vienna, Austria, 2018. [Google Scholar]
  22. Paz, H. Root/Shoot allocation and root architecture in seedlings: Variation among Forest Sites, Microhabitats, and Ecological Groups. Biotropica 2003, 35, 318–332. [Google Scholar] [CrossRef]
  23. Markesteijn, L.; Poorter, L. Seedling root morphology and biomass allocation of 62 tropical tree species in relation to drought-and shade-tolerance. J. Ecol. 2009, 97, 311–325. [Google Scholar] [CrossRef]
  24. Rumpel, C.; Kögel-Knabner, I. Deep soil organic matter—A key but poorly understood component of terrestrial C cycle. Plant Soil 2011, 338, 143–158. [Google Scholar] [CrossRef]
  25. Brant, J.B.; Myrold, D.D.; Sulzman, E.W. Root controls on soil microbial community structure in forest soils. Oecologia 2006, 148, 650–659. [Google Scholar] [CrossRef]
  26. Sanaullah, M.; Chabbi, A.; Leifeld, J.; Bardoux, G.; Billou, D.; Rumpel, C. Decomposition and stabilization of root litter in top-and subsoil horizons: What is the difference? Plant Soil 2011, 338, 127–141. [Google Scholar] [CrossRef]
  27. Rasse, D.P.; Rumpel, C.; Dignac, M.F. Is soil carbon mostly root carbon? Mechanisms for a specific stabilisation. Plant Soil 2005, 269, 341–356. [Google Scholar] [CrossRef]
  28. Fujimaki, R.; Takeda, H.; Wiwatiwitaya, D. Fine root decomposition in tropical dry evergreen and dry deciduous forests in Thailand. J. For. Res. Jpn. 2008, 13, 338–346. [Google Scholar] [CrossRef]
  29. Yoo, K.; Amundson, R.; Heimsath, A.M.; Dietrich, W.E. Spatial patterns of soil organic carbon on hillslopes: Integrating geomorphic processes and the biological C cycle. Geoderma 2006, 130, 47–65. [Google Scholar] [CrossRef]
  30. Wischmeier, W.H.; Smith, D.D. Predicting Rainfall Erosion Losses—A Guide to Conservation Planning; USDA, Science and Education Administration: Hyattsville, MD, USA, 1978.
  31. Land Development Department. Land Development Department Soil Erosion in Thailand; Land Development Department: Bangkok, Thailand, 2000. (In Thai)
  32. Tingting, L.V.; Xiaoyu, S.; Dandan, Z.; Zhenshan, X.; Jianming, G. Assessment of soil erosion risk in northern Thailand. Int. Arch Photogramm Remote Sens. Spat. Inf. Sci. 2008, 8, 703–708. [Google Scholar]
  33. Zhou, B.Z.; Fu, M.Y.; Xie, J.Z.; Yang, X.S.; Li, Z.C. Ecological functions of bamboo forest: Research and Application. J. For. Res. 2005, 16, 143–147. [Google Scholar]
  34. Parr, J.; Sullivan, L.; Chen, B.; Ye, G.; Zheng, W. Carbon bio-sequestration within the phytoliths of economic bamboo species. Glob. Chang. Biol. 2010, 16, 2661–2667. [Google Scholar] [CrossRef]
  35. Janmahasatien, S.; Phopinit, S.; Sakai, M.; Ohta, S. Characteristics of soil under different forest types on a limestone plateau in Erawan national park, Thailand. In Proceedings of the FORTROP’96: Tropical Forestry in the 21th Century, Bangkok, Thailand, 25–28 November 1996; Kasetsart University: Bangkok, Thailand, 1997; Volume 2, pp. 271–280. [Google Scholar]
  36. Bunyavejchewin, S.; Baker, P.J.; Davies, S.J. Seasonally Dry Tropical Forests in Continental Southeast Asia. Structure, Composition, and Dynamics. In The Ecology and Conservation of Seasonally Dry Forests in Asia; McShea, W.J., Davies, S.J., Bhumpakphan, N., Eds.; Smithsonian Institution Scholarly Press: Washington, DC, USA, 2011; pp. 9–35. [Google Scholar]
Figure 1. Location of soil survey pits at the Mae Klong Watershed Research Station, Kanchanaburi, Thailand. Red circles, green circles, and blue circles indicate upper, middle, and lower slope positions, respectively. The location of root sampling sites is indicated by “R”. The blue dotted line is the primary stream channel of the Nikufu River.
Forests 10 00106 g001
Figure 2. Mean soil carbon stocks in the soil layers at different slope positions in a mixed deciduous forest. The vertical bars represent the standard deviations of the total stocks. The p value of the analysis of variance for the total carbon stocks was 0.03.
Forests 10 00106 g002
Figure 3. Schematic illustration of the slope positions and soil carbon densities in the mixed deciduous forest at the Mae Klong Watershed Research Station.
Forests 10 00106 g003
Table 1. Mean density of carbon and dry bulk density in the soil layers at different slope positions. Standard deviations are shown within parentheses. The p values of the two-way analysis of variance (ANOVA) test were calculated for the factors of slope position and soil layer.
PositionUpperMiddleLowerThe p Value of ANOVA
LayerCarbon (kg m−3)PositionLayer
0–10 cm35.3 (7.6)29.1 (2.8)27.1 (4.4)0.03<0.0001
10–30 cm21.8 (3.1)19.1 (5.2)14.9 (1.4)Interaction
30–100 cm10.9 (1.5)9.31 (0.84)8.33 (0.92)0.38
Dry bulk density (kg m−3)
0–10 cm980 (212)977 (132)1152 (185)0.8110.0002
10–30 cm1150 (194)1191 (121)1179 (269)Interaction
30–100 cm1167 (164)1243 (122)1196 (218)0.12
No. of soil pits454
Table 2. Mean density of fine (<3 mm in diameter), medium (3–10 mm), and coarse (>10 mm) roots in the soil layers at different slope positions. Standard deviations are shown within parentheses. The p values of the two-way analysis of variance (ANOVA) test were calculated for the factors of slope position and soil layer.
PositionUpperMiddleLowerThe p Value of ANOVA
LayerFine roots (kg m−3)PositionLayer
0–15 cm0.98 (0.39)1.10 (0.63)0.66 (0.64)0.502<0.0001
15–30 cm0.67 (0.39)0.74 (0.57)0.43 (0.34)Interaction
30–60 cm0.24 (0.17)0.23 (0.15)0.33 (0.17)0.11
60–90 cm0.04 (0.05)0.16 (0.09)0.18 (0.16)
90–120 cm0.04 (0.07)0.16 (0.16)0.14 (0.15)
Medium roots (kg m−3)PositionLayer
0–15 cm0.52 (0.44)0.24 (0.31)0.13 (0.15)0.0300.037
15–30 cm0.95 (1.07)0.41 (1.02)0.22 (0.16)Interaction
30–60 cm1.30 (2.05)0.03 (0.04)0.11 (0.13)0.081
60–90 cm0.22 (0.54)0.00 (0.00)0.13 (0.27)
90–120 cm0.04 (0.07)0.00 (0.00)0.22 (0.45)
Coarse roots (kg m−3)PositionLayer
0–15 cm2.17 (4.24)1.03 (2.68)0.76 (2.29)0.980.026
15–30 cm0.46 (1.12)2.66 (4.06)5.06 (8.05)Interaction
30–60 cm2.67 (4.19)1.25 (3.74)0.00 (0.00)0.195
60–90 cm0.00 (0.00)0.04 (0.13)0.00 (0.00)
90–120 cm0.00 (0.00)0.28 (0.82)0.00 (0.00)
No. of samples699
Table 3. Mean root biomass of fine (<3 mm in diameter), medium (3–10 mm), and coarse (>10 mm) roots and percentage of bamboo root biomass in the fine root biomass of the soil layers at different slope positions. Standard deviations are indicated within parentheses.
Slope PositionRoot SizeFine RootsMedium RootsCoarse RootsTotalPercentage of Bamboo in Fine Roots
Layer (kg m−2) (%)
Upper0–15 cm0.15 (0.05)0.08 (0.01)0.33 (0.33)0.55 (0.59)49.3
15–30 cm0.10 (0.02)0.14 (0.12)0.07 (0.07)0.31 (0.21)57.6
30–60 cm0.07 (0.01)0.39 (0.34)0.80 (0.79)1.27 (1.24)45.2
60–90 cm0.01 (0.01)0.07 (0.07)0.00 (0.00)0.08 (0.12)47.9
90–120 cm0.01 (0.01)0.01 (0.01)0.00 (0.00)0.03 (0.03)8.6
0–120 cm0.34 (0.11)0.69 (0.67)1.20 (1.00)2.23 (1.67)48.1
Middle0–15 cm0.17 (0.07)0.04 (0.04)0.15 (0.22)0.36 (0.39)55.7
15–30 cm0.11 (0.05)0.06 (0.08)0.40 (0.36)0.57 (0.59)55.4
30–60 cm0.07 (0.03)0.01 (0.01)0.37 (0.53)0.45 (1.06)67.6
60–90 cm0.05 (0.02)0.00 (0.00)0.01 (0.02)0.06 (0.04)77.6
90–120 cm0.05 (0.01)0.00 (0.00)0.08 (0.12)0.13 (0.24)75.1
0–120 cm0.44 (0.16)0.11 (0.12)1.02 (0.88)1.57 (1.05)58.8
Lower0–15 cm0.10 (0.09)0.02 (0.01)0.12 (0.16)0.23 (0.33)37.9
15–30 cm0.07 (0.04)0.03 (0.01)0.76 (0.77)0.86 (1.14)34.0
30–60 cm0.10 (0.03)0.03 (0.02)0.00 (0.00)0.13 (0.06)25.5
60–90 cm0.06 (0.03)0.04 (0.03)0.00 (0.00)0.10 (0.09)31.4
90–120 cm0.04 (0.03)0.07 (0.05)0.00 (0.00)0.11 (0.12)46.2
0–120 cm0.36 (0.17)0.20 (0.07)0.87 (0.67)1.43 (0.74)34.7

