Potential Economic Impacts of Allocating More Land for Bioenergy Biomass Production in Virginia
by
Thomas O. Ochuodho
1,*, 
Janaki R. R. Alavalapati
2,
Pankaj Lal
3,
Domena A. Agyeman
4,
Bernabas Wolde
3 and
Pralhad Burli
3 1
Department of Forestry and Natural Resources, University of Kentucky, Lexington, KY 40546, USA
2
School of Forestry and Wildlife Sciences, Auburn University, Auburn, AL 36849, USA
3
Department of Earth and Environmental Studies, Clean Energy and Sustainability Analytics Center, Montclair State University, Montclair, NJ 07043, USA
4
Department of Agricultural Economics, University of Kentucky, Lexington, KY 40503, USA
*
Author to whom correspondence should be addressed.
Forests 2019, 10(2), 159; https://doi.org/10.3390/f10020159
Submission received: 31 December 2018
/
Revised: 2 February 2019
/
Accepted: 4 February 2019
/
Published: 13 February 2019
(This article belongs to the Special Issue Forest Bioenergy and Bioproducts)
Abstract
:The growing attention to renewable energy and rural development has created greater demand for production of biomass feedstock for bioenergy. However, forest growth rates and the amount of land in most existing forests may not be sufficient to sustainably supply the forest biomass required to support existing forest products industries and the expanding bioenergy industry. Additionally, concerns about agricultural land use competition have dampened expansion of biomass production on agricultural land base. One of the ways to meet the growing forest biomass feedstock demand for bioenergy production is by allocating currently marginal non-forested land for growing bioenergy feedstocks. In Virginia, about 80% of forestland is under nonindustrial private forest ownership. The land use allocation decisions of these private owners are critical for the supply of the forest biomass feedstock to support bioenergy production. We apply a computable general equilibrium model to assess the economy-wide impacts of forestland owners’ willingness to plant pine on non-forested land for woody bioenergy in Virginia. We consider three counterfactual scenarios of biomass feedstock supply increase as intermediate demand for bioenergy production based on forestland owners’ willingness to accept biomass bid prices to set aside more non-forested land for biomass production in Virginia under general equilibrium conditions. Overall, the results show an increase in social welfare and household utility but a marginal decline in GDP. However, increased demand of biomass from logging sector depressed the manufacturing sector (the wood manufacturing sub-sector particularly), which also relies on the logging sector for its intermediate inputs. Results from this study provide insights into the bioenergy land use competition debate, and pathways towards sustainable bioenergy feedstock supply.
1. Introduction
Woody biomass is the longest-standing form of energy resources in the history of human civilization [1] and is the largest source of renewable energy globally [2]. The debate about using woody biomass for renewable energy production continues, both in the USA and overseas [3]. As of 2017, about 20% of renewable energy consumed in the USA was generated from woody biomass [4], and these estimates are anticipated to increase in the near future, going by recent trends [4].
In the USA both agricultural and forested biomass energy are considered options to reduce the dependency on fossil fuels, increase the current share of the nation’s renewable energy, and improve the sustainability of forests and marginal lands [5]. Forests have a great potential for providing woody bioenergy with less competition for cropland compared to crop-based energy crops. The potential of forest for woody biomass has led to an increase in demand for forest biomass feedstock across the USA. Though the disadvantages of forest biomass production (such as longer rotation compared to agricultural crops) cannot be overlooked, there is a great potential for allocating more land for forest biomass production as forest landowners enjoy numerous economic and environmental benefits from production of forest bioenergy such as revenues from biomass sales, forest management cost savings, potential carbon credits and increased forest health, low cost of stand improvement, and reduced-cost on-site preparations [6].
The production of bioenergy from forests has rapidly expanded in the southern USA and could increase in the coming years due to the recent increase in federal renewable energy and climate policies [7,8]. However, growth rates and the amount of land in most of these existing forests may not be sufficient to sustainably supply the amount of forest biomass required to support existing forest products industries and the expanding bioenergy industry over short-term periods [8,9]. An option for forestland owners to meet the demand and goals of renewable energy policies is to allocate non-forested lands for forest biomass production [5,10].
Virginia ranks among the top 10 most forested states in the USA. About 63% of Virginia’s total land area was forested in 2014, which represented about a 0.85% increase from 2011 [11]. Forest is among the largest industries in Virginia and it makes a significant contribution to the growth and development of Virginia’s economy [12]. An annual economic contribution of about $21 billion was estimated for Virginia’s forest sector in 2017.
The oak-hickory forest type is the most predominant in Virginia. The second predominate forest type is loblolly-shortleaf pine, which covers about 3.1 million acres of forestland in Virginia [13]. Loblolly pine is an ideal tree for site restoration and forest management. It is the most hardy and versatile pine in the south, due to its ability to reproduce and grow rapidly on diverse environmental conditions [14]. Forestland owners in Virginia are therefore familiar with the needs and productivity of loblolly pine [15]. Loblolly pine is an attractive species for bioenergy biomass production. In Virginia, a report from an experimental forest that had loblolly-shortleaf as the second dominant tree indicates that an average biomass of 2.9 tons per acre can be obtained from coarse wood debris [11,13]. This can increase to 3.5 tons per acre in the Virginia’s northern mountains and can reduce to 2.4 tons per acre in the coastal plains. Rose [11,13] report that an average biomass of 3.5 tons per acre can obtained from fine wood debris.
The overall potential yield of biomass feedstock for bioenergy production depends on land area allocated to producing it [16]. About 80% of the forestland in Virginia is privately owned [13]. This percentage of ownership has remained consistent over the years, which makes land use allocation decisions by private forestland owners critical for forest bioenergy production. Virginia has seen much growth in its biomass electricity generation in the last decade [17], ranking it 10th in the nation for biomass electricity production in 2010. A large proportion of the state’s biomass-based electricity is obtained from wood and wood waste [17]. A significant portion of the over 15.9 million acres of forestland in Virginia is used for bioenergy production [18,19]. Non-forested land owners can therefore take advantage of the increasing demand for woody biomass by allocating currently non-forested land to loblolly pine for bioenergy production [5,10].
A recent study by [10] reports that forest landowners in Virginia who own at least 8.1 hectares of forestland are willing to allocate about 23.1% of their non-forested lands for pine plantation for bioenergy. The authors found that forestland owners with large forestland size are willing to allocate more of their non-forestland for forest bioenergy production. Factors such as high price offer and less dependence on land for annual income lead to larger portion of non-forested land being allocated for pine production. Land owners allocating small portion of their non-forested land for pine production is as a result of their past experiences with federal financial or technical support programs and large land holding. Generally, the decision to plant pine on non-forestland by owners depend on both economic and non-economic factors [5,10].
2. Literature Review
2.1. Biomass Yield
Earlier study [8] estimated forest residues in Virginia to be about 1.3 million dry tons, which can be used for biomass electricity production, but are in themselves insufficient to supply long-term biomass electricity production requirements. This means harvested timber will become the preferred feedstock for forest bioenergy as demand for forest bioenergy increases [20]. Another study [21] employed a GIS-based spatial analysis to estimate the amount of biomass by type of wood manufactures and residues in Virginia. The authors focused on the woody biomass residue generation from loggers, sawmills, secondary wood manufacturers, and landfills. They estimated a total of 10 million green tons of residue for biomass, of which only 8% did not have a ready market. The ready market for forest residue give a clear indication on the increase use of forest biomass in Virginia, and the need to take measures to meet this rising demand.
Forest biomass like loblolly pine is a unique resource as a biomass feedstock and an economically feasible alternative to conventional forest product systems [22]. Operational experience have revealed that over 10 tons per acre per year of total plantation biomass productivity with rotations shorter than 25 years is feasible and sustainable. However, gains like that depend on intensively managed forest plantations [23]. Loblolly pine biomass yield per acre varies and it depends on several prevailing factors and forest management regimes. Implementing intensive site preparations (e.g., bedding, fertilizing, disking, subsoiling etc.) increases the productivity of loblolly pine, but intensive management regimes are only justifiable if it leads to significant returns in terms of biomass output [24].
Given the differences in management regimes and other production activities, different studies have reported different biomass yield estimates for loblolly pine. The average aboveground biomass yield for loblolly pine is about 4 dry tons per acre annually across the southern USA [25]. Combining stem residue and pulpwood, an average annual biomass from 1.64 to 2.38 tons per acre annually can be obtained under financially optimal management regimes [24]. It is reported [26] that for non-fertilized research fields with site preparation and weed control, an average biomass of 3.3 to 3.8 dry ton per acre annually can be produced from stems, branches and foliage. Adding fertilization to site preparation and weed control increases the average biomass yield to 3.6 to 5.2 dry tons per acre annually. This may further increase to 5.1 to 7.3 dry tons per acre annually, if higher levels of fertilizer are applied with irrigation. Good production practices and intensive management with high-yielding loblolly pine genotypes can increase aboveground biomass yield to 5.4 to 8.5 dry tons per acre annually [26].
In Virginia, a report from an experimental forest that had loblolly-shortleaf as the second dominant tree indicates that an average biomass of 2.9 tons per acre can be obtained from coarse wood debris [27]. This can increase to 3.5 tons per acre in Virginia’s northern mountains and can reduce to 2.4 tons per acre in the coastal plains.
2.2. The Land Use Competition Question and Controversy
Globally, existing works on bioenergy production have devoted significant effort to issues concerning the allocation of land for bioenergy production (e.g., [27,28]). Biomass for bioenergy production can be produced from different sources [8,27]. However, the competition for cropland between the crop-based sources of biomass and food crops has been a concern over the years, as it leads to reduced food production and hence increases food prices [29,30].
Land use competition between bioenergy crops and food crops remains an important issue even under cellulosic bioenergy production, because trees and grasses used for cellulosic biofuels are grown on fertile lands that are already dedicated to food crops [31]. Sands et al. [32] states that crop and forest residues are produced in conjunction with other marketable products, but production of some bioenergy feedstock compete directly for land and resources with food, feed, and fiber production [33,34,35,36]. Hence, the introduction of large-scale production of energy crops will displace other agricultural activities. Generally, the implementation of bioenergy policies in the USA and European Union has resulted in significant shifts and changes in land use (e.g., [26,35,37]).
While forest bioenergy production reduces the competition with agricultural crops, using cropland to grow trees rather than food crops for biofuels will probably not reduce or eliminate, competition for cropland [31]. For this reason increase in bioenergy production could extend to abandoned and marginal lands ([38,39,40]). Marginal lands are agricultural lands that are not in production or are not suitable for food crop production [38]. In recent years, researchers have focused on allocating abandoned and marginal for bioenergy energy due to the reduced competition with food crops [41].
Recent studies ([5,7,10]) have reported that using current non-forested land and idle farmlands for forest bioenergy is an option to meet the increasing and projected demands for forest bioenergy, and will also prevent the use of crop lands for growing trees. Focusing on intensively managed pine plantation in the southern USA. Another study [7] concluded that the volume of biomass supplied to bioenergy firms in the southern USA could be substantial if markets emerge and intensive practices are implemented on a large scale. They report that planting on idle farmland could mitigate some limitations and constraints associated with existing stands, but this practice is likely to be impeded by financial and ownership dynamics whereby older generation landowners may not be attracted to invest in such long-term ventures while the millennials inheriting these lands may have other land use options in mind other than bioenergy production. Hence, incentives in combination with significant price increases will be needed to substantiate the adoption across all owners and land types. Two studies in Virginia concludes that non-forestland owners are willing to allocate portions of their non-forestland lands for forest bioenergy production, and their willingness increases when they are provided with incentives through increase bid prices for the proportion of land allocated [5,10].
2.3. Modeling Forest Bioenergy Economic Impacts
Economic impacts analysis is one commonly used criteria for assessing potential of any policy in an economy. There has been a growing interest in understanding the role woody biomass can play in the energy market [42] and its economy-wide impacts [43,44]. White [3] stated that increased use of woody biomass for bioenergy is expected to have some ripple effects in the forest and agriculture sectors.
In East Texas, Gan and Smith [45] concluded that the electricity generation from woody biomass could generate about 1320 jobs and contribute about $352 million in total output. Recently, [46] used an input‒output analysis to evaluate the profitability and socio-economic impact of three forest-based bioenergy development strategies in the northwest USA. Their results show total economic impact on employment is small, however the production of bioenergy will contribute about $152 million annually and generate over 2000 jobs in the region.
Studies such as [47,48,49] have used various computable general equilibrium (CGE) models to analyze land use changes and equilibrium effects of bioenergy production. Hertel et al. [50] reported that CGE models are more appropriate for analyzing the economics of land use because partial equilibrium models solely focus on an adjustment of prices in land using sectors to obtain equilibrium, while CGE models examine the tradeoffs of supply and demand in the entire economy. However, Suttles [43] note that CGE models can over-aggregate economic sectors and biological processes. However, CGE models are still the best available tool capable of economy-wide analysis of bioenergy policies. Huang et al. [44] used a modified CGE model to analyze the socioeconomic effects of forest bioenergy production scenarios in Florida. They found that subsidies and technological improvement in second generation bioenergy production would lead to increased welfare and land shifting from agricultural production to forest-based activities.
With the growing demand for forest bioenergy and the willingness of forestland owners in Virginia to convert varying proportions of their non-forestlands to grow pine for bioenergy production, this study assesses the economy-wide impacts of forestland owners willingness to plant loblolly pine on non-forested land for woody bioenergy production. Next, we present the analytical method then results followed by discussion, summary and conclusions.
3. Methodology
3.1. Land Use Change Survey and Biomass Value
The proportion of non-forestland forestland owners are willingness to allocate for forest bioenergy feedstock production are obtained from survey results by other studies [5,10]. After multiple rounds of focus group discussions and pilot studies, the researchers administered a comprehensive survey to about 900 representative forestland owners in Virginia. The researchers used four different bidding biomass price values (Table 1) to determine the proportion of non-forestland forestland owners are willing to allocate for loblolly pine for energy production. On the average, respondent were willing to allocate 3.25, 4.45, 5.63, and 6.67 acres of non-forestland for low, low‒middle, middle‒high, and high bids, respectively. They approximated the per acre responses from the respondents to the state level and the total non-forested land allocated for growing pine for biomass. The state-wide estimates were approximated by multiplying the per-acre values from a given average respondent by the total number of forestland owners in Virginia [5].
3.2. The Computable General Equilibrium Model
CGE models are a class of economic models that use economic data, usually in the form of an input‒output table or social accounting matrix (SAM), to estimate how an economy might react to changes in investments, policies, markets, technologies, or other such factors [51,52]. CGE models endogenize price and demand system; enable substitution in production and demand; provide a more realistic treatment of factor scarcity, institutions, and the macroeconomic environment; and allow for optimization of agent behavior [53,54]. CGE models can capture in detail sectoral reactions and the resulting structural changes and feedback effects. Because of these characteristics, CGE models are thus well suited for the study of bioenergy development and policies (e.g., [44,55,56,57].
3.2.1. CGE Modeling Framework
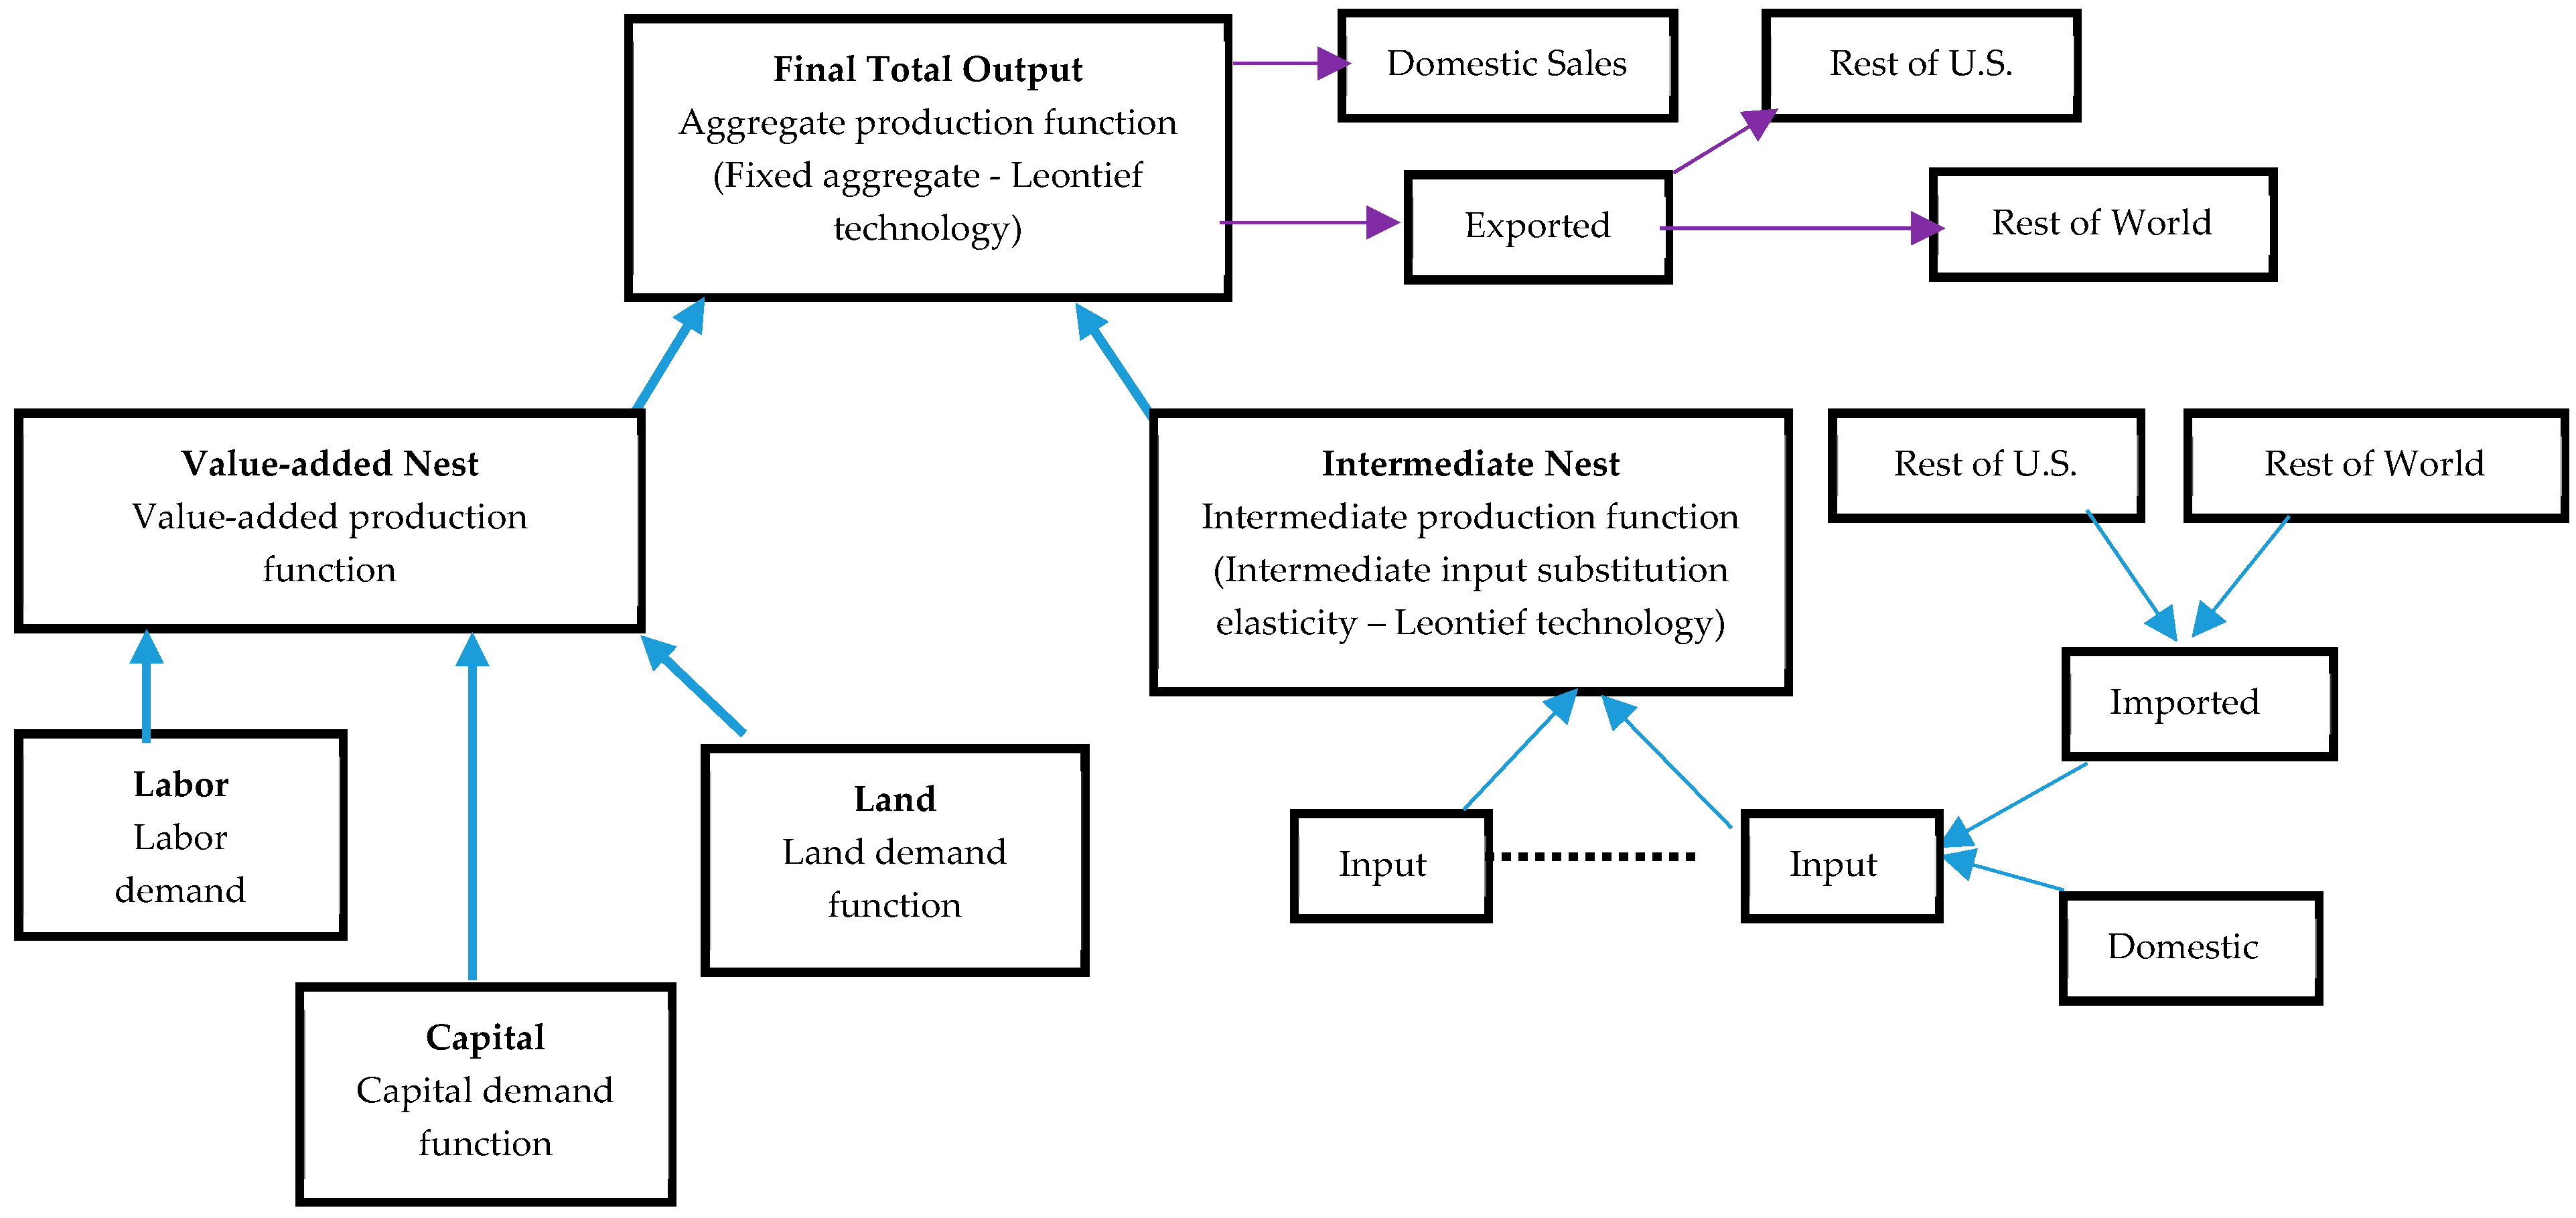
This analysis is based on a CGE model originally developed by Lofgren et al. [58] and later customized by Holland et al. [59] to be compatible with the IMPLAN (IMpact analysis for PLANning) dataset. The model is based on traditional neoclassical economic theory. The model is deterministic in nature with assumptions of small-open-economy (price taker) and constant returns to scale technology. In the model, producers are assumed to maximize profits (defined as the difference between revenue earned and the cost of factors and intermediate inputs) subject to constant returns to scale technology with three factors of production: labor, capital, and land. Production is specified in a two-level nest where at the top level, a composite of value-added and a composite of intermediate inputs are demanded in fixed proportions to produce each unit of output. At the bottom level, the three primary factors of production are assumed to substitute smoothly through a CES composite value-added function. Intermediate inputs, on the other hand, are determined by fixed shares through Leontief function (Figure 1).
The model has three major institutions, households (disaggregated into three income categories) and government (both state and federal) disaggregated by investment and expenditures, and rest of the world (and rest of the USA separately). The households derive their income from input production factors in addition to transfers from other institutions; they also make payments as direct taxes, but also save, consume, and make transfers to other institutions as well. The optimal allocation between consumption of commodities by households is through maximization of a Stone‒Geary Utility function (a Linear Expenditure System (LES) function) subject to its disposable income constraint [60].
The government on the other hand collects taxes, which are fixed at ad valorem rates, and also receives transfers from other institutions. Government consumption is fixed in quantity, and government transfers to households and the investment account are normalized by the consumer price index (CPI). The general investment account receives payments from the input factors and transfers from other institutions. Investment demand is fixed and defined as the base-year quantity multiplied by an adjustment factor. Transfer payments from the rest of the world, domestic institutions, and factors are all fixed in foreign currency.
With regard to trade, domestic and imported goods are considered imperfect substitutes. On the demand (import) side, the domestic consumers discriminate between the domestically produced and imported goods through an Armington assumption. Therefore, the demand between domestic and imported goods is determined through a constant elasticity of substitution (CES) Armington specification [61]. The final ratio of imports to domestic goods is determined by the cost minimizing decision-making of domestic demanders based on the relative prices of domestic goods and imports. This condition ensures that an increase in the domestic import price ratio causes an increase in the import-‒domestic demand ratio. In other words, the demand shifts away from the more expensive source. The export supply function is derived from a constant elasticity of transformation (CET) function and specifies the value of exports based on a ratio of domestic and export prices. The CET function assumes imperfect substitutability between products produced for the domestic and export market by a given industry.
All prices (including exchange rate) of commodities and primary input factors are normalized to unity in the initial equilibrium. In the counterfactual scenarios, new equilibrium prices are determined endogenously through system of simultaneous equations. Other critical model parameters (share and shift parameters in the CES and CET functions), are calibrated with the 2015 Virginia SAM dataset.
As is routine with any CGE model, closure rules specifications are required to determine the mechanisms by which demand and supply sides achieve equilibrium in all markets. In this study, capital is activity-specific and fixed in supply by activity, labor is mobile across sectors and flexible in supply to allow for unemployment and its supply is perfectly elastic, land on the other hand is mobile across sectors while its endowment (total supply) is fixed. Investment is fixed and macro saving balances (foreign and rest of the USA) are variable. This helps aggregate employment as a link to macro-variables [58,62].
On government expenditures, state government revenues are flexible and therefore determine state expenditures in the current account; consequently, the state government savings/deficit is fixed (exogenous) at the initial level. Federal government expenditures on the other hand are fixed in nominal terms, while federal revenues are variable with federal government savings/deficit. In addition, the foreign exchange rate is assumed flexible and the import price is a function of the world price, import tariffs, and the exchange rate. The CPI is set to be the numeraire (reference price). The square set of 412 simultaneous model equations were solved using the General Algebraic Modeling System (GAMS) software as a Mixed Complementary Problem (MCP) using the PATH solver [63].
3.2.2. Database and Model Calibration
Social accounting matrix (SAM) is the basic accounting structure and data required to implement a CGE model. A SAM is a comprehensive statistical representation of an economy at a particular point in time, usually one year. It is a square matrix with matching row and column accounts, where each cell in the matrix shows a payment from its column account to its row account. Major accounts in a standard SAM are: activities that carry out production; commodities (goods and services) that are produced or imported and sold domestically or exported; factors used in production (labor, capital, land, and other natural resources); and institutions such as households, government, and the rest of the world ([64,65]). The Virginia SAM dataset for this project was purchased from Minnesota Implan Group (IMPLAN) that produces annual SAM data. Other required data and parameters (such as elasticities) for the CGE model were obtained from literature sources.
The SAM database for this study is 2015 Virginia IMPLAN dataset that has 484 total industries (sectors) of potential 536 total. To narrow down to the sectors of interest for this analysis, the 484 sectors in Virginia SAM were aggregated into nine sectors: agriculture, logging, bioenergy electricity generation, all other electricity generation, electric power transmission and distribution, natural gas distribution, manufacturing, services, and rest of the economy, using sectoral mapping and aggregator algorithms in GAMS. A summary of 2015 Virginia SAM is presented in Table 2.
Before 2015, electricity generation (2015 IMPLAN industry code 41) was not broken down by sources of its contributing commodities in the Industry by Commodity account in the IMPLAN database. This made isolating electricity production from biomass under Industry by Commodity account a challenging task. Fortunately in 2015 dataset, even though electric power generation by sources are not defined as unique commodity accounts, they are presented under social account balance sheet from where one can create a unique SAM. Based on this IMPLAN database, electric power generation from biomass (commodity code 3047) required $75 million worth of biomass as intermediate input. Electric power generation from biomass represented 7.88% of total electricity energy production in Virginia in 2015. Of aggregate renewable electricity energy production, electric power generation from biomass accounted for 17.61%, overall, 45% of Virginia’s total energy production was from renewable sources (Table 3 and Table 4).
With the commodity output values available from the IMPLAN, the intermediate and primary factor input demand for bioenergy sector was estimated for the nine aggregated SAM sectors according to share ratios [66,67].
IMPLAN 2015 database has nine household income classes. To capture welfare impacts of our analysis at the household level by annual income categories, and for simplicity, the households are aggregated into three groups: low income (annual income less than $40,000), middle income ($40,000 to $100,000), and high income (greater than $100,000).
3.2.3. The Experimental Shock Scenarios
This study assess economy-wide and welfare impacts of forestland owners’ willingness to allocate more non-forested land for loblolly pine biomass production for biomass electric power generation in Virginia. It focuses on increase in biomass supply as landowners’ respond to higher biomass prices.
Economically, a change in supply and a change in quantity supplied are two distinct terms. Whereas the first is shown graphically as a movement of supply curve, the latter is a movement along a curve. While the first can be as a result of changes in costs and incentives that change how much a producer can and will produce at a given price, the second follows change in retail price of the commodity. We consider three (low, medium, and high) biomass supply counterfactual scenarios from the 2015 SAM baseline data. In setting up these experimental shock scenarios of change in intermediate supply (demand) of biomass for electric power generation, we followed the study of Wolde et al. [10]. However, their study did not consider conducting WTA survey within the framework of general equilibrium, bioenergy infrastructure, production capacities, etc. and therefore their results, in terms of change in biomass price and corresponding change in supply are not directly transferable to our CGE model. For simplicity, and convenience we consider the lowest WTA bid of $800/acre and its corresponding non-forestland acreage allocation and resulting biomass value to be the 2015 baseline SAM values. Assuming proportional change in biomass supply resulting from increase in non-forested land allocation for growing bioenergy pine and using the percentage increase in non-forested land allocation for biomass production, we set up three counterfactual scenarios (from the 2015 baseline) at 44%, 90%, and 128% for low, medium, and high, respectively (Table 1). We therefore shock the intermediate biomass supply (demand) for bioenergy production by these percentages in the counterfactual scenarios.
4. Results
We present summary of selected pertinent results of increase of intermediate supply of biomass for electricity production. Given these impacts are generated from general equilibrium condition, we cannot present impacts on all variables for all sectors here. We only report impacts on supply price and quantity, sectoral outputs, regional gross product, and household welfare. Other results are available upon request.
4.1. Supply Price and Quantity
Consistent with CGE modeling framework, all prices are initialized at 1 in baseline equilibrium before any shocks are implemented. The reported price impacts are percentage deviations from 1. Following increase in intermediate demand of biomass for bioenergy production, producer (landowner) commodity price in logging (that produces biomass) sector increases by 2.323, 4.639, and 6.444% under the low, medium, and high demand scenarios respectively. The logging sector experiences the greatest commodity producer price than any other sector. Consequently, bioenergy sector (electricity generated from biomass), which uses the biomass for electric power generation similarly experiences proportional producer price increases in the three scenarios though at a lower level of 0.195, 0.887, and 1.884% respectively. The producer commodity prices contract marginally in all other electricity generation and natural gas distribution sectors. The manufacturing sector also experience marginal commodity price increases. Manufacturing sector uses logs in production of manufactured wood products. Therefore, these impacts are triggered by price increase in the logging sector (Table 5). Other sectors (agriculture, services and rest of the economy) experience reduction in commodity prices following substitution effects.
Following supply price impacts (Table 5), sectoral commodity demand (same as supply in equilibrium) responds on the reserve (price increase results in decline in demand and vice versa) almost for all sectors except for the logging sector where intermediate supply to bioenergy sector is exogenous. Table 6 and Table 7 present commodity supply impacts in percentage and levels respectively.
4.2. Sectoral Outputs and GDP Impacts
Table 8 and Table 9 present sectoral output impacts as percentage and levels changes respectively. The logging sector experience the largest increase in total output that is proportional to increase in intermediate demand for biomass at 7.01, 14.24, and 20.05% for low, medium, and high scenarios respectively. Bioenergy production sector also experiences proportional increase in output though at much lower scale at 0.04, 0.14, and 0.3% for the three scenarios respectively. Agriculture sector’s output increase at 0.04, 0.08, and 0.11 for low, medium, and high scenarios respectively. The increase/decrease in sectoral outputs are triggered by sectoral demand increase/decrease following decrease/increase of commodity producer prices. As a result of decline in foreign savings and government spending (revenues).Gross regional product (GDP) declines marginally in the three scenarios at 0.007, 0.014, and 0.019 respectively.
4.3. Household and Welfare Impacts
Consumer (household) utility increases marginally (between 0.0002% and 0.0008%) among the three scenarios across the three household income categories. Household welfare is measured by equivalent variation (EV), in million dollars. EV is a measure of both price and income effects. It represents the change in household income at current prices that a change in prices would have on household welfare if income were held constant at initial level prior to any shock in the economy. It is the amount of income that a consumer would have to be compensated with so as to make the consumer well-off in case the economic shock were to take place.
Welfare impacts increases with increase in intermediate demand of biomass for bioenergy production across the three household income categories. These range from $1.71 million for the low-income household category under low biomass intermediate demand to $12.62 million for the high-income household category under a high biomass supply scenario (Table 10).
It is worth noting that while not reported, our model also produces impacts regarding prices, input factors, employment levels, trade (exports and imports), among many other indicators, which are integral component of estimating welfare impacts.
5. Discussion, Summary, and Conclusions
This study provides a snapshot of potential economy-wide impacts of increasing supply of forest biomass following increase in biomass prices per unit land base of non-forested marginal land in Virginia.
Being the largest holders of forestland in Virginia and the USA in general, private forestland owners’ decisions, within conducive and enabling bioenergy policy framework, hold the key to sustainable bioenergy sector. This research assessed potential economy-wide impacts of increasing biomass supply for bioenergy production as a result of exogenous increase in biomass price incentive. Overall, the increase in biomass demand resulted in increase in social welfare and household utility but with a marginal decline in GDP. Even though their total utility is lowest, the low-income household category had the greatest utility gains followed by the high- and middle-income categories, in the three scenarios. Increased demand for biomass for bioenergy production triggered increase in logging sector supply price, which consequently resulted in increased logging sector total output. However, these impacts depressed the manufacturing sector (the wood manufacturing sub-sector, particularly), which also relies on logging sector for its intermediate inputs.
While it may be informative to compare our results with other studies for similarity and dissimilarity, such comparisons in CGE models may not be appropriate and fair given how impacts are generated in CGE models. While directions (−/+) of impacts in CGE models are governed by economic theories and type of model specification, the magnitudes of such impacts are largely driven by among factors, model assumptions (model closures) and elasticities, structure and size of the economy under study, etc. Despite these factors, our results (prices, output, demand, and welfare), point to similar directions as related other studies we highlighted in literature [3,43,44,45,47,48,49].
In the past 20 years, the USA has accelerated commercialization of bioenergy industry as viable source of renewable energy. Bioenergy policies in the USA have largely been driven by federal government policies that specifically encourage production of bioenergy wood-based sources (2002 Farm Bill, 2005 Energy Policy Act, 2007 Energy Independence and Security Act, and various Farm Bills. The USA has made good progress in renewable energy production from only 2% in 2012 to about 12% in 2017 [4]. Of renewable total energy production, forest biomass constitute about 20%. Forest biomass will therefore continue to supply significant component of renewable energy moving forward with availability of marginal non-forested land within enabling policy and market environment. This will provide both rural economic stimulus as well as reduce dependence on non-renewable energy sources.
This study was conducted under some broad assumptions that future studies may try to address. Unlike other renewable energy types, bioenergy in the USA is still at infancy stages in terms of technology, market structure, stable policy environment, infrastructure development, etc. Additionally, unlike other energy inputs like coal, the logging sector has several intermediate uses such as wood manufacturing (from sawn wood) and pulp and paper (from pulp wood). Without disaggregating logging sector by final commodities, a shock in logging sector supply price (following biomass price increase) will inevitably affect all commodities that depend on the logging sector for their intermediate demand. It is because of this assumption that we saw the manufacturing sector being affected disproportionately relative to other sectors. This is because the intermediate demand of the logging sector’s commodity is fivefold that of the bioenergy sector in the SAM. Future studies can also consider the actual costs of the establishment and management of a dedicated bioenergy feedstock with a determinate rotation age that will provide an actual timeline to enable modeling various scenarios in a dynamic CGE framework with nested but disaggregated energy sub-sectors to allow for substitution among energy alternatives. Such a modeling framework will provide more realistic results. It is the intention of the authors to consider these in future work.
Author Contributions
Conceptualization, P.L. and J.R.R.A.; methodology, P.L., J.R.R.A. and T.O.O.; software, T.O.O.; validation, T.O.O., B.W. and P.B.; formal analysis, T.O.O.; investigation, T.O.O., B.W., P.B.; resources, P.L., J.R.R.A. and T.O.O.; data curation, T.O.O., B.W., P.B.; writing—original draft preparation, T.O.O. and D.A.A.; writing—review and editing, T.O.O.; visualization, T.O.O.; supervision, J.R.R.A. and P.L.; project administration, J.R.R.A. and P.L.; funding acquisition, P.L. and J.R.R.A.
Funding
U.S. Department of Agriculture, National Institute of Food and Agriculture Grant 2012-67009-19742, National Science Foundation Award 1555123, Montclair State University, Virginia Polytechnic and State University, and University of Kentucky.
Acknowledgments
The authors gratefully acknowledge the support of the U.S. Department of Agriculture, National Institute of Food and Agriculture Grant 2012-67009-19742, and National Science Foundation Award 1555123, Clean Energy and Sustainability Analytics Center at Montclair State University, Virginia Polytechnic and State University, and University of Kentucky.
Conflicts of Interest
The authors declare no conflict of interest. The funders had no role in the design of the study; in the collection, analyses, or interpretation of data; in the writing of the manuscript, or in the decision to publish the results.
References
- Nielsen-Pincus, M.; Moseley, C. Social Issues of Woody Biomass Utilization: A Review of the Literature; Ecosystem Workforce Program, Institute for a Sustainable Environment, University of Oregon: Eugene, OR, USA, 2009. [Google Scholar]
- Lauri, P.; Havlík, P.; Kindermann, G.; Forsell, N.; Bottcher, H.; Obersteiner, M. Woody biomass energy potential in 2050. Energy Policy 2014, 66, 19–31. [Google Scholar] [CrossRef]
- White, E.M. Woody Biomass for Bioenergy and Biofuels in the United States—A Briefing Paper; General Technical Report PNW-GTR-825; U.S. Department of Agriculture, Forest Service, Pacific Northwest Research Station: Portland, OR, USA, 2010; p. 45. [Google Scholar]
- U.S Energy Information Administration, Renewable Energy Explained. Available online: https://www.eia.gov/energyexplained/?page=renewable_home (accessed on 20 December 2018).
- Lal, P.; Wolde, B.; Alavalapati, J.; Burli, P.; Munsell, J. Forestland owners’ willingness to plant pine on non-forested land for woody bioenergy in Virginia. For. Policy Econ. 2016, 73, 52–57. [Google Scholar] [CrossRef]
- Jacobson, M.; Ciolkosz, D. A Primer on Woody Biomass Energy for Forest Landowners; Renewable and Alternative Energy, Penn State College of Agricultural Sciences, The Pennsylvania State Fact Sheet, Penn State Extension: State College, PA, USA, 2012. [Google Scholar]
- Munsell, J.F.; Fox, T.R. An analysis of the feasibility for increasing woody biomass production from pine plantations in the southern United States. Biomass Bioenergy 2010, 34, 1631–1642. [Google Scholar] [CrossRef]
- Galik, C.S.; Abt, R.; Wu, Y. Forest biomass supply in the southeastern United States—Implications for industrial roundwood and bioenergy production. J. For. 2009, 107, 69–77. [Google Scholar]
- Binkely, C.S. Preserving Nature through Intensive Plantation Forestry: The Case for Forest Land Allocation with Illustrations from British Columbia. For. Chron. 1997, 73, 553–559. [Google Scholar] [CrossRef]
- Wolde, B.; Lal, P.; Alavalapati, J.; Burli, P.; Munsell, J. Factors affecting forestland owners’ allocation of non-forested land to pine plantation for bioenergy in Virginia. Biomass Bioenergy 2016, 85, 69–75. [Google Scholar] [CrossRef]
- Rose, A.K. Virginia’s forests, 2011; Resource Bulletin SRS-RB-197; USDA-Forest Service, Southern Research Station: Asheville, NC, USA, 2013; Volume 197, pp. 1–92.
- Rephan, T.J. The Economic Impact of Virginia’s Agriculture and Forest Industries; Weldon Cooper Center for Public Service, University of Virginia: Charlottesville, VA, USA, 2017. [Google Scholar]
- Rose, A.K. Forests of Virginia 2013 Resource Update FS-37; US Department of Agriculture Forest Service. Southern Research Station: Asheville, NC, USA, 2015; Volume 37, pp. 1–4.
- Schultz, R.P. Loblolly Pine: The Ecology and Culture of Loblolly Pine (Pinus taeda L.); Agriculture Handbook 713; US Department of Agriculture, Forest Service: Washington, DC, USA, 1997; p. 493.
- USFS. Timber Product Output Data 2003; U.S. Department of Agriculture Forest Service, Forest Inventory and Analysis Unit: Washington, DC, USA, 2003. [Google Scholar]
- Field, C.B.; Campbell, J.E.; Lobell, D.B. Biomass energy: The scale of the potential resource. Trends Ecol. Evol. Dev. 2008, 23, 65–72. [Google Scholar] [CrossRef] [PubMed]
- U.S Energy Information Administration, Southern States Leads Growth in Biomass Electricity. Available online: https://www.eia.gov/todayinenergy/detail.php?id=26392# (accessed on 23 December 2018).
- Rose, A.K. Virginia, 2010 Forest Inventory and Analysis Factsheet, e-Science Update SRS–056; US Department of Agriculture Forest Service, Southern Research Statio: Asheville, NC, USA, 2012; pp. 1–4.
- Gan, J.; Mayfield, C. Benefits to Landowners from Forest Biomass/Bioenergy Production, Sustainable Forestry for Bioenergy and Bio-Based Products: Trainers Curriculum Notebook; Southern Forest Research Partnership, Inc.: Athens, GA, USA, 2007; pp. 225–228. [Google Scholar]
- Alavalapati, J.R.; Lal, P.; Susaeta, A.; Abt, R.C.; Wear, D.N. Forest biomass energy. In The Southern Forest Futures Project: Technical Report; Wear, D.N., Greis, J.G., Eds.; USDA-Forest Service, Southern Research Station: Asheville, NC, USA, 2013; Volume 178, pp. 213–260. [Google Scholar]
- Parhizkar, O.; Smith, R.L. Application of GIS to estimate the availability of Virginia’s biomass residues for bioenergy production. For. Prod. J. 2008, 58, 71–76. [Google Scholar]
- U.S. Department of Energy. Economic Availability of Feedstocks. In Billion-Ton Report: Advancing Domestic Resources for a Thriving Bioeconomy; Langholtz, M.H., Stokes, B.J., Eds.; Oak Ridge National Laboratory: Oak Ridge, TN, USA, 2016; p. 448. [Google Scholar]
- Virginia Department of Forestry. Forest Research Review. Available online: http://www.dof.virginia.gov/research/publications.htm URL (accessed on 10 December 2018).
- Guo, Z.; Grebner, D.; Sun, C.; Grado, S. Evaluation of Loblolly pine management regimes in Mississippi for biomass supplies: A simulation approach. South J. Appl. For. 2010, 34, 65–71. [Google Scholar]
- Stanturf, J.A.; Kellison, R.C.; Broerman, F.S.; Jones, S.B. Productivity of southern pine plantations: Where are we and how did we get here? J. For. 2003, 101, 26–31. [Google Scholar]
- U.S. Department of Energy. U.S. Billion-Ton Update: Biomass Supply for a Bioenergy and Bioproducts Industry; Perlack, R.D., Stokes, B.J., Eds.; Oak Ridge National Laboratory: Oak Ridge, TN, USA, 2011; p. 227.
- Oliver, A.; Khanna, M. Demand for biomass to meet renewable energy targets in the United States: Implications for land use. Gcb Bioenergy 2017, 9, 1476–1488. [Google Scholar] [CrossRef]
- Rajcaniova, M.; Kancs, D.A.; Ciaian, P. Bioenergy and global land-use change. Appl. Econ. 2014, 46, 3163–3179. [Google Scholar] [CrossRef] [Green Version]
- Ciaian, P.; Kancs, D. Interdependencies in the energy bioenergy food price systems: A cointegration analysis. Resour. Energy Econ. 2011, 33, 326–348. [Google Scholar] [CrossRef]
- Johansson, D.J.A.; Azar, C. A scenario based analysis of land competition between food and bioenergy production in the US. Clim. Chang. 2007, 82, 267–291. [Google Scholar] [CrossRef]
- Searchinger, T.; Heimlich, R. Avoiding Bioenergy Competition for Food Crops and Land: Creating a Sustainable Food Future; World Resources Institute: Washington, DC, USA, 2015; pp. 1–44. Available online: https://www.wri.org/publication/avoiding-bioenergy-competition-food-crops-and-land (accessed on 23 December 2018).
- Sands, R.D.; Malcolm, S.A.; Suttles, S.A.; Marshall, E. Dedicated Energy Crops and Competition for Agricultural Land; United States Department of Agriculture, Economic Research Service: Washington, DC, USA, 2017.
- Kampman, B.; van Grinsven, A.; Croezen, H. Sustainable Alternatives for Land-Based Biofuels in the European Union: Assessment of Options and Development of a Policy Strategy; CE Delft: Delft, The Netherlands, December 2012; Available online: https://www.cedelft.eu/publicatie/sustainable_alternatives_for_landbased_biofuels_in_the_european_union/1325 (accessed on 23 December 2018).
- Banse, M.; van Meijl, H.; Tabeau, A.; Woltjer, G.; Hellmann, F.; Verburg, P.H. Impact of EU biofuel policies on world agricultural production and land use. Biomass Bioenergy 2011, 35, 2385–2390. [Google Scholar] [CrossRef]
- Taheripour, F.; Tyner, W.E. Introducing First and Second Generation Biofuels into GTAP Data Base Version 7; GTAP Research Memorandum, Purdue University: West Lafayette, IN, USA, 2011. [Google Scholar]
- Banse, M.; Woltjer, G.; Tabeau, A.; van Meijl, H. Will EU biofuel policies affect global agricultural markets? Eur. Rev. Agric. Econ. 2008, 35, 117–141. [Google Scholar] [CrossRef] [Green Version]
- Kancs, D.A.; Wohlgemuth, N. Evaluation of renewable energy policies in an integrated economic-energy-environment model. For. Policy Econ. 2008, 10, 128–139. [Google Scholar] [CrossRef]
- Miyake, S.; Renouf, M.; Peterson, A.; McAlpine, C.; Smith, C. Land-use and environmental pressures resulting from current and future bioenergy crop expansion: A review. J. Rural Stud. 2012, 28, 650–658. [Google Scholar] [CrossRef]
- Hoogwijk, M.; Faaij, A.; Eickhout, B.; de Vries, B.; Turkenburg, W. Potential of biomass energy out to 2100, for four IPCC SRES land-use scenarios. Biomass Bioenergy 2005, 29, 225–257. [Google Scholar] [CrossRef] [Green Version]
- Hoogwijk, M.; Faaij, A.; Van Den Broek, R.; Berndes, G.; Gielen, D.; Turkenburg, W. Exploration of the ranges of the global potential of biomass for energy. Biomass Bioenergy 2003, 25, 119–133. [Google Scholar] [CrossRef]
- Liu, T.; Huffman, T.; Kulshreshtha, S.; McConkey, B.; Du, Y.; Green, M.; Liu, J.; Shang, J.; Geng, X. Bioenergy production on marginal land in Canada: Potential, economic feasibility, and greenhouse gas emissions impacts. Appl. Energy 2017, 205, 477–485. [Google Scholar] [CrossRef]
- Shelly, J.R. Woody Biomass Factsheet–Wb1; University of California Berkeley: Berkeley, CA, USA, 2011; Available online: http://www.ucanr.org/sites/WoodyBiomass/newsletters/InfoGuides43284.pdf (accessed on 23 December 2018).
- Suttles, S.A.; Tyner, W.E.; Shively, G.; Sands, R.D.; Sohngen, B. Economic effects of bioenergy policy in the United States and Europe: A general equilibrium approach focusing on forest biomass. Renew. Energy 2014, 69, 428–436. [Google Scholar] [CrossRef]
- Huang, M.Y.; Alavalapati, J.R.; Banerjee, O. Economy-wide impacts of forest bioenergy in Florida: A computable general equilibrium analysis. Taiwan J. For. Sci. 2012, 27, 81–93. [Google Scholar]
- Gan, J.; Smith, C.T. Availability of logging residues and potential for electricity production and carbon displacement in the USA. Biomass Bioenergy 2006, 30, 1011–1020. [Google Scholar] [CrossRef]
- Saul, D.; Newman, S.; Peterson, S.; Kosse, E.; Jacobson, R.; Keefe, R.; Moroney, J. Evaluation of Three Forest-Based Bioenergy Development Strategies in the Inland Northwest, United States. J. For. 2018, 116, 497–504. [Google Scholar] [CrossRef]
- Sands, R.; Kim, M.K. Modelling the competition for land: Methods and application to climate policy. In Economic Analysis of Land Use in Global Climate Change Policy; Hertel, T.W., Rose, S.K., Eds.; Routledge: London, UK, 2009; pp. 174–201. [Google Scholar]
- Golub, A.; Hertel, T.; Lee, H.-L.; Rose, S.; Sohngen, B. The opportunity cost of land use and the global potential for greenhouse gas mitigation in agriculture and forestry. Resour. Energy Econ. 2009, 31, 299–319. [Google Scholar] [CrossRef] [Green Version]
- Van der Mensbrugghe, D. Environmental Impact and Sustainability Applied General Equilibrium (ENVISAGE) Model. Available online: http://ledsgp.org/resource/environmental-impact-and-sustainability-applied-general-equilibrium-model/?loclang=en_gb (accessed on 15 November 2018).
- Hertel, T.W.; Rose, S.; Richard, S. Land use in computable general equilibrium models: An overview. In Economic Analysis of Land Use in Global Climate Change Policy; Hertel, T.W., Rose, S., Eds.; Routledge: London, UK, 2009; pp. 23–50. [Google Scholar]
- Miller, M.H.; Spencer, J.E. The static economic effects of the UK joining the EEC: A general equilibrium approach. Rev. Econ. Stud. 1977, 44, 71–93. [Google Scholar] [CrossRef]
- Johansen, L. Multi-Sectoral Study of Economic Growth, 1960; North-Holland Publishing Company: Amsterdam, The Netherlands, 1960; p. 284. [Google Scholar]
- Banerjee, O.; Alavalapati, J. Illicit exploitation of natural resources: The forest concessions in Brazil. J. Policy Model. 2010, 32, 488–504. [Google Scholar] [CrossRef]
- Banerjee, O.; Alavalapati, J.R. Forest policy modelling in an economy-wide framework. Handbook of Forest Resource Economics. Available online: https://www.routledgehandbooks.com/doi/10.4324/9780203105290.ch34 (accessed on 14 October 2018).
- Haddad, S.; Britz, W.; Börner, J. Impacts of increased forest biomass demand in the European bioeconomy. Presented at the 57th Annual Conference, Weihenstephan, Germany, 13–15 September 2017; German Association of Agricultural Economists (GEWISOLA): Weihenstephan, Germany, 2017. [Google Scholar]
- Furtenback, Ö. Dynamic CGE-Model with Heterogeneous Forest Biomass: Applications to Climate Policy; CERE—The Center for Environmental and Resource Economics: Umeå, Sweden, 2011. [Google Scholar]
- Lu, C.; Zhang, X.; He, J. A CGE analysis to study the impacts of energy investment on economic growth and carbon dioxide emission: A case of Shaanxi Province in western China. Energy 2010, 35, 4319–4327. [Google Scholar] [CrossRef]
- Lofgren, H.; Harris, R.L.; Robinson, S. A Standard Computable General Equilibrium (CGE) Model in GAMS; Intl Food Policy Res Inst: Washington, DC, USA, 2002. [Google Scholar]
- Holland, D.W.; Stodick, L.; Painter, K. Assessing the Economic Impact of Energy Price Increases on Washington Agriculture and the Washington Economy: A General Equilibrium Approach; Working Papers 2007-14; School of Economic Sciences, Washington State University: Pullman, WA, USA, 2007. [Google Scholar]
- Stone, R. Linear expenditure systems and demand analysis: An application to the pattern of British demand. Econ. J. 1954, 64, 511–527. [Google Scholar] [CrossRef]
- Armington, P.S. A Theory of Demand for Products Distinguished by Place of Production. Palgrave Macmillan J. 1969, 1, 159–178. [Google Scholar]
- Julia-Wise, R.; Cooke, S.C.; Holland, D. A computable general equilibrium analysis of a property tax limitation initiative in Idaho. Land Econ. 2002, 78, 207–227. [Google Scholar] [CrossRef]
- GAMS (General Algebraic Modeling System)—Computer Application, GAMS Development Corporation: Washington, DC, USA, 2018.
- Pyatt, G.; Round, J.I. Social Accounting Matrices: A Basis for Planning. Available online: http://documents.worldbank.org/curated/en/919371468765880931/Social-accounting-matrices-a-basis-for-planning (accessed on 11 August 2018).
- UN [United Nations] (Statistical Division). The System of National Accounts 2008. 2008. Available online: https://unstats.un.org/unsd/nationalaccount/sna2008.asp (accessed on 11 November 2018).
- Taheripour, F.; Hertel, T.W.; Tyner, W.E.; Beckman, J.F.; Birur, D.K. Biofuels and their by-products: Global economic and environmental implications. Biomass Bioenergy 2010, 34, 278–289. [Google Scholar] [CrossRef] [Green Version]
- Winston, R.A.P. Enhancing Agriculture and Energy Sector Analysis in CGE Modelling: An Overview of Modifications to the USAGE Model; Monash University, Centre of Policy Studies and the Impact Project: Melbourne, Australia, 2009. [Google Scholar]
- Robinson, S.; Cattaneo, A.; El-Said, M. Updating and Estimating a Social Accounting Matrix Using Cross Entropy Methods. Econ. Syst. Res. 2001, 13, 47–64. [Google Scholar] [CrossRef] [Green Version]
- Robinson, S.; Roland-Holst, D.W. Macroeconomic structure and computable general equilibrium models. J. Policy Model. 1988, 10, 353–375. [Google Scholar] [CrossRef]
Figure 1.
Production technology tree for regional CGE model in the USA (authors’ illustration).

Table 1.
Biomass bid prices with corresponding non-forestland allocation in Virginia.
| Scenario | Biomass Price ($/acre) | Non-Forested Land Allocated (acre) |
|---|---|---|
| Low | 800 | 494,320 |
| Low–middle | 1035 | 714,564 |
| Middle–high | 1270 | 940,022 |
| High | 1500 | 1,126,919 |
Source: [10].
Table 2.
Virginia 2015 SAM summary.
| Model Year | 2015 | Value Added | |
| GRP (GDP) | $493,944,088,226 | Employee Compensation | $276,827,546,707 |
| Total Personal Income | $437,111,400,000 | Proprietor Income | $28,386,585,071 |
| Total Employment | 5,059,628 | Other Property Type Income | $159,473,806,415 |
| Tax on Production and Import | $29,256,150,032 | ||
| Number of Industries | 484 | ||
| Land Area (Sq. Miles) | 39,598 | Total Value Added | $493,944,088,226 |
| Area Count | 1 | ||
| Final Demand | |||
| Population | 8,382,993 | Households | $365,971,820,149 |
| Total Households | 3,201,210 | State/Local Government | $59,624,364,456 |
| Average Household Income | $136,546 | Federal Government | $109,295,223,544 |
| Capital | $85,746,527,670 | ||
| Trade Flows Method | Trade Flows Model | Exports | $203,606,651,905 |
| Model Status | Social Accounts | Imports | ($305,759,049,007) |
| Institutional Sales | ($24,541,448,640) | ||
| Economic Indicators | |||
| Shannon-Weaver Index | 0.75398 | Total Final Demand: | $493,944,090,077 |
Note: Totals of value added may not equal to final demand due to rounding off.
Table 3.
Electric power generation by sources for Virginia, 2015.
| Implan536 Commodity Index | Implan BEA Code | Implan Description | Commodity Production $ | % Share of Total |
|---|---|---|---|---|
| 3041 | 221111 | Electric power generation—Hydroelectric | 63,323,875 | 1.26 |
| 3042 | 221112 | Electric power generation—Fossil fuel | 2,678,571,777 | 53.30 |
| 3043 | 221113 | Electric power generation—Nuclear | 1,672,888,916 | 33.29 |
| 3044 | 221114 | Electric power generation—Solar | 0 | 0.00 |
| 3045 | 221115 | Electric power generation—Wind | 62,293,266 | 1.24 |
| 3046 | 221116 | Electric power generation—Geothermal | 53,018,517 | 1.06 |
| 3047 | 221117 | Electric power generation—Biomass | 395,837,158 | 7.88 |
| 3048 | 221118 | Electric power generation—All other | 0 | 0.00 |
| 3525 | S00302 | Local government electric utilities | 99,163,748 | 1.97 |
| Total | 5,025,097,257 | 100.00 | ||
Source: Virginia SAM, 2015.
Table 4.
Total renewable electricity energy production by sources for Virginia, 2015.
| Implan536 Commodity Index | Implan BEA Code | Implan Description | Commodity Production $ | % Share of Total |
|---|---|---|---|---|
| 3041 | 221111 | Electric power generation—Hydroelectric | 63,323,875 | 2.82 |
| 3043 | 221113 | Electric power generation—Nuclear | 1,672,888,916 | 74.44 |
| 3044 | 221114 | Electric power generation—Solar | 0 | 0.00 |
| 3045 | 221115 | Electric power generation—Wind | 62,293,266 | 2.77 |
| 3046 | 221116 | Electric power generation—Geothermal | 53,018,517 | 2.36 |
| 3047 | 221117 | Electric power generation—Biomass | 395,837,158 | 17.61 |
| 3048 | 221118 | Electric power generation—All other | 0 | 0.00 |
| Total | 2,247,361,732 | 100.00 | ||
Source: Virginia SAM, 2015.
Table 5.
Producer commodity prices (% change).
| Sector | Intermediate Demand of Biomass for Bioenergy Production | ||
|---|---|---|---|
| Low | Medium | High | |
| Agriculture | −0.001 | −0.003 | −0.004 |
| Logging | 2.325 | 4.639 | 6.444 |
| All other electricity generation | −0.010 | −0.021 | −0.030 |
| Electricity generated from biomass | 0.195 | 0.887 | 1.884 |
| Electric power transmission and distribution | −0.002 | 0.023 | 0.066 |
| Natural gas distribution | −0.006 | −0.012 | −0.017 |
| Manufacturing | 0.001 | 0.002 | 0.003 |
| Services | −0.005 | −0.011 | −0.015 |
| Rest of the economy | −0.006 | −0.012 | −0.017 |
Table 6.
Commodity supply quantity (% change).
| Sector | Intermediate Demand of Biomass for Bioenergy Production | ||
|---|---|---|---|
| Low | Medium | High | |
| Agriculture | 0.038 | 0.078 | 0.110 |
| Logging | 4.581 | 9.175 | 12.780 |
| All other electricity generation | 0.009 | −0.008 | −0.043 |
| Electricity generated from biomass | −0.159 | −0.738 | −1.552 |
| Electric power transmission and distribution | 0.000 | −0.026 | −0.070 |
| Natural gas distribution | 0.001 | 0.003 | 0.006 |
| Manufacturing | −0.040 | −0.076 | −0.101 |
| Services | 0.008 | 0.015 | 0.021 |
| Rest of the economy | 0.003 | 0.006 | 0.007 |
Table 7.
Commodity supply level ($ millions).
| Sector | Intermediate Demand of Biomass for Bioenergy Production | ||
|---|---|---|---|
| Low | Medium | High | |
| Agriculture | 2.032 | 4.178 | 5.937 |
| Logging | 17.337 | 34.720 | 48.366 |
| All other electricity generation | 0.408 | −0.356 | −2.024 |
| Electricity generated from biomass | −0.641 | −2.970 | −6.251 |
| Electric power transmission and distribution | −0.006 | −2.080 | −5.590 |
| Natural gas distribution | 0.015 | 0.053 | 0.098 |
| Manufacturing | −47.027 | −89.576 | −120.088 |
| Services | 43.577 | 87.494 | 121.632 |
| Rest of the economy | 4.693 | 9.049 | 12.055 |
Table 8.
Sectoral value of outputs impacts (% changes).
| Sector | Intermediate Demand of Biomass for Bioenergy Production | ||
|---|---|---|---|
| Low | Medium | High | |
| Agriculture | 0.04 | 0.08 | 0.11 |
| Logging | 7.01 | 14.24 | 20.05 |
| All other electricity generation | 0.00 | −0.03 | −0.07 |
| Electricity generated from biomass | 0.04 | 0.14 | 0.30 |
| Electric power transmission and distribution | 0.00 | 0.00 | 0.00 |
| Natural gas distribution | −0.01 | −0.01 | −0.01 |
| Manufacturing | −0.04 | −0.07 | −0.10 |
| Services | 0.00 | 0.00 | 0.01 |
| Rest of the economy | 0.00 | −0.01 | −0.01 |
Table 9.
Sectoral value of outputs impacts ($ millions).
| Sector | Intermediate Demand of Biomass for Bioenergy Production | ||
|---|---|---|---|
| Low | Medium | High | |
| Agriculture | 1.96 | 4.03 | 5.75 |
| Logging | 26.54 | 53.89 | 75.87 |
| All other electricity generation | −0.07 | −1.34 | −3.44 |
| Electricity generated from biomass | 0.14 | 0.57 | 1.22 |
| Electric power transmission and distribution | −0.16 | −0.27 | −0.34 |
| Natural gas distribution | −0.09 | −0.15 | -0.19 |
| Manufacturing | −45.48 | −86.63 | −116.15 |
| Services | 12.84 | 26.00 | 35.86 |
| Rest of the economy | −4.85 | −10.36 | −15.42 |
Table 10.
Social welfare impacts (equivalent variation $ millions).
| Household Annual Income Category | Number of Households (% of Total) | Intermediate Demand of Biomass for Bioenergy Production | ||
|---|---|---|---|---|
| Low | Medium | High | ||
| Low ($0–40K) | 993,176 (31%) | 1.71 | 3.22 | 4.18 |
| Medium ($40–100K) | 1,221,222 (38%) | 2.20 | 3.97 | 4.82 |
| High (>$100K) | 986,813 (31%) | 5.15 | 9.75 | 12.62 |
© 2019 by the authors. Licensee MDPI, Basel, Switzerland. This article is an open access article distributed under the terms and conditions of the Creative Commons Attribution (CC BY) license (http://creativecommons.org/licenses/by/4.0/).
Share and Cite
MDPI and ACS Style
Ochuodho, T.O.; Alavalapati, J.R.R.; Lal, P.; Agyeman, D.A.; Wolde, B.; Burli, P. Potential Economic Impacts of Allocating More Land for Bioenergy Biomass Production in Virginia. Forests 2019, 10, 159. https://doi.org/10.3390/f10020159
AMA Style
Ochuodho TO, Alavalapati JRR, Lal P, Agyeman DA, Wolde B, Burli P. Potential Economic Impacts of Allocating More Land for Bioenergy Biomass Production in Virginia. Forests. 2019; 10(2):159. https://doi.org/10.3390/f10020159
Chicago/Turabian StyleOchuodho, Thomas O., Janaki R. R. Alavalapati, Pankaj Lal, Domena A. Agyeman, Bernabas Wolde, and Pralhad Burli. 2019. "Potential Economic Impacts of Allocating More Land for Bioenergy Biomass Production in Virginia" Forests 10, no. 2: 159. https://doi.org/10.3390/f10020159
Note that from the first issue of 2016, this journal uses article numbers instead of page numbers. See further details here.