Damage Diversity as a Metric of Structural Complexity after Forest Wind Disturbance


Department of Plant Biology, University of Georgia, Athens, GA 30602, USA
Forests 2019, 10(2), 85; https://doi.org/10.3390/f10020085
Submission received: 31 December 2018
/
Revised: 18 January 2019
/
Accepted: 21 January 2019
/
Published: 23 January 2019
(This article belongs to the Special Issue Causes and Consequences of Species Diversity in Forest Ecosystems)
Abstract
:This study presents a new metric for quantifying structural complexity using the diversity of tree damage types in forests that have experienced wind disturbance. Structural complexity studies of forests have to date not incorporated any protocol to address the variety of structural damage types experienced by trees in wind disturbances. This study describes and demonstrates such a protocol. Damage diversity, defined as the richness and evenness of types of tree damage, is calculated analogously to species diversity using two common indices, and termed a ‘Shannon Damage Heterogeneity Index’ (Sh-DHI) and an inverse Simpson Damage Heterogeneity Index (iSi-DHI). The two versions of the DHI are presented for >400 plots across 18 distinct wind disturbed forests of eastern North America. Relationships between DHI and pre-disturbance forest species diversity and size variability, as well as wind disturbance severity, calculated as the fraction of basal area downed in a wind disturbance event, are examined. DHIs are only weakly related to pre-disturbance tree species diversity, but are significantly positively related to pre-disturbance tree size inequality (size diversity). Damage diversity exhibits a robust curvilinear relationship to severity; both versions of the DHI show peaks at intermediate levels of wind disturbance severity, suggesting that in turn structural complexity may also peak at intermediate levels of severity.
Keywords:
species diversity; structural complexity; legacies; wind damage; uprooting; trunk breakage1. Introduction
Diversity in forests can be of several types, such as compositional, functional, and structural [1,2,3], although historically the great majority of discussion of diversity has focused on compositional diversity (usually at the species level). In the past two decades, however, interest in functional and structural diversity has greatly increased [3,4,5]. These three types of diversity may interact in complex and interesting ways, such that they might be considered either cause or effect, depending on circumstance.
Most obviously, compositional diversity may result in both functional and structural diversity. For example, a larger suite of species will—simply because of the sampling effect—be likely to have more variety of ecophysiological responses to resources (functional diversity) as well as a wider range of growth forms and architectures (structural diversity) [6,7,8].
Conversely, if a suite of species that includes potential members of a community are functionally diverse (e.g., in drought or shade tolerance), there is greater chance for coexistence, thus facilitating compositional diversity: the classical niche partitioning explanation for species diversity [9,10].
A third type of interaction, rooted in the seminal work by MacArthur [11], hypothesizes that structural diversity provides more habitat niches and thereby facilitates higher species diversity. MacArthur showed that different warbler species utilized different feeding locations (niches) in spruce and fir trees, and proposed that this spatial partitioning allowed the warblers to coexist. More recently, this idea has been reformulated and presented with the label structural complexity (e.g., [12,13,14]). The closely-related concept of biological legacies has much overlap with structural complexity, although legacies are most often discussed in the context of post-disturbance conditions [15,16,17,18]. Regardless of the terminology, the idea is that forests with greater structural variability or heterogeneity should provide for more niche diversity (either plant or animal), and therefore greater species diversity; this facilitation has been documented numerous times for various faunal groups [19,20,21,22,23]. Throughout this manuscript, the term “structural complexity” will be used to describe this idea.
Note that a distinct and important developing idea applies at the ecosystem level, wherein structural complexity is defined as canopy rugosity; higher complexity is correlated with, and possibly facilitating, higher net primary productivity [24,25]. Moreover, other studies show a positive correlation between structural complexity and aboveground carbon stocks [26,27]; the latter idea is outside the scope of this paper, although reconciliation of these two approaches (community-level and ecosystem-level) would seem to benefit multiple areas of ecological understanding.
Given that the various types of diversity (compositional, functional, structural) may influence each other as either cause or effect, especially in light of the third example (structural diversity facilitating species diversity), it is pertinent to ask if structural or compositional diversity before a disturbance might influence structural diversity after disturbance. While a variety of studies examine structural diversity or complexity after fire, insect outbreaks, or harvesting [13], only a few have examined structural complexity after wind disturbance [28,29,30]. This paper aims to characterize one component of structural complexity after wind disturbance, and test for associations with two types of pre-disturbance forest diversity. In particular, analyses will test for potential influence of pre-disturbance species diversity or size variation on post-disturbance damage diversity (described below).
Many different metrics have been employed by researchers seeking to quantify structural complexity, often in an attempt to establish some benchmark based on conditions in old-growth or unmanaged forests, that can subsequently serve as a target of management actions [31,32,33]. While some complexity metrics address species diversity [13], spatial distribution patterns of trees [4,34,35,36,37,38], or size variation [28,34,39,40,41], an entirely distinct class of complexity metrics seek to capture the variety of structural categories present in a stand. Examples of the latter are measures of coarse woody debris or snag abundance [29,30]. This paper introduces an apparently novel metric of structural complexity: damage diversity. This metric is most suited to quantifying the variety of distinct tree structural categories on the basis of the damage experienced in wind disturbances. The rationale of the proposed damage diversity metric is that uprooted trees provide very distinct habitat niches from trees that experienced trunk breakage, and these categories further differ in obvious ways from intact or lightly damaged trees. For example, abundant research has examined the influence of uprooted tree root mounds and pits on fine scale patterns of plant species composition [42,43,44,45,46,47,48,49,50,51]. Trunk-broken trees simultaneously deposit tree crowns on the ground (which can greatly influence spatial variation in fire intensity [52]) as well as creating standing snags of various heights [53]. Uprooted and trunk-broken trees also differ in the amount of tree bole deposited on the soil surface—boles can serve as fine-scale fire breaks [52] and can impede movement of ungulate herbivores and thus reduce browsing [54,55,56,57], and as they decay can provide suitable microsites for seedling establishment [58,59]. Lighter types of damage (e.g., bent, leaning or light crown damage) will, in hardwood forests, prompt release of advanced regeneration (suppressed saplings) and prolific sprouting of the damaged trees, particularly by smaller trees. These responses often result in limited new seedling colonization and thus continuance of site dominance by the pre-disturbance individuals [30,48,60,61,62,63,64,65,66,67]. Clearly the distinct types of tree damage have potentially great influence on post-disturbance dynamics of both composition and diversity of vegetation: at the extremes, light damage will perpetuate existing composition and diversity, while uprooting will facilitate new seedling establishment on treefall microsites and potentially shift composition to an early-seral suite of species. It is expected, therefore, that a greater diversity of damage types after wind disturbance will foster a higher species diversity during forest regeneration.
Expectations for how pre-disturbance compositional and structural diversity might influence post-disturbance damage diversity are developed as follows. Tree species differ in their vulnerability to wind damage [68], thus it is expected (Hypothesis 1) that as pre-disturbance species richness or diversity increases, tree damage diversity should increase. Similarly, it is well-established that larger trees are more likely to suffer trunk breakage or uprooting (e.g., [68]); in contrast, small trees and saplings may be sufficiently flexible that they bend, a phenomenon rarely witnessed in large trees [69], and one that may allow small trees to avoid complete trunk breakage or uprooting. Thus smaller trees may be prone to different types of damage than large trees; as a consequence the second expectation (Hypothesis 2) is that while types of tree damage may shift with increasing tree size, damage diversity will be roughly similar across stands of different tree sizes. Following this logic, stands with limited tree size inequality (more uniform sizes) should show low damage diversity (although the actual types of damage may differ depending on the mean tree size). Conversely, if tree size inequality is high, a greater variety of types of tree damage are expected, and therefore the third expectation (Hypothesis 3) is that damage diversity will increase with increasing size inequality.
A fourth hypothesis emerges from the recent recognition that intermediate-severity wind disturbances may be an important source of structural complexity in forests [30], although the sites available for sampling did not allow those authors to explicitly address how complexity might vary with wind disturbance severity. There are several reasons to expect that post-disturbance structural complexity might exhibit a unimodal relationship to wind disturbance severity, with a peak at intermediate levels; some of this reasoning is a logical result of the definition of severity as the proportion of trees broken or uprooted. First, at low levels of severity, the more drastic types of tree damage (e.g., trunk breakage and uprooting) are likely to be uncommon while lighter types of tree damage will be most common, thus, damage diversity should be low in low severity situations. At the very highest levels of severity, where most or all trees are fallen, the lighter types of damage are obviously rare or absent and therefore damage diversity is again low. In contrast, at intermediate levels of severity, trees are likely to suffer a variety of types of damage, resulting in maximal damage diversity when severity is intermediate. This straightforward logic produces an expectation (Hypothesis 4) that damage diversity will be maximal at intermediate levels of wind damage severity. An additional subsidiary expectation is that the predominant type of tree damage will change with changing severity, such that uprooting and trunk breakage predominate at high severity, while lighter types of damage predominate at lower severity.
Specific objectives of this study are to (1) demonstrate a protocol for developing a damage diversity metric in recently wind-disturbed stands; (2) apply this protocol to describe the damage diversity in 18 separate wind disturbed forests of eastern and central North America; and (3) test the four hypotheses presented above, to explore the influence of pre-disturbance compositional and structural diversity, as well as disturbance severity, on the resulting damage diversity.
2. Materials and Methods
2.1. Study Sites
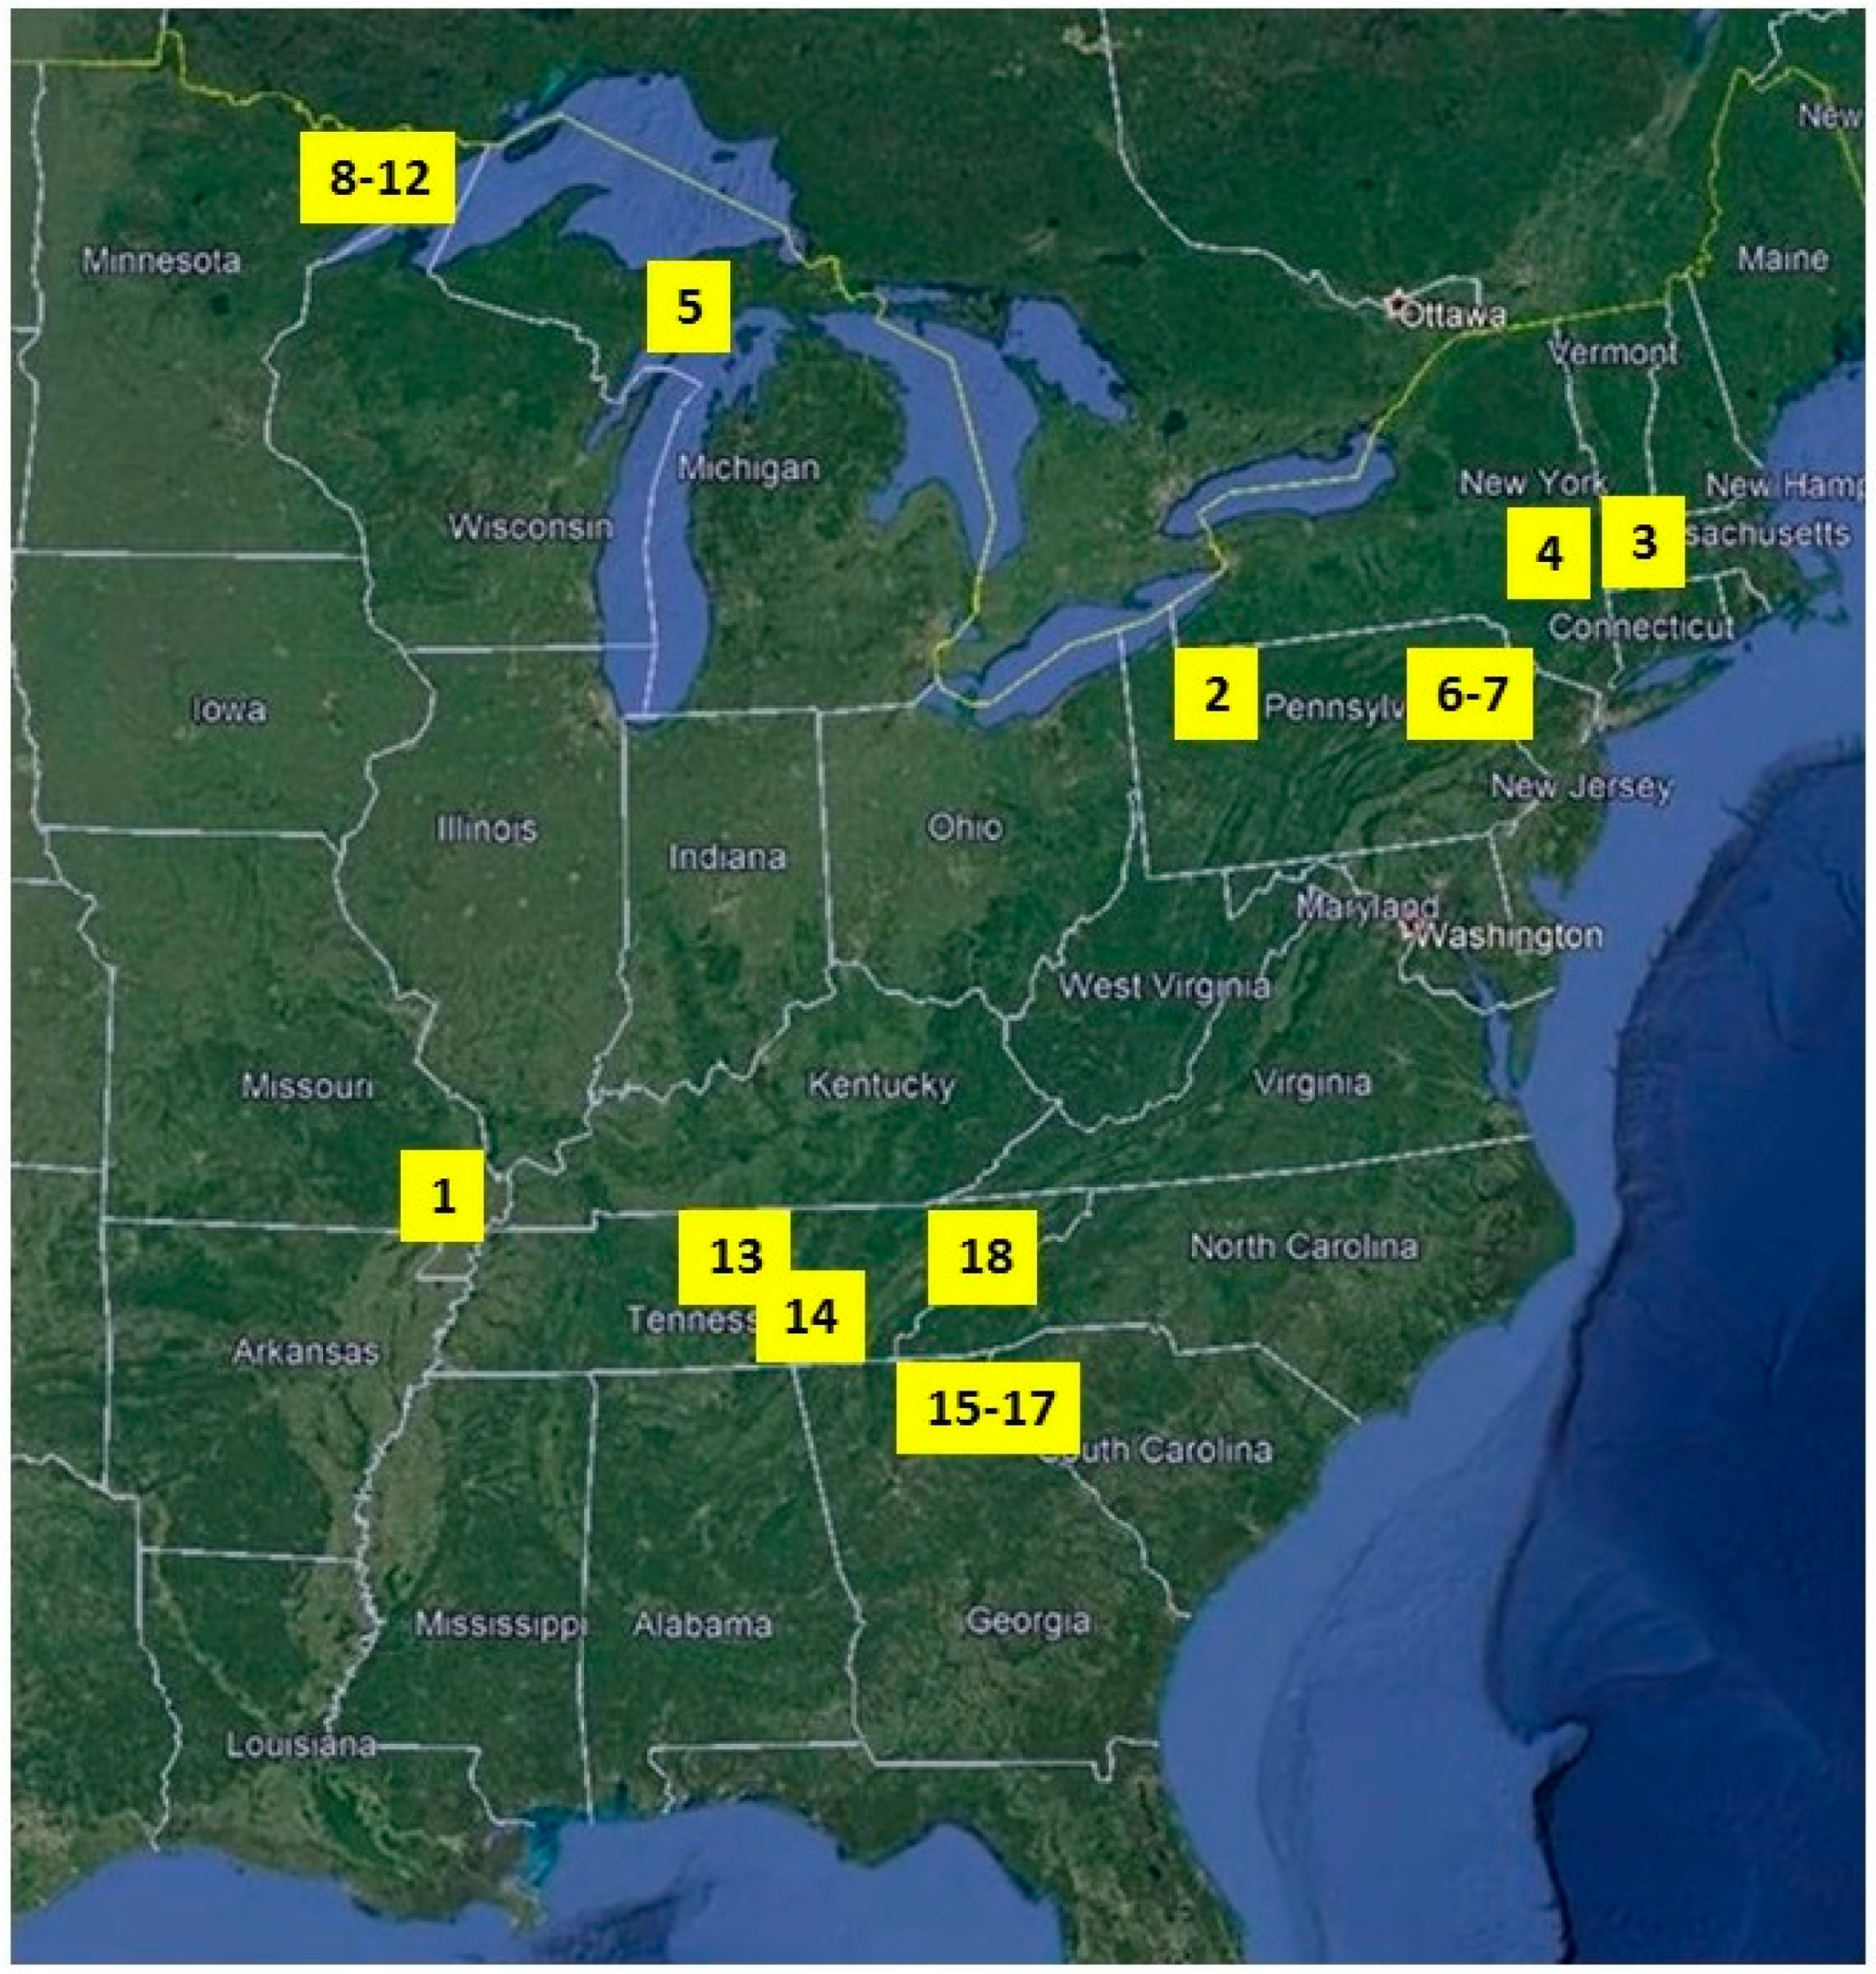
From the study sites from which data are reported here, several previous publications report other aspects of damage and regeneration [43,44,63,68,69,70,71,72,73,74,75]. Descriptions below are presented chronologically based on date of disturbance event; locations shown in Figure 1. Dominant woody species are presented in decreasing order of cumulative basal area.
Mingo site: Mingo National Wildlife Refuge is located in southeastern Missouri (36.974° N, 90.176° W; Table 1). On 4 June, 1993, an F1-rated tornado passed over the Refuge; lower hillslope and bottomland forests were damaged along a 20-km path. Tree damage was sampled in August 1994, in 9 survey plots distributed along transects; the 6 on hillslopes were 20 m × 20 m, while the 3 in bottomlands were 30 m × 30 m to adjust for lower tree density. Forests are of low density and consist of a high diversity of Quercus species (oaks) and other mesic hardwoods.
Tionesta 1994 site: This site is a primary forest preserve within Allegheny National Forest of northwestern Pennsylvania (41.638° N, 78.940° W; Table 1). Dominant woody vegetation was Fagus grandifolia Ehrh. (greatly diminished since the 1990s because of beech bark disease) and Tsuga canadensis L., with smaller components of Betula alleghaniensis Britton, Betula lenta L., Prunus serotina Ehrh., and Acer rubrum L. The site was disturbed by a small F2-rated tornado on 10 July, 1994, which damaged a patch of roughly 2 ha. (tornadoes in the United States are rated according to severity of damage, on a six-level scale from F0 to F5 [prior to 2007] or EF0 to EF5 [2007 and later]; Storm Prediction Center Fujita Tornado Damage Scale). The entire damaged patch was mapped with surveying equipment in summer 1996, and subsequently partitioned into 20 m × 20 m contiguous plots [Peterson 2000]. This site has been free of major disturbance (prior to 1994) for at least 3 centuries [76].
Gould Farm and Texas Hill sites: These two sites, separated by ~15 km, were disturbed by the same F4-rated tornado on May 29, 1995. Gould Farm is in western Massachusetts (42.175° N, 73.249° W), and had Pinus strobus L., T. canadensis, and Acer saccharum Marshall as dominant species. Texas Hill is in far eastern New York (42.207° N, 73.606° W; Table 1), and Quercus montana Willd., Quercus rubra L., and T. canadensis were dominants. Each site was sampled in 1997 with ten 20 m × 20 m plots distributed as 5 plots along each of 2 transects. Both are secondary stands with unknown disturbance history.
Rapid River site: This site in the central Upper Peninsula of Michigan (45.944° N, 86.658° W; Table 1), is covered in secondary forest dominated by A. rubrum, Betula papyrifera Marshall and Populus grandidentata Michx. Forests were damaged by a 5 October, 1997 thunderstorm downburst, which impacted an area roughly 5 km wide and 35 km long. Eleven 20 m × 20 m plots distributed along 2 parallel transects were sampled in July of 1999.
Hattons and Taylor sites: These sites, separated by ~10 km, are located in secondary forests of northeastern Pennsylvania (Table 1). Hattons (41.398° N, 75.126° W) was dominated by A. rubrum and P. strobus, while Taylor (41.266° N, 75.128° W) was a mix of several species of Quercus and Carya. Both were damaged by an F2-rated tornado on 30 May, 1998, which caused an 85-ha damage patch at Hattons, and a 4-ha damage patch at Taylor. At the Hattons site, 8 contiguous 20 m × 20 m plots were inventoried in July 1999 for tree damage. At the Taylor site, roughly 4 ha of damaged forest was mapped with surveying equipment, in June–July 2000, and subsequently subdivided into 77 contiguous 20 m × 20 m plots.
Boundary Waters Canoe Area sites: Fishhook, Shirttail, Meditation Lake, Threemile and Twin Island are the five study sites located with the Boundary Waters Canoe Area, a wilderness that consists of nearly 500,000 ha of primary sub-boreal forests in northeastern Minnesota, entirely within Superior National Forest. On 4 July, 1999, a large derecho event damaged >150,000 ha of forest in the Boundary Waters Canoe Area Wilderness [77]. Five sites in the vicinity of Seagull Lake were sampled for tree damage in 2000 and 2001 [71]; (Table 1). At Fishhook, 16 plots were sampled along 5 transects; at Meditation Lake, 9 contiguous plots (3 rows of 3) were sampled; at Shirttail, an area slightly less than 2 ha was mapped and partitioned into 18 contiguous plots; at Twin Island 20 plots were arranged along two transects; and at Threemile, 22 plots were distributed on five transects. Woody vegetation at Fishhook (48.138° N, 90.890° W) was predominantly Picea species, Pinus banksiana Lamb., and B. papyrifera, while that at Shirttail (48.118° N, 90.939° W) was a mixture of Abies balsamea (L.) Mill, Thuja occidentalis L., and Pinus resinosa Sol ex Aiton. Twin Island (48.120° N, 90.934° W) was an A. balsamea-B. papyrifera-T. occidentalis stand. Dominant species at Meditation Lake (48.134° N, 90.883° W) were A. balsamea, Populus tremuloides Michx., and B. papyrifera; while at Threemile (48.137° N, 90.899° W) the dominants were P. resinosa, T. occidentalis, and Pinus banksiana Lamb. The study sites are all of post-fire origin.
NTSF site: Natchez Trace State Park and Forest (NTSF) is located in west-central Tennessee (35.717° N, 88.300° W; Table 1), and occupied by secondary forests that originated in the 1930s. Dominant tree species are several Quercus species, Carya species, and Pinus taeda L. On 5 May 1999, a straight-line windstorm (downburst) with sustained winds >90 km/h and gusts >145 km/h struck NTSF and damaged ~3000 ha. Thirty-two plots (30 m × 30 m) were distributed haphazardly in 2 areas (16 in each area), and were inventoried for damage to all trees >10 cm trunk diameter in the summers of 2000 and 2001.
Gum Road was a secondary Q. rubra-Q. alba-Fraxinus americana L. stand in central Tennessee (35.667° N, 75.148° W; Table 1) disturbed in April 2002 by an F2 tornado, and was sampled in 2004. Twenty-eight plots were distributed as 4 contiguous 20 m × 20 m plots in each of 7 larger 40 m × 40 m plots. Disturbance history at this site is unknown.
Boggs Creek, Timpson, and Martin Branch are all located within the Chattahoochee National Forest in northern Georgia (Table 1). They were disturbed on April 27, 2011 by an EF-3 tornado that ultimately had a total track length of 64 km. At Boggs Creek (34.699° N, 83.883° W) Q. montana, Quercus coccinea Munchh., Pinus virginiana Mill., Q. alba, P. strobus, and Oxydendrum arboreum (L.) DC were the dominant tree species. The Timpson (34.876° N, 83.481° W) site’s woody vegetation was predominantly P. strobus, Q. alba, and Q. coccinea. At Martin Branch (34.775° N, 83.796° W), dominant tree species were P. strobus, A. rubrum and O. arboreum. These 3 sites were sampled in the summer and fall of 2011, and summer of 2012. At Boggs Creek, 38 plots were distributed along 8 transects; at Martin Branch 18 plots were arranged along 6 transects; and at Timpson, 14 plots were distributed among 5 transects. These stands originated after clearcutting in the late 19th and early 20th centuries.
The Smokies study site was located in the northwestern corner of Great Smoky Mountains National Park in southeastern Tennessee (35.621° N, 83.882° W; Table 1). The disturbance was also on April 27, 2011, and was an EF-4 tornado with a 33 km track length. A. rubrum, T. canadensis, and P. strobus were the dominant tree species. It was sampled in 2012 and 2013, using 22 plots distributed along park trails in 3 areas. Histories of the locations of actual plots are unknown, although most stands in this area are of post-fire origin and the area is generally considered primary forest.
2.2. Methods
Field methods For all of the above sites, field sampling consisted of an inventory of all trees above a minimum size threshold (either 5 cm or 10 cm trunk diameter at 1.4 m) within sample plots, in which species, type of damage, and dbh (cm) were recorded, as well as other variables not relevant to this report. Type of damage was categorized as: intact (undamaged), light crown damage (LCD; <50% of crown missing), heavy crown damage (HCD; >50% of crown missing), bent (trunk curved), leaning (trunk straight but >20° from vertical), trunk broken, or uprooted, for a total of 7possible damage categories.
Sampling plots were typically 20 m × 20 m in size; and distributed non-adjacently (typically spaced along transects) or as contiguous plots such as at Meditation Lake, Shirttail, Tionesta 1994, and Taylor. Two sites were exceptions. Natchez Trace was sampled with 32 non-adjacent 30 m × 30 m plots [73]. At Mingo, 3 out of the 9 total plots were also 30 m × 30 m in size [74].
Statistical analyses Plot-level damage severity was calculated as percent of pre-disturbance tree basal area that was felled (trunk broken or uprooted) by the wind disturbance. This is a better representation of the change in site conditions than using percent of individuals felled by the wind disturbance, because basal area better captures the size variation among individuals, and is therefore more closely correlated with the amount of canopy openness in a closed-canopy stand. A more nuanced measure of severity might include the partial damage categories by using some fraction of a tree’s pre-disturbance basal area in the total subtracted from the plot’s pre-disturbance total; however, it is not immediately obvious how such partial basal areas would be assigned to the lighter damage categories.
The term ‘damage heterogeneity index’ or DHI, is introduced as a measure of the diversity of damage categories; it is entirely analogous to typical measures of diversity of species. Two versions of the DHI were calculated, one called Sh-DHI and using the Shannon index (H’ = Σi pi ln pi) and another called iSI-DHI and using the inverse Simpson index (D = 1/λ, where λ = Σi(pi2)). In both of the versions of DHI, damage categories were used instead of species as the classification variable, and pi defined as the proportion of total individuals or total basal area represented by a given species. Evenness was also calculated along with the two primary indices, as J = H’/Hmax [78]. Note that while the great majority of uses of the Shannon or Simpson index use the number of individuals as the measure of abundance, this is by no means necessary, and may indeed by misleading when individuals differ by orders of magnitude in size. Using the summed basal area for a given damage category in a given plot mitigates this extreme variation and gives a better indicator of the actual dominance of a damage category in the sample. While the seven damage categories place an upper limit on the values Sh-DHI (max = 1.946) and iSi-DHI (max = 7.00) thus calculated, it still provides a quantitative measure of the diversity of damage types across the tree samples.
To explore any potential relationship between the DHIs and pre-disturbance forest characteristics and damage severity, the plot-level values of DHI (Sh-DHI and iSi-DHI) were regressed against plot-level forest characteristics (species richness and diversity, mean and inequality of tree diameter) and wind damage severity. Both linear and quadratic regressions were tested; if the secondary term in the quadratic regression significantly improved the regression, the relationship between predictor and response variable is curvilinear. Tree diameter inequality was quantified as the Gini coefficient [79]. All regressions were performed in Sigma-Plot 11.0 (Systat Software, San Jose, CA, USA).
Nonmetric multidimensional scaling ordination was used to visualize how type of tree damage varied among sample plots. In this novel ordination approach, damage types are used analogously to how species are used in traditional ordinations; the distribution of plots in “damage type ordination space” reveals the most prevalent type of tree damage for those plots. PC-Ord 7 (Wild Blueberry Media LLC, Corvalis, OR, USA) was used to perform the ordination. The following options were used in the ordination: Autopilot = off; distance index = Sorensen; Axes = 2; Runs with real data = 50; Stability criterion = 0.00001; Iterations to evaluate stability = 1; Maximum number of iterations = 250; Initial step length= 0.20; starting coordinates = Random. The multiple runs with real data were utilized to avoid local minima. Preliminary output was rotated with a varimax rigid rotation to improve separation; a varimax rotation moves output points simultaneously around the centroid to obtain the greatest spread of scores along the first axis. Final stress of the two-dimensional solution was 17.46. The input matrix was 340 rows × 7 columns of data; the columns define attributes—in this case, types of treefall (e.g., intact is one column; branches broken is next column, etc.) and the rows define entities—in this case 20 × 20 m sample plots. Entries in the input data matrix were number of trees experiencing that category of damage in that plot. After the ordination, plots were divided into those with 5 cm dbh as the minimum tree size (n = 237 plots) and those with 10 cm dbh as the minimum tree size (n = 111 plots) to show on separate graphs; the 35 plots that were 30 m × 30 m in size were excluded from the ordinations due to the small sample size.
3. Results
A total of 413 plots were sampled, encompassing 10,762 trees. Twenty-eight plots had five or fewer trees pre-disturbance and were subsequently excluded from analyses, resulting in 385 plots and 10,675 trees. Among the seven damage categories, uprooting was the most common overall, with 27.8% of trees (2973 trees), while trunk breakage occurred in 17.9% of trees (1907 trees). Lighter damage categories accounted for 33.0% of trees (3519 trees), while 25.9% of trees (2769 trees) remained intact (undamaged).
The relative abundances of damage categories varied immensely, even among plots within the same study site; many plots had no representation of one or more of the seven damage categories, while others had all seven categories in broadly similar abundances. Figure 2 presents the nine plots of Meditation Lake as just one example. In this site, plot C2 is overwhelmingly composed (62.1% of basal area) of uprooted trees; plot C1 has damage dominated by trunk breakage (54.1% of basal area); while in plot B2 intact or branches broken were the most abundant damage categories (36.9% and 31.9% of basal area, respectively).
Mean Sh-DHI (based on basal area) was close to half of the maximum for both the plots sampled with 5 cm dbh minimum, and those sampled with a 10 cm dbh minimum (Figure 3). For iSi-DHI, the corresponding levels were roughly 35% and 37% of the maximum. Larger plots (30 m × 30 m plot size) exhibited higher diversity than smaller 20 m × 20 m plots in both the Sh-DHI (roughly 84% of maximum) and iSi-DHI (50.3% of maximum) indices. A ranked one-way ANOVA (Kruskal-Wallis test) found that the three plot types differed significantly (H = 47.55, p < 0.001 for Sh-DHI, and H = 42.69, p < 0.001 for iSi-DHI). In both cases, Dunn’s pairwise comparisons revealed that the 5 cm dbh minimum plots and the 10 cm dbh minimum plots did not differ from one another, while the 30 m × 30 m plots significantly differed from the 5 cm dbh minimum plots. The 30 m × 30 m plots were sampled with a 5 cm diameter minimum, thus are not tested against the 20 m × 20 m plots that were sampled with a 10 cm diameter minimum.
Hypothesis 1: For plots sampled with a 5-cm diameter minimum, neither species richness nor species diversity of pre-disturbance trees was significantly related to post-disturbance Sh-DHI or iSi-DHI (data not shown).
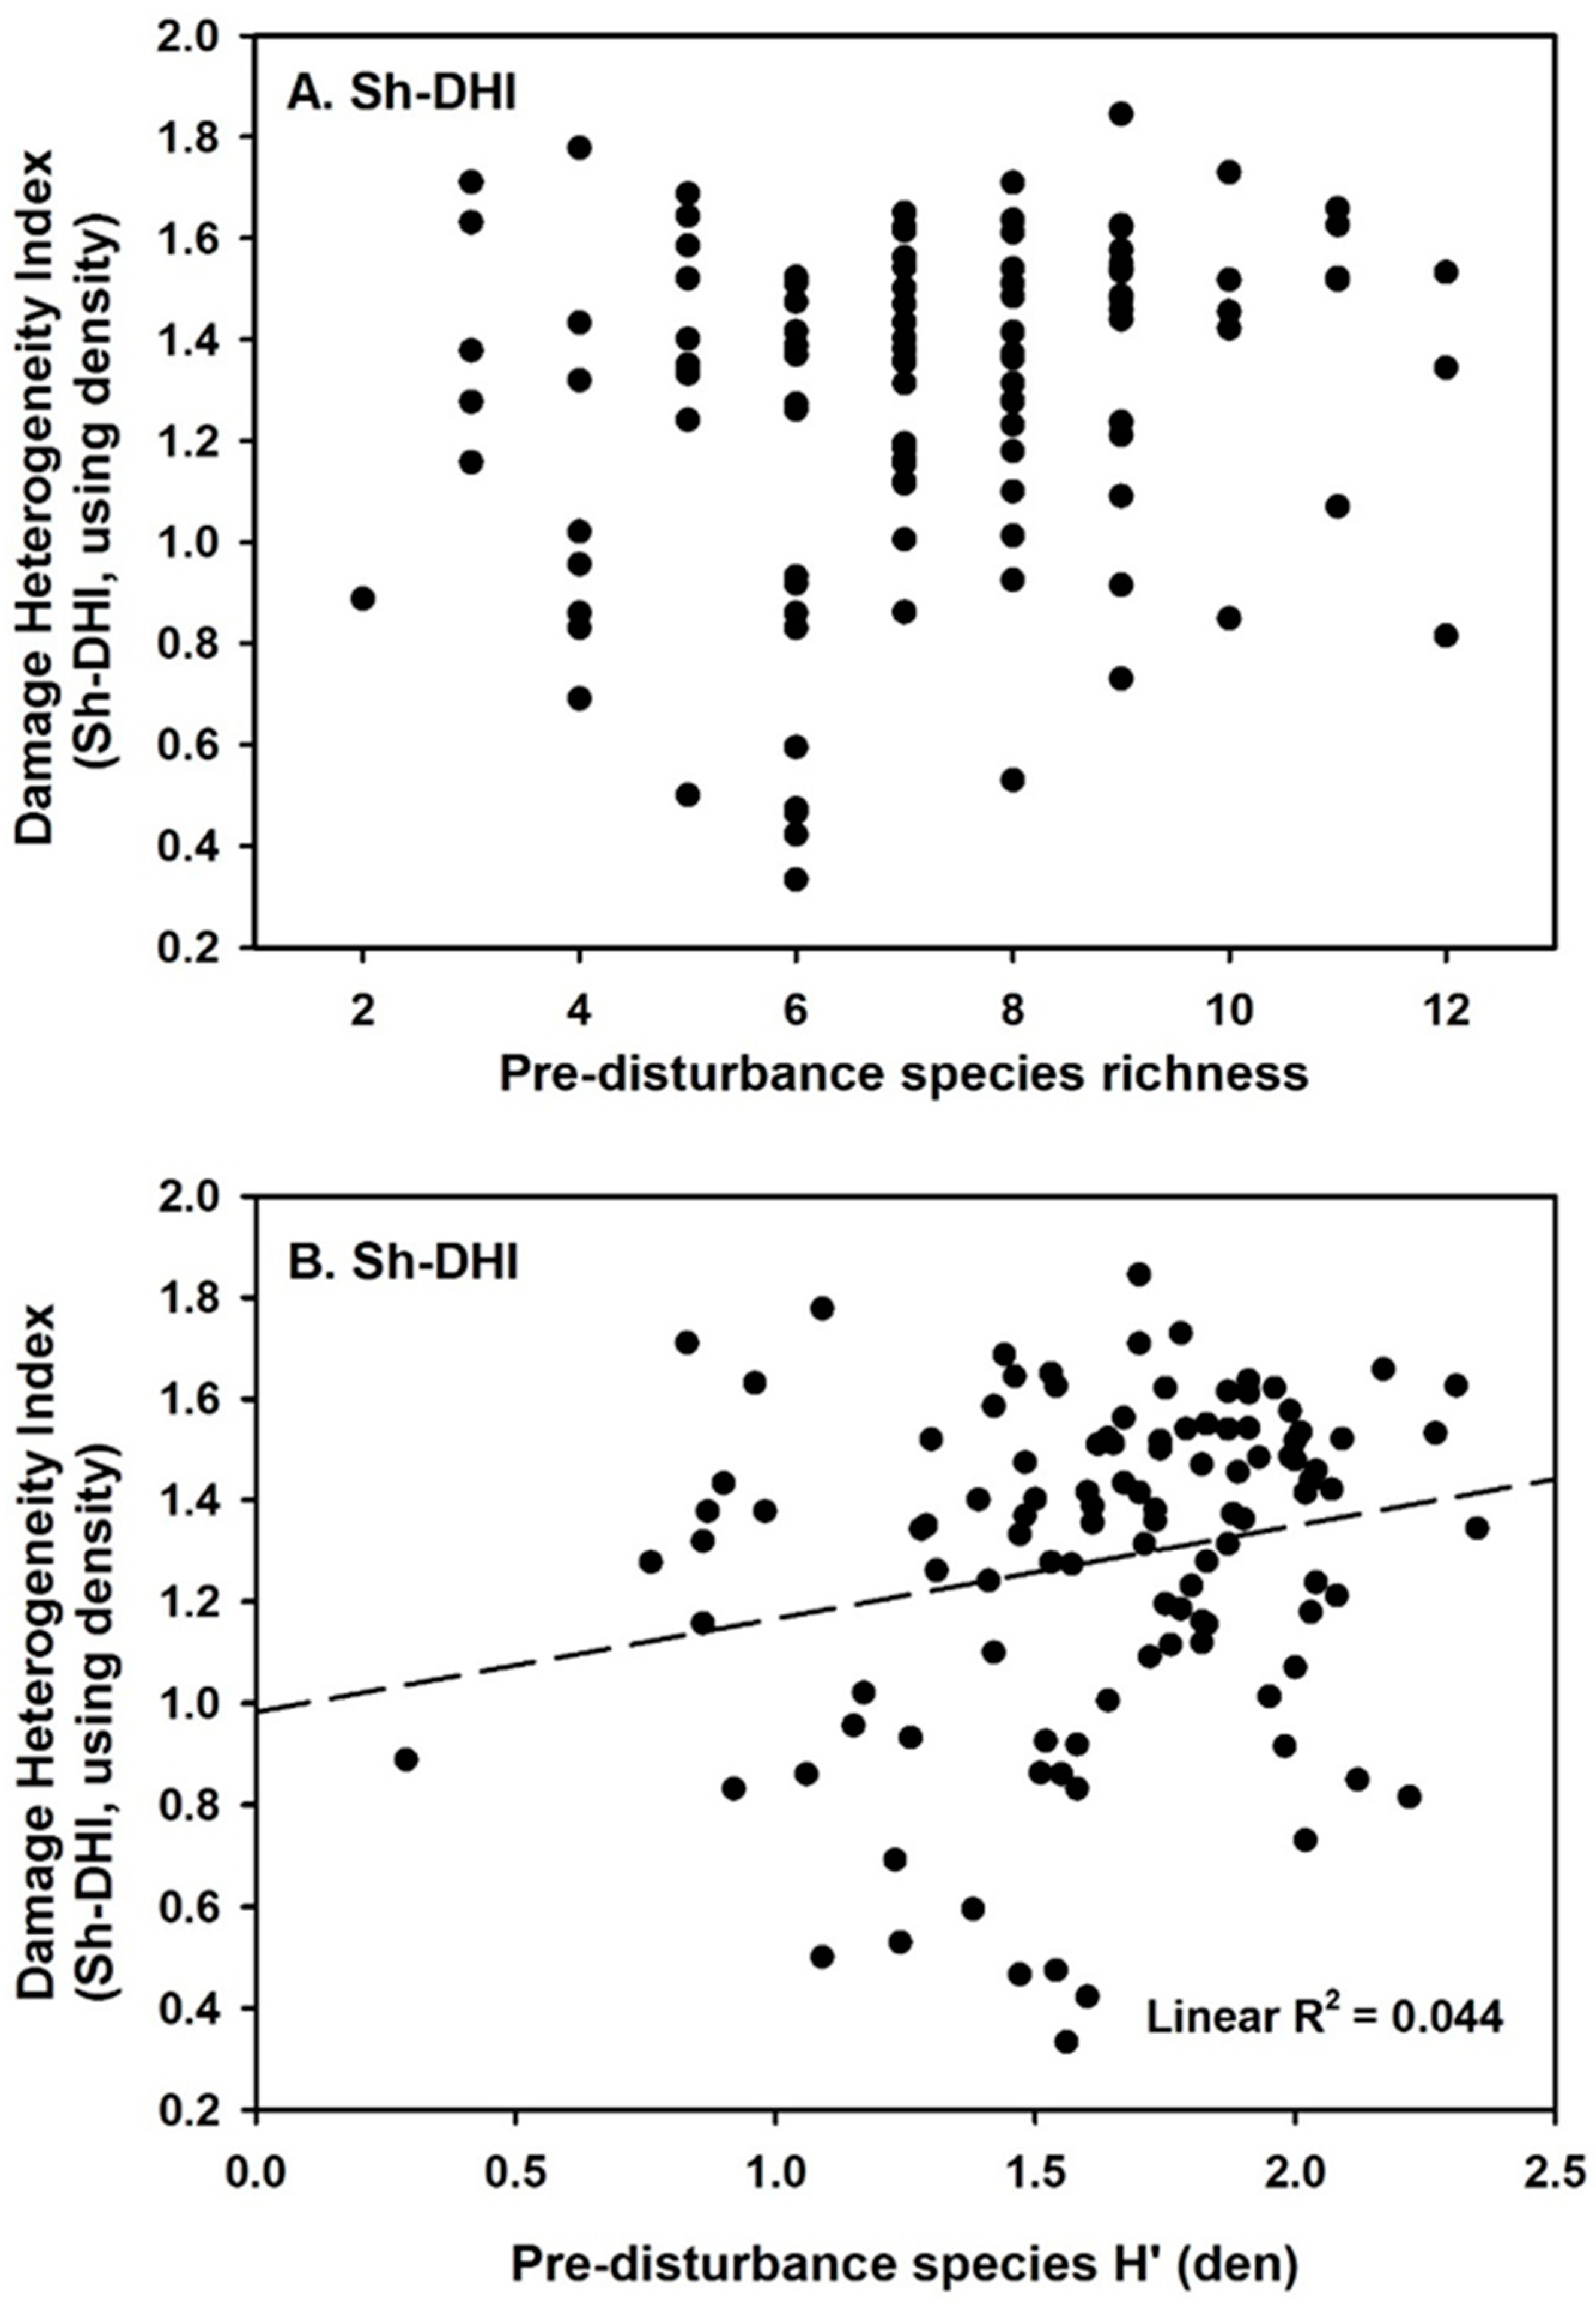
For plots sampled with a 10-cm diameter minimum, the DHIs showed no significant relationship to pre-disturbance tree species richness (Figure 4a; Sh-DHI results shown; results for iSi-DHI are similar). There was a weak positive correlation between pre-disturbance tree species diversity and Sh-DHI (Figure 4b), although the R2 was very small.
Hypothesis 2: For plots sampled with 5-cm diameter minimum, there was a weak linear relationship between pre-disturbance mean tree diameter and post-disturbance Sh-DHI and iSi-DHI (data not shown). In both cases, the linear regression was significant (for Sh-DHI: p < 0.001, R2 = 0.048; for iSi-DHI: p = 0.036, R2 = 0.019) and had a negative slope. However, note that again the linear regressions both had very low R2 values. For these plots, the secondary term of the quadratic regression was not significant (p > 0.05 in both cases).
For plots sampled with 10-cm diameter minimum, Sh-DHI and iSi-DHI both showed significant relationship to the pre-disturbance mean tree diameter (Figure 5). Both linear regressions were significant (for Sh-DHI: p = 0.014, R2 = 0.054; for iSi-DHI: p = 0.025, R2 = 0.045), and had negative slopes. For this data set, however, the secondary term in the quadratic regressions was also significant and negative for both types of DHI. Even with the improvement provided by the curvilinear term, though, the overall R2 values were again quite small (Figure 5).
Hypothesis 3: For plots sampled with 5-cm minimum diameter, both the Sh-DHI and the iSi-DHI increased significantly with greater pre-disturbance tree size inequality (Figure 6). In both cases, the linear regression was significant (for Sh-DHI: p < 0.001, R2 = 0.147; For iSi-DHI, p < 0.001, R2 = 0.114) but the secondary term in the quadratic regression was not. Note that in these regressions the variance explained is somewhat better than in previous regressions.
For plots sampled with 10-cm minimum diameter (data not shown), none of the regressions between pre-disturbance tree size inequality and post-disturbance DHIs were significant.
Hypothesis 4 The Nonmetric Multidimensional Scaling ordination produced a distribution of plots in the reduced 2-dimensional space (Figure 4) in which uprooted trees are lower and to the right of the centroid of the distribution, while intact trees are nearer the top of the graph. In the both groups of plots, severity of damage is strongly positively correlated with Axis 1 (5-cm minimum plots: r = 0.792, p < 0.0001; 10-cm minimum plots: r = 0.732, p < 0.0001), and strongly negatively correlated with Axis 2 (5-cm minimum plots: r = −0.537, p < 0.0001; 10-cm minimum plots: r = -0.766, p < 0.0001). Thus in the ordination graphs, highest severity damage is located in the lower right of the graph. Since the ‘uproot’ category is low and furthest to the right, this indicates that uprooting was the dominant type of damage in plots that experienced severe damage. It is noteworthy that the trends in Figure 7a,b are largely consistent, indicating that the results shown are not an artifact of one particular minimal tree size threshold.
Graphing the damage diversity (whether calculated with Sh-DHI or iSi-DHI) against severity of plot damage revealed a clear and consistent pattern: damage diversity peaks at intermediate levels of severity (Figure 8 and Figure 9). In all four of the datasets presented in Figure 8 and Figure 9, the quadratic regressions had much higher R2 values than the linear relationship, which was sometimes not significant at all. This confirms existence of the peak at intermediate severity.
All of the relationships shown in Figure 8 and Figure 9 are based on the two DHIs calculated using basal area as the measure of abundance of the damage categories; analogous DHI calculations using counts of individuals rather than basal area as the measure of abundance (not shown) produced similar curves with peaks at intermediate severity, although the relationships were noisier. In all cases, the quadratic regressions again indicated a significant curvature with a DHI peak at intermediate levels of wind disturbance severity.
Finally, the intermediate peak in the DHIs is not an artifact of pooling multiple sites. Figure 10 shows results from two of the study sites with larger sample sizes—Boggs Creek and Tionesta 1994. In both cases, Sh-DHI peaks at intermediate levels of damage severity, and the quadratic regression has much higher R2 than the linear, indicating that the peak is statistically real.
4. Discussion
This work demonstrates for the first time that tree damage categories can be used to construct a structural complexity metric based on damage diversity. Just as some early work on structural complexity used size categories in a diversity index calculation [12,13,80], the same logic is here applied to distinct categories of tree damage. The similarity of mean DHI values for plots with 5-cm vs. 10-cm diameter minima (Figure 3), as well as the similar distribution of the two types of plots in the ordination (Figure 7), suggest that this approach is not dramatically affected by the minimum tree size sampled, at least for these two common size thresholds. However, it is clear that plot size may influence the quantitative values obtained in this type of damage diversity study (Figure 3), as evidenced by the significant difference in mean diversity index value for 20 m × 20 m plots vs. 30 m × 30 m plots. Also, although the actual values obtained with the Sh-DHI and the iSi-DHI differed (as expected, given the different formulas used), the trends were remarkably similar, again suggesting that the approach proposed here is robust to the actual diversity index employed, as well as to the minimum tree size sampled.
The pre-disturbance forest characteristics examined for Hypotheses 1–3 differed substantially in their influence on post-disturbance damage diversity. Surprisingly, pre-disturbance species richness and diversity appeared to have little effect on damage diversity (Figure 4), therefore Hypothesis 1 must be rejected. Because a number of studies have documented among-species differences in tree damage during high winds [81,82], having a greater variety of trees would be expected to result in greater damage diversity. However, as pointed out in Peterson [68], the species effect is often small, suggesting that in this analysis, the numerous other influencing variables (e.g., tree sizes, site conditions, storm conditions) may have obscured any potential species effect. Thus in this analysis, pre-disturbance compositional diversity appears to have little causative effect on post-disturbance structural complexity.
Mean tree size significantly influenced the two DHIs, but the variance explained was quite small (Figure 5). The extent to which this result is contingent on the distribution of tree sizes in addition to the plot mean, is unknown; expected patterns of damage might be expected to be very different between two plots with, for example a mean trunk diameter of 30 cm. In one plot, many small trees and two or three large ones (e.g., >60 cm) would likely experience damage distinct from another plot with all trees in the range of 20–40 cm diameter. Nevertheless, this weak effect can be interpreted as a confirmation of Hypothesis 2, which expected no trend in damage diversity with changes in mean tree sizes.
Potentially more interesting is the stronger relationship between pre-disturbance size inequality (measured via the Gini coefficient) and damage diversity (Figure 6). While noisy, this relationship was stronger than the previous ones, and confirms Hypothesis 3. The confirmation of Hypothesis 3, in combination with rejection of Hypothesis 1, is consistent with several previous studies [68,81] that conclude that tree size is a greater influence than species on wind damage patterns. Pre-disturbance size variability, then, is indeed positively associated with higher values of one component of structural complexity—diversity begets diversity, in this case. Such a continuation of structural diversity through severe wind damage echoes other studies that suggest positive feedbacks in vegetation composition, in which species composition becomes entrained and spatial patchiness in composition is maintained through time via positive neighborhood effects [83].
Visualizing the “damage category composition” through ordination reveals that there is a clear gradient from predominantly intact plots to predominantly uprooted plots as severity of damage increases (Figure 7). This confirms the subsidiary expectation to Hypothesis 4, namely that as severity changes, the predominant type of tree damage changes as well. At first glance, this is perhaps expected, but further consideration suggests that such a finding is not a foregone conclusion since trees in very severely damage plots could fail primarily by trunk breakage. Although post-windthrow circumstances are known in which most tree failure is via trunk breakage (Gum Road as described in [68]), these data sets suggest that for wind damage in eastern North America, high severity wind damage will mostly produce uprooted trees. The accompanying root pits and mounds have important implications for regeneration of vegetation, driving fine scale spatial patterns [42,43,44,45,46,47,48,49,50,51], as well as providing an important establishment site for pioneers that typically do not establish on intact forest floor [72] and thus enriching vegetation diversity. Treefall pits and mounds are also a source of soil turnover and mixing [84,85].
Perhaps the most notable result of this study is the clear relationship between damage diversity (as quantified in the two types of DHI) and damage severity. In hindsight, such a relationship may be unsurprising in light of the logic presented for Hypothesis 4, but this appears to nevertheless be the first documentation of such a pattern. At the lowest severities, most trees are intact or have broken branches, and on the left sides of Figure 8, Figure 9 and Figure 10, increasing severity means adding the more serious damage categories, thus driving the diversity index upward. On the right sides of Figure 8, Figure 9 and Figure 10, an analogous process occurs, except that as severity increases from intermediate to very high, the light damage categories disappear and most or all of the trees are snapped or uprooted, thus driving down diversity. Therefore, considering damage diversity as a component of multidimensional concepts of structural complexity, it may be expected that structural complexity overall may also show a peak at intermediate levels of damage severity, at least after wind disturbances. At least three previous studies have examined structural complexity after wind disturbances [28,29,30]. Szmyt and Dobrowolska [28] specifically reported higher structural complexity in intermediate-severity sites, although their metrics did not include damage diversity. Meigs and Keeton [30] did not quantitatively relate complexity to severity; they did, however, note that the intermediate-severity wind disturbance can augment structural complexity. Since these interesting trends reported in previous work [28,30] do not employ damage diversity in their calculations of structural complexity, there could be a variety of components of complexity that are maximal at intermediate levels of wind damage severity.
The intermediate peak in damage diversity appears to be a very robust relationship, as affirmed by several lines of evidence. First, using two different indices of diversity (Figure 8 and Figure 9), and with datasets employing two different tree size minima, there was a consistent peak in damage diversity at intermediate levels of disturbance severity. Second, very similar—albeit noisier—relationships were revealed when using counts of individuals in the damage diversity calculations, showing that this trend is also robust to the actual measure of abundance (counts vs. basal area). And third, these trends are revealed within individual sites as well as across the pooled datasets (Figure 10), quelling concerns that the intermediate peak relationship could be some sort of artifact of the pooled analysis. Thus, very similar trends are seen across two indices of diversity, two measures of abundance, two tree size minima, two plot sizes, and for individual sites as well as pooled sites.
The results reported here have striking parallels in the suggestion by Gough et al. [25] that intermediate severity disturbances may, via enhanced complexity, provide a mechanism for aging mature forests to maintain net ecosystem production. Their reasoning is that disturbances that are frequent but that are not fully stand-replacing will maximize canopy rugosity (a single-metric measure of complexity) which in turn will promote higher-than-expected net primary productivity that can offset increasing heterotrophic respiration, and thus maintain net ecosystem productivity as forests age (see similar reasoning in [14]). If broadly confirmed, their hypothesis, along with results reported here, together suggest that low- to intermediate-severity disturbances may play vital roles in both ecosystem and community ecology via their influence on complexity.
Limitations As with any correlative study, the relationships revealed here are intertwined with multiple other causal factors and cannot be convincingly separated without complex, controlled experiments. For example, while this work revealed little influence of species richness or diversity on damage diversity, it is quite likely the species composition influenced the types of tree damage and therefore the level of damage diversity. One striking species effect on wind damage is the phenomenon of interlocking or extensively grafting root systems [86], which can result in exceedingly strong rooting and therefore a virtual absence of uprooting in the face of high winds for such trees. Alternatively, Canham et al. [82] suggest that certain species may preferentially ‘sacrifice’ major limbs to maintain an intact trunk and root system and thereby assure the ability to regrow from an elevated position; such species might rarely suffer uprooting or trunk breakage even in extreme winds. It is likely that species differences influenced the results seen here, but that influence may not compromise the validity of these results. The trends reported appear to be consistent across many forest types, and under a wide variety of sampling constraints and methodologies; even if species effects were hidden influences on the patterns in one or a few locations, it seems unlikely that trends observed across such a large collection of data sets would be vulnerable to such influences. Moreover, even single sites (Figure 10) show the same trends as the larger ensemble of observations; since compositional variation within a given site is modest, the peaked damage diversity vs severity curve would be unlikely to be driven by species effects.
Management While the primary objective of this research was to understand how wind disturbance might contribute to structural complexity, there may be management insights to be gained from considering these findings. Creation, by human intervention, of the types of damage discussed herein, would be likely to be laborious and expensive, in part because several different tasks would need to be employed, and the damage types discussed are the result of application of large forces high in a tree. In some circumstances, managers may choose to apply novel techniques, such as use of explosives to remove the top of a tree and create a snag with live lower branches [18]; such actions, though, are likely to be financially affordable only when applied to a modest number of selected individual trees. However, managers can exploit the well-known phenomenon [87] that trees in recently thinned or harvested stands are much more likely to fall. Application of variable density thinning or newer harvesting methods to retain scattered trees will parallel an intermediate severity wind event in terms of canopy opening, and will by default result in the occurrence of many of these types of damage discussed here. While such actions are an imperfect mimic of natural wind disturbance, they can serve to facilitate creation of some structural complexity attributes while still allowing resource extraction [87].
5. Conclusions
Damage diversity is presented as a potentially useful metric of structural complexity in forests following wind disturbance. Characterization of damage diversity in 18 distinct study sites in eastern North America shows that the metric is readily quantified and robust to differing indices of diversity, differing minimal tree sizes, and differing measures of abundance. Visualization via ordination showed that uprooting tends to become the predominant damage category as damage severity increases. A noteworthyresult was that damage diversity peaks at intermediate levels of damage severity, and when viewed in combination with previous research, there may be an emerging trend that structural complexity overall is maximal when wind disturbance is of intermediate severity.
This research is a first step on a novel conceptual pathway, and suggests a variety of ways the damage diversity concept may be extended. Considering emphases of past research on spacing and size variation as additional major dimensions of complexity, it may be informative to merge the damage diversity approach presented here with tree size categories to have a larger suite of size-damage categories, each potentially with distinct implications for fostering species diversity in the recovering forest. Damage categories were examined here in an entirely non-spatial manner, but could easily be analyzed using measures of spatial autocorrelation, clustering, or neighborhood intermingling. It remains to be seen if other components of complexity, such as metrics based on spacing or size variation, show similar relationships to severity. With an eye to generalizing to other disturbance types, this approach might easily be applied to ice storm damage in forests. Considering fire, although the particular damage categories presented here obviously would not apply to a post-fire context, a similar perspective might examine categories of fire damage such as intact, partial foliage scorch, all foliage scorched, and larger branches consumed.
Funding
Funding for this work was provided by grants DEB 114-3511 from the Population & Community Ecology program, and AGS 114-1926 from the Physical & Dynamic Meteorology program, of the U.S. National Science Foundation. Sampling at Natchez Trace was funded by the USDA Forest Service Southern Research Station, cooperative agreement # SRS 01-CA-11330136-405. Additional funding was provided by Sigma Xi, the Cary Institute, Rutgers University, University of Georgia, and the Andrew Mellon Foundation.
Acknowledgments
I thank the following agencies or offices for permission to sample at the field sites: Chattahoochee National Forest, Blue Ridge Ranger District; Allegheny National Forest, Bradford Ranger District; Mingo National Wildlife Refuge; Superior National Forest; Hiawatha National Forest; Natchez Trace State Forest of the Tennessee Department of Natural Resources; Great Smoky Mountains National Park, and the Blooming Grove Hunting Club. Many field assistants over the period from 1994–2014 labored in often-difficult conditions to make this synthesis possible; I am grateful to all of them.
Conflicts of Interest
The author declares no conflict of interest. The funders had no role in the design of the study; in the collection, analyses, or interpretation of data; in the writing of the manuscript, or in the decision to publish the results.
References
- Swanson, M.E.; Franklin, J.F.; Beschta, R.L.; Crisafulli, C.M.; DellaSala, D.A.; Hutto, R.L.; Lindenmayer, D.B.; Swanson, F.J. The forgotten stage of forest succession: Early-successional eocsystems on forest sites. Front. Ecol. Environ. 2011, 9, 117–125. [Google Scholar] [CrossRef]
- D’Amato, A.W.; Bradford, J.B.; Fraver, S.; Palik, B.J. Forest management for mitigation and adaptation to climate change: Insights from long-term silviculture experiments. For. Ecol. Manag. 2011, 262, 803–816. [Google Scholar] [CrossRef]
- Fahey, R.T.; Alveshere, B.C.; Burton, J.I.; D’Amato, A.W.; Dickinson, Y.L.; Keeton, W.S.; Kern, C.C.; Larson, A.J.; Palik, B.J.; Puettmann, K.J.; et al. Shifting conceptions of complexity in forest management and silviculture. For. Ecol. Manag. 2018, 421, 59–71. [Google Scholar] [CrossRef]
- Zenner, E.K. Does old-growth condition imply high live-tree structural complexity? For. Ecol. Manag. 2004, 195, 243–258. [Google Scholar] [CrossRef]
- Lutz, J.A.; Larson, A.J.; Freund, J.A.; Swanson, M.E.; Bible, K.J. The importance of large-diameter trees to forest structural heterogeneity. PLoS ONE 2013, 8, e82784. [Google Scholar] [CrossRef] [PubMed]
- Kinzig, A.P.; Pacala, S.W.; Tilman, D. The Functional Consequences of Biodiversity; Princeton University Press: Princeton, NJ, USA, 2001. [Google Scholar]
- Tilman, D.; Isbell, F.; Cowles, J.M. Biodiversity and ecosystem functioning. Annu. Rev. Ecol. Syst. 2014, 45, 471–493. [Google Scholar] [CrossRef]
- Isbell, F.; Craven, D.; Connolly, J.; Loreau, M.; Schmid, B.; Beierkuhnlein, C.; Bezemer, T.M.; Bonin, C.; Bruelheide, H.; de Luca, E.; et al. Biodiversity increases the resistance fo ecosystem productivity to climate extremes. Nature 2015, 526, 574–577. [Google Scholar] [CrossRef] [PubMed]
- Hutchinson, G.E. Homage to Santa Rosalia, or why are there so many kinds of animals? Am. Nat. 1959, 93, 145–159. [Google Scholar] [CrossRef]
- Tilman, D.; Pacala, S. The maintenance of species richness in plant communities. In Species Diversity in Ecological Communities; Ricklefs, R.E., Schluter, D., Eds.; University of Chicago Press: Chicago, IL, USA, 1993; pp. 13–25. [Google Scholar]
- MacArthur, R.H. Population ecology of some warblers of northeastern coniferous forests. Ecology 1958, 39, 599–619. [Google Scholar] [CrossRef]
- Neumann, M.; Starlinger, F. The significance of different indices for stand structure and diversity in forests. For. Ecol. Manag. 2001, 145, 91–106. [Google Scholar] [CrossRef]
- McElhinny, C.; Gibbons, P.; Brack, C.; Bauhus, J. Forest and woodland stand structural complexity: Its definition and measurement. For. Ecol. Manag. 2005, 218, 1–24. [Google Scholar] [CrossRef]
- Danescu, A.; Albrecht, A.T.; Bauhus, J. Structural diversity promotes productivity of mixed, uneven-aged forests in southwestern Germany. Oecologia 2016, 182, 319–333. [Google Scholar] [CrossRef] [PubMed]
- Foster, D.R.; Knight, D.H.; Franklin, J.F. Landscape patterns and legacies resulting from large, infrequent forest disturbances. Ecosystems 1998, 1, 497–510. [Google Scholar] [CrossRef]
- Franklin, J.F.; Lindenmayer, D.B.; MacMahon, J.A.; McKee, A.; Magnuson, J.; Perry, D.A.; Waide, R.; Foster, D. Threads of continuity: Ecosystem disturbance, recovery, and the theory of biological legacies. Conserv. Pract. 2000, 1, 8–16. [Google Scholar] [CrossRef]
- Keeton, W.S.; Franklin, J.F. Do remnant old-growth trees accelerate rates of succession in mature Douglas-fir forests? Ecol. Monogr. 2005, 75, 103–118. [Google Scholar] [CrossRef]
- Franklin, J.F.; Mitchell, R.J.; Palik, B.J. Natural Disturbance and Stand Development Principles for Ecological Forestry; General Technical Report NRS-19; USDA Forest Service: Newtown Square, PA, USA, 2007.
- Bouget, C.; Duelli, P. The effects of windthrow on forest insect communities: A literature review. Boil. Conserv. 2004, 118, 281–299. [Google Scholar] [CrossRef]
- Janssen, P.; Fortin, D.; Hebert, C. Beetle diversity in a matrix of old-growth boreal forest: Influence of habitat heterogeneity at multiple scales. Ecography 2009, 32, 423–432. [Google Scholar] [CrossRef]
- Goetz, S.J.; Steinberg, D.; Betts, M.G.; Holmes, R.T.; Doran, P.J.; Dubayah, R.; Hofton, M. Lidar remote sensing variables predict breeding habitat of a Neotropical migrant bird. Ecology 2010, 91, 1569–1576. [Google Scholar] [CrossRef] [Green Version]
- Arnan, X.; Bosch, J.; Comas, L.; Gracia, M.; Retana, J. Habitat determinants of abundance, structure and composition of flying Hymenoptera communities in mountain old-growth forests. Insect Conserv. Divers. 2011, 4, 200–211. [Google Scholar] [CrossRef]
- Huth, N.; Possingham, H.P. Basic ecological theory can inform habitat restoration for woodland birds. J. Appl. Ecol. 2011, 48, 293–300. [Google Scholar] [CrossRef]
- Hardiman, B.S.; Gough, C.M.; Halperin, A.; Hofmeister, K.L.; Nave, L.E.; Bohrer, G.; Curtis, P.S. Maintaining high rates of carbon storage in old forests: A mechanism linking canopy structure to forest function. For. Ecol. Manag. 2013, 298, 111–119. [Google Scholar] [CrossRef]
- Gough, C.M.; Curtis, P.S.; Hardiman, B.S.; Scheuermann, C.M.; Bond-Lamberty, B. Disturbance, complexity and succession of net ecosystem production in North America’s temperate deciduous forests. Ecosphere 2016, 7, e01375. [Google Scholar] [CrossRef]
- Wang, W.; Lei, X.; Ma, Z.; Kneeshaw, D.D.; Peng, C. Positive relationship between aboveground carbon stocks and structural diversity in spruce-dominated forest stands in New Brunswick, Canada. For. Sci. 2011, 57, 506–515. [Google Scholar]
- Ford, S.E.; Keeton, W.S. Enhanced carbon storage through management for old-growth characteristics in northern hardwood-conifer forests. Ecosphere 2017, 8, e01721. [Google Scholar] [CrossRef] [Green Version]
- Szmyt, J.; Dobrowolska, D. Spatial diversity of forest regeneration after catastrophic wind in northeastern Poland. iForest 2016, 9, 414–421. [Google Scholar] [CrossRef] [Green Version]
- Fraver, S.; Dodds, K.J.; Kenefic, L.S.; Morrill, R.; Seymour, R.S.; Sypitkowski, E. Forest structure following tornado damage and salvage logging in northern Maine, USA. Can. J. For. Res. 2017, 47, 560–564. [Google Scholar] [CrossRef] [Green Version]
- Meigs, G.W.; Keeton, W.S. Intermediate-severity wind disturbance in mature temperate forests: Legacy structure, carbon storage, and stand dynamics. Ecol. Appl. 2018, 28, 798–815. [Google Scholar] [CrossRef]
- Kuuluvainen, T. Forest management and biodiversity conservation based on natural ecosystem dynamics in northern Europe: The complexity challenge. Ambio 2009, 38, 309–315. [Google Scholar] [CrossRef]
- Palik, B.J.; Mitchell, R.J.; Hiers, J.K. Modelling silviculture after natural disturbance to sustain biodiversity in the longleaf pine (Pinus palustris) ecosystem: balancing complexity and implementation. For. Ecol. Manag. 2002, 155, 347–356. [Google Scholar] [CrossRef]
- Jogiste, K.; Korjus, H.; Stanturf, J.A.; Frelich, L.E.; Baders, E.; Donis, J.; Jansons, A.; Kangur, A.; Koster, K.; Learman, D. Hemiboreal forest: Natural disturbances and the importance of ecosystem legacies to management. Ecosphere 2017, 8, e02503. [Google Scholar] [CrossRef]
- Donato, D.C.; Campbell, J.L.; Franklin, J.F. Multiple successional pathways and precocity in forest development: Can some forests be born complex? J. Veg. Sci. 2012, 23, 576–584. [Google Scholar] [CrossRef]
- Bace, R.; Svoboda, M.; Janda, P.; Morrissey, R.C.; Wild, J.; Clear, J.L.; Cada, V.; Donato, D.C. Legacy of pre-disturbance spatial pattern determines early structural diversity following severe disturbance in montane spruce forests. PLoS ONE 2015, 10, e0139214. [Google Scholar] [CrossRef] [PubMed]
- Franklin, J.F.; Van Pelt, R. Spatial aspects of structural complexity. J. For. 2004, 102, 22–28. [Google Scholar]
- Bachofen, H.; Zingg, A. Effectiveness of structure improvement thinning on stand structure in subalpine Norway spruce (Picea abies (L.) Karst.) stands. For. Ecol. Manag. 2001, 145, 137–149. [Google Scholar] [CrossRef]
- Schneider, E.E.; Larson, A.J. Spatial aspects of structural complexity in Sitka spruce–western hemlock forests, including evaluation of a new canopy gap delineation method. Can. J. For. Res. 2017, 47, 1033–1044. [Google Scholar] [CrossRef]
- Meigs, G.W.; Morrissey, R.C.; Bace, R.; Chaskovskyy, O.; Cada, V.; Despres, T.; Donato, D.C.; Janda, P.; Labusova, J.; Seedre, M.; et al. More ways than one: Mixed-severity disturbance regimes foster structural complexity via multiple developmental pathways. For. Ecol. Manag. 2017, 406, 410–426. [Google Scholar] [CrossRef]
- Peck, J.E.; Zenner, E.K.; Brang, P.; Zingg, A. Tree size distribution and abundance explain structural complexity differentially within stands of even-aged and uneven-aged structure types. Eur. J. For. Res. 2014, 133, 335–346. [Google Scholar] [CrossRef]
- Zenner, E.K.; Peck, J.E. Floating neighborhoods reveal contribution of individual trees to high sub stand scale heterogeneity. For. Ecol. Manag. 2018, 412, 29–40. [Google Scholar] [CrossRef]
- Beatty, S.W. Influence of microtopography and canopy species on spatial patterns of forest understory plants. Ecology 1984, 65, 1406–1419. [Google Scholar] [CrossRef]
- Peterson, C.J.; Carson, W.P.; McCarthy, B.C.; Pickett, S.T.A. Microsite variation and soil dynamics within newly created treefall pits and mounds. Oikos 1990, 58, 39–46. [Google Scholar] [CrossRef]
- Peterson, C.J.; Pickett, S.T.A. Microsite and elevational influences on forest regeneration three years after catastrophic windthrow. J. Veg. Sci. 1990, 1, 657–662. [Google Scholar] [CrossRef]
- Carlton, G.C.; Bazzaz, F.A. Regeneration of three sympatric birch species on experimental hurricane blowdown microsites. Ecol. Monogr. 1998, 68, 99–120. [Google Scholar] [CrossRef]
- Waldron, K.; Ruel, J.-C.; Gauthier, S.; de Grandpre, L.; Peterson, C.J. Effects of post-windthrow salvage logging on microsites, plant composition and regeneration. Appl. Veg. Sci. 2014, 17, 323–334. [Google Scholar] [CrossRef]
- Spicer, J.E.; Suess, K.F.; Wenzel, J.W.; Carson, W.P. Does salvage logging erase a key physical legacy of a tornado blowdown? A case study of tree tip-up mounds. Can. J. For. Res. 2018, 48, 976–982. [Google Scholar] [CrossRef]
- Plotkin, A.B.; Schoonmaker, P.; Leon, B.; Foster, D. Microtopography and ecology of pit-mound structures in second-growth versus old-growth forests. For. Ecol. Manag. 2017, 404, 14–23. [Google Scholar] [CrossRef]
- Sass, E.M.; D’Amato, A.W.; Foster, D.R.; Plotkin, A.B.; Fraver, S.; Schoonmaker, P.K.; Orwig, D.A. Long-term influence of disturbance-generated microsites on forest structural and compositional development. Can. J. For. Res. 2018, 48, 958–965. [Google Scholar] [CrossRef]
- Vodde, F.; Jogiste, K.; Engelhart, J.; Frelich, L.E.; Moser, W.K.; Sims, A.; Metslaid, M. Impact of wind-induced microsites and disturbance severity on tree regeneration patterns: Results from the first post-storm decade. For. Ecol. Manag. 2015, 348, 174–185. [Google Scholar] [CrossRef]
- Simon, A.; Gratzer, G.; Sieghardt, M. The influence of windthrow microsites on tree regeneration and establishment in an old growth mountain forest. For. Ecol. Manag. 2011, 262, 1289–1297. [Google Scholar] [CrossRef]
- Cannon, J.B.; O’Brien, J.J.; Loudermilk, E.L.; Dickinson, M.B.; Peterson, C.J. The influence of experimental wind disturbance on forest fuels and fire characteristics. For. Ecol. Manag. 2014, 330, 294–303. [Google Scholar] [CrossRef]
- Cline, S.P.; Berg, A.B.; Wight, H.M. Snag characteristics and dynamics in Douglas-fir forests, western Oregon. J. Wildl. Manag. 1980, 44, 773–786. [Google Scholar] [CrossRef]
- Tilghman, N.G. Impacts of white-tailed deer on forest regeneration in northwestern Pennsylvania USA. J. Wildl. Manag. 1989, 53, 524–532. [Google Scholar] [CrossRef]
- Ripple, W.J.; Larsen, E.J. The role of postfire coarse woody debris in aspen regeneration. West. J. Appl. For. 2001, 16, 61–64. [Google Scholar]
- De Chantal, M.; Granstrom, A. Aggregations of dead wood after wildfire act as browsing refugia for seedlings of Populus tremula and Salix Caprea. For. Ecol. Manag. 2007, 250, 3–8. [Google Scholar] [CrossRef]
- Relva, M.A.; Westerholm, C.L.; Kitzberger, T. Effects of introduced ungulates on forest understory communities in northern Patagonia are modified by timing and severity of stand mortality. Plant Ecol. 2009, 201, 11–22. [Google Scholar] [CrossRef]
- Cornett, M.W.; Reich, P.B.; Puettmann, K.J.; Frelich, L.E. Seedbed and moisture availability determine safe sites for early Thuja occidentalis (Cupressaceae) regeneration. Am. J. Bot. 2000, 87, 1807–1814. [Google Scholar] [CrossRef] [PubMed]
- Harmon, M.E.; Franklin, J.F.; Swanson, F.J.; Sollins, P.; Gregory, S.V.; Lattin, J.D.; Anderson, N.H.; Cline, S.P.; Aumen, N.G.; Sedell, J.R.; et al. Ecology of coarse woody debris in temperate ecosystems. Adv. Ecol. Res. 1986, 15, 133–302. [Google Scholar]
- Webb, S.L. Disturbance by wind in temperate-zone forests. In Ecosystems of Disturbed Ground; Walker, L.R., Ed.; Elsevier: Amsterdam, The Netherlands, 1999; pp. 187–222. [Google Scholar]
- Cooper-Ellis, S.; Foster, D.R.; Carlton, G.; Lezberg, A. Forest response to catastrophic wind: Results from an experimental hurricane. Ecology 1999, 80, 2683–2696. [Google Scholar] [CrossRef]
- Girard, F.; De Grandpre, L.; Ruel, J.-C. Partial windthrow as a driving process of forest dynamics in old-growth boreal forests. Can. J. For. Res. 2014, 44, 1165–1176. [Google Scholar] [CrossRef]
- Peterson, C.J. Damage and recovery from two different tornadoes in the same old Growth forest: A comparison of infrequent events. For. Ecol. Manag. 2000, 135, 237–252. [Google Scholar] [CrossRef]
- Vandermeer, J.; Mallona, M.A.; Boucher, D.; Yih, K.; Perfecto, I. Three years of ingrowth following catastrophic hurricane damage on the Caribbean coast of Nicaragua: Evidence in support of the direct regeneration hypothesis. J. Trop. Ecol. 1995, 11, 465–471. [Google Scholar] [CrossRef]
- Harcombe, P.A.; Leipzig, L.E.M.; Elsik, I.S. Effects of Hurricane Rita on three long-term forest study plots in east Texas, USA. Wetlands 2009, 29, 88–100. [Google Scholar] [CrossRef]
- Nagel, T.A.; Svoboda, M.; Diaci, J. Regeneration patterns after intermediate wind disturbance in an old-growth Fagus-Abies forest in southeastern Slovenia. For. Ecol. Manag. 2006, 226, 268–278. [Google Scholar] [CrossRef]
- Dodet, M.; Collet, C.; Frochot, H.; Wehrlen, L. Tree regeneration and plant species diversity responses to vegetation control following a major windthrow in mixed broadleaved stands. Eur. J. For. Res. 2011, 130, 41–53. [Google Scholar] [CrossRef]
- Peterson, C.J. Consistent influence of tree diameter and species on damage in nine Eastern North America tornado blowdowns. For. Ecol. Manag. 2007, 250, 96–108. [Google Scholar] [CrossRef]
- Peterson, C.J.; Pickett, S.T.A. Stem damage and resprouting following catastrophic windthrow in an old-growth hemlock-hardwoods forest. For. Ecol. Manag. 1991, 42, 205–217. [Google Scholar] [CrossRef]
- Peterson, C.J.; Pickett, S.T.A. Forest reorganization: A case study in an old-growth forest catastrophic blowdown. Ecology 1995, 76, 763–774. [Google Scholar] [CrossRef]
- Peterson, C.J. Within-stand variation in windthrow in southern-boreal forests of Minnesota: Is it predictable? Can. J. For. Res. 2004, 34, 365–375. [Google Scholar] [CrossRef]
- Peterson, C.J.; Carson, W.P. Generalizing forest regeneration models: The dependence of propagule availability on disturbance history and stand size. Can. J. For. Res. 1996, 26, 45–52. [Google Scholar] [CrossRef]
- Peterson, C.J.; Leach, A.D. Limited salvage logging effects on forest regeneration after moderate-severity windthrow. Ecol. Appl. 2008, 18, 407–420. [Google Scholar] [CrossRef]
- Peterson, C.J.; Rebertus, A.J. Tornado damage and initial recovery in three adjacent, lowland temperate forests in Missouri. J. Veg. Sci. 1997, 8, 559–564. [Google Scholar] [CrossRef]
- Sobhani, V.M.; Barrett, M.J.; Peterson, C.J. Robust prediction of treefall pit and mound sizes from tree size across 10 forest blowdowns in eastern North America. Ecosystems 2014, 17, 837–850. [Google Scholar] [CrossRef]
- Bjorkbom, J.C.; Larson, R.G. The Tionesta Scenic and Research Natural Areas; General Technical Report NE-31; USDA Forest Service: Washington, DC, USA, 1977.
- U.S. Department of Agriculture Forest Service. After the Blowdown: A Resource Assessment of the Boundary Waters Canoe Area Wilderness, 1999-2003; General Technical Report NRS-7; U.S. Department of Agriculture Forest Service: Washington, DC, USA, 2007.
- Pielou, E.C. Measurement of diversity in different types of biological collections. J. Theor. Boil. 1966, 13, 131–135. [Google Scholar] [CrossRef]
- Weiner, J.; Solbrig, O.T. The meaning and measurement of size hierarchies in plant populations. Oecologia 1984, 61, 334–336. [Google Scholar] [CrossRef] [PubMed]
- Stoudhammer, C.L.; LeMay, V.M. Introduction and evaluation of possible indices of stand structural complexity. Can. J. For. Res. 2001, 31, 1105–1115. [Google Scholar] [CrossRef]
- Everham, E.M.; Brokaw, N.V.L. Forest damage and recovery from catastrophic wind. Bot. Rev. 1996, 62, 113–185. [Google Scholar] [CrossRef]
- Canham, C.D.; Papaik, M.J.; Latty, E.F. Interspecific variation in susceptibility to windthrow as a function of tree size and storm severity for northern temperate tree species. Can. J. For. Res. 2001, 31, 1–10. [Google Scholar] [CrossRef]
- Frelich, L.E.; Sugita, S.; Reich, P.B.; Davis, M.B.; Friedman, S.K. Neighborhood effects in forests: Implications for within-stand patch structure. J. Ecol. 1998, 86, 149–161. [Google Scholar] [CrossRef]
- Ulanova, N.G. The effects of windthrow on forests at different spatial scales: A review. For. Ecol. Manag. 2000, 135, 155–167. [Google Scholar] [CrossRef]
- Phillips, J.D.; Marion, D.A.; Turkington, A.V. Pedologic and geomorphic impacts of a tornado blowdown event in a mixed pine-hardwood forest. Catena 2008, 75, 278–287. [Google Scholar] [CrossRef]
- Basnet, K.; Scatena, F.N.; Likens, G.E.; Lugo, A.E. Ecological consequences of root grafting in Tabonuco (Dacryodes excelsa) trees in the Luquillo Experimental Forest, Puerto Rico. Biotropica 1993, 25, 28–35. [Google Scholar] [CrossRef]
- Bauhus, J.; Puettmann, K.; Messier, C. Silviculture for old-growth attributes. For. Ecol. Manag. 2009, 258, 525–537. [Google Scholar] [CrossRef] [Green Version]
Figure 1.
General location of 18 study sites within Eastern U.S. Multiple locations close together shown as a single box with multiple numbers. 1 = Mingo; 2 = Tionesta 1994; 3 = Gould Farm; 4 = Texas Hill; 5 = Rapid River; 6 = Taylor; 7 = Hattons; 8 = Fishhook; 9 = Meditation Lake; 10 = Shirttail; 11 = Twin; 12 = ThreeMile Island; 13 = Natchez Trace; 14 = Gum Road; 15 = Boggs Creek; 16 = Martin Branch; 17 = Timpson; 18 = Smokies.

Figure 2.
Relative basal area of seven tree damage categories at the Meditation Lake study site. In the figure legend, ‘LCD’ = light crown damage and ‘HCD’ = heavy crown damage; other damage categories are words, not acronyms.
Figure 2.
Relative basal area of seven tree damage categories at the Meditation Lake study site. In the figure legend, ‘LCD’ = light crown damage and ‘HCD’ = heavy crown damage; other damage categories are words, not acronyms.

Figure 3.
Mean and standard deviation of two damage heterogeneity indices, for three types of sampling plots. Each plot’s damage heterogeneity was calculated using the basal area in each damage category as the abundance values input into the diversity formula. The ‘5 cm minimum diameter and ‘10 cm minimum diameter’ plot types were all 20 m × 20 m plots, while the ‘30 m × 30 m’ plot type had a 5 cm diameter minimum.

Figure 4.
Damage heterogeneity index (DHI) vs. pre-disturbance plot species richness or diversity, for plots with 10-cm diameter minimum. (A) DHI calculated with Shannon formula, vs. species richness; (B) DHI calculated with Shannon formula, vs. pre-disturbance species diversity calculated using density and the Shannon formula. Only significant regressions shown.

Figure 5.
Damage heterogeneity index vs. pre-disturbance plot mean trunk diameter, for plots with 10-cm diameter minimum; n = 111. (A) DHI calculated with Shannon formula; (B) DHI calculated with inverse Simpson formula. Only significant regressions shown; quadratic regression shown if it had greater R2 than linear regression.

Figure 6.
Damage heterogeneity index vs. pre-disturbance tree size inequality, for plots with 5-cm diameter minimum; n = 111. (A) DHI calculated with the Shannon formula; (B) DHI calculated with the inverse Simpson formula. Only significant (p < 0.05) regression results shown.
Figure 6.
Damage heterogeneity index vs. pre-disturbance tree size inequality, for plots with 5-cm diameter minimum; n = 111. (A) DHI calculated with the Shannon formula; (B) DHI calculated with the inverse Simpson formula. Only significant (p < 0.05) regression results shown.

Figure 7.
Nonmetric Multidimensional Scaling ordination of plots based on damage type categories. (A) 5-cm minimum diameter, n = 237 plots; (B) 10-cm minimum diameter, n = 111 plots. LCD = Light crown damage; HCD = Heavy crown damage.
Figure 7.
Nonmetric Multidimensional Scaling ordination of plots based on damage type categories. (A) 5-cm minimum diameter, n = 237 plots; (B) 10-cm minimum diameter, n = 111 plots. LCD = Light crown damage; HCD = Heavy crown damage.

Figure 8.
Damage heterogeneity index in relation to severity of damage, using plots sampled with 5-cm diameter minimum. (A) Sh-DHI, calculated with the Shannon index; (B) iSi-DHI, calculated with the inverse Simpson index. In all calculations of damage heterogeneity above, the measure of abundance used was the cumulative basal area in each damage category for that plot. Variance explained (R2) by linear and quadratic regressions was compared to determine if the relationship between DHI and severity was significantly curved.

Figure 9.
Damage heterogeneity index in relation to severity of damage, using plots sampled with 10-cm diameter minimum. (A) Sh-DHI, calculated with the Shannon index; (B) iSi-DHI, calculated with the inverse Simpson index. In all calculations of damage heterogeneity above, the measure of abundance used was the number of trees in each damage category for that plot. Variance explained (R2) by linear and quadratic regressions were compared to determine if the relationship between DHI and severity was significatly curved.

Figure 10.
Damage heterogeneiety index (Sh-DHI) in relation to severity of damage, from two of the study sites. (A) Boggs Creek (linear R2 = 0.124, quadratic R2 = 0.726); and (B) Tionesta 1994 (linear R2 = 0.106, quadratic R2 = 0.298). In both panels, quadratic regression line is shown. In all calculations of damage heterogeneity above, the measure of abundance used was the cumulative basal area in each damage category for that plot.


Table 1.
Study site names, pre-disturbance vegetation characteristics, number of trees sampled, and disturbance severity. Values are means ± standard deviation across plots.
Table 1.
Study site names, pre-disturbance vegetation characteristics, number of trees sampled, and disturbance severity. Values are means ± standard deviation across plots.
| Site | Pre-Dist Species Richness | Pre-Dist. H’ (Density) | Pre-Dist 1/λ (Density) | Pre-Dist. Evenness (Density) | Severity (prop. Basal Area Lost) | Num. Trees | Pre-Dist. Diam. (cm) |
|---|---|---|---|---|---|---|---|
| Mingo *a,5 | 7.67 ± 2.34 | 1.56 ± 0.28 | 3.72 ± 1.12 | 0.78 ± 0.09 | 0.58 ± 0.23 | 192 | 17.08 ± 3.48 |
| Mingo *b,5 | 8.67 ± 1.15 | 1.80 ± 0.14 | 4.84 ± 0.88 | 0.83 ± 0.03 | 0.75 ± 0.23 | 92 | 28.58 ± 3.59 |
| Tionesta 1994 a,5 | 3.48 ± 1.46 | 1.04 ± 0.31 | 2.55 ± 0.75 | 0.82 ± 0.12 | 0.30 ± 0.28 | 643 | 27.00 ± 8.09 |
| Gould Farm a,5 | 7.50 ± 1.84 | 1.54 ± 0.30 | 3.80 ± 1.47 | 0.77 ± 0.11 | 0.85 ± 0.19 | 360 | 22.02 ± 3.21 |
| Texas Hill a,5 | 5.60 ± 1.84 | 1.23 ± 0.37 | 2.78 ± 1.07 | 0.72 ± 0.12 | 0.97 ± 0.04 | 255 | 21.84 ± 2.23 |
| Rapid River a,5 | 6.09 ± 1.97 | 1.27 ± 0.30 | 2.91 ± 0.74 | 0.72 ± 0.10 | 0.28 ± 0.21 | 573 | 15.99 ± 0.86 |
| Taylor a,5 | 4.96 ± 2.23 | 1.36 ± 0.37 | 3.46 ± 1.20 | 0.86 ± 0.09 | 0.80 ± 0.25 | 1224 | 23.73 ± 5.41 |
| Hattons a,5 | 3.88 ± 0.64 | 0.90 ± 0.21 | 2.04 ± 0.58 | 0.67 ± 0.12 | 0.73 ± 0.27 | 158 | 22.57 ± 4.61 |
| Fishhook a,5 | 3.31 ± 0.79 | 0.79 ± 0.22 | 1.93 ± 0.39 | 0.67 ± 0.16 | 0.47 ± 0.16 | 611 | 15.35 ± 1.92 |
| Med. Lake a,5 | 4.44 ± 0.73 | 0.85 ± 0.21 | 1.85 ± 0.40 | 0.58 ± 0.13 | 0.63 ± 0.14 | 554 | 11.01 ± 2.83 |
| Shirttail a,5 | 5.17 ± 1.04 | 1.32 ± 0.26 | 3.28 ± 0.82 | 0.81 ± 0.11 | 0.86 ± 0.16 | 548 | 16.26 ± 2.61 |
| Twin a,5 | 5.35 ± 1.27 | 1.17 ± 0.22 | 2.64 ± 0.73 | 0.72 ± 0.12 | 0.83 ± 0.14 | 878 | 15.19 ± 3.94 |
| ThreeMile a,10 | 3.86 ± 1.39 | 1.00 ± 0.35 | 2.48 ± 0.84 | 0.77 ± 0.14 | 0.29 ± 0.24 | 404 | 22.40 ± 3.89 |
| Natchez Trace b,5 | 12.07 ± 2.38 | 2.02 ± 0.27 | 5.87 ± 1.75 | 0.82 ± 0.06 | 0.38 ± 0.20 | 1637 | 19.07 ± 2.56 |
| Gum Road a,5 | 7.89 ± 2.21 | 1.86 ± 0.32 | 5.92 ± 1.87 | 0.91 ± 0.04 | 0.33 ± 0.26 | 674 | 23.24 ± 3.23 |
| Boggs Creek a,10 | 8.24 ± 2.07 | 1.79 ± 0.32 | 5.12 ± 1.77 | 0.86 ± 0.08 | 0.66 ± 0.29 | 894 | 25.71 ± 5.29 |
| Smokies a,10 | 7.14 ± 1.96 | 1.66 ± 0.31 | 4.66 ± 1.74 | 0.86 ± 0.09 | 0.58 ± 0.24 | 487 | 25.60 ± 3.03 |
| Martin Branch a,10 | 7.28 ± 1.32 | 1.73 ± 0.17 | 4.87 ± 0.96 | 0.88 ± 0.06 | 0.74 ± 0.24 | 383 | 26.72 ± 5.49 |
| Timpson a,10 | 7.71 ± 1.07 | 1.77 ± 0.18 | 4.91 ± 1.20 | 0.87 ± 0.06 | 0.72 ± 0.16 | 274 | 27.47 ± 3.17 |
* Mingo site sampled with 6 20 × 20 m plots, and 3 30 × 30 m plots. a,b = Plot size; a = 20 m × 20 m; b = 30 m × 30 m; 5,10 = minimum tree diameter (in cm) sampled; 5 = 5 cm; 10 = 10 cm.
© 2019 by the author. Licensee MDPI, Basel, Switzerland. This article is an open access article distributed under the terms and conditions of the Creative Commons Attribution (CC BY) license (http://creativecommons.org/licenses/by/4.0/).
Share and Cite
MDPI and ACS Style
Peterson, C.J. Damage Diversity as a Metric of Structural Complexity after Forest Wind Disturbance. Forests 2019, 10, 85. https://doi.org/10.3390/f10020085
AMA Style
Peterson CJ. Damage Diversity as a Metric of Structural Complexity after Forest Wind Disturbance. Forests. 2019; 10(2):85. https://doi.org/10.3390/f10020085
Chicago/Turabian StylePeterson, Chris J. 2019. "Damage Diversity as a Metric of Structural Complexity after Forest Wind Disturbance" Forests 10, no. 2: 85. https://doi.org/10.3390/f10020085
Note that from the first issue of 2016, this journal uses article numbers instead of page numbers. See further details here.