Article

Optimization of Skid Trails and Log Yards on the Amazon Forest

by
Agust Sales
1,
Duberlí Geomar Elera Gonzáles
1,
Thales Guilherme Vaz Martins
1,
Gabriela Cristina Costa Silva
1,*,
Aline Gonçalves Spletozer
1,
Lucas Arthur de Almeida Telles
1,
Marco Antonio Siviero
2 and
Alexandre Simões Lorenzon
1
1
Departamento de Engenharia Florestal, Universidade Federal de Viçosa, Viçosa 36570-900, Minas Gerais, Brazil
2
Universidade Federal do Paraná, Curitiba 80060-000, Paraná, Brazil
*
Author to whom correspondence should be addressed.
Forests 2019, 10(3), 252; https://doi.org/10.3390/f10030252
Submission received: 30 January 2019 / Revised: 21 February 2019 / Accepted: 25 February 2019 / Published: 12 March 2019
(This article belongs to the Special Issue Forest Operations: Planning, Innovation and Sustainability)

Abstract

:
Research highlights: We used Dijkstra Algorithm (DA) to define optimal allocation of yards in order to minimize total skid-trail’s distance in the Amazon Forest. DA minimized trails’ distances and associated transportation costs, leading to an even smaller value when the current planning was disregarded and suggesting the reduction of deleterious environmental externalities. Background and objectives: We sought to answer if it is possible to optimize distances and intrinsic costs in the management of Amazonian forests using DA. The objective was to minimize skid trails distances by best allocating yards using DA and to compare four scenarios of forest harvest planning in the Brazilian Amazon. Materials and methods: Tree census data from Gênesis-Salém Farm, state of Pará, Brazil, were used. The yards and roads located by Grupo Arboris (scenario 1) were compared to three alternative scenarios in terms of total skid distance, trails and road densities, and skidding costs for three successive harvests, seeking to minimize total skid-trails’ distance. Alternative scenarios were to keep the number of yards within work units (WU) and place them in the edge of existing roads (scenario 2); keep the number of yards within each WU (scenario 3); and place 23 yards, disregarding the current planning (scenario 4). Results: Total skid-trail’s distance, number of trees above optimal extraction distance and densities of skid trails and roads were smaller in scenarios 2, 3, and 4, compared to the current yard allocation (scenario 1). Scenario 4, with fewer restrictions, reduced skid-trails’ distances by 23%. Harvest costs decreased from scenario 1 to 4 in all three harvest cycles. Conclusions: DA allowed optimized distribution of yards and skid trails and generated efficient results for harvest planning. This reinforces the importance of optimized planning, which establishes satisfactory results in the effort to reduce costs and environmental impact keeping high efficiency.

Graphical Abstract

1. Introduction

Tropical forests destined to wood production correspond to more than 400 million hectares in the world [1,2]. Harvesting these forests is vital for many countries as they generate significant local and export revenues [3]. In Brazilian Amazon, wood extraction in managed forests is carried out in reduced impact harvesting system (RIL), aiming continuous wood production and biodiversity conservation [4,5]. RIL is supported by Law 7803 (1989), which establishes the criteria for wood harvesting in the Amazon [6]. In RIL, harvest is done by technicians, following a planning that reduces ecosystem damages caused by tree harvesting, skidding, and storage [7].
RIL techniques are essential for tropical forest management; however, their planning and execution need to be improved at various planning scales [8,9]. Currently, some harvest-planning activities, such as allocation of roads, yards, and skidding trails receives little interest in forestry planning, even in certified timber companies. In many cases, harvest planning is done empirically, considering the manager’s experience and available field information to support decision making [10].
Empirical planning is a slow and costly process, and generally leads to poor performance by examining just few alternatives [11]. This lower performance results in higher harvesting costs and greater environmental impacts [12]. Once transportation and storage infrastructure accounts for up to 50% of total harvesting costs [13], finding the most suitable alternatives becomes a major concern.
Decisions about spatial arrangement and optimum density of roads, yards, and skid trails are complex problems due to great species diversity, trees size, forests types, among other factors [13]. Identification of optimal wood transport and storage network is a key element, and modern optimization techniques can handle this task in a more rational way [10]. In economic terms, the forestry sector should employ techniques that make harvesting processes more efficient [9].
Several researches were carried out in an attempt to optimize wood transport and storage networks [14,15,16,17,18,19]. Geographic information system (GIS) technology has also been successfully incorporated into forest sector [20]. The Network Analyst extension of ArcGIS® software includes the Dijkstra algorithm (DA) [21], one of the most efficient algorithms for searching graphs. It can solve different types of problems, including minimizing or maximizing a mapped pathway [22], but there are very few studies applying it on skid-trail’s design [12]. We expect DA to be efficient in optimizing yard allocation, to reduce skid-trails’ distances and costs.
In this study, we used DA algorithm to solve a network design problem, which involves determining the optimal allocation of yards and skid trails to access selected trees for harvesting. Four planning scenarios and three harvest cycles in a forest managed under the RIL system, located on the Brazilian Amazon, were considered.

2. Materials and Methods

2.1. Study Area Description

Gênesis-Salém Farm, managed by Grupo Arboris, is located in Dom Eliseu municipality, state of Pará, Amazon, Brazil (47°49′6.967′′ W and 04°32′29.352′′ S). Forest management is carried out in Legal Reserve area (481.57 ha), which has no humid areas or streams and is subdivided into seven work units (WU) (Figure 1). The area was explored from 1988 to 1994 and in 2002.

2.2. Census Inventory

The forest census included trees with dbh (diameter at breast height, 1.30 m) ≥ 25 cm, and it was carried out in the second half of 2016, in all WUs (Table 1). Trees’ dbh and commercial heights were measured. Coordinates, scientific name, family, and qualitative characteristics were also obtained. The census quantified 37,959 trees from 50 families and 167 species. Trees were classified as “for harvest” (first harvest) or “remaining” (second and third harvests) according to stem health and quality information. It resulted in a total of 11,748 trees from 147 species ready for harvest, with an average tree height of 9.53 m, average dbh of 42.16 cm, total volume of 13970.91 m3, and cutting intensity of 29 m3 ha−1. The five species with the highest occurrence were Jacaratia spinosa (Aubl.) A.DC., Schizolobium parahyba var. amazonicum (Huber ex Ducke) Barneby, Protium tenuifolium (Engl.) Engl., Tetragastris altíssima Aubl. Swart., and Schizolobium parahyba (Vell.) Blake.

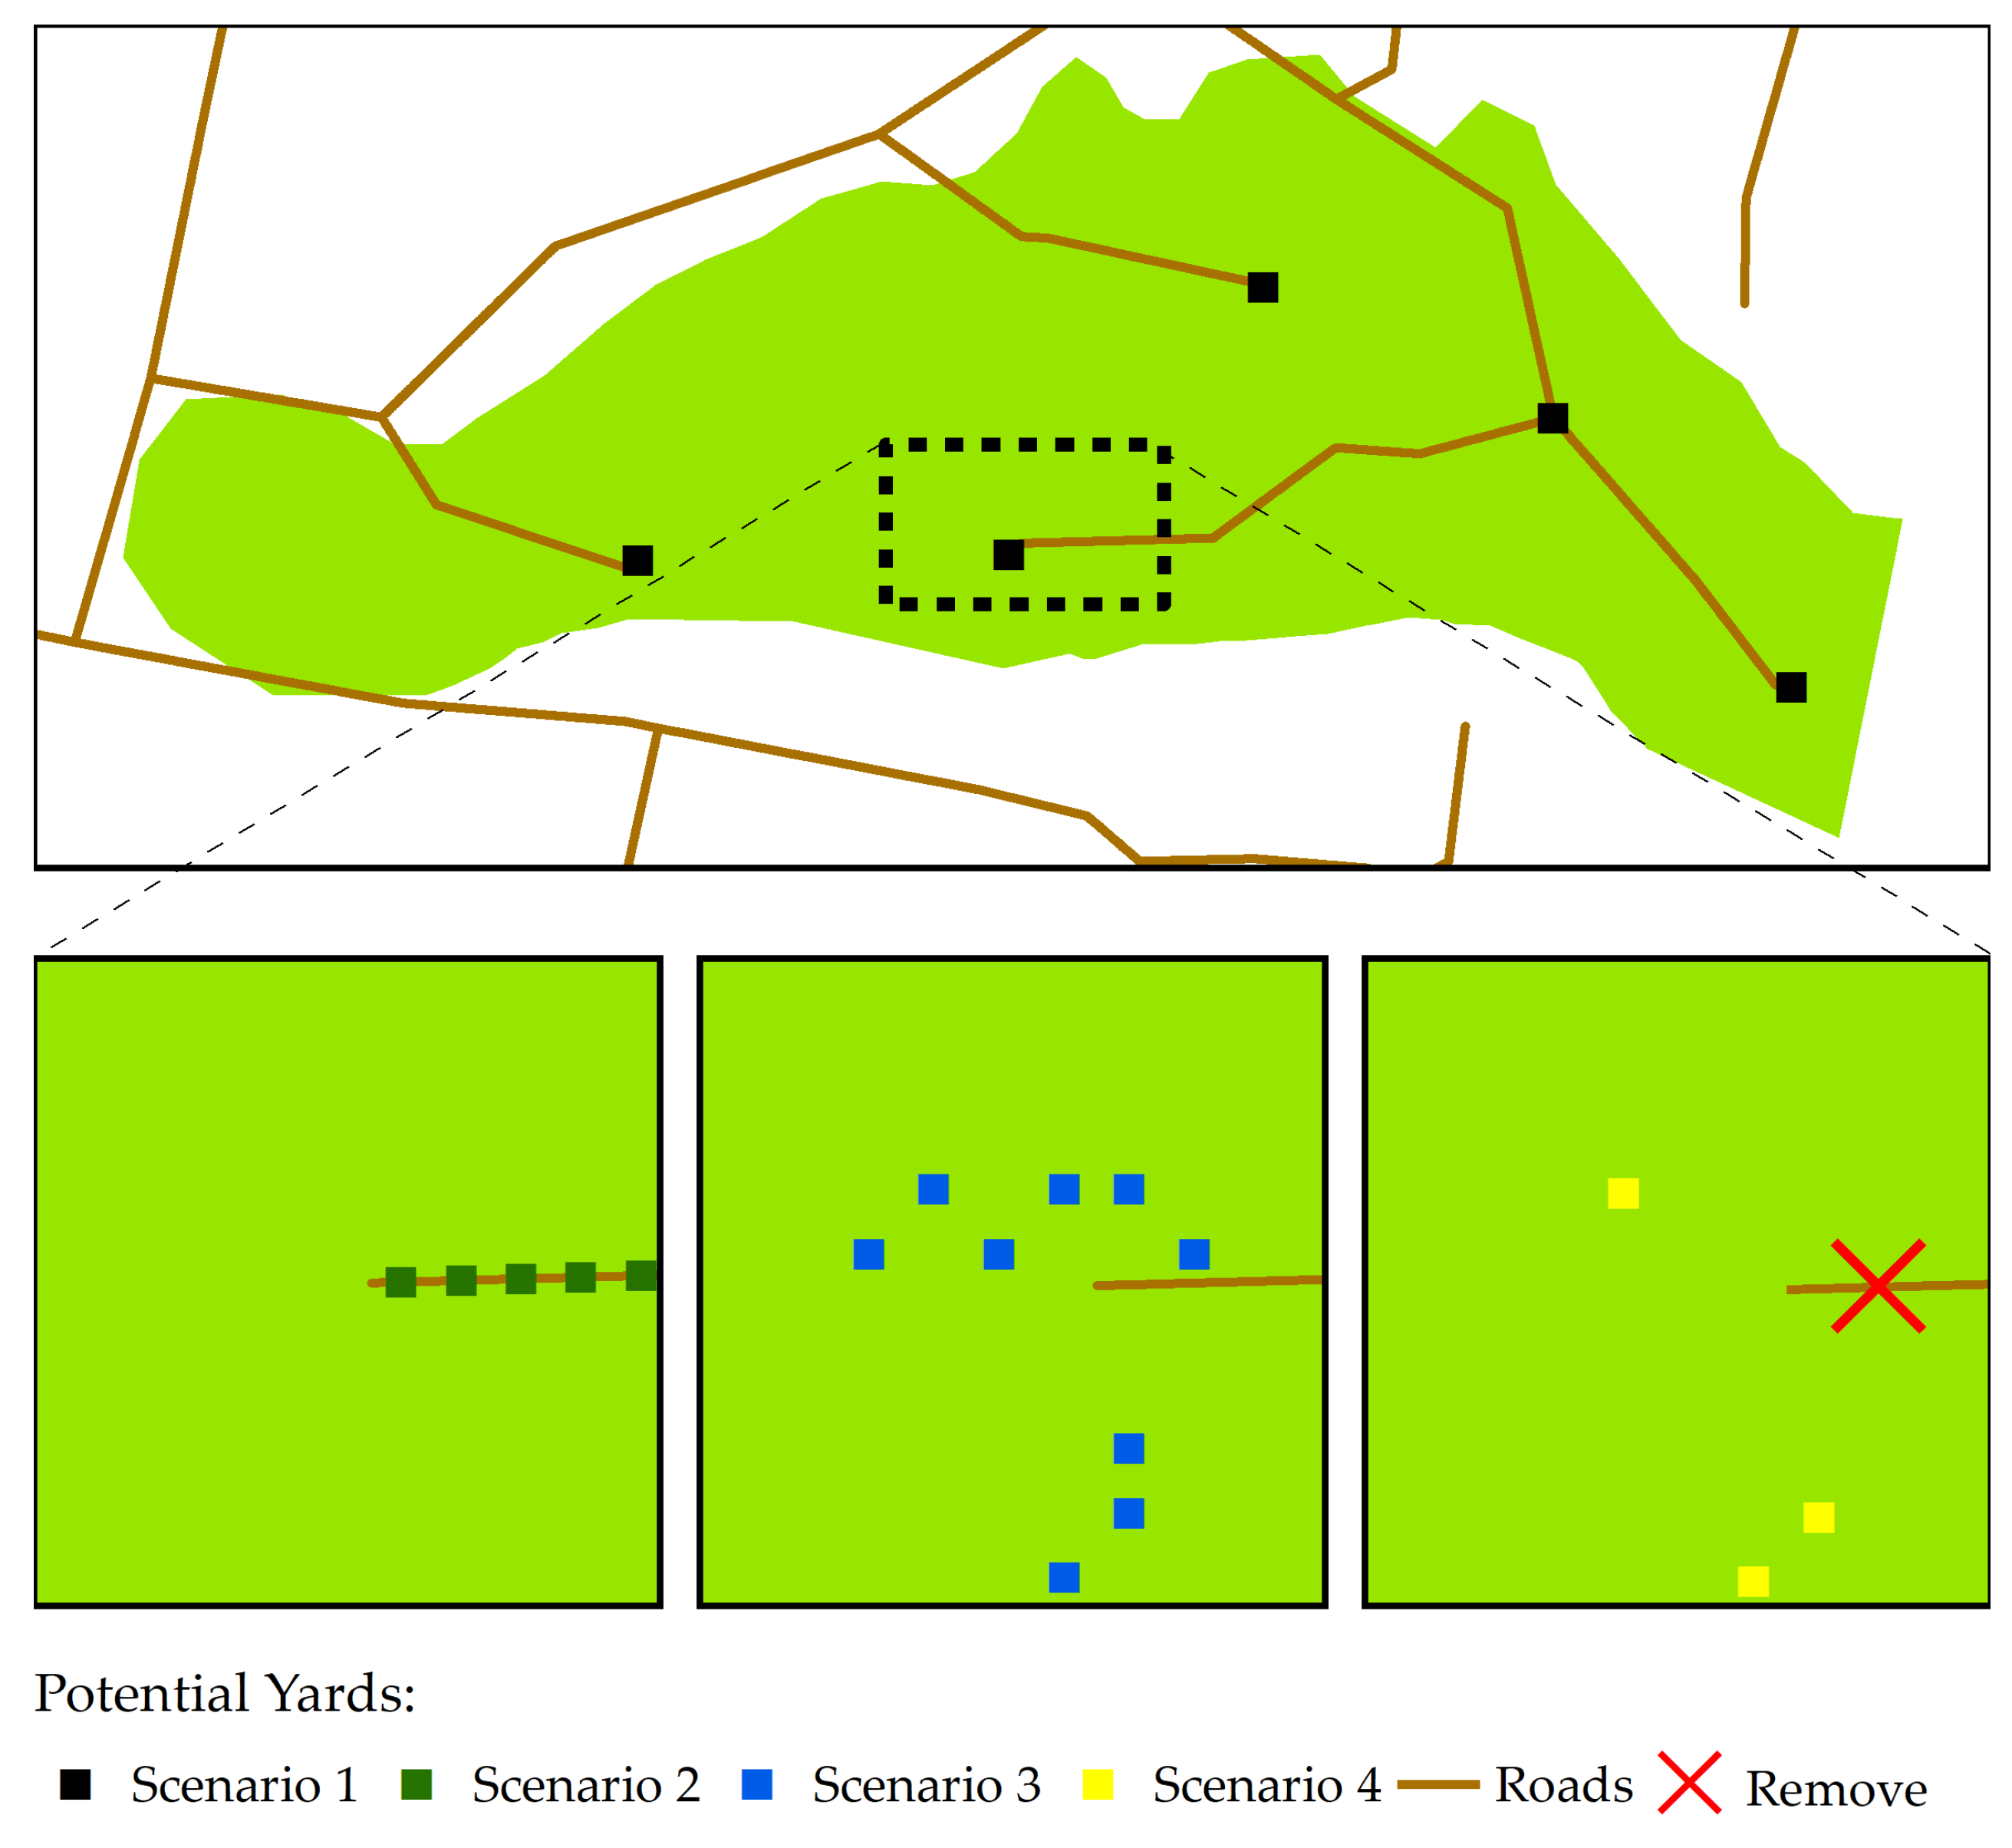
2.3. Planning Scenarios

Planning (Figure 2) was based on “for harvest” trees in order to minimize total skid-trail’s distance. Proposed scenarios were within each WU, allocate trees to existing yards (scenario 1); within each WU, locate the same amount of existing yards next to existing roads and then allocate trees (scenario 2); within each WU, relocate the same amount of existing yards and then allocate trees (scenario 3); and locate 23 yards in the farm, disregarding the current planning (roads and WU) and then allocate trees (scenario 4). This last scenario represents a planning problem closer to tactical scale.
Yard location and tree-yard allocation of each scenario were carried out with Network Analyst tool available in ArcGIS® software. This tool is based on Dijkstra algorithm (DA), which traces the shortest route between two points. The network was configured by connected arcs among facilities and incident points (trees) considering general and specific restrictions of each scenario (constraints).
Tree-yard allocation in first three scenarios considered WUs’ limits as constraints. The solution of scenario 4 was generated disregarding the existing planning, locating the same amount of existing yards, 23, in the farm so that total skid-trails’ distances were minimized. Each feature contained the tree-yard distances (Table 2).

2.4. Database Preparation

Farm and WUs limits, contours, roads, current yards, and tree points represented the initial database processed in ArcGIS® software. Sloping areas and close to remaining trees were constrained to yards’ allocation due to difficult construction and in order to avoid damaging remaining stock, respectively. Two digital elevation models (DEM) were generated with spatial resolution of 10 m and 20 m. The slope restriction, such as unrestricted site (slope ≤ 15%) and restricted (slope > 15%), were generated with the 20 m DEM (Figure 3).
A 10 m buffer was generated in the remaining trees. This buffer plus slope restriction resulted in the final constraint for yard allocation (Figure 4). Each 20 m DEM cell generated a possible yard. Unrestricted areas to allocate feasible yards of scenarios 3 and 4 were identified by the intersection between no restricted cells and no restricted slope surfaces (Figure 5). Feasible yards of scenario 2 were generated from roads’ spatial features, considering 20 m distance between them. Connection between existing roads and allocated yards in scenario 3 was generated with points spaced every 1 m.
In order to protect stock, an empirical buffer of 1.5 times dbh value of each remaining tree was created, in addition to the 10 m buffer, as a restriction for tree-yard routes in all scenarios. Arcs connected with actual distances, considering the slope terrain information and eight possible walking routes from the center of each cell, were created with the 10 m DEM in model builder, a visual programing environment available on ArcGIS® software. The processing is shown in Figure 6.

2.5. Second and Third Harvest Cycles

With yard allocation structure defined in each planning scenario for the first harvest cycle, second and third harvests were simulated with remaining trees by randomly assigning half of them to each next harvesting cycles.

2.6. Comparison among Scenarios

Scenarios were compared by descriptive statistics, considering
  • total skid-trail’s distance, in kilometers;
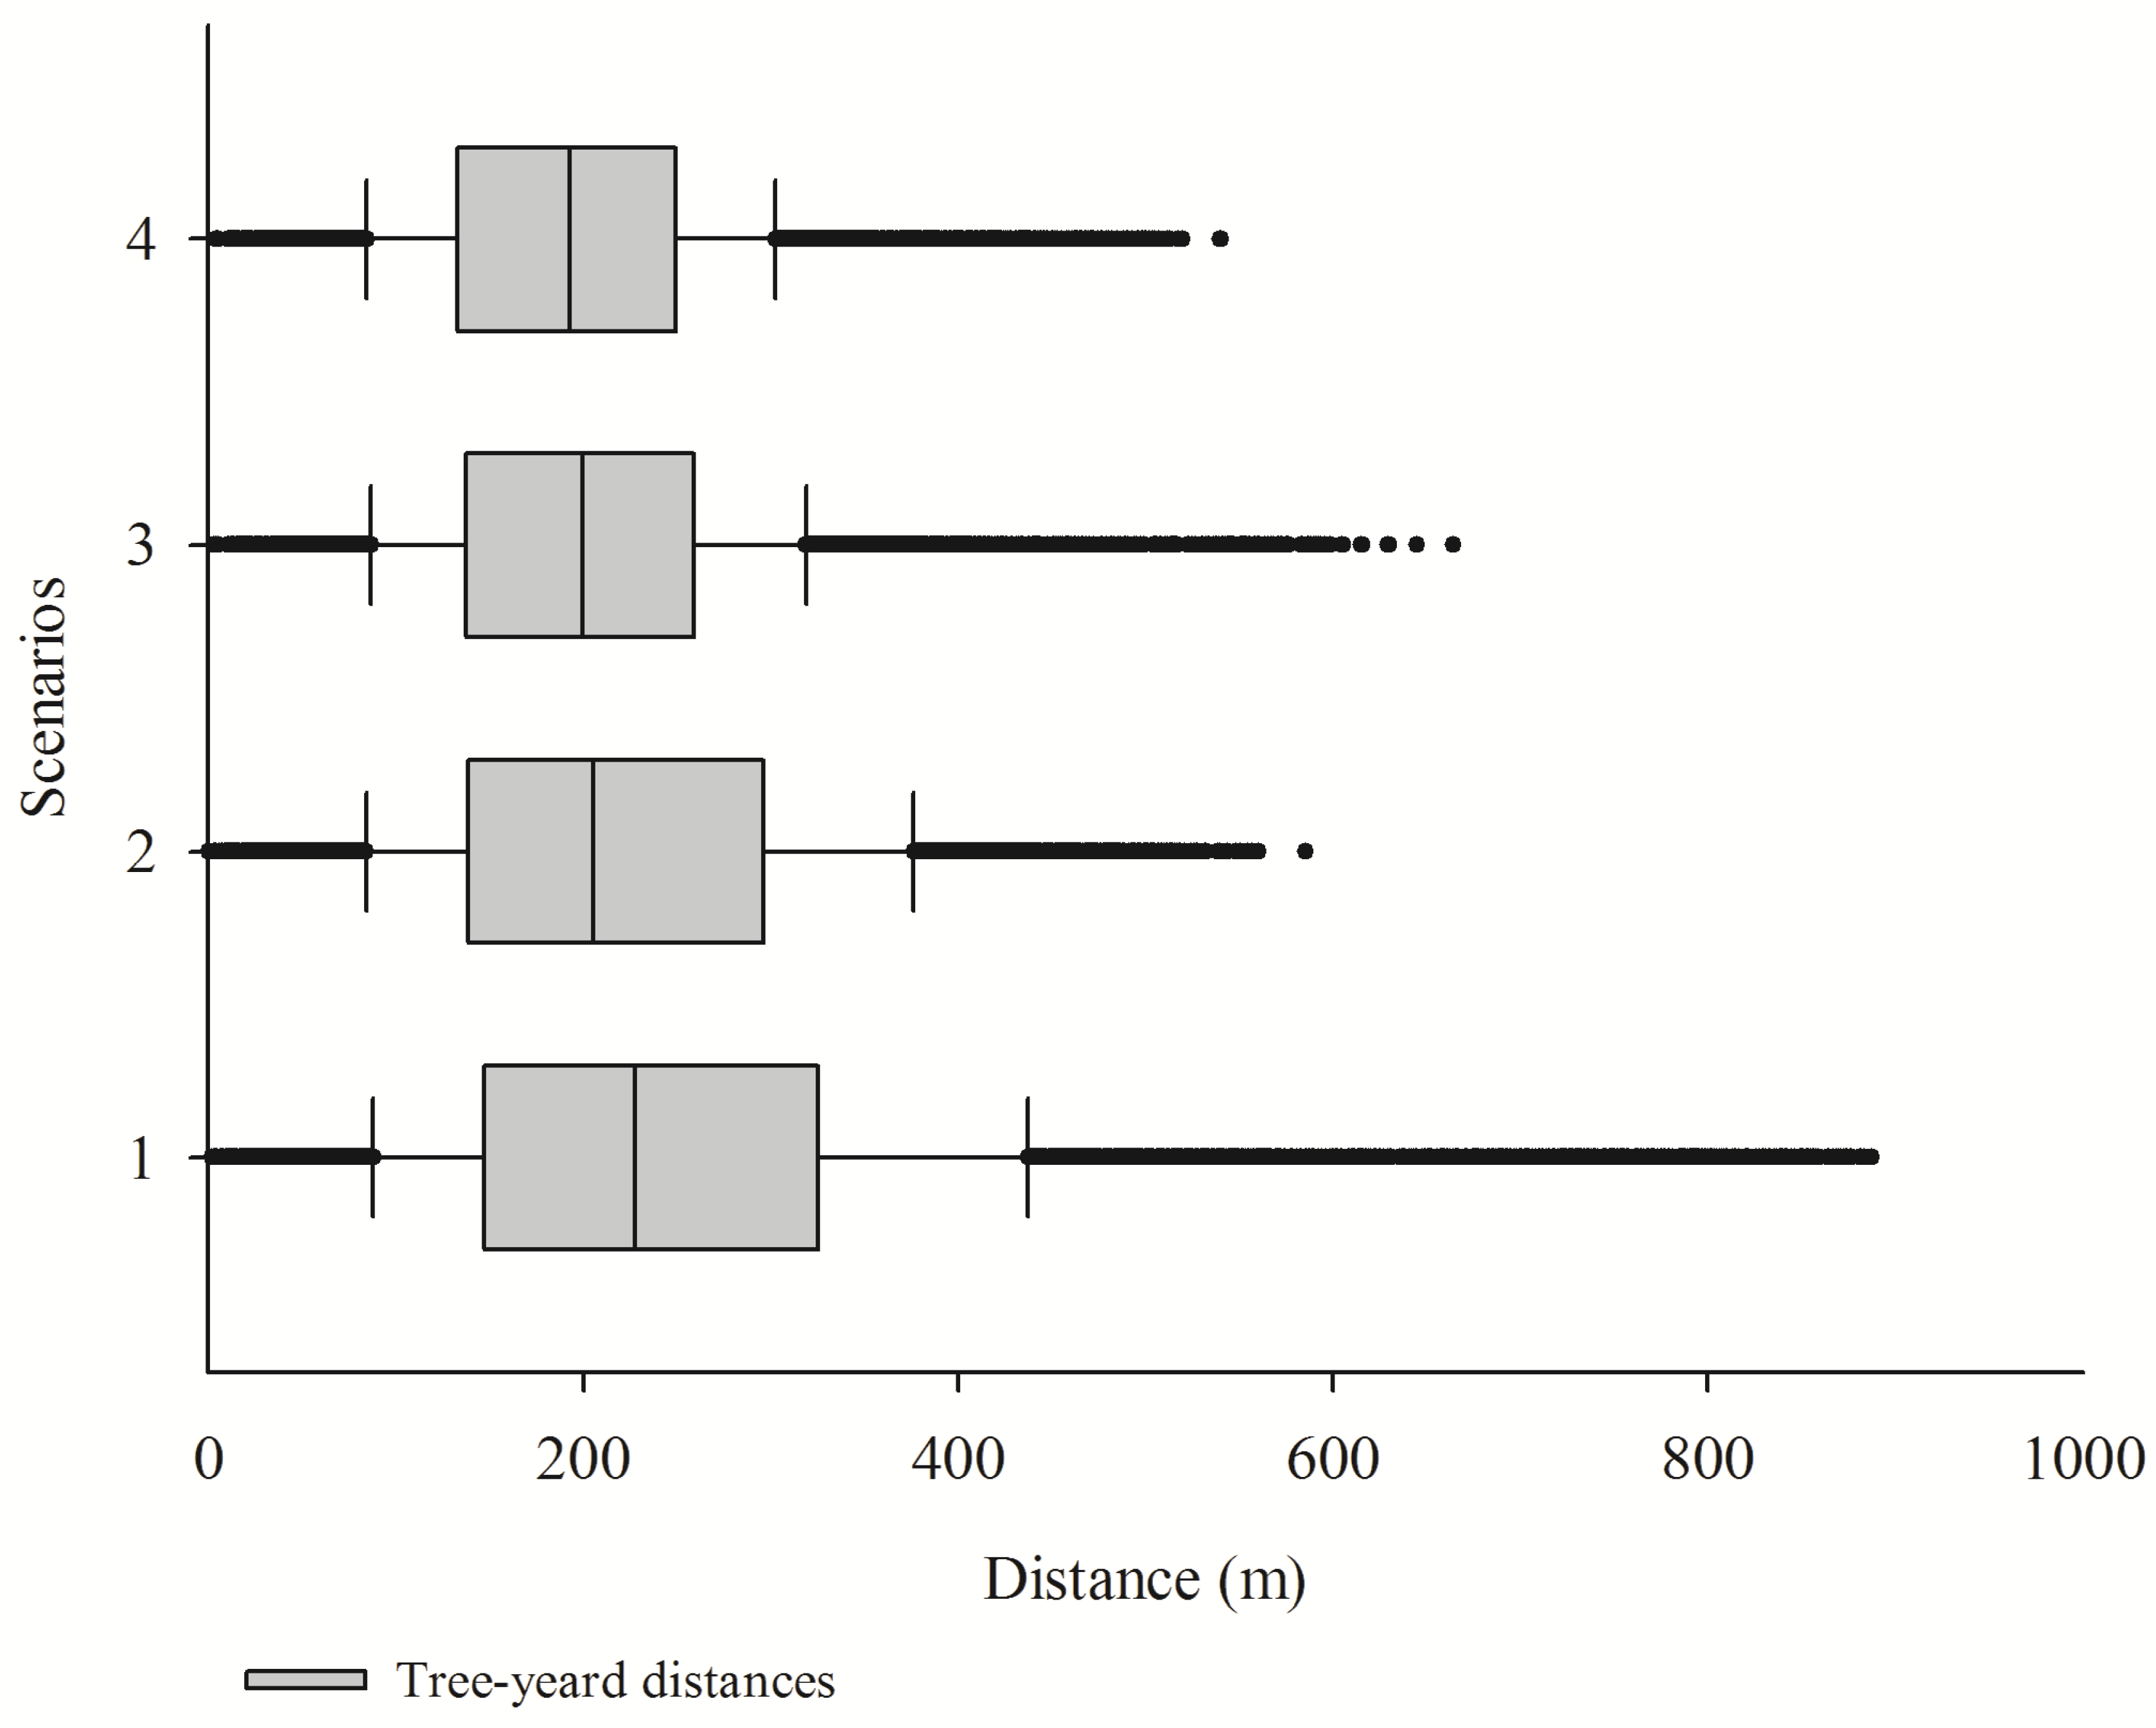
  • number of trees, in percentage, with their distances greater than 342 m from the yard, which is considered as the optimal extraction distance [18];
  • skid-trails’ and roads’ densities calculated using the formula.
D = dist/area,
where D is the skid-trails’ or roads’ densities; dist is the skid-trails’ or roads’ total distances (km), area is the total farm area (48,157 ha) [17]; and costs of yards’ opening and skidding, in Dollars (4). To calculate the total cost, number of yards was multiplied by the cost of opening a yard ($ 37.73 per yard)). The skidding cost was obtained by total skid-trail’s distance (m) multiplied by the skid cost (US $ 0.07 per linear meter, unpublished data), considering the Euclidean distance among trees and their respective yards [23].

3. Results

Yards’ and trails’ optimum distribution for the four scenarios in the first harvest can be visualized in Figure 7.
Comparing to scenario 1, total skid-trail’s distance reduced 13%, 19%, and 23%, on scenarios 2, 3, and 4, respectively. Similar reductions were observed when applying these scenarios in second and third harvests (Table 3).
The number of trees above optimum extraction distance (342 m) decreased from 21.8% to 4.8% on scenarios 1 to 4, respectively (Table 3). The smallest Euclidean distance of tree extraction in scenarios 2, 3, and 4 are better visualized in Figure 8. In general, the largest extraction distance decreased from 887 m (scenario 1) to 540 m (scenario 4).
Skid-trail’s density was 6.09 km ha−1 for scenario 1, reducing to 13%, 19%, and 23% when applying scenarios 2, 3, and 4, respectively. Roads’ density also reduced from scenario 1 to 4; however, roads’ reduction in scenario 3 (13%) was lower than in scenario 2 (19%) (Table 3).
The economic impact of each scenario in the final harvest planning is shown in Table 4. Even with the opening of new yards in scenarios 2, 3, and 4, there was a reduction in harvest costs about 12%, 19%, and 22%, respectively, when comparing to scenario 1. This significant reduction was obtained by the decrease of total skidding distance about 700 km from scenarios 1 to 4.

4. Discussion

Native wood exploration can improve the development of rural areas and generate important local and exportation revenues in many countries of South America. Wood extraction and stocking architecture is one of the main steps of the exploration process due to the elevated costs involved [13]. Equally important, deleterious environmental externalities can also be generated during harvest as canopy loss, soil disturbances, changes in vegetation composition and structure, hydrological process impacts, among others [12,24,25]. Good management practices have evolved in tropics, mainly on certified areas; however, their planning and execution still need to be improved [12,13] in order to achieve equilibrium between economic and environmental objectives. Dijkstra (DA) algorithm can improve harvest efficiency and reduce deleterious environmental impacts through optimal yard-location allocation. Thus, we have tested its efficiency in an RIL managed forest on Brazilian Amazon, considering four planning scenarios and three harvest cycles.
The gradual distance reduction from scenario 1 to 4, in the three harvests, occurred due to a change in the number of constraints among scenarios, impacting mainly the most restrictive scenario, i.e., scenario 1 [15]. Distance reductions, in scenarios 2, 3, and 4, can be considered significant in determining skid trails to yards [18].
The extraction of trees with distances greater than 342 m from yards can be expensive and aggressive to environment, making the project unfeasible in some cases [17,26]. As scenario 4 disregarded all existing planning, horizontal alignment options increased and, consequently, the capacity to improve the network efficiency [27,28]. This permitted the optimal positioning of yards and, consequently, a greater number of trees within optimal distance limit (342 m), as well a more homogeneous arrangement of distances to yards.
Scenario 1 required higher trail and road densities for harvest, which means a greater infrastructure area with greater potential of environmental damage [12]. Scenario 4, in turn, required a more compact infrastructure, indicating that the optimization model, at tactical planning scale, promotes reduction of ecosystem damages caused by harvest operations. Scenario 3 required less total infrastructure than scenario 2; however, its higher road density may have a greater forest impact due to higher soil removal [18].
The costs reduction from scenario 1 to 4, in the three harvest cycles, supports that optimized planning can significantly change the profitability of the company’s harvesting system. Since harvest cost is also dependent on skid-trails’ distances [27], when using the least restrictive DA algorithm, it can be expected that if there is an improvement in solutions, these will be expressed at lower harvest costs [29]. Therefore, if harvest-planning decision-making were based only on Euclidean distance from trees to yards, the analyzed scenarios would reduce not only environmental damage but also operational costs in Amazon areas in RIL. In addition, scenario 4 results confirm the economic benefits of using DA algorithm at operational and tactical scale [28].
Finally, results of the application of DA algorithm in harvest planning were positive, either in economic or environmental perspective. However, some concerns need to be addressed—reduced information regarding harvest costs of companies imposes methodological restrictions; and what makes it difficult to access economic efficiency of DA algorithm and suggest future researches. It should be considered that we addressed a real problem in this study and part of the infrastructure was pre-established. Thus, the optimum solution obtained by scenario 4 may not be possible. However, the reduction of skid-trails’ distances in scenario 2 allied with its absence of new roads requirement (in comparison with scenario 3) shows that this is the actual best scenario for the company.

5. Conclusions

DA algorithm has generated more efficient results for the analyzed scenarios compared to the current planning, reducing skid-trails’ distances, trails’ and roads’ densities, and increasing the number of trees within ideal extraction distance. This has led to reductions in costs and, possibly, environmental impacts of the harvest. Scenario 2 best serves the timber harvest management in the area. DA algorithm use is an alternative for planning management in Amazon forest.

Supplementary Materials

The following are available online at https://www.mdpi.com/1999-4907/10/3/252/s1, Figure S1: Skid trails with the shortest distances defined by the algorithm and following the network configuration with common tracks for more than one tree.

Author Contributions

Conceptualization ideas, A.S., D.G.E.G., and T.G.V.M.; data curation, M.A.S., G.C.C.S., A.G.S., and D.G.E.G.; formal analysis, A.S., D.G.E.G., T.G.V.M., G.C.C.S., and A.G.S.; methodology, D.G.E.G.; Investigation, A.S., D.G.E.G., T.G.V.M., G.C.C.S., and A.G.S.; writingoriginal draft, T.G.V.M, G.C.C.S., and A.G.S.; writing—review and editing, T.G.V.M., G.C.C.S., A.G.S., L.A.d.A.T., A.S., D.G.E.G., L.A.d.A.T., and A.S.L.

Funding

This research received no external funding.

Acknowledgments

To the Geographic Information Systems Laboratory of Universidade Federal de Viçosa and Grupo Arboris.

Conflicts of Interest

The authors declare no conflict of interest.

References

  1. Blaser, J.; Sarre, A.; Poore, D.; Johnson, S. Status of Tropical Forest Management; ITTO Technical Series N. 38; International Tropical Timber Organization: Yokohama, Japan, 2011. [Google Scholar]
  2. Groenendijk, P.; Bongers, F.; Zuidema, P.A. Using tree-ring data to improve timber-yield projections for African wet tropical forest tree species. For. Ecol. Manag. 2017, 400, 396–407. [Google Scholar] [CrossRef]
  3. Köhl, M.; Lasco, R.; Cifuentes, M.; Jonsson, Ö.; Korhonen, K.T.; Mundhenk, P.; Navar, J.J.; Stinson, G. Changes in forest production, biomass and carbon: Results from the 2015 UN FAO Global Forest Resource Assessment. For. Ecol. Manag. 2015, 35, 21–34. [Google Scholar]
  4. Putz, F.E.; Sist, P.; Fredericksen, T.; Dykstra, D. Reduced-impact logging: Challenges and opportunities. For. Ecol. Manag. 2008, 256, 1427–1433. [Google Scholar] [CrossRef]
  5. Dionisio, L.F.S.; Schwartz, G.; Mazzei, L.; do Carmo Lopes, J.; dos Santos, G.G.A.; de Assis Oliveira, F. Mortality of stocking commercial trees after reduced impact logging in eastern Amazonia. For. Ecol. Manag. 2017, 401, 1–7. [Google Scholar] [CrossRef]
  6. Calvão, L.B.; Nogueira, D.S.; de Assis Montag, L.F.; Lopes, M.A.; Juen, L. Are Odonata communities impacted by conventional or reduced impact logging? For. Ecol. Manag. 2016, 382, 143–150. [Google Scholar] [CrossRef]
  7. Chaudhary, A.; Burivalova, Z.; Koh, L.P.; Hellweg, S. Impact of forest management on species richness: Global meta-analysis and economic trade-offs. Sci. Rep. 2016, 6, 23954. [Google Scholar] [CrossRef]
  8. Pokorny, B.; Sabogal, C.; Silva, J.N.M.; Bernardo, P.; Souza, J.; Zweede, J. Compliance with reduced-impact harvesting guidelines by timber enterprises in terra firme forests of the Brazilian Amazon. Int. For. Rev. 2005, 7, 9–20. [Google Scholar] [CrossRef]
  9. Talbot, B.; Pierzchała, M.; Astrup, R. Applications of remote and proximal sensing for improved precision in forest operations. Croatian Journal of Forest Engeneering. 2017, 38, 327–336. [Google Scholar]
  10. Søvde, N.E.; Løkketangen, A.; Talbot, B. Applicability of the GRASP metaheuristic method in designing machine trail layout. For. Sci. Technol. 2013, 9, 187–194. [Google Scholar] [CrossRef]
  11. Babapour, R.; Naghdi, R.; Ghajar, I.; Mortazavi, Z. Forest road profile optimization using meta-heuristic techniques. Appl. Soft Comput. 2018, 64, 126–137. [Google Scholar] [CrossRef]
  12. Gumus, S.; Turk, Y. A new skid trail pattern design for farm tractors using linear programing and Geographical information systems. Forests 2016, 7, 306. [Google Scholar] [CrossRef]
  13. Ezzati, S.; Najafi, A.; Yaghini, M.; Hashemi, A.A.; Bettinger, P. An optimization model to solve skidding problem in steep slope terrain. J. For. Econ. 2015, 21, 250–268. [Google Scholar] [CrossRef]
  14. Dean, D.J. Finding optimal routes for networks of harvest site access roads using GIS-based techniques. Can. J. For. Res. 1997, 27, 11–22. [Google Scholar] [CrossRef]
  15. Anderson, A.E.; Nelson, J. Projecting vector-based road networks with a shortest path algorithm. Can. J. For. Res. 2004, 34, 1444–1457. [Google Scholar] [CrossRef]
  16. Contreras, M.; Chung, W. A computer approach to finding an optimal log landing location and analyzing influencing factors for ground-based timber harvesting. Can. J. For. Res. 2007, 37, 276–292. [Google Scholar] [CrossRef]
  17. Hosseini, S.A.; Mazrae, M.R.; Lotfalian, M.; Parsakhoo, A. Designing an optimal forest road network by consideration of environmental impacts in GIS. J. Environ. Eng. Landsc. 2012, 20, 58–66. [Google Scholar] [CrossRef]
  18. Ferreira da Silva, E.; da Silva, G.F.; Figueiredo, E.O.; Binoti, D.H.B.; Mendonça, A.R.; Torres, C.M.M.E.; Pezzopane, J.E.M. Allocation of storage yards in management plans in the Amazon by means of mathematical programming. Forests 2018, 9, 127. [Google Scholar] [CrossRef]
  19. Devlin, G.J.; McDonnell, K.; Ward, S. Timber haulage routing in Ireland: An analysis using GIS and GPS. J. Transp. Geogr. 2018, 16, 63–72. [Google Scholar] [CrossRef]
  20. Grigolato, S.; Mologni, O.; Cavalli, R. GIS Applications in forest operations and road network planning: An overview over the last two decades. Croatian Journal of Forest Engeneering. Theory Appl. For. Eng. 2017, 38, 175–186. [Google Scholar]
  21. Dijkstra, E.W. A note on two problems in connection with graphs. Numer. Math. 1959, 1, 269–271. [Google Scholar] [CrossRef]
  22. Ciesielski, K.C.; Falcão, A.X.; Miranda, P.A. Path-value functions for which Dijkstra’s algorithm returns optimal mapping. J. Math. Imaging. Vis. 2016, 60, 1025–1036. [Google Scholar] [CrossRef]
  23. Figueiredo, E.O.; Lima, Q.S. Coeficientes Técnicos Para Inventário e Manejo Florestal com Emprego do Modelo Digital de Exploração Florestal (Modeflora); Embrapa Acre: Rio Branco, Brazil, 2008. [Google Scholar]
  24. Silva, J.N.M.; de Carvalho, J.O.P.; Lopes, J. d. C.A.; de Almeida, B.F.; Costa, D.H.M.; de Oliveira, L.C.; Vanclay, J.K.; Skovsgaard, J.P. Growth and yield of a tropical rain forest in the Brazilian Amazon 13 years after logging. For. Ecol. Manag. 1995, 71, 267–274. [Google Scholar] [CrossRef]
  25. Boltz, F.; Holmes, T.P.; Carter, D.R. Economic and environmental impacts of conventional and reduced-impact logging in Tropical South America: A comparative review. For. Policy Econ. 2003, 5, 69–81. [Google Scholar] [CrossRef]
  26. Matthews, D.M. Cost Control in the Logging Industry; McGraw-Hill: New York, NY, USA, 1942. [Google Scholar]
  27. Chung, W.; Stückelberger, J.; Aruga, K.; Cundy, T.W. Forest road network design using a trade-off analysis between skidding and road construction costs. Can. J. For. Res. 2008, 38, 439–448. [Google Scholar] [CrossRef]
  28. Naderializadeh, N. The effect of the density of candidate roads upon solutions in tactical forest planning. Can. J. For. Res. 2018, 48, 679–688. [Google Scholar] [CrossRef]
  29. Philippart, J.; Sun, M.; Doucet, J.-L.; Lejeune, P. Mathematical formulation and exact solution for landing location problem in tropical forest selective logging, a case study in Southeast Cameroon. J. For. Econ. 2012, 18, 113–122. [Google Scholar] [CrossRef]
Figure 1. Location and description of Gênesis-Salém Farm, Pará (PA), Brazil.
Forests 10 00252 g001
Figure 2. Graphical representation of considered planning scenarios.
Forests 10 00252 g002
Figure 3. Digital elevation model, slope classification and slope restriction of areas suitable for yards’ allocation.
Forests 10 00252 g003
Figure 4. Vector of remaining trees, intersection between remaining trees constraint and slope constraint, and the resulting vector with restricted and non-restricted areas to yards’ allocation.
Forests 10 00252 g004
Figure 5. Location of feasible yards to store harvested log.
Forests 10 00252 g005
Figure 6. Simplified flowchart of the steps needed to prepare data used in the planning.
Forests 10 00252 g006
Figure 7. Results of tree-yard optimization scenarios. Lines represent the target yard for each tree (skidding routes follow network setting according to Figure S1), stacked logs represent yard locations and green points represent trees for harvesting.
Forests 10 00252 g007
Figure 8. Dispersion of tree-yards’ distances for each scenario.
Forests 10 00252 g008
Table 1. Work units (WU), with their respective areas, number of current yards, number of trees and volume destined to first and second/third (remaining) harvest(s) on Genesis Farm.
WUYardsArea (ha)HarvestRemaining
TreesVol. (m3)TreesVol. (m3)
01269.835416672564.7443353596.85
02354.369310751489.9528392360.38
03386.738322142238.7242503030.09
04357.261312451289.2136152958.01
05166.326811301397.9436452661.48
06681.360917081853.0438553025.16
07565.675927093137.3032482474.30
Total23481.56821174813970.92578720106.27
Table 2. Setting up the network optimization in the Network Analyst tool.
ScenarioFunctionFacilityIncidentConstraint
1Closest facility23 current yardsHTRT and WUs
2Location-allocationYards on roadsides
Closest facility23 yards allocated at roadsides
3Location-allocationFeasible yards
Closest facility23 allocated yards
4Location-allocationFeasible yardsHTRT
Closest facility23 allocated yards
HT, harvest tree; RT, 1.5 * dbh buffer of the remaining trees; WUs, limit of work units.
Table 3. Scenario evaluation based on skid-trails’ distances, and densities of trails and roads. Numbers between parentheses indicate the difference in percentage (%) from scenario 1.
ParametersHarvestScenario 1Scenario 2Scenario 3Scenario 4
Total skid-trail’s distance (km)1st29342555 (87)2364 (81)2264 (77)
2nd32772863 (87)2628 (80)2557 (78)
3rd32962884 (87)2668 (81)2572 (78)
Number of trees (%) with their distances greater than 342 m1st21.815.5 (71)6.8 (31)4.8 (22)
2nd25.016.2 (65)6.5 (26)3.3 (13)
3rd25.817.0 (66)6.9 (27)4.6 (18)
Average trail distances (m)1st232215 (93)201 (86)193 (83)
2nd232216 (93)205 (88)196 (84)
3rd232217 (94)207 (89)196 (85)
CV (%)1st46.845.4 (97)42.9 (92)41.3 (88)
2nd46.044.6 (97)43.2 (94)40.9 (89)
3rd46.744.6 (96)42.6 (91)40.8 (87)
Skid-trail’s density (km ha−1)1st6.095.30 (87)4.91 (81)4.70 (77)
2nd6.815.94 (87)5.46 (80)5.31 (78)
3rd6.845.99 (88)5.54 (81)5.34 (78)
Road density (km ha−1)1st0.040.03 (82)0.04 (90)0.02 (59)
Table 4. Total costs of yards opening and skidding for the four scenarios. Numbers within parentheses indicate the difference in percentage (%) from scenario 1.
HarvestTotal Costs (US$)Scenario 1Scenario 2Scenario 3Scenario 4
1stSkidding205,351178,828 (87)165,493 (81)158,500 (77)
Yards-868868868
Total205,351179,695 (88)166,361 (81)159,368 (78)
2ndSkidding229,418200,388 (87)183,930 (80)179,004 (78)
Yards----
Total229,418200,388 (87)183,930 (80)179,004 (78)
3rdSkidding230,738201,879 (87)186,743 (81)180,021 (78)
Yards----
Total230,738201,879 (87)186,743 (81)180,021 (78)

