Article

Response of Soil Surface Respiration to Storm and Ips typographus (L.) Disturbance in Boreal Norway Spruce Stands

Department of Forest Sciences, University of Helsinki, P.O. Box 27, FI-00014, 00100 Helsinki, Finland
*
Author to whom correspondence should be addressed.
Forests 2019, 10(4), 307; https://doi.org/10.3390/f10040307
Submission received: 28 February 2019 / Revised: 18 March 2019 / Accepted: 24 March 2019 / Published: 3 April 2019

Abstract

:
Disturbances such as storm events and bark beetle outbreaks can have a major influence on forest soil carbon (C) cycling. Both autotrophic and heterotrophic soil respiration may be affected by the increase in tree mortality. We studied the effect of a storm in 2010 followed by an outbreak of the European spruce bark beetle (Ips typographus L.) on the soil surface respiration (respiration by soil and ground vegetation) at two Norway spruce (Picea abies L.) dominated sites in southeastern Finland. Soil surface respiration, soil temperature, and soil moisture were measured in three types of plots—living trees (undisturbed), storm-felled trees, and standing dead trees killed by I. typographus—during the summer–autumn period for three years (2015–2017). Measurements at storm-felled tree plots were separated into dead tree detritus-covered (under storm-felled trees) and open-vegetated (on open areas) microsites. The soil surface total respiration for 2017 was separated into its autotrophic and heterotrophic components using trenching. The soil surface total respiration rates at the disturbed plots were 64%–82% of those at the living tree plots at one site and were due to a decrease in autotrophic respiration, but there was no clear difference in soil surface total respiration between the plots at the other site, due to shifts in either autotrophic or heterotrophic respiration. The soil surface respiration rates were related to plot basal area (living and all trees), as well as to soil temperature and soil moisture. As storm and bark beetle disturbances are predicted to become more common in the future, their effects on forest ecosystem C cycling and CO2 fluxes will therefore become increasingly important.

1. Introduction

Abiotic disturbances, such as storms, and biotic disturbances, such as bark beetle outbreaks, are important drivers of forest ecosystem functioning [1,2]. Such disturbances increase tree mortality, resulting in—at least temporarily—diminished forest C fixation (CO2 influx) and autotrophic respiration (CO2 efflux from plant and rhizosphere metabolism) and, in some cases, increased heterotrophic respiration (CO2 efflux from organic matter decomposition) due to increased decomposition [2,3,4,5,6]. Over extended periods of time, the effect of natural disturbances on the carbon (C) balance can thus result in a forest turning from being a C sink into a C source and so add to global warming [4,7]. However, the effects on C balance may be less drastic and transient if the productivity of the remaining trees and secondary structure is increased or if decreased forest stand productivity is accompanied with a reduction in ecosystem respiration [8,9]. Besides disturbance severity, changes in forest ecosystem C fluxes are dependent on several other factors, e.g., pre-disturbance forest composition and structure, growth of the remaining trees and ground vegetation, and tree regeneration [5,8,10,11,12]. Hence, the responses and recovery of a forest after disturbance may differ among forest management strategies as well as between non-managed and commercially managed forests [3,8,13,14,15].
Soil respiration is one of the largest terrestrial C fluxes globally [16]. It has been estimated that 55% of the C fixed annually by forests in gross primary production is returned back to the atmosphere as a result of soil respiration [17]. Disturbance may alter soil respiration in several ways. Tree death reduces soil autotrophic respiration due to the cessation of C allocation to roots and soil [18,19]. Disturbance-induced tree mortality also results in changes in litter quality and quantity [20,21], light and water availability and soil temperature and moisture [2,6,12,22,23], soil microbial community dynamics [24,25,26], and the composition of the ground vegetation [13,27], all of which can be expected to lead to changes in the decomposition process and, hence, soil heterotrophic respiration.
Besides spatial variation in the alterations, the direction and magnitude of these alterations may change with time after the disturbance [5]. As a result, both increases [23,28] and decreases [9,29] as well as no change [6,22,23,30,31] in soil total respiration over periods varying from months to several years after disturbance have been reported. However, few studies have studied the effects of natural disturbance separately on the autotrophic and heterotrophic components of soil respiration. Mayer et al. [6,23] found that storm disturbance increased heterotrophic respiration for some years after the storm and attributed this to increases in soil temperature and associated accelerated decomposition of soil organic matter, whereas in another study [29], storm and bark beetle disturbance was shown to have decreased autotrophic soil respiration but to have had no clear effect on heterotrophic respiration.
Storms and European spruce bark beetle (Ips typographus L.) outbreaks are two major forms of disturbance in European forests [32,33], and both are predicted to result in greater tree damage in the future [34,35]. Whilst storms immediately alter the structure and functioning of the forest by breaking and uprooting (killing) trees and mixing soil [1], the changes brought about by bark beetle outbreaks are gradual [2]. Wind disturbance especially creates various microsites [1,36] where tree stand and soil properties differ. For example, undisturbed soil with decomposing residue piles [37] or gaps [38,39] created after disturbance can have different soil properties and dynamics compared to the less affected areas or pre-disturbance conditions. Storm events can predispose forests to insect outbreaks, as wind-fallen trees provide optimal breeding material for bark beetles [40,41]. Where there is more than one disturbance event, changes in the C balance and soil respiration can be expected to be more complicated.
In this study, the effects of a storm event followed by an outbreak of I. typographus on soil surface total (SRtot, soil CO2 efflux from soil and ground vegetation), autotrophic (SRa), and heterotrophic (SRh) respiration were investigated at two forest sites in southeastern Finland. The aims of the study were to determine the effect of storm damage and I. typographus outbreak on (1) SRtot and its autotrophic and heterotrophic components and (2) the degree to which disturbance-related differences in respiration were due to differences in tree stand characteristics and tree mortality or in environmental conditions. We hypothesized that (1) SRa from storm-damaged and from I. typographus-infested plots would be lower and SRh higher compared to control (undisturbed) plots; (2) storm-damaged SRa and SRh would differ between open microsites having ground vegetation and microsites under storm-felled trees covered with dead tree detritus; and (3) respiration would be related to stand basal area (dead tree basal area resulting from the storm and I. typographus disturbances), disturbance-related differences in soil microclimate (temperature and moisture), or both.

2. Materials and Methods
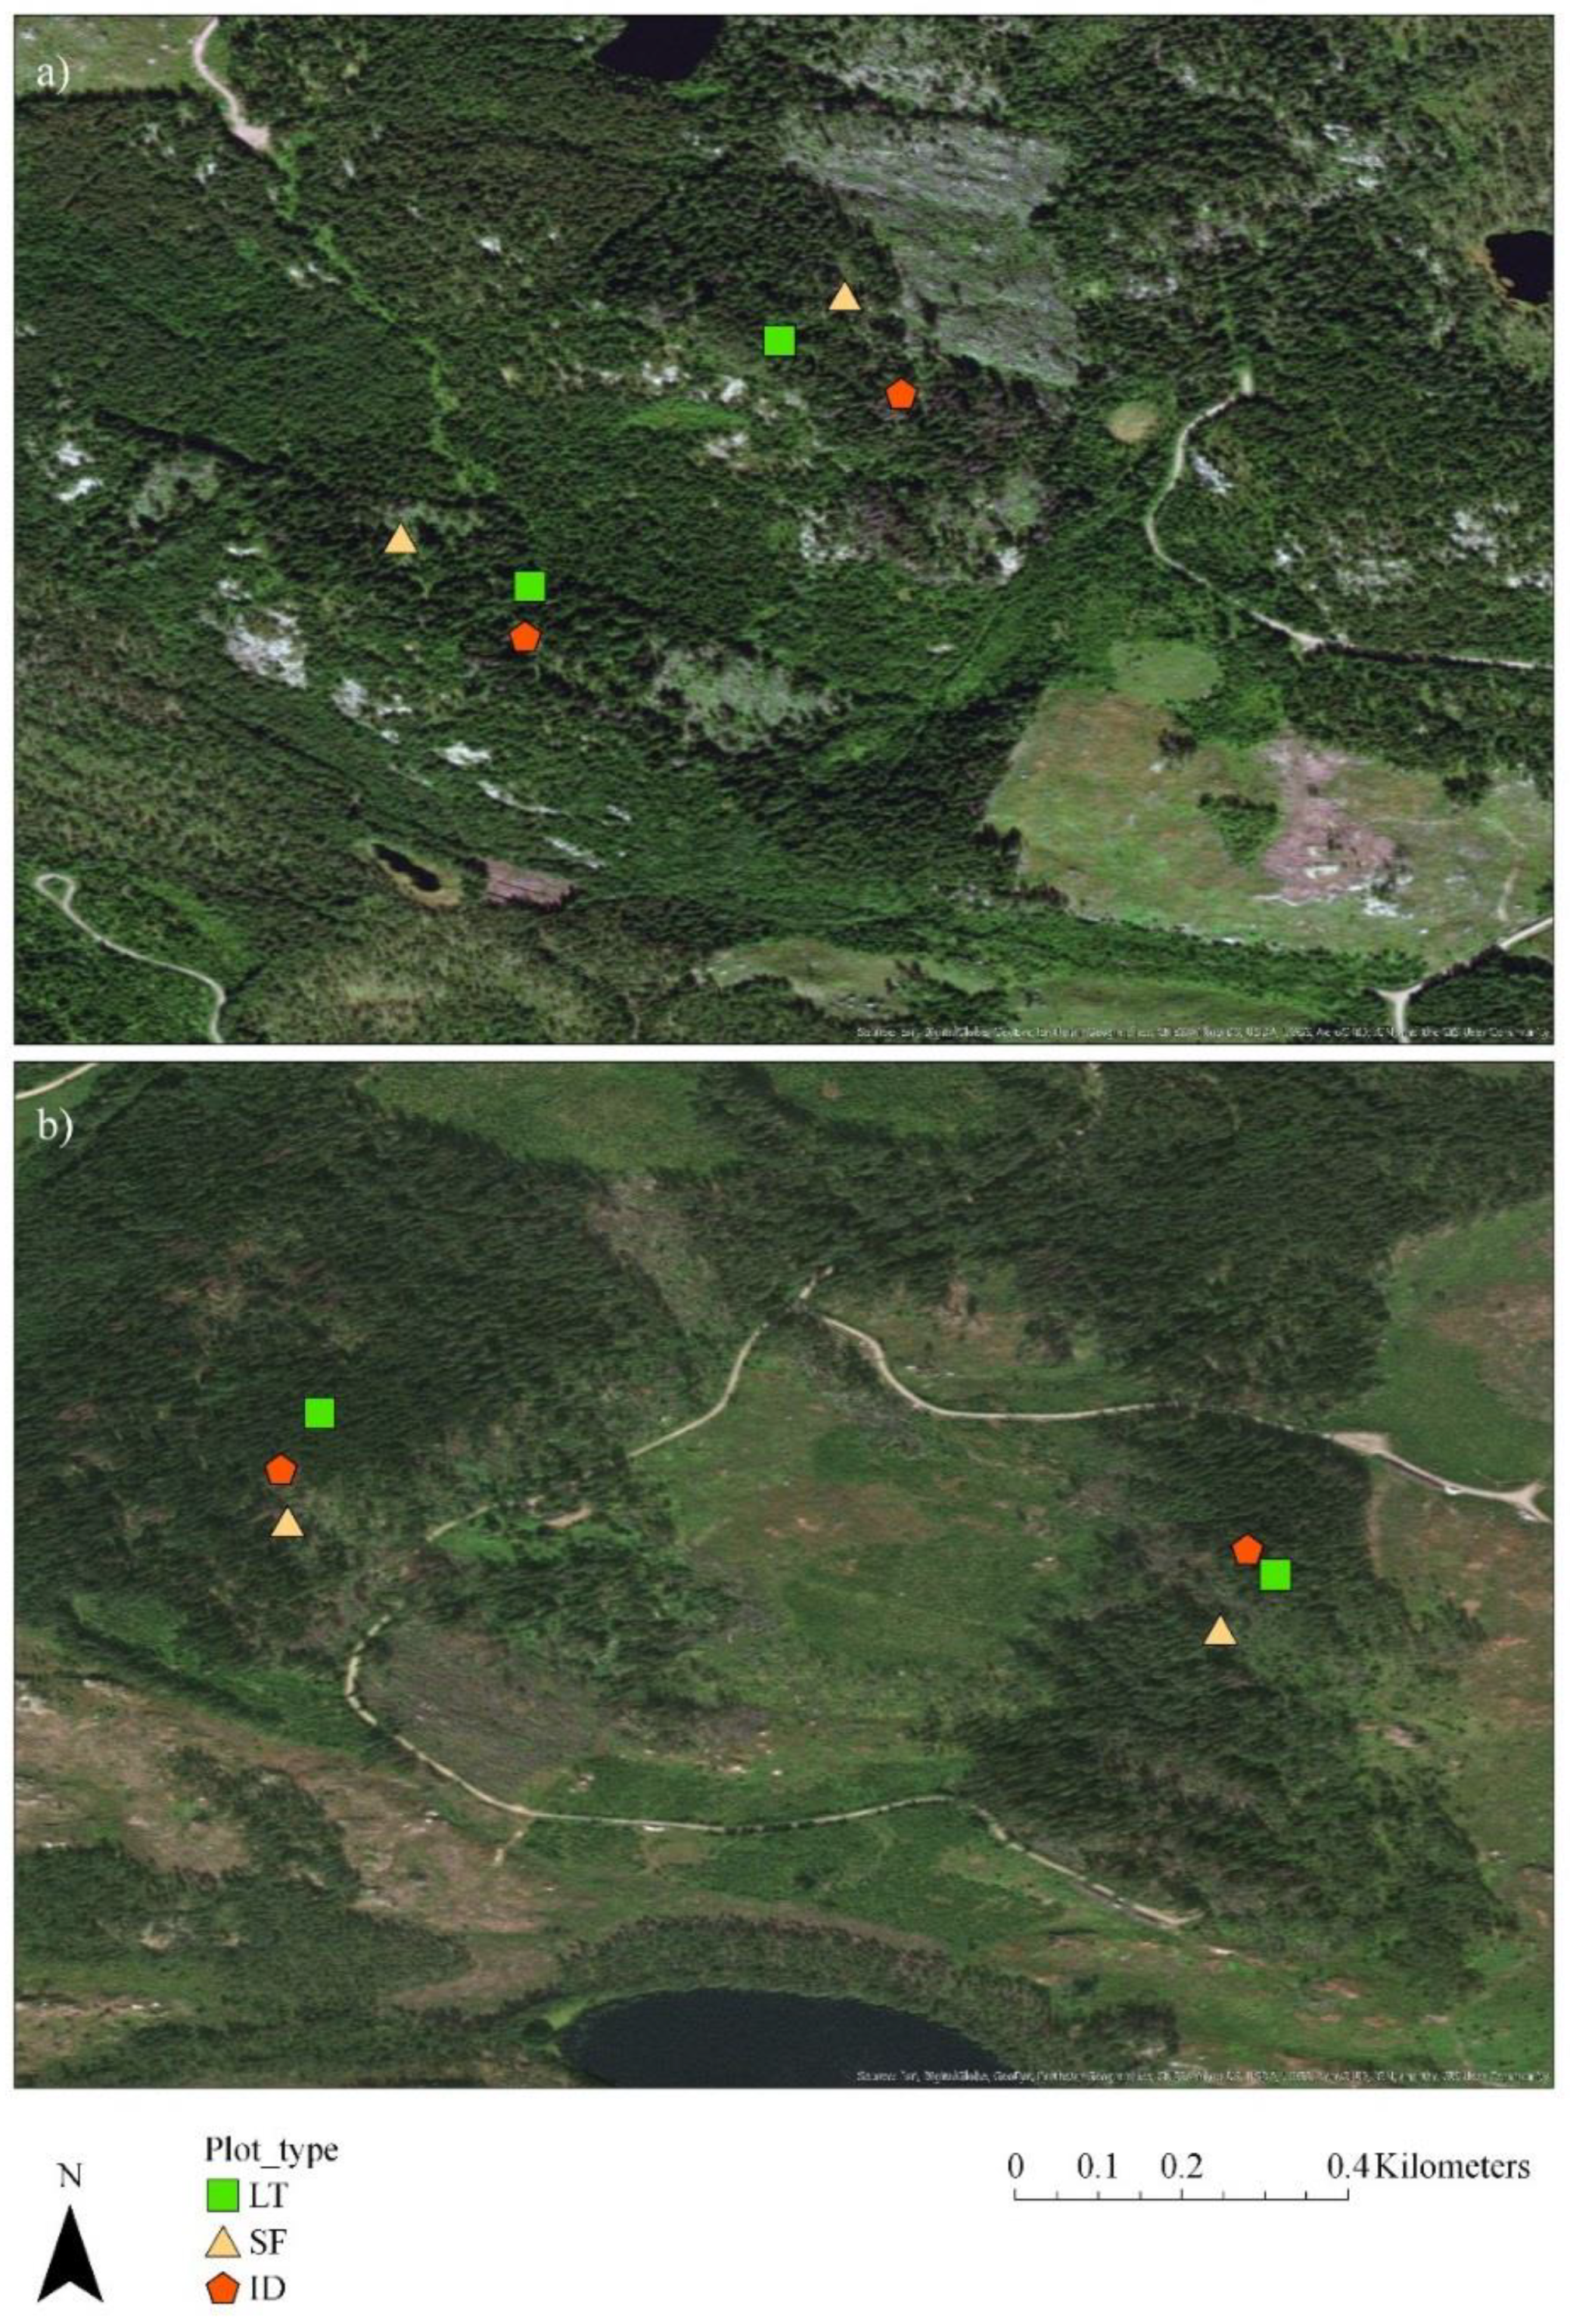
2.1. Research Area

The study was carried out in two Norway spruce (Picea abies L.) dominated forest sites, Paajasensalo (56 ha) and Viitalampi (73 ha), located in the municipality of Ruokolahti (61°17′30″ N, 28°49′10″ E) in southeastern Finland. The distance between the two sites is about 6 km. A large-scale storm occurred in the region in July 2010 and was followed by an outbreak of I. typographus from 2011 onwards. The forests at the Paajasensalo site were in commercial use until 2010 and those in the Viitalampi site until 2011, but afterwards they were conserved as METSO (Forest Biodiversity Program for Southern Finland) sites and no forest management actions have been carried out since. Thus, contrary to normal forestry practice, all the trees killed by the storm and bark beetle were left in the forest after the disturbance events, making the sites ideal for the purposes of this research.
The soils at the study sites were Podzols, mostly cambic, and developed in till deposits. The soil texture (fine-earth fraction) was either sandy loam or loamy sand, and the thickness of the surface humus layer varied between 2.3 and 8.0 cm. According to the Cajanderian site type classification [42], which describes site stand productivity, the sites were mainly medium-rich Myrtillus (MT) and rich Oxalis-Myrtillus (OMT) types. The ground vegetation under closed canopy was dominated by blueberry (Vaccinium myrtillus L.), with lingonberry (Vaccinium vitis-idaea L.) and several herbaceous species (e.g., small cow-wheat (Melampyrum sylvaticum L.), twinflower (Linnea borealis L.), wood sorrel (Oxalis acetosella L.), and oak fern (Gymnocarpium dryopteris L. Newman)) being present. The forest floor moss layer was dominated by red-stemmed feather-moss (Pleurozium schreberi (Brid.) Mitt.), stairstep moss (Hylocomium splendens (Hedw.) BSG), and fork-moss (Dicranum sp.). The storm and, to a lesser degree, the bark beetle outbreaks modified the ground vegetation composition towards more light-demanding pioneer species such as fireweed (Chamerion angustifolium L.), wavy hair-grass (Deschampsia flexuosa L. Trin), and raspberry (Rubus ideaus L.). Although dominated by spruce, isolated Scots pine (Pinus sylvesteris L.), silver birch (Betula pendula Roth), downy birch (Betula pubescens L.), European aspen (Populus tremula L.), grey alder (Alnus incana L.), common alder (Alnus glutinosa L. Gaertn), rowen (Sorbus aucuparia L.), and willow (Salix spp.) trees also grew within the stands. The long-term (1981–2010) mean annual air temperature for the study sites was 4.2 °C and the mean annual precipitation was 653 mm [43]. The mean air temperature and precipitation for the study months (May–Oct) were 12.3 °C and 38 mm in 2015, 13.0 °C and 52 mm in 2016, and 11.3 °C and 61 mm in 2017 [44].

2.2. Study Layout

After exploring both study sites, three types of disturbance areas were identified: those having living trees with no clear signs of storm or bark beetle damage (LT), areas with fallen trees resulting from the storm (SF), and areas of living and dead standing trees showing bark beetle attack (ID). A circular plot (radius 11.28 m, area 400 m2) was then established in each of three areas in both study sites in June 2015 (Figure 1), resulting in a total of 12 plots (6 in Paajasensalo and 6 in Viitalampi). In order to have a more encompassing data set, another set (block) of plots were established in both study sites in June 2016 (Figure 1). Photographs of each plot type (LT, SF, and ID) are presented in Figure S1. As the three plots (disturbance treatments) were spatially interspersed within the two blocks and the blocks were replicated at two study sites, bias and problems of pseudoreplication were reduced [45].

2.3. Tree Measurements

All trees growing on the plots were numbered and the diameter at breast height (dbh) of each living and dead tree, both standing and fallen, with a dbh of >6 cm was measured. All spruce trees were inspected for symptoms of I. typographus colonization (discoloration, defoliation, entrance and exit holes, resin flow spots, and bark loss) [46] to confirm the initial cause of each spruce tree’s death as I. typographus and to monitor the population level of the living trees during the study. Although some spruce trees on the LT plots showed incipient symptoms caused by I. typographus, they remained living and vigorous during the study period. We are not able to identify the specific time of death of the I. typographus-killed trees in our plots, but it took place during 2013–2014 [47]. In addition to the storm in July 2010, the warm summers of 2010, 2011, and 2013 [48] likely contributed to the development of the I. typographus outbreak. The two disturbance types also interacted on some of the plots. For example, 50% of the standing dead trees on the Viitalampi ID plot established in 2015 broke and fell due to another storm in October 2015. On the other plots, however, only single standing dead trees and none of the living trees fell during the study period. In addition, many of the wind-thrown trees on the SF plots had maternal galleries of I. typographus. However, the initial cause of tree death on SF plots was the storm in 2010 and the beetle outbreak on the ID plots that occurred from 2011 onwards. Some dead trees were also found at the LT plots, but they had already died before the 2010 storm and start of the beetle outbreak.

2.4. Soil Surface Respiration, Temperature, and Moisture Measurements

Soil surface respiration, soil temperature, and soil moisture were measured at a number of locations in each plot. For the LT and ID plots, the location of the sampling point was based on a random selection of the numbered trees. A stone-free sampling area ≥2 m from the randomly selected tree stem (or other measurement point) was selected. In the case of the SF plots, all fallen tree(s)–detritus-covered microsites (SFd) and ground vegetated–open (i.e., no fallen trees above) microsites (SFo) were identified and numbered, and then a set of each microsite type was chosen using a random number sequence generator. These two types of microsite reflected a clear dichotomy in conditions created by the storm. If a respiration measurement point was considered unsuitable (stony or <1.5 m to another measurement point or tree), it was rejected and the next measurement point in the random sequence was chosen. Accordingly, 30 soil respiration measurement points were established in each study site in summer 2015: eight in the LT plots, seven each in the SFd and SFo microsites, and eight in ID plots at each forest (Figure S2). A PVC collar (diameter = 20.1 cm, height ~ 15 cm) for respiration measurements was installed at each selected measurement point by pressing the collar into the ground to a depth of ca. 1 cm and sealed from the outside with sand (Figure 2, Figure S2). At this stage, vegetation was not removed from inside the collars so that SRtot measurements included respiration by soil and ground vegetation. In 2016, collars were installed in the new plots using the same procedure as in 2015: three collars in the LT plots, three in each of the two microsites in the SF plots, and three in ID plots at both study sites.
In order to quantify the proportions of SRa and SRh, 15 of the measurement points in the plots established in 2015 (4 in LT, 3 or 4 in SFd and 3 or 4 in SFo, and 4 in ID selected at random in both study sites) were trenched in July–August 2016. A knife and a spade were used to cut the roots in an area of ca 0.25 m2 surrounding the selected collars to a depth of ca. 30 cm, the maximum depth of most P. abies roots in Finnish conditions [49]. A 30 cm wide strip of strong fabric was then inserted into the cut to inhibit further root ingrowth. After trenching, the ground vegetation was carefully removed from inside the collars. Mosses were, however, left growing in the collars to avoid direct radiation from topsoil, but were not considered to have significantly affected the respiration measurements. Any regrowth of vegetation was removed inside the trenched collars before each measurement.
Trenching may bias soil autotrophic and heterotrophic respiration estimates, for example, because of changes in the soil microclimate brought about by root decease [50]. In our study, trenching, however, had no clear effect on soil moisture and increased the soil temperature only slightly at some plots. Nevertheless, for example, re-sprouting of the clipped vegetation at trenched points in between measurements as well as inclusion of ground vegetation respiration to measurements at intact collars may have also caused inaccuracy to estimations. Thus, the SRa and SRh values should only be considered as estimates of the proportions.
The respiration measurements were carried out approximately weekly during 18 Jun–6 Oct 2015 and 24 May–27 Sept 2016 and approximately biweekly during 16 May–19 Oct 2017 (intervals varying from 4 to 18 days) using a closed and darkened chamber (D = 19.0 cm, height = 24.7 cm) made of Perspex fitted with a CARBOCAP® GMP343 CO2 probe (Vaisala Ltd., Vantaa, Finland) and an air mixing fan (Figure 2). After carefully placing the chamber on top of the collar, the increase in the CO2 concentration inside the chamber was recorded every 5 seconds over a 5 minute period. The lower edge of the chamber was fitted with a rubber O-ring washer so as to prevent any airflow between the collar and chamber. The air in the chamber was mixed during each measurement by means of a small fan fitted inside the chamber. Between each measurement, the chamber was ventilated by exposing the chamber to the air. Immediately following the respiration measurements, soil temperature and moisture were measured at three spots around each collar (ca. 0.2 m distance from the collar). Soil temperature (°C) was measured at a depth of 10.5 cm using a S3 11B thermometer (Fluke corp., Everett, WA, USA) probe and the soil moisture (% vol) was measured at a depth of 6.0 cm with a ML3 ThetaKit soil moisture meter (Delta-T devices Ltd., Cambridge, UK).

2.5. Calculation of Soil Surface Total, Heterotrophic, and Autotrophic Respiration

Respiration (mg CO2 m−2 s−1) was calculated as the slope of the linear regression between CO2 concentration in the chamber and time. Respiration measurements from the intact (non-trenched) collars (n = 30 in both Paajasensalo and Viitalampi until Aug 2016, after which n = 27) in both study sites over the whole study period in 2015–2017 were taken to be SRtot. Respiration measured from the trenched collars (n = 15 in both Paajasensalo and 15 in Viitalampi) was considered to be SRh, and the difference between SRtot and SRh was therefore assumed to be SRa.
However, as we observed a difference in the mean SRtot values between the intact collars and the collars to be trenched already before the trenching for some plots, we used linear regression to estimate the SRtot values for the trenched collars in order to correct for this baseline difference. Thus, for each plot established in 2015, a linear regression model was computed using pre-trench data (up to June 2016) to predict the SRtot of the collars to be trenched from that of the collars that would remain intact. These regression models were then used to derive post-trenching SRtot values for the trenched collars as if they had not been trenched. All regression models had high R2 values (0.73–0.96). The difference between the predicted mean SRtot values and the measured mean values from the trenched collars (SRh) was then taken to be SRa. Values of SRa were thus weekly treatment means, including one value that was negative. The SRh values were individual collar measurements; however, weekly treatment means of SRh for each plot were used to compare with SRa values.
The disturbance caused by root cutting and fast decay could be expected to keep the levels of respiration high for some time after trenching. In our treatments, respiration of the trenched collars in comparison to the intact collars decreased mostly 1–3 weeks (but ca. 2 months at the latest) after the root cutting; therefore, only the respiration measurements starting from 2017 were used to estimate the proportions of SRa and SRh.

2.6. Statistical Analyses

For comparing SRtot and SRh (measured and temperature-adjusted), temperature, and moisture between treatments, analyses of variance (ANOVA) with a linear mixed-effects model structure followed by Scheffe’s post hoc tests were used. Treatment (LT, SFo, SFd, and ID) was set as a fixed variable, and measurement date (running number of days cumulated over the study period) and collar number were set as random crossed variables. If the produced linear mixed model did not fulfil the assumptions of normality and homogeneity of residuals, appropriate transformations were applied. Because there was only one value for SRa at each treatment for each measurement day in 2017, it was not appropriate to test for differences in SRa between treatments.
To control for the effect of treatment differences in soil temperature on respiration, each measured SRtot and SRh value was adjusted to a soil temperature value of 10 °C. This was done by fitting a nonlinear regression [51] between soil temperature and respiration for each collar separately. The adjusted flux at a soil temperature at 10 °C was then calculated by adding the estimated value of respiration at 10 °C of each collar to the residual of each measurement.
Spearman’s rank correlation coefficients were computed to describe the relationship between the plot (n = 16) mean SRtot (measured and temperature-adjusted), soil temperature and soil moisture, and plot basal area (living, dead, and total), i.e., across treatments. Basal area values of the entire SF plots were used for both SFd and SFo microsites. Spearman’s rank correlation coefficients were also computed to describe the relationship between plot (n = 8) mean SRa and SRh and plot basal area, i.e., across treatments.
All the analyses were done using the R statistical computing environment [52] with utilization of lme4 [53] for the mixed modeling, car [54] for ANOVA, and emmeans [55] for the post hoc tests.

3. Results

3.1. Tree Mortality

The characteristics of the stands on each plot are shown in Table 1. Spruce was the dominant species, although several plots also had a considerable proportion of pine (Pinus sylvestris L.) and broadleaved trees (mostly silver birch, Betula Pendula Roth) present. An exception was the Viitalampi LT plot established in 2016, where only 45% of the trees were spruce; however, 59% of the living trees on that plot were spruce. The Viitalampi ID plot established in 2016 had the highest stem density, and the Viitalampi SF plot established in 2015 had the lowest, with all being dead. Of the disturbed plots (SF and ID), the greatest proportion of dead trees was in the Viitalampi SF plot established in 2015 (100%) and the lowest was in the Viitalampi ID plot established in 2015 (69%). The proportion of dead trees on the LT plots varied between 8% and 27%.

3.2. Soil Surface Total Respiration, Soil Temperature, and Soil Moisture

At Paajasensalo, the mean SRtot of the three disturbed treatments was lower than that of the LT treatment, although only significantly so in the case of the SFo treatment (Table 2). At Viitalampi, the disturbed treatment mean SRtot was also lower than that of the LT treatment, but none of the differences were significant. After adjusting SRtot for soil temperature, the differences in mean values between treatments were reduced, but LT and SFo still significantly differed from each other at Paajasensalo (Table 2). Adjusting the respiration values for soil temperature did not change the pattern in SRtot among the treatments at Viitalampi.
Mean soil temperatures were slightly lower, but significantly so only at SFd and SFo for the disturbed treatments compared to the LT treatment at Paajasensalo (Table 2). At Viitalampi, mean soil temperatures were significantly highest in the case of the ID treatment. The mean soil moisture content at Paajasensalo was significantly higher for the three disturbed treatments compared to the LT treatment. At Viitalampi, the disturbed treatment mean soil moisture was also higher than the LT treatment mean value, but not significantly so (Table 2). The mean SRtot, temperature, and moisture of plots established in 2015 and 2016 as well as those of the to-be-trenched and intact collars are presented in Table S1.
The seasonal patterns in SRtot, soil temperature, and soil moisture contents for the three study years are shown in Figure 3. At Paajansensalo, the LT treatment had higher SRtot values compared to the disturbed treatments during the mid-summer to autumn months, whereas the differences between treatments were not that visible in the early summer periods (Figure 3a). At Viitalampi, no clear differences in the seasonal pattern of SRtot among the treatments were observed (Figure 3b). However, at both Paajasensalo and Viitalampi, SRtot followed the seasonal pattern in soil temperature (Figure 3c,d). The seasonal pattern in soil moisture in each year was similar at both Paajasensalo and Viitalampi. At Paajasensalo, soil moisture was consistently the highest in the ID treatment and lowest in the LT treatment throughout each year (Figure 3e). While the treatment differences in soil moisture at Viitalampi during 2015 were similar to those at Paajasensalo, the differences evened out during 2016 and 2017 (Figure 3f).

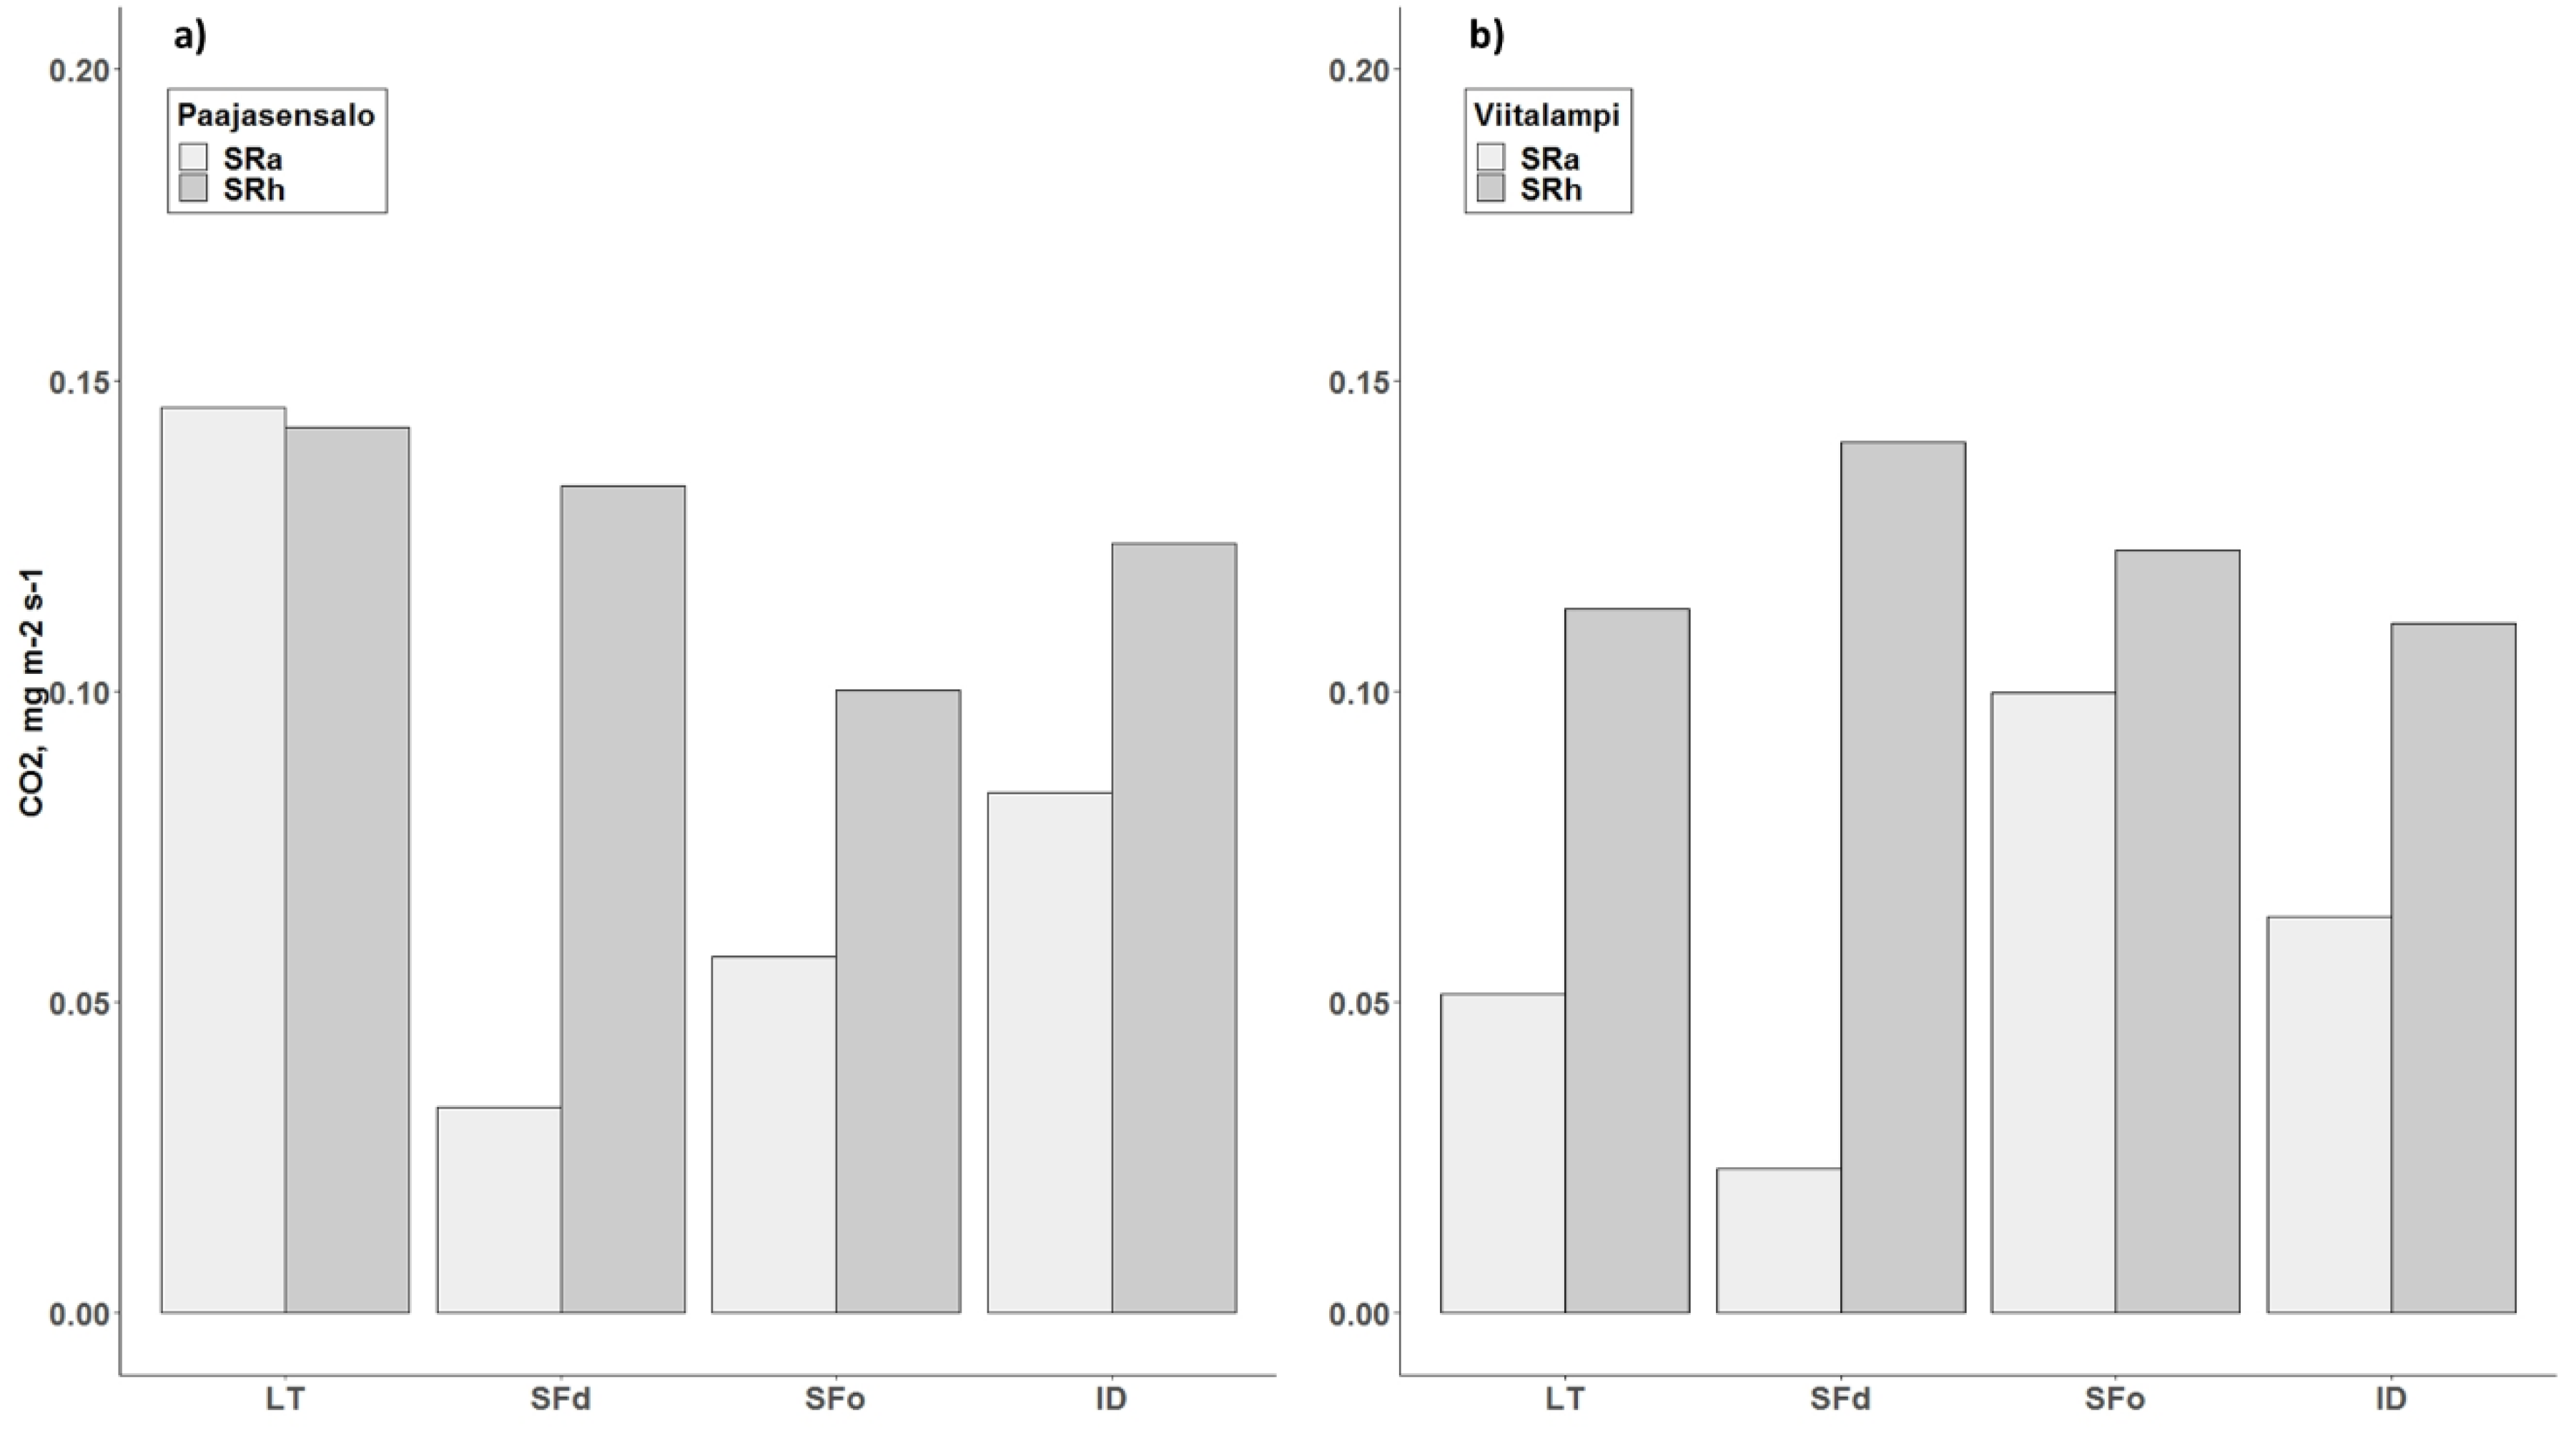
3.3. Heterotrophic and Autotrophic Soil Respiration

At Paajasensalo, the mean SRa values from the disturbed plots were 23% (SFd), 39% (SFo), and 57% (ID) of the mean value from LT. At Viitalampi, the mean SRa value from the SFd treatment was 45% of the mean value in LT, whereas the mean values from the SFo microsite and ID plot were 195% and 124%, respectively, of the mean value of LT. The mean SRh at Paajansensalo was lowest in SFo (70% of the mean in LT) (Figure 4) and differed significantly from LT. The respective soil-temperature-adjusted mean respiration values, however, did not differ significantly from each other (Table 2). At Viitalampi, the highest mean SRh was found in SFd (124% of mean in LT), but the mean did not differ significantly from those of other treatments (Table 2).
The proportion of SRa relative to SRtot at Paajasensalo was 51% for LT, 20% for SFd, 36% for SFo, and 40% for ID treatment. The corresponding proportions at Viitalampi were 31% for LT, 14% for SFd, 45% for SFo, and 36% for ID. This resulted in a shift in SRtot towards SRh at disturbed plots with exception of the SFo microsite and ID plot in Viitalampi, where the proportions of SRa were higher than at the LT plot.

3.4. Relationships between Variables

Combining data from both sites, the plot mean (treatment mean in SF) SRtot was significantly and positively correlated with the basal area of living trees (Table 3). SRa or SRh, however, were not significantly correlated with the basal area of living trees or that of all trees. Neither did soil temperature correlate with the tree stand variables, but soil moisture showed a significant negative correlation with both basal areas of living and all trees (Table 3). Using soil-temperature-adjusted SRtot values for correlations did lower the correlations. Across both sites, treatment and plot mean soil temperature also showed a significant positive correlation with soil total respiration (Table 3), as it did inside each treatment (Table S2). Mean soil moisture, on the contrary, showed significant negative correlations with SRtot and SRh across both sites and treatments (Table 3) but showed weaker correlations inside each treatment (Table S2).

4. Discussion

4.1. Soil Surface Total, Autotrophic, and Heterotrophic Respiration

We hypothesized that the loss of living trees (roots) resulting from storm damage (5–7 years ago) and I. typographus infestation (tree mortality circa 2–4 years ago) would result in reduced SRa, while the death of trees and roots would increase the amount of surface organic debris and soil organic matter available for microbial decomposition and hence increase SRh. Our results went some way to supporting this hypothesis. Thus, SRa at both the I. typographus-infested and storm-damaged plots was lower than at the living tree plot in Paajasensalo, and the same was true for the storm-damaged SFd microsite, but not for the storm-damaged SFo microsite and I. typographus-infested plot, at Viitalampi. Furthermore, the lower SRa/SRtot ratios of the disturbed plots compared to the living tree plots supported the hypothesis that disturbance results in a shift in total respiration away from SRa towards SRh at Paajasensalo, but not at Viitalampi. Although significant differences in SRh were only found between the SFo and LT treatments in Paajasensalo, the values at disturbed treatments were mainly lower in Paajasensalo and higher in Viitalampi in comparison to LT. As a result of these patterns in SRa and SRh, significant differences (lower) in SRtot compared to living tree plots were only associated with the storm-damaged open microsites at Paajasensalo.
The higher-than-expected level of SRa at the Viitalampi SFo microsite and ID plot might have been due to a response of ground vegetation cover and/or the remaining living trees to changes brought about by the tree mortality. As the ground vegetation at the Viitalampi SFo microsite was observed to be more developed than at the other plots, the higher-than-expected SRa value was however probably due to the inclusion of the associated autotrophic respiration. The ID plot was also damaged by a storm which broke and felled 50% of the beetle-killed standing dead trees, resulting in increased light to the forest floor and subsequent development of the ground vegetation, which is typical especially after wind disturbance [27]. The effect of developing ground vegetation after disturbance (bark beetle, storm and clearance) has been implicated in increased autotrophic soil respiration observed in a study carried out in Norway spruce stands in Austria [50]. In addition, the productivity of the remaining living trees at the ID plot may have been stimulated by an increase in light, water, and nutrient availability after the death of surrounding trees by I. typographus, as was shown in a study on mountain pine beetle (Dendroctonus ponderosae Hopkins) attack on lodgepole pine stands in British Columbia [8], and resulted in increased SRa. Also, seedlings which were growing at all plot types may have contributed to some extent to the SRa at the disturbed treatment plots. However, rather than stimulating growth, mechanical damage to the remaining living trees caused by the storm-felled trees may have hampered their growth [56], resulting in the lower SRa in SFd plot compared to the ID plot at Paajasensalo. That there was still relatively high SRa in the SFd microsite in Viitalampi in spite of there being no living mature trees, may be because some of the respiration measurement points also had living ground vegetation, which would have contributed to the SRa component.
That the difference in SRh rates between treatments was weaker than expected may be related to the length of time since tree mortality. Following tree mortality, the C/N and lignin/N ratios of the needle litter decrease [20,22], while litterfall [21] and the mortality of fine roots and ectomycorrhizal fungi [19,57] increase, all of which could potentially stimulate decomposition and SRh. With time after disturbance, the more easily decomposable compounds would be utilized, leaving more recalcitrant debris and lowering the rate of decomposition [24]. The SRh rates at our disturbed plots may thus have been considerably higher in the first weeks, or even years, following the death of the trees, i.e., before our measurements started. Nevertheless, small branches and twigs on the SFd microsites were probably a sufficiently good substrate for decomposition, keeping SRh rates relatively high even seven years after the storm. However, such an effect could be expected to be less visible in the case of managed forests where trees are cleared away after disturbance. Increasing ground vegetation growth accompanied with lowering heterotrophic respiration can considerably mitigate C emissions already three to six years after storm and beetle disturbance and clearing of damaged trees [50]. In our study, the higher SRa at the SFo microsite in comparison to LT at Viitalampi and lower (although not significantly) SRh at SFo microsite in comparison to SFd at both sites could indicate such a pattern. However, we have no data to support this possibl effect.
On a larger spatial scale with greater variability in tree mortality, forest structure and composition, and disturbance-created microhabitats, different or more notable effects in soil surface respiration after the two disturbance types could possibly be found. Although our disturbed study plots on average had a similar dead tree basal area, storm- and I. typographus-induced tree mortality patterns across the study forests were rather heterogeneous, varying from individual to stand-level tree decease. Noteworthy also is that at our sites, trees were not cleared away after the events, which would be expected to lead to differing response and recovery patterns of C balance compared to managed forests, due to differences in, e.g., litter quantity, incoming radiation, and ground vegetation changes [13,27].

4.2. Relationships between Basal Area, Soil Microclimate, and Respiration

Although we hypothesized that respiration would be related to the amount of dead tree biomass resulting from the disturbances, SRtot was more strongly correlated to the basal area of living trees than to that of the dead trees. The weaker correlations with dead tree basal area are probably because much of the dead fine root biomass, needles, and small branch detritus that decompose much faster than the bigger tree parts [58,59] had already decomposed by the time of our respiration measurements. Also, since detritus for decomposition is also supplied by the living trees, SRh cannot be attributed to dead trees only; therefore, correlations with basal area likely were relatively weak.
As we had hypothesized, soil temperature and moisture conditions differed among the treatments. The higher soil moisture contents in the disturbed plots compared to the living tree plots in Paajasensalo are likely related to a reduction in transpiration resulting from tree mortality. The effect of tree mortality on transpiration and soil moisture contents was also clearly indicated by a significant negative correlation between soil moisture content and living tree basal area. However, in Viitalampi, the diminishing soil moisture differences between treatments during the study period may be related to the dense herbaceous ground vegetation further developing during the study and potentially enhanced tree growth taking up moisture from the soil. Soil temperature did not differ so clearly between treatments as moisture, but the higher soil temperatures recorded in Viitalampi ID treatment compared to other treatments may be explained by an increase in light (radiation) conditions brought about by the storm felling of dead trees, as discussed earlier.
To assess the extent to which soil surface respiration were determined more by soil temperature than by plant metabolism and the supply of detritus (living and dead basal area), we examined temperature-adjusted respiration values. However, adjusting respiration for temperature had little effect on the treatment mean respiration rates, indicating that treatment differences in soil surface respiration were determined more by differences in plant metabolism and the supply of detritus than by differences in soil temperature per se.
Collar-wise correlations between soil moisture and SRtot were generally poor, which is why we were not able to examine the effect of soil moisture on respiration differences between treatments. There were, however, clear differences in mean soil moisture contents between treatments, and plot-wise mean SRtot and SRh rates were strongly and significantly correlated to plot mean soil moisture contents, indicating that disturbance-driven effects on soil surface respiration are related to changes in soil moisture conditions. However, as basal area and soil moisture were also strongly correlated, it is not possible to determine whether differences in respiration were due to differences in basal area or soil moisture.

5. Conclusions

We found no consistent effect of either storm or I. typographus disturbances (tree mortality) on SRtot and SRh. However, SRa was lower and SRtot rates showed a shift towards a greater proportion of SRh in the disturbed forest areas, except at the SFo microsite and ID plot at Viitalampi, where SRa was higher than expected. These higher-than-expected SRa values may have been related to the development of ground vegetation and growth stimulation of remaining living trees. Soil surface respiration was found to be related to basal area (living trees) and soil moisture and temperature conditions, factors which would further relate to plant metabolism, the supply and availability of organic matter for decomposition, forest floor light (radiation) conditions, and stand transpiration.
Despite the mainly similar effects of the two disturbances on soil C dynamics found in this study, the influence of the disturbances on tree mortality patterns, stand structure and composition, and created microsites differs over larger areas. Since storm and bark beetle disturbances are predicted to become more common in the future, their effects on forest C dynamics may become even more complex and considerable. Therefore, for future research, studies concentrating on several disturbances and their effects on forest C fluxes and C balance at greater spatial and temporal scales would be important in order to clarify and estimate the potential effects of disturbances on forest C dynamics.

Supplementary Materials

The following are available online at https://www.mdpi.com/1999-4907/10/4/307/s1, Figure S1: Example photos of plot types, Figure S2: Example photos of soil surface respiration measurement points, Table S1: Mean soil surface respiration, temperature and moisture of each treatment at each plot separately, Table S2: Correlation coefficients between soil surface total and heterotrophic respiration, temperature and moisture.

Author Contributions

Conceptualization, M.K., P.L.-S., M.B. and M.S.; Data curation, M.K. and M.B.; Formal analysis, M.K.; Funding acquisition, M.K., P.L.-S. and M.S.; Investigation, M.K., P.O. and M.S.; Methodology, M.K., P.L.-S., P.O. and M.S.; Project administration, M.K. and M.S.; Resources, M.K.; Software, M.K.; Supervision, P.L.-S., P.O. and M.S.; Visualization, M.K. and M.S.; Writing—original draft, M.K.; Writing—review and editing, P.L.-S., P.O., M.B. and M.S.

Funding

This research was funded by AGFOREE Doctoral Programme, Finnish Cultural Foundation—South-Karelia Regional Fund, Nessling Foundation, Niemi Foundation and Societas pro Fauna et Flora Fennica.

Acknowledgments

We wish to thank Pentti Henttonen, Eetu Hirvonen, Risto Tanninen and Jaana Turunen for irreplaceable help with field work. Tuula Kantola, Kajar Köster and Jukka Pumpanen we acknowledge for their valuable advice in relation to the study design and field measurements. Stora Enso and Tornator Ltd, especially Jarmo Hakalisto and Maarit Sallinen, we thank for enabling this study to be carried out in the Viitalampi and Paajasensalo forests.

Conflicts of Interest

The authors declare no conflict of interest.

References

  1. Mitchell, S.J. Wind as a natural disturbance agent in forests: A synthesis. Forestry 2013, 86, 147–157. [Google Scholar] [CrossRef]
  2. Edburg, S.L.; Hicke, J.A.; Brooks, P.D.; Pendall, E.G.; Brent, E.; Norton, U.; Gochis, D.; Gutmann, E.D.; Meddens, A.J.H.; Edburg, S.L.; et al. Cascading impacts of bark beetle-c mortality on coupled biogeophysic biogeochemical processes. Front. Ecol. Environ. 2012, 10, 416–424. [Google Scholar] [CrossRef]
  3. Knohl, A. Carbon exchange of a Russian boreal forest after windthrow Carbon dioxide exchange of a Russian boreal forest after disturbance by wind throw. Glob. Chang. Biol. 2002, 8, 231–246. [Google Scholar] [CrossRef]
  4. Kurz, W.A.; Dymond, C.C.; Stinson, G.; Rampley, G.J.; Neilson, E.T.; Carroll, A.L.; Ebata, T.; Safranyik, L. Mountain pine beetle and forest carbon feedback to climate change. Nature 2008, 452, 987–990. [Google Scholar] [CrossRef]
  5. Hicke, J.A.; Allen, C.D.; Desai, A.R.; Dietze, M.C.; Hall, R.J.; Hogg, E.H.T.; Kashian, D.M.; Moore, D.; Raffa, K.F.; Sturrock, R.N.; et al. Effects of biotic disturbances on forest carbon cycling in\r\nthe United States and Canada. Glob. Chang. Biol. 2012, 18, 7–34. [Google Scholar] [CrossRef]
  6. Mayer, M.; Sandén, H.; Rewald, B.; Godbold, D.L.; Katzensteiner, K. Increase in heterotrophic soil respiration by temperature drives decline in soil organic carbon stocks after forest windthrow in a mountainous ecosystem. Funct. Ecol. 2017, 31, 1163–1172. [Google Scholar] [CrossRef]
  7. Lindroth, A.; Lagergren, F.; Grelle, A.; Klemedtsson, L.; Langvall, O.; Weslien, P.; Tuulik, J. Storms can cause Europe-wide reduction in forest carbon sink. Glob. Chang. Biol. 2009, 15, 346–355. [Google Scholar] [CrossRef]
  8. Brown, M.; Black, T.A.; Nesic, Z.; Foord, V.N.; Spittlehouse, D.L.; Fredeen, A.L.; Grant, N.J.; Burton, P.J.; Trofymow, J.A. Impact of mountain pine beetle on the net ecosystem production of lodgepole pine stands in British Columbia. Agric. For. Meteorol. 2010, 150, 254–264. [Google Scholar] [CrossRef]
  9. Moore, D.J.P.; Trahan, N.A.; Wilkes, P.; Quaife, T.; Stephens, B.B.; Elder, K.; Desai, A.R.; Negron, J.; Monson, R.K. Persistent reduced ecosystem respiration after insect disturbance in high elevation forests. Ecol. Lett. 2013, 16, 731–737. [Google Scholar] [CrossRef]
  10. Hicke, J.A.; Meddens, A.J.H.; Allen, C.D.; Kolden, C.A. Carbon stocks of trees killed by bark beetles and wildfire in the western United States. Environ. Res. Lett. 2013, 8, 035032. [Google Scholar] [CrossRef]
  11. Hansen, E.M.; Amacher, M.C.; Van Miegroet, H.; Long, J.N.; Ryan, M.G. Carbon dynamics in central US Rockies lodgepole pine type after mountain pine beetle outbreaks. For. Sci. 2015, 61, 665–679. [Google Scholar] [CrossRef]
  12. Reed, D.E.; Ewers, B.E.; Pendall, E. Impact of mountain pine beetle induced mortality on forest carbon and water fluxes. Environ. Res. Lett. 2014, 9, 105004. [Google Scholar] [CrossRef]
  13. Jonášová, M.; Prach, K. The influence of bark beetles outbreak vs. salvage logging on ground layer vegetation in Central European mountain spruce forests. Biol. Conserv. 2008, 141, 1525–1535. [Google Scholar] [CrossRef]
  14. Seidl, R.; Rammer, W.; Jäger, D.; Lexer, M.J. Impact of bark beetle (Ips typographus L.) disturbance on timber production and carbon sequestration in different management strategies under climate change. For. Ecol. Manag. 2008, 256, 209–220. [Google Scholar] [CrossRef]
  15. Jonášová, M.; Vávrová, E.; Cudlín, P. Western Carpathian mountain spruce forest after a windthrow: Natural regeneration in cleared and uncleared areas. For. Ecol. Manag. 2010, 259, 1127–1134. [Google Scholar] [CrossRef]
  16. Schlesinger, W.; Andrews, J. Soil Respiration and Global Carbon Cycle. Biogeochemistry 2000, 48, 7–20. [Google Scholar] [CrossRef]
  17. Janssens, I.A.; Lankreijer, H.; Matteucci, G.; Kowalski, A.S.; Buchmann, N.; Epron, D.; Pilegaard, K.; Kutsch, W.; Longdoz, B.; Grünwald, T.; et al. Productivity overshadows temperature in determining soil and ecosystem respiration across European forests. Glob. Chang. Biol. 2002, 7, 269–278. [Google Scholar] [CrossRef]
  18. Bhupinderpal-Singh; Nordgren, A.; Löfvenius Ottosson, M.; Högberg, M.N.; Mellander, P.E.; Högberg, P. Tree root and soil heterotrophic respiration as revealed by girdling of boreal Scots pine forest: Extending observations beyond the first year. Plant Cell Environ. 2003, 26, 1287–1296. [Google Scholar] [CrossRef]
  19. Högberg, P.; Bhupinderpal-Singh; Löfvenius, M.O.; Nordgren, A. Partitioning of soil respiration into its autotrophic and heterotrophic components by means of tree-girdling in old boreal spruce forest. For. Ecol. Manag. 2009, 257, 1764–1767. [Google Scholar]
  20. Sariyildiz, T.; Akkuzu, E.; Küçük, M.; Duman, A.; Aksu, Y. Effects of Ips typographus (L.) damage on litter quality and decomposition rates of oriental spruce [Picea orientalis (L.) Link.] in Hatila Valley National Park, Turkey. Eur. J. For. Res. 2008, 127, 429–440. [Google Scholar] [CrossRef]
  21. Kopáček, J.; Cudlín, P.; Fluksová, H.; Kaňa, J.; Picek, T.; Šantrůčková, H.; Svoboda, M.; Vaněk, D. Dynamics and composition of litterfall in an unmanaged Norway spruce (Picea abies) forest after bark-beetle outbreak. Boreal Environ. Res. 2015, 20, 305–323. [Google Scholar]
  22. Morehouse, K.; Johns, T.; Kaye, J.; Kaye, M. Carbon and nitrogen cycling immediately following bark beetle outbreaks in southwestern ponderosa pine forests. For. Ecol. Manag. 2008, 255, 2698–2708. [Google Scholar] [CrossRef]
  23. Mayer, M.; Matthews, B.; Schindlbacher, A.; Katzensteiner, K. Soil CO2 efflux from mountainous windthrow areas: Dynamics over 12 years post-disturbance. Biogeosciences 2014, 11, 6081–6093. [Google Scholar] [CrossRef]
  24. Štursová, M.; Šnajdr, J.; Cajthaml, T.; Bárta, J.; Šantrůčková, H.; Baldrian, P. When the forest dies: The response of forest soil fungi to a bark beetle-induced tree dieback. ISME J. 2014, 8, 1920–1931. [Google Scholar] [CrossRef]
  25. Mikkelson, K.M.; Brouillard, B.M.; Bokman, C.M.; Sharpa, J.O. Ecosystem resilience and limitations revealed by soil bacterial community dynamics in a bark beetle-impacted forest. MBio 2017, 8, 1–13. [Google Scholar] [CrossRef]
  26. Pec, G.J.; Karst, J.; Taylor, D.L.; Cigan, P.W.; Erbilgin, N.; Cooke, J.E.K.; Simard, S.W.; Cahill, J.F. Change in soil fungal community structure driven by a decline in ectomycorrhizal fungi following a mountain pine beetle (Dendroctonus ponderosae) outbreak. New Phytol. 2017, 213, 864–873. [Google Scholar] [CrossRef] [PubMed]
  27. Fischer, A.; Lindner, M.; Abs, C.; Lasch, P. Vegetation dynamics in central european forest ecosystems (near-natural as well as managed) after storm events. Folia Geobot. 2002, 37, 17–32. [Google Scholar] [CrossRef]
  28. Zhang, B.; Zhou, X.; Zhou, L.; Ju, R. A global synthesis of below-ground carbon responses to biotic disturbance: A meta-analysis. Glob. Ecol. Biogeogr. 2015, 24, 126–138. [Google Scholar] [CrossRef]
  29. Kobler, J.; Jandl, R.; Dirnböck, T.; Mirtl, M.; Schindlbacher, A. Effects of stand patchiness due to windthrow and bark beetle abatement measures on soil CO2 efflux and net ecosystem productivity of a managed temperate mountain forest. Eur. J. For. Res. 2015, 134, 683–692. [Google Scholar] [CrossRef]
  30. Köster, K.; Püttsepp, Ü.; Pumpanen, J. Comparison of soil CO2 flux between uncleared and cleared windthrow areas in Estonia and Latvia. For. Ecol. Manag. 2011, 262, 65–70. [Google Scholar] [CrossRef]
  31. Borkhuu, B.; Peckham, S.D.; Ewers, B.E.; Norton, U.; Pendall, E. Does soil respiration decline following bark beetle induced forest mortality? Evidence from a lodgepole pine forest. Agric. For. Meteorol. 2015, 214–215, 201–207. [Google Scholar] [CrossRef]
  32. Schelhaas, M.-J.; Nabuurs, G.-J.; Schuck, A. Natural disturbances in the European forests in the 19th and 20th centuries. Glob. Chang. Biol. 2003, 9, 1620–1633. [Google Scholar] [CrossRef]
  33. Jeger, M.; Bragard, C.; Caffier, D.; Candresse, T.; Chatzivassiliou, E.; Dehnen-Schmutz, K.; Gilioli, G.; Jaques Miret, J.A.; MacLeod, A.; Navajas Navarro, M.; et al. Pest categorisation of Ips amitinus. EFSA J. 2017, 15, 5038. [Google Scholar]
  34. Seidl, R.; Thom, D.; Kautz, M.; Martin-Benito, D.; Peltoniemi, M.; Vacchiano, G.; Wild, J.; Ascoli, D.; Petr, M.; Honkaniemi, J.; et al. Forest disturbances under climate change. Nat. Clim. Chang. 2017, 7, 395–402. [Google Scholar] [CrossRef] [PubMed]
  35. Seidl, R.; Schelhaas, M.J.; Lexer, M.J. Unraveling the drivers of intensifying forest disturbance regimes in Europe. Glob. Chang. Biol. 2011, 17, 2842–2852. [Google Scholar] [CrossRef]
  36. Ulanova, N.G. The effects of windthrow on forest at different spatial scales: A review. For. Ecol. Manag. 2000, 135, 155–167. [Google Scholar] [CrossRef]
  37. Pumpanen, J.; Westman, C.J.; Ilvesniemi, H. Soil CO2 efflux from a podzolic forest soil before and after forest clear-cutting and site preparation. Boreal Environ. Res. 2004, 9, 199–212. [Google Scholar]
  38. Müller, K.H.; Wagner, S. Fine root dynamics in gaps of Norway spruce stands in the German Ore Mountains. Forestry 2003, 76, 149–158. [Google Scholar] [CrossRef]
  39. Gray, A.N.; Spies, T.A.; Easter, M.J. Microclimatic and soil moisture responses to gap formation in coastal Douglas-fir forests. Can. J. For. Res. 2002, 32, 332–343. [Google Scholar] [CrossRef]
  40. Wermelinger, B. Ecology and management of the spruce bark beetle Ips typographus—A review of recent research. For. Ecol. Manag. 2004, 202, 67–82. [Google Scholar] [CrossRef]
  41. Eriksson, M.; Pouttu, A.; Roininen, H. The influence of windthrow area and timber characteristics on colonization of wind-felled spruces by Ips typographus (L.). For. Ecol. Manag. 2005, 216, 105–116. [Google Scholar] [CrossRef]
  42. Mikola, P. Application of vegetation science to forestry in Finland. In Handbook of Vegetation Science, Part 12; Jahn, G., Ed.; Dr W. Junk Publishers: The Hague, The Netherlands; Boston, MA, USA; London, UK, 1982; pp. 199–224. [Google Scholar]
  43. Pirinen, P.; Simola, H.; Aalto, J.; Kaukoranta, J.-P.; Karlsson, P.; Ruuhela, R. CLIMATOLOGICAL statistics of Finland 1981–2010; Reports 2012-1; Finnish Meteorological Institute: Helsinki, Finland, 2012. [Google Scholar]
  44. Finnish Meteorological Institute. Open Source Weather Observations. Available online: https://en.ilmatieteenlaitos.fi/download-observations#!/ (accessed on 19 October 2018).
  45. Hurlbert, S.H. Pseudoreplication and the Design of Ecological Field Experiments. Ecol. Monogr. 1984, 54, 187–211. [Google Scholar] [CrossRef]
  46. Blomqvist, M.; Kosunen, M.; Starr, M.; Kantola, T.; Holopainen, M.; Lyytikäinen-Saarenmaa, P. Modelling the predisposition of Norway spruce to Ips typographus L. infestation by means of environmental factors in southern Finland. Eur. J. For. Res. 2018, 137, 675–691. [Google Scholar] [CrossRef]
  47. Lyytikäinen-Saarenmaa, P.; (Department of Forest Sciences, University of Helsinki). Personal communication, 2014.
  48. Finnish Meteorological Institute. Annual Weather Statistics. Available online: https://ilmatieteenlaitos.fi/vuositilastot (accessed on 3 January 2019).
  49. Helmisaari, H.-S.; Derome, J.; Nojd, P.; Kukkola, M. Fine root biomass in relation to site and stand characteristics in Norway spruce and Scots pine stands. Tree Physiol. 2007, 27, 1493–1504. [Google Scholar] [CrossRef]
  50. Zehetgruber, B.; Kobler, J.; Dirnböck, T.; Jandl, R.; Seidl, R.; Schindlbacher, A. Intensive ground vegetation growth mitigates the carbon loss after forest disturbance. Plant Soil 2017, 420, 239–252. [Google Scholar] [CrossRef] [PubMed]
  51. Lloyd, J.; Taylor, J. On the Temperature Dependence of Soil Respiration. Funct. Ecol. 1994, 8, 315–323. [Google Scholar] [CrossRef]
  52. R Core Team. R: A Language and Environment for Statistical Computing; R Foundation for Statistical Computing: Vienna, Austria, 2018. [Google Scholar]
  53. Bates, D.; Maechler, M.; Bolker, B.; Walker, S. Fitting Linear Mixed-Effects Models Using lme4. J. Stat. Softw. 2015, 67, 1–48. [Google Scholar] [CrossRef]
  54. Fox, J.; Weisberg, S. An {R} Companion to Applied Regression, 2nd ed.; Sage: Thousand Oaks, CA, USA, 2011. [Google Scholar]
  55. Lenth, R. Emmeans: Estimated Marginal Means, aka Least-Squares Means; R Core Team: Vienna, Austria, 2018. [Google Scholar]
  56. Seidl, R.; Blennow, K. Pervasive Growth Reduction in Norway Spruce Forests following Wind Disturbance. PLoS ONE 2012, 3, e33301. [Google Scholar] [CrossRef]
  57. Högberg, M.N.; Högberg, P.; Högberg, M.N. Extramatrical ectomycorrhizal mycelium contributes one-third of microbial biomass and produces, together with associated roots, half the dissolved organic carbon in a forest soil. New Phytol. 2002, 791–795. [Google Scholar] [CrossRef]
  58. Lõhmus, K.; Ivask, M. Decomposition and nitrogen dynamics of fine roots of Norway spruce (Picea abies (L.) Karst.) at different sites. Plant Soil 1995, 168, 89–94. [Google Scholar] [CrossRef]
  59. Hyvonen, R.; Olsson, B.A.; Lundkvist, H.; Staaf, H. Decomposition and nutrient release from Picea abies (L.) Karst. and Pinus sylvestris L. logging residues. For. Ecol. Manag. 2000, 126, 97–112. [Google Scholar] [CrossRef]
Figure 1. Locations of study plots in Paajasensalo (a) where plots established in 2015 are on the left and plots established in 2016 are on the right, and Viitalampi (b) where plots established in 2015 are on the right and plots established in 2016 are on the left. LT = living tree plot (green squares), SF = storm-felled tree plot (light brown triangles), and ID = tree killed by I. typographus plot (red pentagons). Created using ArcGIS (ESRI, Redlands, CA, USA).
Forests 10 00307 g001
Figure 2. Soil surface respiration chamber darkened with aluminum foil and containing the CARBOCAP® GMP343 CO2 probe and a data logger on the ground in front. The measurement point is one of the trenched measurement points. Photo: Maiju Kosunen.
Forests 10 00307 g002
Figure 3. Monthly means and standard deviations for soil surface total respiration (a,b), soil temperature (c,d), and soil moisture (e,f) of each treatment in Paajasensalo (left) and Viitalampi (right). Values are based on measurements from the intact collars on plots established in 2015, i.e., the data set is consistent throughout 2015–2017. LT = living trees, SFd = storm dead tree detritus, SFo = storm open-vegetated, and ID = trees killed by I. typographus.
Forests 10 00307 g003
Figure 4. Means of autotrophic (SRa) and heterotrophic (SRh) soil surface respiration, based on the measurements in May–Sept 2017, of each treatment (one weekly mean value per treatment) in plots established in 2015 for (a) Paajasensalo and (b) Viitalampi. LT = living trees, SFd = storm dead tree detritus, SFo = storm open-vegetated, ID = trees killed by I. typographus.
Forests 10 00307 g004
Table 1. Study plot disturbance and stand characteristics (mean ± standard deviation). Abbreviations: Year = year of plot establishment, dbh = tree diameter at breast height, Stems/ha = number of trees per hectare, Basal area = basal area of trees, Species (%) = percentage of basal area of certain tree species from all measured trees on plot, Sp = spruce, Pi = pine, De = deciduous, PS = Paajasensalo, VL = Viitalampi, LT = living trees, ID = trees killed by I. typographus, SF = storm-felled trees, MT = medium-rich Myrtillus type, OMT = Oxalis-Myrtillus type.
Basal Area (m2/ha)Species (%)
SiteYearPlot TypeSite Typedbh (cm)Stems/haLiving DeadTotalSpPiDe
PS2015LTMT21 ± 8135042.2 ± 0.69.3 ± 1.451.5 ± 0.8652213
PS2015SFMT22 ± 792513.6 ± 0.724.6 ± 0.638.2 ± 0.781145
PS2015IDOMT25 ± 86255.5 ± 1.227.4 ± 0.733.0 ± 0.89604
PS2016LTMT20 ± 1092534.3 ± 0.80.9 ± 0.235.2 ± 0.889011
PS2016SFMT17 ± 7172510.6 ± 0.336.8 ± 0.747.4 ± 0.688012
PS2016IDMT15 ± 715252.3 ± 0.329.3 ± 0.531.7 ± 0.510000
VL2015LTMT21 ± 797535.9 ± 0.40.4 ± 0.036.3 ± 0.59703
VL2015SFMT25 ± 36000 ± 0.028.6 ± 0.328.6 ± 0.310000
VL2015IDMT24 ± 46509.8 ± 0.420.1 ± 0.330.0 ± 0.310000
VL2016LTMT20 ± 10127539.8 ± 0.89.5 ± 1.049.2 ± 0.945451
VL2016SFMT19 ± 98000.7 ± 0.126 ± 0.826.7 ± 0.863038
VL2016IDOMT19 ± 9180022.8 ± 0.739.7 ± 0.762.5 ± 0.79604
Table 2. Treatment mean total soil surface respiration (SRtot) and soil-temperature-adjusted soil surface total respiration values (SRtot_ST adj.), soil temperature (ST) and soil moisture (SM; non-trenched collars 2015–2017 data only), and heterotrophic soil respiration (SRh) and soil-temperature-adjusted heterotrophic soil respiration (SRtot_STadj; 2017 data from trenched collars only) for the Paajasensalo and Viitalampi study sites. Values are linear mixed-effects model adjusted means. Treatment means followed by the same subscript letter are not significantly different (p = 0.05; Scheffe’s post hoc tests). LT = living trees, SFd = storm damaged, tree detritus, SFo = storm damaged, open-vegetated, ID = trees killed by I. typographus.
LT SFd SFo ID
Paajasensalo
SRtot (mg CO2 m−2 s−1)0.28a0.23ab0.18b0.22ab
SRtot_STadj. (mg CO2 m−2 s−1)0.24a0.22ab0.17b0.20ab
ST (°C)10.7a10.2b10.2b10.5ab
SM (% vol/vol)13.3a18.3b22.8bc26.0c
SRh (mg CO2 m2 s1)0.14a0.13ab0.10b0.12ab
SRh_STadj. (mg CO2 m−2 s−1)0.15a0.15a0.12a0.13a
Viitalampi
SRtot (mg CO2 m−2 s−1)0.22a0.18a0.21a0.20a
SRtot_STadj. (mg CO2 m−2 s−1)0.20a0.17a0.19a0.17a
ST (°C)10.5a10.3a10.6a11.0b
SM (% vol/vol)20.1a26.1a26.3a26.3a
SRh (mg CO2 m2 s1)0.11a0.14a0.12a0.11a
SRh_STadj. (mg CO2 m−2 s−1)0.12a0.15a0.12a0.11a
Table 3. Spearman’s correlation coefficients between various plot mean soil surface respiration and soil temperature, soil moisture, and stand basal area. BAL = living, BAD = dead, and BAtot = all trees, ST = soil temperature, SM = soil moisture, SRtot = soil surface total respiration, SRtot_STadj. = temperature-adjusted soil surface total respiration (Aug–Oct 2016 and May–Oct 2017 data, n = 16). SRa = autotrophic respiration, SRh = measured, and SRh_STadj. = soil-temperature-adjusted heterotrophic respiration (May–Oct 2017 data, n = 8).
BALBADBAtotSTSM
SRtot0.55 *−0.410.400.54 *−0.67 **
SRtot_STadj.0.43−0.360.31-−0.69 **
SRa0.14−0.120.17--
SRh0.020.170.12−0.29−0.83 *
SRh_STadj.0.160.130.33-−0.88 **
ST0.17−0.18−0.01-−0.13
SM−0.56 *0.25−0.59 **−0.13-
* = p < 0.05 and ** = p < 0.01.

