Article

Forest Soil Profile Inversion and Mixing Change the Vertical Stratification of Soil CO2 Concentration without Altering Soil Surface CO2 Flux

1
Guangdong Key Laboratory of Animal Conservation and Resource Utilization, Guangdong Public Laboratory of Wild Animal Conservation and Utilization, Guangdong Institute of Applied Biological Resources, Guangzhou 510260, China
2
Key Laboratory of Vegetation Restoration and Management of Degraded Ecosystems, South China Botanical Garden, Chinese Academy of Sciences, Guangzhou 510650, China
3
Key Laboratory of Geospatial Technology for the Middle and Lower Yellow River Regions (Henan University), Ministry of Education, College of Environment and Planning, Henan University, Kaifeng 475004, China
4
Department of Environmental Sciences, College of Natural Sciences, University of Puerto Rico, P.O. Box 70377, San Juan, PR 00936-8377, USA
*
Author to whom correspondence should be addressed.
Forests 2019, 10(2), 192; https://doi.org/10.3390/f10020192
Submission received: 28 December 2018 / Revised: 15 February 2019 / Accepted: 19 February 2019 / Published: 21 February 2019

Abstract

:
In order to gain more detailed knowledge of the CO2 concentration gradient in forest soil profiles and to better understand the factors that control CO2 concentration along forest soil profiles, we examined the soil surface CO2 flux, soil properties and soil profile CO2 concentration in upright (CK), inverted and mixed soil columns with a depth of 60 cm in two subtropical forests in China from May 2008 to December 2009. The results showed that: (1) The SOC (soil organic carbon), TN (total N) and microbial biomass were higher in the deeper layers in the inverted soil column, which was consistent with an increase in CO2 concentration in the deeper soil layer. Furthermore, the biogeochemical properties were homogenous among soil layers in the mixed soil column. (2) CO2 concentration in the soil profile increased with depth in CK while soil column inversion significantly intensified this vertical stratification as the most active layer (surface soil) was now at the bottom. The stratification of CO2 concentration along the soil profile in the mixed soil column was similar to that in CK but it was not intensified after soil was mixed. (3) The soil surface CO2 flux did not significantly change after the soil column was inverted. The surface CO2 flux rate of the mixed soil column was higher compared to that of the inverted soil column but was not significantly different from CK. Our results indicated that the profile soil CO2 production was jointly controlled by soil properties related to CO2 production (e.g., SOC content and soil microbial biomass) and those related to gas diffusion (e.g., soil bulk density and gas molecular weight), but the soil surface CO2 flux was mainly determined by soil surface temperature and may be affected by the intensity of soil disturbance.

1. Introduction

An increase in atmospheric CO2 concentration is considered to be one of the main causes for global warming [1,2]. As the largest terrestrial source and potential sink for CO2, soil is particularly important in the global carbon cycle [3,4,5,6,7]. All CO2 produced in the soil would be emitted through soil surface efflux on a long-term basis [8]. The soil profile CO2 concentration was reported to drive and accelerate this surface emission process [9] and therefore, this would influence the carbon balance of the forest. Some models estimated the soil CO2 effluxes from the soil CO2 concentration profiles [10,11,12]. Thus, we need to gain more detailed knowledge of the soil profile CO2 concentration in order to better assess its contribution to soil surface CO2 emission and global warming.
The majority of the forest soil CO2 is produced in the surface layer since the majority of SOM (soil organic matter) and roots are distributed in the surface soil. However, the soil profile CO2 concentration is high in the deep soil layer and low in the surface soil, which is the opposite to the production source layer [13]. Microbial biomass acts as both a source and sink for nutrients and participates in C, N and P transformation. Although it contributes less than 5% to SOM, it plays an active role in the soil C cycle [14]. The soil profile CO2 concentration depends on both the processes of CO2 production and diffusion. Studies have shown that soil CO2 production and diffusion often has a strong and remarkable dependence on temperature and moisture [15,16,17]. It was also affected by soil properties, such as soil organic matter, total N (TN) and bulk density, root dynamics and microbial biomass [18,19]. However, there were limited studies focused on the relationship between the variation of soil properties and soil CO2 concentration.
Agricultural practice, such as tillage, plays an important role in the storage and release of C within the terrestrial C cycle. The conventional intensive tillage was found to increase the emission of CO2 by 16.0% in a subtropical rice farm [20]. Significantly greater CO2 fluxes were also observed in subtropical paddy ecosystems after tillage operations [21]. Tillage disturbance does not occur as frequently as croplands in forests but during the process of restoring damaged ecosystems, tree planting and occasionally tillage are usual practices. Consequently, soil mixing is inevitable during ploughing.
In the present study, we manipulated a soil column experiment with upright, inverted and mixed soil columns in order to investigate the soil surface CO2 flux, the distribution of CO2 concentration in soil profiles and their influencing factors. The field site was a forest restoration ecosystem. We mixed the soil in “mixed” columns to identify the influence of “tillage” disturbance on soil CO2. The purpose of our study was to examine the dependence of soil profile CO2 concentration on soil properties in order to better understand the mechanism of the vertical stratification of soil profile CO2 concentration and the relationship of soil profile CO2 with soil surface CO2 flux.

2. Materials and Methods

2.1. Study Area

The study was conducted over a 20-month period (from May 2008 to December 2009) in two subtropical plantation forests at the Heshan Hilly Land Interdisciplinary Experimental Station (112°50′ E, 22°34′ N), Guangdong Province, China. These selected forests included a coniferous forest (CF) mixed by Pinus massoniana lamb, Cunninghamia lanceolata (lamb) Hook and a broad-leaved forest (BF) dominated by Schima wallichii Choisy. The soil of the field site was an Orthic Acrisol [22] and the surface soil pH was about 4.0. The soil SOC (soil organic carbon) was 13.08 and 19.26 g kg−1 while the TN was 0.99 and 1.11 g kg−1 in CF and BF, respectively. The trees were about 25 years old when the current experiment started in 2008.

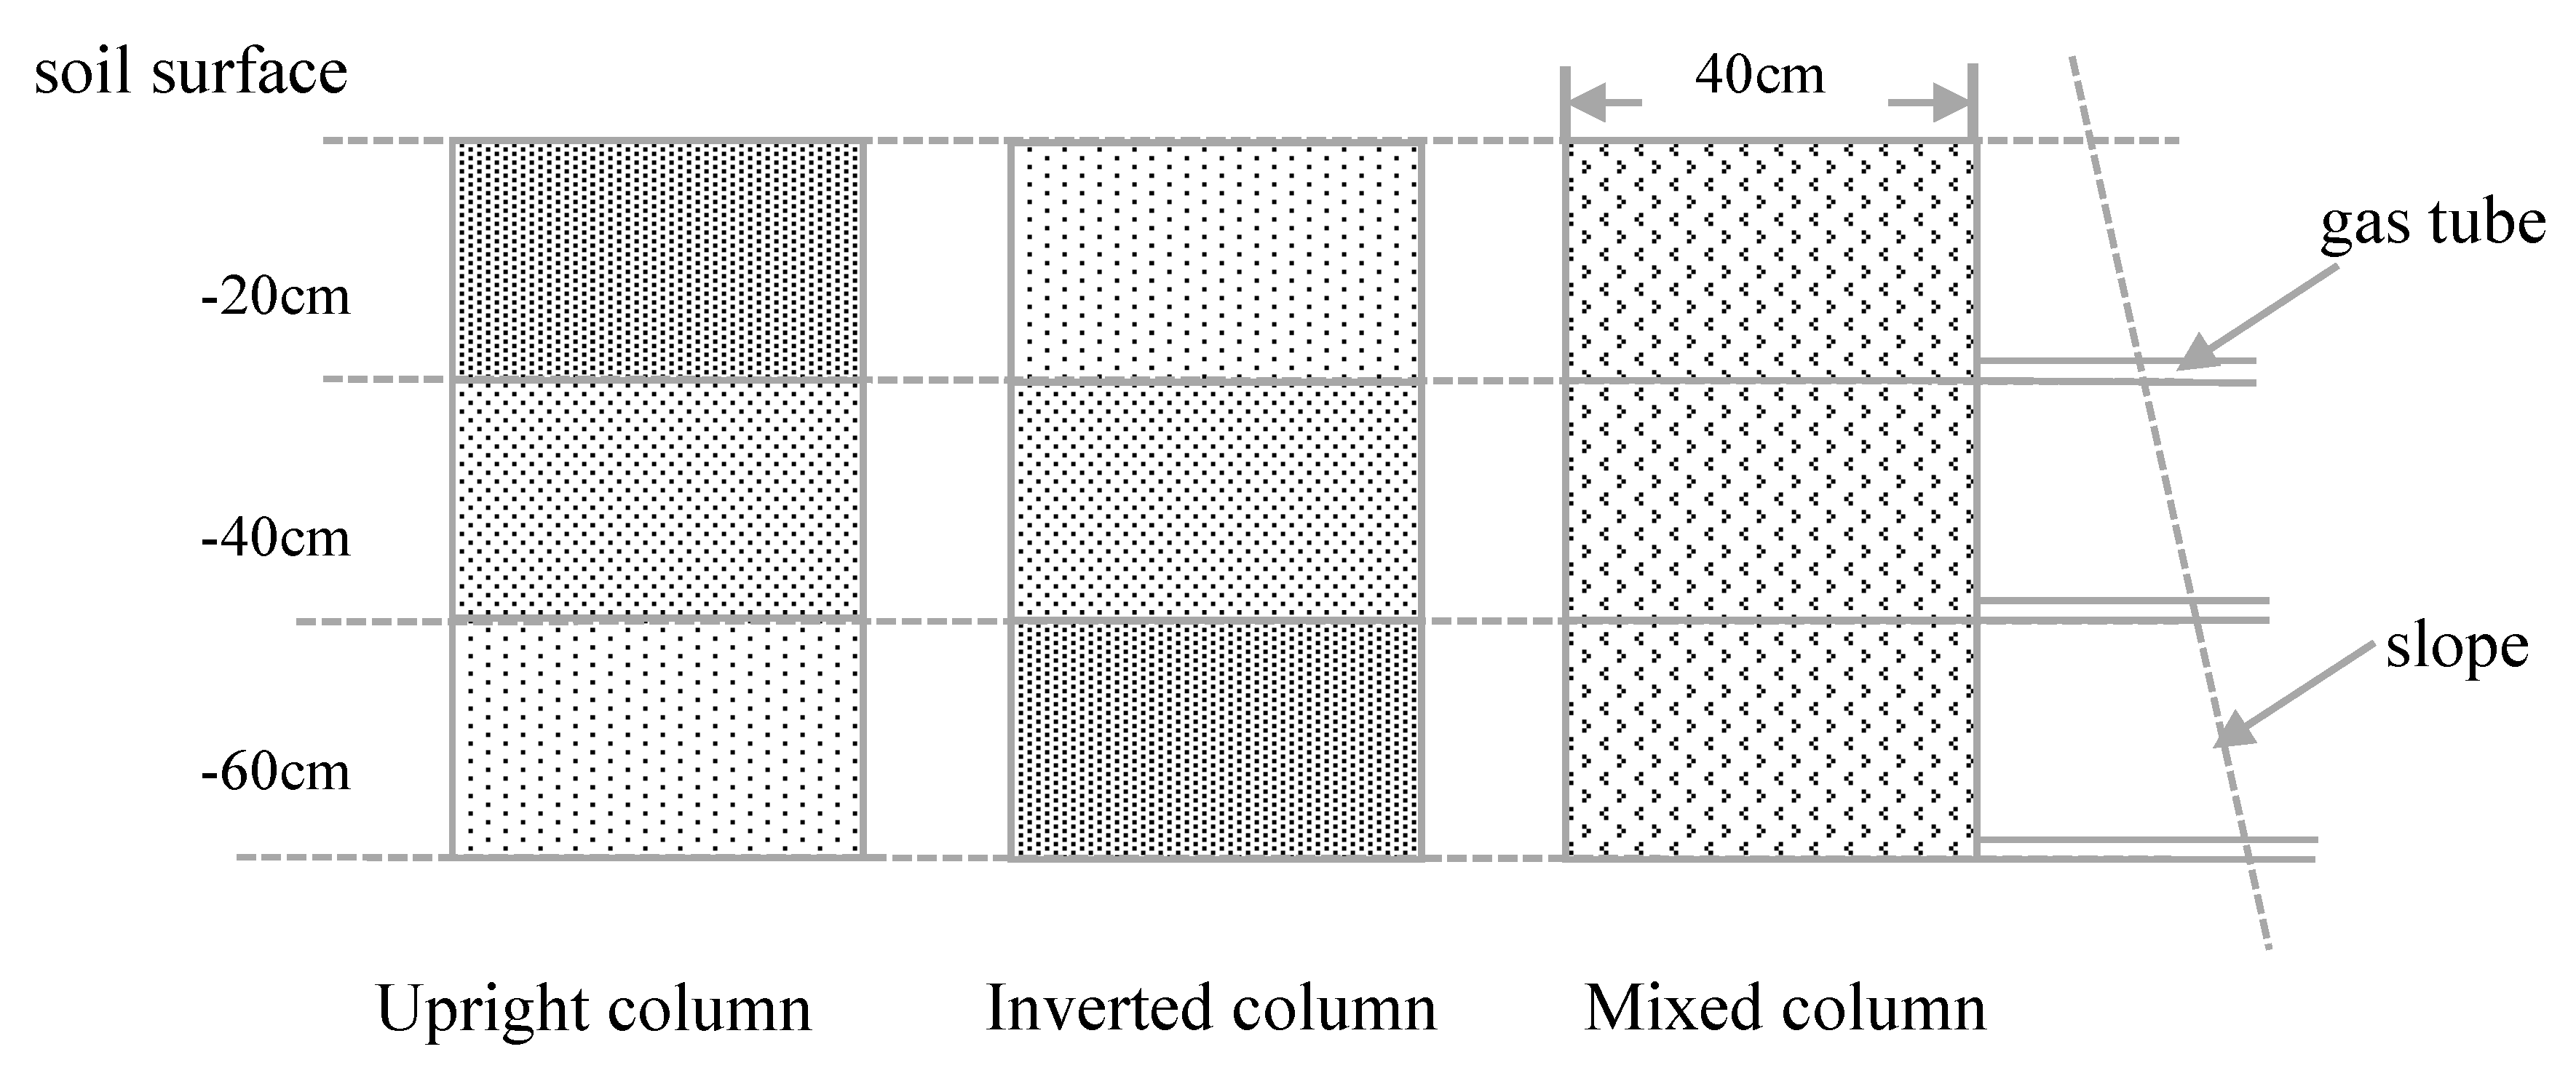
2.2. Experimental Design and Sample Analysis

A randomized block design with six replicates for each treatment was used in the soil column manipulation experiment. The soil column treatments were: (1) Upright soil column (CK); (2) inverted soil column (Inverted); and (3) mixed soil column (Mixed). The soil pillar was carefully dug and sheathed in the PVC (polyvinyl chloride) pipe to make a soil column cylinder. Each soil column had a diameter of 40 cm and a depth of 60 cm. In the upright and inverted soil columns, the soil pillar was undisturbed but in the mixed soil column, the topsoil and subsoil were thoroughly mixed. All soil columns were sealed at the bottom and placed back into the original location where the soil column was manipulated. Each soil column was equipped with gas tubes and three-way stopcocks at depths of 20, 40 and 60 cm to sample soil CO2 while a water tube was added at the bottom to sample the dissolved soil organic carbon and to avoid waterlog (Figure A1). Several holes with a diameter of 2 cm were made onto the wall of the PVC pipe to allow for the free exchange of soil air. All vegetation and litter fall were removed carefully from the soil surface of each soil column and were not present during the experiment period, which was achieved without disturbing the soil. All these manipulations were completed in May 2008.
We measured the soil surface CO2 flux for each column once per month with the static chamber-gas chromatograph (GC) technique [23] from May 2008 to December 2009. PVC chamber with a diameter of 20 cm and a height of 20 cm was gently inserted 2 cm below the soil. Gas samples were collected four times at 10 min intervals from each soil column with 60 mL polypropylene syringes. Measurements were always made between 09:00 and 11:00 as suggested by Xu and Qi to represent the diurnal averages [19,24,25]. Soil CO2 concentrations at depths of 20, 40 and 60 cm were sampled after the surface measurements and were determined using GC within 24 h. The soil temperature at depths of 5, 20, 40 and 60 cm was recorded every 0.5 h with an iButton DS1923 digital thermometer equipped in the soil column.
Gas flux was calculated based on the soil surface gas concentration change within the chamber over the measurement period, which was estimated as the slope of linear regression between concentration and time. It was expressed in the following equation [26]:
F = Δ m Δ t · D V A = h D Δ m Δ t
where F is the gas flux (mg m−2 h−1); h is the height of the chamber (m); D is the gas density in the chamber (D = n/v = P/RT, in mg m−3 where P is the air pressure; T is the temperature inside of the chamber and R is the air constant; m/t denotes the linear slope of concentration changing with time over the measurement period.
The soil along the profiles was sampled in May and November both in 2008 and 2009. All soil samples were sieved with a 2 mm sieve before analysis. Soil water content (SWC) was measured by oven-drying for 48 h at 105 °C; SOC was determined by the dichromate oxidation method; soil TN was estimated by Kjeldahl digestion with UV spectrophotometric analysis [27]; and soil bulk density was determined by the intact soil core method. The soil microbial biomass and community structure was analyzed using the phospholipid fatty acids (PLFAs) method as described by Bossio and Scow [28]. Different PLFAs were considered to represent different groups of soil microorganisms. The abundance of individual fatty acids was calculated based on the 19:0 internal standard concentrations. Bacteria were identified by 10 PLFAs (i15:0, a15:0, 15:0, i16:0, 16: 1ω7, i17:0, a17:0, 17:0, cy17:0 and cy19:0) while 18:2ω6c and 18:1ω9c were used as the indicators of fungal biomass [29]. The ratio of fungal PLFAs to bacterial PLFAs was used to estimate the ratio of fungal to bacterial biomass (F/B) in soil [30]. The results of soil properties were the average of four measurements.

2.3. Statistical Analysis

A repeated measures analysis of variance (RM ANOVA) was performed to examine the monthly changes in CO2 concentration and the soil surface CO2 flux. Two-way ANOVA and LSD (least significant difference) tests were performed to compare the physicochemical and microbial traits among forest types and soil treatments. All statistics were performed using IBM SPSS Statistics 21 (IBM Corporation, New York, NY, USA) and SigmaPlot 12.5 (Systat Software Inc., San Jose, CA, USA).

3. Results

3.1. Precipitation and Air Temperature

The annual precipitation of the site was 1319.6 mm and 1525.6 mm while the average temperature was 21.60 °C and 22.49 °C in 2008 and 2009, respectively. The precipitation from May to September (high temperature period, monthly mean temperature >25 °C) in 2008 was 922.60 mm, which was significantly less than that in the same period in 2009 (1148.20 mm). The mean air temperature was 26.95 °C in this period in 2008, which was lower by 0.62 °C compared to 2009 (Figure A2). The mean soil temperature at a depth of 5 cm was 24.73 °C in CF in the study period, which was higher by 1.29 °C compared to BF.

3.2. Variation of Soil Profile CO2 Concentration

Large variations of CO2 concentration in soil profiles were observed both throughout time and with different depths in all treatments (Figure 1a–f). In general, the CO2 concentration increased with depth, with the highest concentrations observed at a depth of 60 cm. CO2 concentrations in soil profiles were quite different between the two years, with the peak accumulation having occurred in the high temperature period of the second year. The CO2 concentration in the BF soil was higher than that in the CF soil.
The average CO2 concentration in CF at a depth of 60 cm was 1.1 × 10⁴ μL·L−1, which was 39% higher than that in 20 cm. The CO2 concentration in the inverted soil column at a depth of 60 cm reached 3.2 × 10⁴ μL·L−1, which was about 4.8 times that of the 20 cm. In other words, the vertical stratification of CO2 concentration in the soil profile was intensified in the inverted soil column compared to CK. In the mixed soil columns, the CO2 concentration in each layer was lower than CK. Similar patterns were observed in BF, which showed that the inverted soil column intensified the stratification of CO2 concentrations in soil profiles, while CO2 concentrations in the “Mixed” soil column were lower than CK despite still maintaining its stratification.

3.3. Seasonal Variation of Soil Surface CO2 Flux

Soil surface CO2 flux rates varied significantly during the study period, with higher CO2 flux rates observed during the summer both in BF and CF (Figure 2a,b). The repeated measures analyses of variance indicated a significant interaction between months and treatments (p < 0.001). The average soil surface CO2 flux rates in CF were 185.69, 155.70 and 201.81 mg m−2 h−1 for the CK, inverted and mixed soil columns, respectively. In BF, the rates were 183.42, 159.95 and 197.70 mg m−2 h−1, respectively. The soil surface CO2 flux rates of the inverted soil column were 13%–16% lower than CK while that of the “mixed” soil column were somewhat higher although these differences were not significant. However, soil surface CO2 flux rates of the “mixed” soil column was significantly higher than that in the inverted soil column in BF (p < 0.05). Soil surface CO2 flux rates from CF did not significantly differ from the rates measured in BF.

3.4. Soil Biogeochemical Properties in Different Columns

The SOC (at a depth of 0–20 cm) was significantly higher in the BF soil than in the CF soil (p < 0.05, Table 1). SWC, TN and bulk density did not differ between the two forests. In the upright soil column, the SOC and TN in the topsoil were significantly higher than in the subsoil (p < 0.05) while the soil bulk density was higher in the subsoil. Naturally, the opposite pattern was observed in the inverted soil column, which showed that SOC and TN were higher in “new subsoil” but soil bulk density was higher in the “new topsoil”. In the mixed soil column, all measured soil properties did not differ significantly among the three soil layers.
In the upright soil columns, the mean total soil microbial biomass (PLFA), fungal biomass, bacterial biomass and F/B ratio all decreased with depth both in CF and BF soil (Table 2). In the inverted soil column, bacterial biomass was higher in the “new subsoil” while fungal biomass was higher in the “new topsoil”. In the mixed soil column, the biogeochemical properties were homogenous among different soil layers.

3.5. Correlations of Soil CO2 Concentration and Temperature

The dependence of soil CO2 concentration on temperature was strong and consistent in two forests in the CK and mixed soil columns (Figure 3a–f). The relationship was well fit by an exponential growth regression model (p < 0.001). The temperature explained 26%–76% of the variation in soil CO2 concentration in the upright and mixed soil columns. In the inverted soil columns, this dependence was significantly weaker.

4. Discussion

4.1. Effects of Environment Variables on CO2 Concentration in Soil Profiles and Soil Surface CO2 Flux

In general, the soil CO2 concentration was greater in the deeper soil layer regardless of the way that the soil columns were manipulated in the present study. We considered that this was mainly due to the difficulty of CO2 diffusion within the soil profile to the atmosphere [15]. Studies have demonstrated that the molecular diffusion trait is the most important factor affecting CO2 transportation within the soil profile. Furthermore, this was strongly dependent on soil porosity, which was closely related to soil moisture [9]. Rainfall could lead to an increase in soil moisture and a decrease in CO2 diffusivity, which would subsequently result in CO2 accumulation in soil and increase the CO2 concentration in deep soil [16]. Our data also showed that CO2 concentration in soil profiles increased with the seasonal temperature rise, which was probably due to an increase in soil microbial respiration with increasing temperature. This suggests that temperature is also a major factor that influences CO2 concentration along the soil profile. The summer of 2009 was relatively hotter and wetter than the summer of 2008 during the study period, which resulted in a significantly higher CO2 concentration in the summer of 2009 thus, verifying that temperature and moisture are major factors determining soil CO2 concentration.

4.2. Soil Properties and Soil CO2 Concentration Stratification

The inverted soil column was found to intensify the stratification of CO2 concentration due to the replacement of the subsoil with the original topsoil. In this case, the SOC, TN and microbial biomass were higher in the deeper layer in the inverted soil column, which was consistent with an increase in CO2 concentration in the deeper soil layer. SOC and TN provide energy and nutrients for microbial growth and thus, the CO2 in the soil profiles mainly resulted from microbial activity. In addition, the higher soil bulk density in the “new topsoil” in the inverted soil column would have a negative effect on CO2 emission from the soil since CO2 diffusion within the soil profile depends on soil porosity, which is tied closely with soil bulk density.
As we observed, soil organic carbon, total nitrogen and microbial biomass were often higher in original topsoil and they coincided with higher CO2 production. However, the soil CO2 concentration was generally higher in the deeper soil layer. Furthermore, soil properties in the mixed soil columns did not differ significantly among soil layers but the CO2 concentration along the soil profile showed a clear stratification. These results indicated that although CO2 concentration was highly influenced by soil properties, it was the gravity that determined the vertical distribution of soil CO2 concentration since the molecular weight of CO2 is greater than air.

4.3. CO2 Profile Concentration and its Relationship to Soil Surface CO2 Flux

The surface CO2 flux rates of the mixed soil column were 8%–9% higher than those in CK although these were not statistically significantly. This was much less than those in the croplands under conventional tillage [20,21]. Soil profile CO2 is transported into the atmosphere primarily by diffusion and air turbulence at the forest soil surface, which could significantly impact the carbon balance of the forest ecosystem [31,32]. These important processes often occurred near the soil surface but had little effect on the subsoil CO2 storage. Wiaux et al. [10] observed that approximately 90%–95% of the surface CO2 fluxes originated from the top 10 cm of the soil profile. On one hand, the upward movement of CO2 is a slow process limited by soil surface texture and turbulence. On the other hand, CO2 has the tendency to sink down along the soil profile as the molecular weight of CO2 is heavier than the average molecular weight of air [13].
In the present study, it is important to note that soil column inversion significantly intensified the vertical stratification of soil profile CO2 concentration. However, this did not intensify soil surface CO2 flux rate, which was even lower compared to CK. In contrast, soil column mixing increased the soil surface CO2 flux to some extent (although this was not statistically significant). C content in BF in the topsoil was 32% more than that in CF, while the soil surface CO2 flux rates from BF were not significantly different from those in CF. These results suggested that CO2 production was stimulated by the increased CO2 production sources (SOC, TN and microbial communities) while surface soil CO2 exchange could be altered by changing the soil texture (i.e., soil bulk density) and soil surface temperature (mean soil temperature at a depth of 5 cm was 1.29 °C higher in CF than in BF).

5. Conclusions

The soil profile CO2 concentration appeared to be strongly affected by environmental factors (temperature and precipitation) and soil properties (SOC, TN, soil bulk density and microbial communities) in the current study. The surface CO2 fluxes rates remained relatively stable when the CO2 concentration in soil profile was increased to a significant extent. These results increased our understanding of the factors influencing CO2 concentration in forest soil profile and the relationship of soil profile CO2 with soil surface CO2 flux. We concluded that the interaction of soil properties and environmental factors controlled the CO2 production in the soil profile, but the soil surface CO2 emission could be affected by the intensity of the disturbance or soil temperature variation. Although all CO2 produced in the soil would be eventually emitted to the atmosphere through soil surface efflux on a long-term basis, CO2 stored in the subsoil may be relatively stable in the deeper soil layers.

Author Contributions

Data curation, X.W. and Q.T.; formal analysis, X.W.; funding acquisition, J.L. and H.X.; investigation, X.W., Y.L. and Q.T.; project administration, S.F. and L.Z.; supervision, S.F.; writing—original draft, X.W.; writing—review and editing, X.Z. and W.Z.

Funding

This research was funded by the National Natural Science Foundation of China, grant numbers 41501268 and 30771704; and GDAS’ Project of Science and Technology Development, grant number 2019GDASYL-0103060 and 2018GDASCX-0107.

Acknowledgments

We thank Dima Chen for advice on the content and Xingquan Rao and Heshan Station for providing meteorological data. We thank Yanmei Xiong for improving the English of this manuscript. We are grateful to the editors and the three anonymous reviewers for helpful comments on the manuscript.

Conflicts of Interest

The authors declare no conflicts of interest.

Appendix A

Figure A1. Diagram depicting soil column manipulation for field measurements of CO2.
Forests 10 00192 g0a1
Figure A2. Precipitation and air temperature in Heshan station during the study period.
Forests 10 00192 g0a2

References

  1. Houghton, J.T.; Meira-Filho, L.G.; Callander, B.A.; Harris, N. Climate Change 1995: The Science of Climate Change; Kathenberg, N., Maskell, K., Eds.; Cambridge University Press: New York, NY, USA, 1996. [Google Scholar]
  2. Stocker, T.F.; Qin, D.; Plattner, G.K.; Tignor, M.; Allen, S.K.; Boschung, J.; Nauels, A.; Xia, Y. Climate Change: The Physical Science Basis; Bex, V., Midgley, P.M., Eds.; Cambridge University Press: New York, NY, USA, 2013. [Google Scholar]
  3. Grüning, M.M.; Germeshausen, F.; Thies, C.; L.-M.-Arnold, A. Increased forest soil CO2 and N2O emissions during insect infestation. Forests 2018, 9, 612. [Google Scholar] [CrossRef]
  4. Lee, S.; Yim, J.; Son, Y.; Son, Y.; Kim, R. Estimation of forest carbon stocks for national greenhouse gas inventory reporting in south Korea. Forests 2018, 9, 625. [Google Scholar] [CrossRef]
  5. Schlesinger, W.H.; Andrews, J.A. Soil respiration and the global carbon cycle. Biogeochemistry 2000, 48, 7–20. [Google Scholar] [CrossRef]
  6. Valentini, R.; Matteucci, G.; Dolman, A.J.; Schulze, E.D.; Rebmann, C.; Moors, E.J.; Granier, A.; Gross, P.; Jensen, N.O.; Pilegaard, K.; et al. Respiration as the main determinant of carbon balance in European forests. Nature 2000, 404, 861–865. [Google Scholar] [CrossRef] [PubMed]
  7. Raich, J.W.; Schlesinger, W.H. The global carbon-dioxide flux in soil respiration and its relationship to vegetation and climate. Tellus B 1992, 44, 81–99. [Google Scholar] [CrossRef]
  8. Maier, M.; Schack-Kirchner, H.; Hildebrand, E.E.; Schindler, D. Soil CO2 efflux vs. soil respiration: Implications for flux models. Agric. For. Meteorol. 2011, 151, 1723–1730. [Google Scholar] [CrossRef]
  9. Pihlatie, M.; Pumpanen, J.; Rinne, J.; Ilvesniemi, H.; Simojoki, A.; Hari, P.; Vesala, T. Gas concentration driven fluxes of nitrous oxide and carbon dioxide in boreal forest soil. Tellus B 2007, 59, 458–469. [Google Scholar] [CrossRef] [Green Version]
  10. Wiaux, F.; Vanclooster, M.; Van-Oost, K. Vertical partitioning and controlling factors of gradient-based soil carbon dioxide fluxes in two contrasted soil profiles along a loamy hillslope. Biogeosciences 2015, 12, 4637–4649. [Google Scholar] [CrossRef] [Green Version]
  11. Tang, J.W.; Baldocchi, D.D.; Qi, Y.; Xu, L.K. Assessing soil CO2 efflux using continuous measurements of CO2 profiles in soils with small solid-state sensors. Agric. For. Meteorol. 2003, 118, 207–220. [Google Scholar] [CrossRef]
  12. Maier, M.; Schack-Kirchner, H. Reply to comment on “Using the gradient method to determine soil gas flux: A review”. Agric. For. Meteorol. 2014, 197, 256–257. [Google Scholar] [CrossRef]
  13. Luo, Y.Q.; Zhou, X.H. Processes of CO2 transport from soil to the atmosphere. In Soil Respiration and the Environment; Elsevier Inc.: Amsterdam, The Netherlands, 2006; pp. 61–76. [Google Scholar]
  14. Hopkins, D.W.; Sparrow, A.D.; Shillam, L.L.; English, L.C.; Dennis, P.G.; Novis, P. Enzymatic activities and microbial communities in an antarctic dry valley soil: Responses to c and n supplementation. Soil Biol. Biochem. 2008, 40, 2130–2136. [Google Scholar] [CrossRef]
  15. Risk, D.; Kellman, L.; Beltrami, H. Carbon dioxide in soil profiles: Production and temperature dependence. Geophys. Res. Lett. 2002, 29, 111–114. [Google Scholar] [CrossRef]
  16. Jassal, R.; Black, A.; Novak, M.; Morgenstern, K.; Nesic, Z.; Gaumont-Guay, D. Relationship between soil CO2 concentrations and forest-floor CO2 effluxes. Agric. For. Meteorol. 2005, 130, 176–192. [Google Scholar] [CrossRef]
  17. Albanito, F.; Saunders, M.; Jones, M.B. Automated diffusion chambers to monitor diurnal and seasonal dynamics of the soil CO2 concentration profile. Eur. J. Soil Sci. 2009, 60, 507–514. [Google Scholar] [CrossRef]
  18. Billings, S.A.; Richter, D.D.; Yarie, J. Soil carbon dioxide fluxes and profile concentrations in two boreal forests. Can. J. For. Res. 1998, 28, 1773–1783. [Google Scholar] [CrossRef]
  19. Xu, M.; Qi, Y. Soil-surface CO2 efflux and its spatial and temporal variations in a young ponderosa pine plantation in northern California. Glob. Chang. Biol. 2001, 7, 667–677. [Google Scholar] [CrossRef]
  20. Zhang, Z.S.; Cao, C.G.; Guo, L.J.; Li, C.F. Emissions of CH4 and CO2 from paddy fields as affected by tillage practices and crop residues in central china. Paddy Water Environ. 2016, 14, 85–92. [Google Scholar] [CrossRef]
  21. Li, C.F.; Kou, Z.K.; Yang, J.H.; Cai, M.L.; Wang, J.P.; Cao, C.G. Soil CO2 fluxes from direct seeding rice fields under two tillage practices in central China. Atmos. Environ. 2010, 44, 2696–2704. [Google Scholar] [CrossRef]
  22. FAO. World Reference Base for Soil Resources 2006; World Soil Resources Report; FAO: Rome, Italy, 2006; p. 103. [Google Scholar]
  23. Wang, Y.S.; Wang, Y.H. Quick measurement of CH4, CO2 and N2O emissions from a short-plant ecosystem. Adv. Atmos. Sci. 2003, 20, 842–844. [Google Scholar]
  24. Larionova, A.A.; Rozonova, L.N.; Samoylov, T.I. Dynamics of gas exchange in the profile of a gray forest soil. Sov. Soil Sci. 1989, 24, 1359–1372. [Google Scholar]
  25. Jian, J.S.; Steele, M.K.; Day, S.D.; Quinn, T.R.; Hodges, S.C. Measurement strategies to account for soil respiration temporal heterogeneity across diverse regions. Soil Biol. Biochem. 2018, 125, 167–177. [Google Scholar] [CrossRef]
  26. Zhou, C.Y.; Zhou, G.Y.; Zhang, D.Q.; Wang, Y.H.; Liu, S.Z. CO2 efflux from different forest soils and impact factors in Dinghu Mountain, China. Sci. China Ser. D 2005, 48, 198–206. [Google Scholar]
  27. Liu, G. Analysis of Soil Physical and Chemical Properties and Description of Soil Profiles; China Standard: Beijing, China, 1996. [Google Scholar]
  28. Bossio, D.A.; Scow, K.M. Impacts of carbon and flooding on soil microbial communities: Phospholipid fatty acid profiles and substrate utilization patterns. Microb. Ecol. 1998, 35, 265–278. [Google Scholar] [CrossRef] [PubMed]
  29. Frostegard, A.; Baath, E. The use of phospholipid fatty acid analysis to estimate bacterial and fungal biomass in soil. Biol. Fert. Soils 1996, 22, 59–65. [Google Scholar] [CrossRef]
  30. Baath, E.; Anderson, T.H. Comparison of soil fungal/bacterial ratios in a pH gradient using physiological and PLFA-based techniques. Soil Biol. Biochem. 2003, 35, 955–963. [Google Scholar] [CrossRef] [Green Version]
  31. Massman, W.J.; Sommerfeld, R.A.; Mosier, A.R.; Zeller, K.F.; Hehn, T.J.; Rochelle, S.G. A model investigation of turbulence-driven pressure-pumping effects on the rate of diffusion of CO2, N2O and CH4 through layered snow packs. J. Geophys. Res.-Atmos. 1997, 102, 18851–18863. [Google Scholar] [CrossRef]
  32. Bowling, D.R.; Massman, W.J. Persistent wind-induced enhancement of diffusive CO2 transport in a mountain forest snowpack. J. Geophys. Res.-Biogeo. 2011, 116, 352–370. [Google Scholar] [CrossRef]
Figure 1. Seasonal variations of CO2 concentration along soil profiles in a coniferous forest (CF) and a broad-leaved forest (BF). Different soil column treatments were: (a) CF-CK (upright soil column); (b) BF-CK; (c) CF-Inverted; (d) BF-Inverted; (e) CF-Mixed; and (f) BF-Mixed. Data are shown as means ± SE, n = 6.
Forests 10 00192 g001
Figure 2. Fluxes of CO2 in a coniferous forest (CF) (a) and a broad-leaved forest (BF) (b) in different soil column treatments: CK, inverted and mixed. Error bars represent standard errors of the mean (n = 6).
Forests 10 00192 g002
Figure 3. Relationship between soil profile CO2 concentration and soil temperature. Different soil column treatments were: (a) CF-CK; (b) BF-CK; (c) CF-Inverted; (d) BF-Inverted; (e) CF-Mixed; and (f) BF-Mixed.
Forests 10 00192 g003
Table 1. Soil physical and chemical properties by depth and soil columns manipulation, including soil water content (SWC), total organic carbon (TOC), total nitrogen (TN) and bulk density. Error bars represent the standard errors of the mean (n = 4). Different letters represent significant differences (LSD test, p < 0.05).
Forest TypeTreatmentsProfileSWC (%)SOC (g·kg−1)TN (mg·L−1)Bulk Density (g·cm−3)
CFCK0–20 cm19.66 ± 4.00a13.09 ± 2.74a1.17 ± 0.14a1.40 ± 0.05a
20–40 cm18.95 ± 2.54a7.62 ± 2.21b0.83 ± 0.18b1.48 ± 0.06a
40–60 cm19.93 ± 2.97a5.75 ± 1.45b0.70 ± 0.10b1.48 ± 0.08a
Inverted0–20 cm19.08 ± 3.21a5.98 ± 1.00b0.66 ± 0.15b1.49 ± 0.02a
20–40 cm20.04 ± 1.86a6.17 ± 1.76b0.71 ± 0.20b1.46 ± 0.11ab
40–60 cm21.36 ± 2.58a10.12 ± 2.98a0.99 ± 0.20a1.35 ± 0.09b
Mixed0–20 cm20.19 ± 2.63a10.89 ± 1.82a0.97 ± 0.18a1.31 ± 0.03a
20–40 cm21.04 ± 2.67a9.25 ± 1.35a0.94 ± 0.16a1.30 ± 0.05a
40–60 cm21.80 ± 1.53a9.42 ± 0.69a0.90 ± 0.16a1.28 ± 0.09a
BFCK0–20 cm23.15 ± 1.82a17.25 ± 1.53a1.42 ± 0.41a1.39 ± 0.02b
20–40 cm21.07 ± 2.15a6.97 ± 1.94b0.81 ± 0.29b1.55 ± 0.05a
40–60 cm21.44 ± 1.60a4.76 ± 1.54b0.68 ± 0.33b1.48 ± 0.08a
Inverted0–20 cm20.15 ± 1.82a5.51 ± 1.44b0.75 ± 0.41a1.39 ± 0.09a
20–40 cm20.62 ± 2.51a5.31 ± 1.49b0.76 ± 0.31a1.48 ± 0.10a
40–60 cm23.29 ± 1.83a12.79 ± 5.54a1.15 ± 0.29a1.39 ± 0.02a
Mixed0–20 cm21.80 ± 2.31a9.43 ± 2.16a0.97 ± 0.33a1.32 ± 0.08a
20–40 cm22.22 ± 1.57a9.18 ± 3.01a0.92 ± 0.21a1.35 ± 0.03a
40–60 cm22.50 ± 3.93a8.33 ± 2.22a0.96 ± 0.40a1.32 ± 0.04a
Table 2. Soil microbial community characters in each soil layer over all manipulated soil columns. PLFA, total PLFA; Fun, fungi; Bac, Bacteria; F/B, the ratio of fungal to bacterial biomass. Error bars represent the standard errors of the mean (n = 4). Different letters represent significant differences (LSD test, p < 0.05).
Forest TypeTreatmentsProfilePLFA (nmol·g−1)Fun (mol%)Bac (mol%)F/B%
CFCK0–20 cm6.34 ± 3.52a4.14 ± 1.34a28.64 ± 5.76a14.69 ± 4.23a
20–40 cm4.07 ± 2.24a1.99 ± 0.98ab21.33 ± 8.61b10.75 ± 6.12a
40–60 cm4.15 ± 2.30a1.53 ± 1.12b17.86 ± 4.93b8.89 ± 5.83a
Inverted0–20 cm5.45 ± 2.66a3.52 ± 3.39a17.39 ± 3.31b19.64 ± 18.31a
20–40 cm4.72 ± 2.25a1.18 ± 0.72a17.06 ± 3.36b7.34 ± 4.67b
40–60 cm5.10 ± 1.90a2.94 ± 0.51a27.51 ± 6.05a11.18 ± 4.54a
Mixed0–20 cm7.31 ± 4.60a5.01 ± 2.60a27.25 ± 3.00a17.43 ± 8.86a
20–40 cm5.57 ± 2.73a3.21 ± 0.89a25.28 ± 3.84a12.09 ± 3.37a
40–60 cm5.45 ± 1.77a2.76 ± 0.56a25.83 ± 2.10a10.19 ± 2.06a
BFCK0–20 cm10.55 ± 1.92a3.35 ± 1.90a24.24 ± 6.24a13.04 ± 5.24a
20–40 cm7.75 ± 1.94a2.05 ± 0.74a20.83 ± 3.85a9.79 ± 4.14a
40–60 cm6.23 ± 1.05b0.98 ± 0.60a14.37 ± 3.15b7.32 ± 4.10a
Inverted0–20 cm6.54 ± 1.55a3.71 ± 4.90a16.79 ± 3.93a8.46 ± 4.25a
20–40 cm6.83 ± 2.49a1.39 ± 0.41a18.38 ± 3.64a8.81 ± 3.39a
40–60 cm7.11 ± 0.96a1.74 ± 0.48a21.24 ± 1.06a8.93 ± 1.67a
Mixed0–20 cm7.05 ± 2.27a2.21 ± 2.04a20.96 ± 4.47a9.88 ± 8.07a
20–40 cm8.49 ± 2.37a1.44 ± 1.30a16.15 ± 6.37a8.19 ± 5.49a
40–60 cm9.10 ± 3.08a1.32 ± 1.11a16.32 ± 4.66a7.93 ± 4.95a

