Mapping Maximum Tree Height of the Great Khingan Mountain, Inner Mongolia Using the Allometric Scaling and Resource Limitations Model


Abstract
:1. Introduction
2. Data
3. Methods
3.1. The ASRL Model Framework
3.2. Improvements in the ASRL Model
4. Results
5. Discussions
5.1. Model Improvement
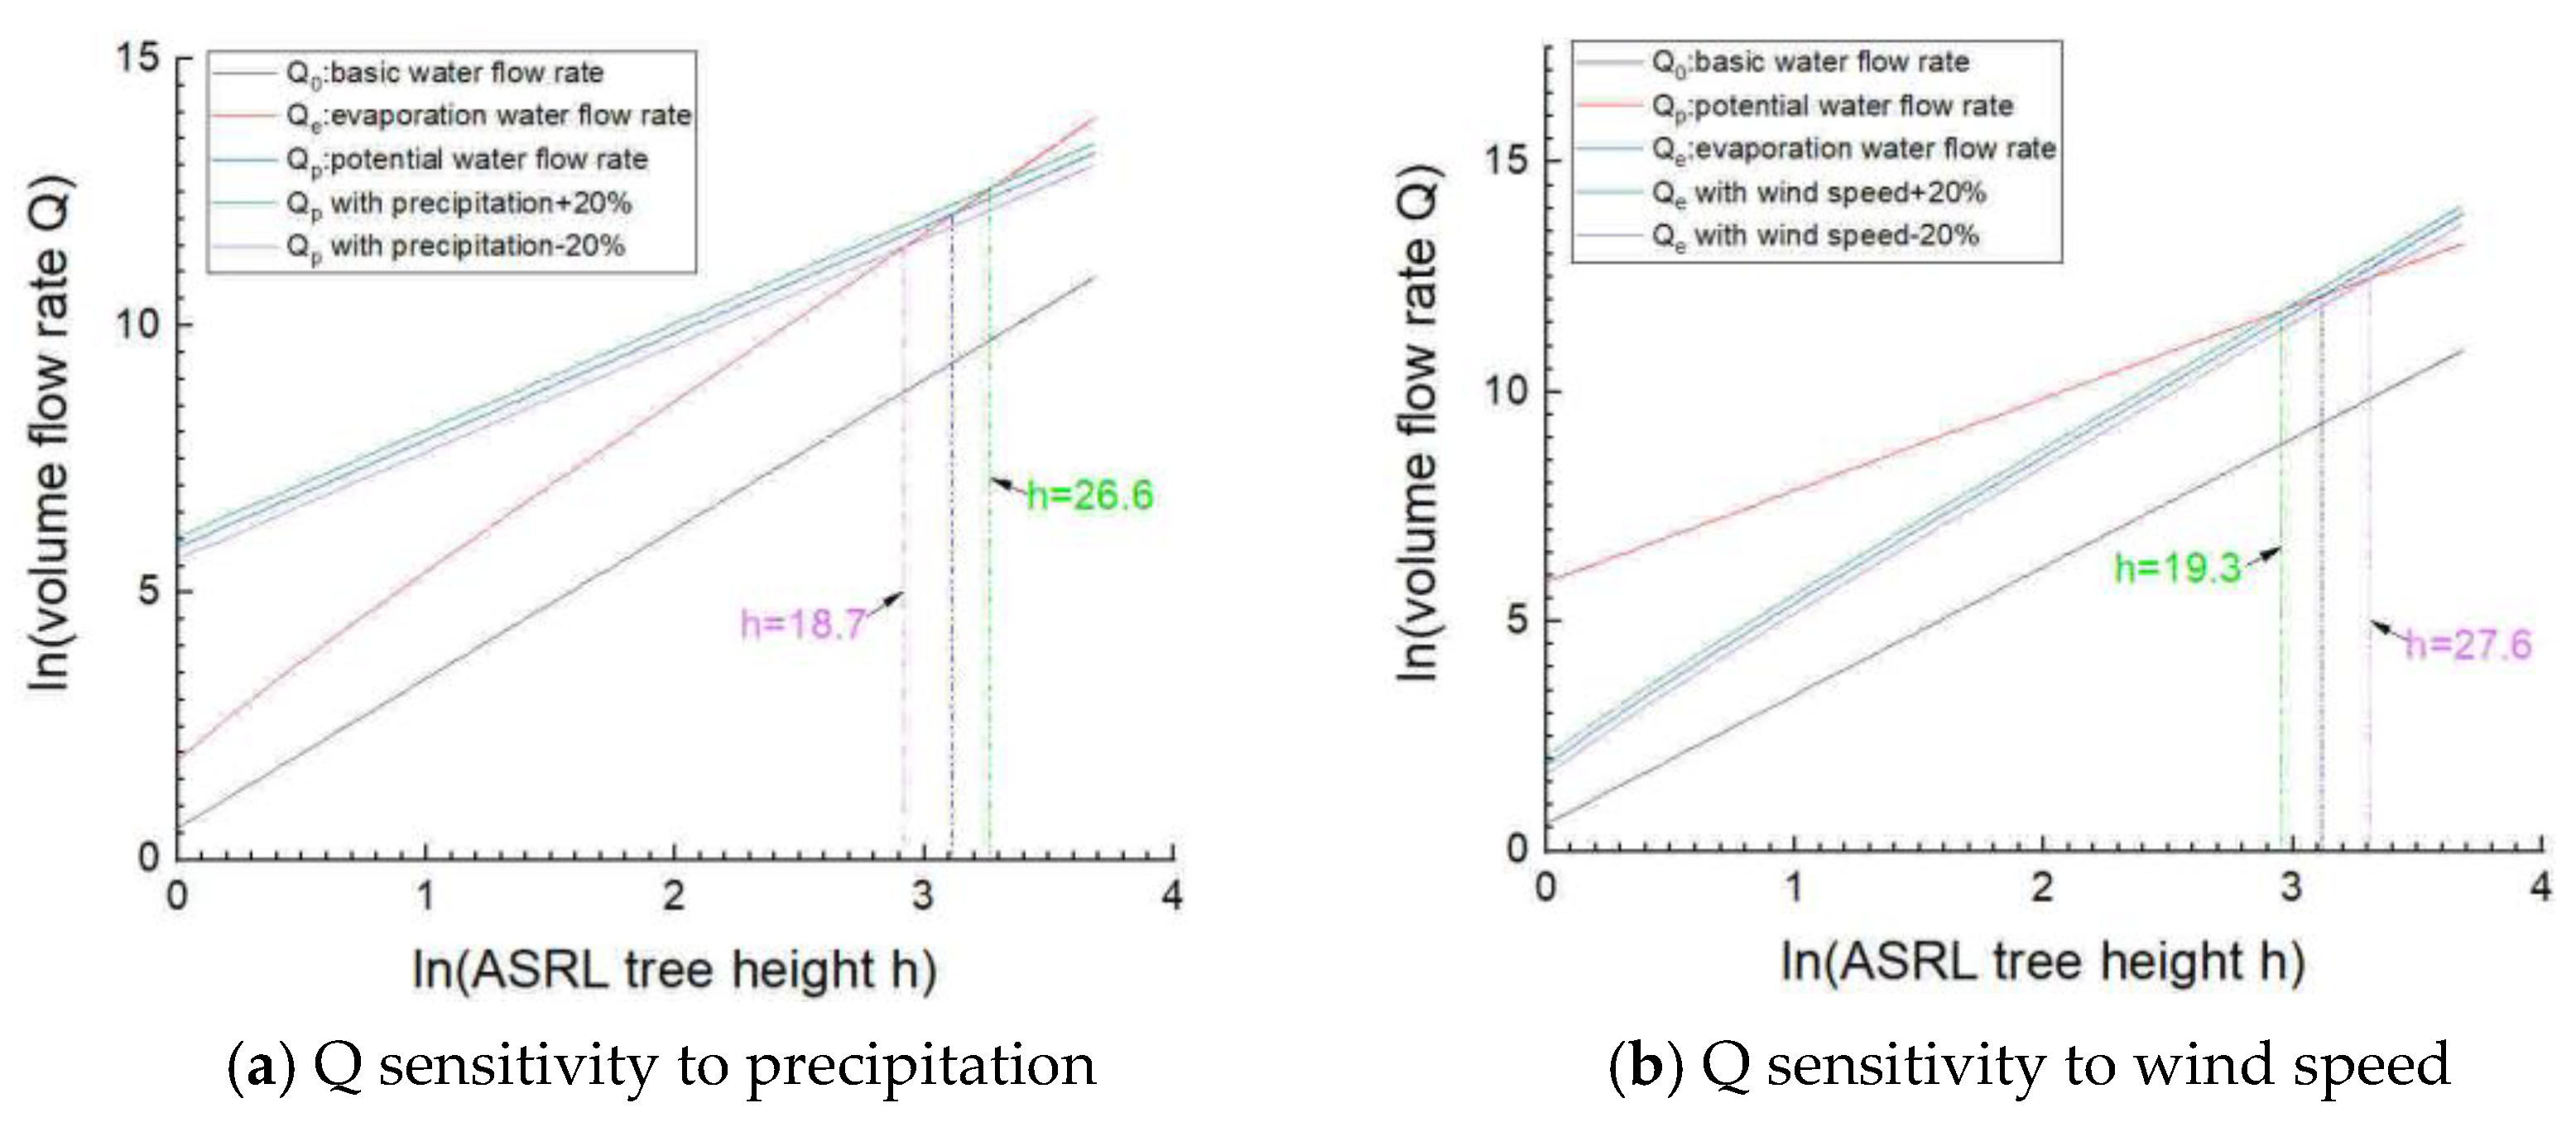
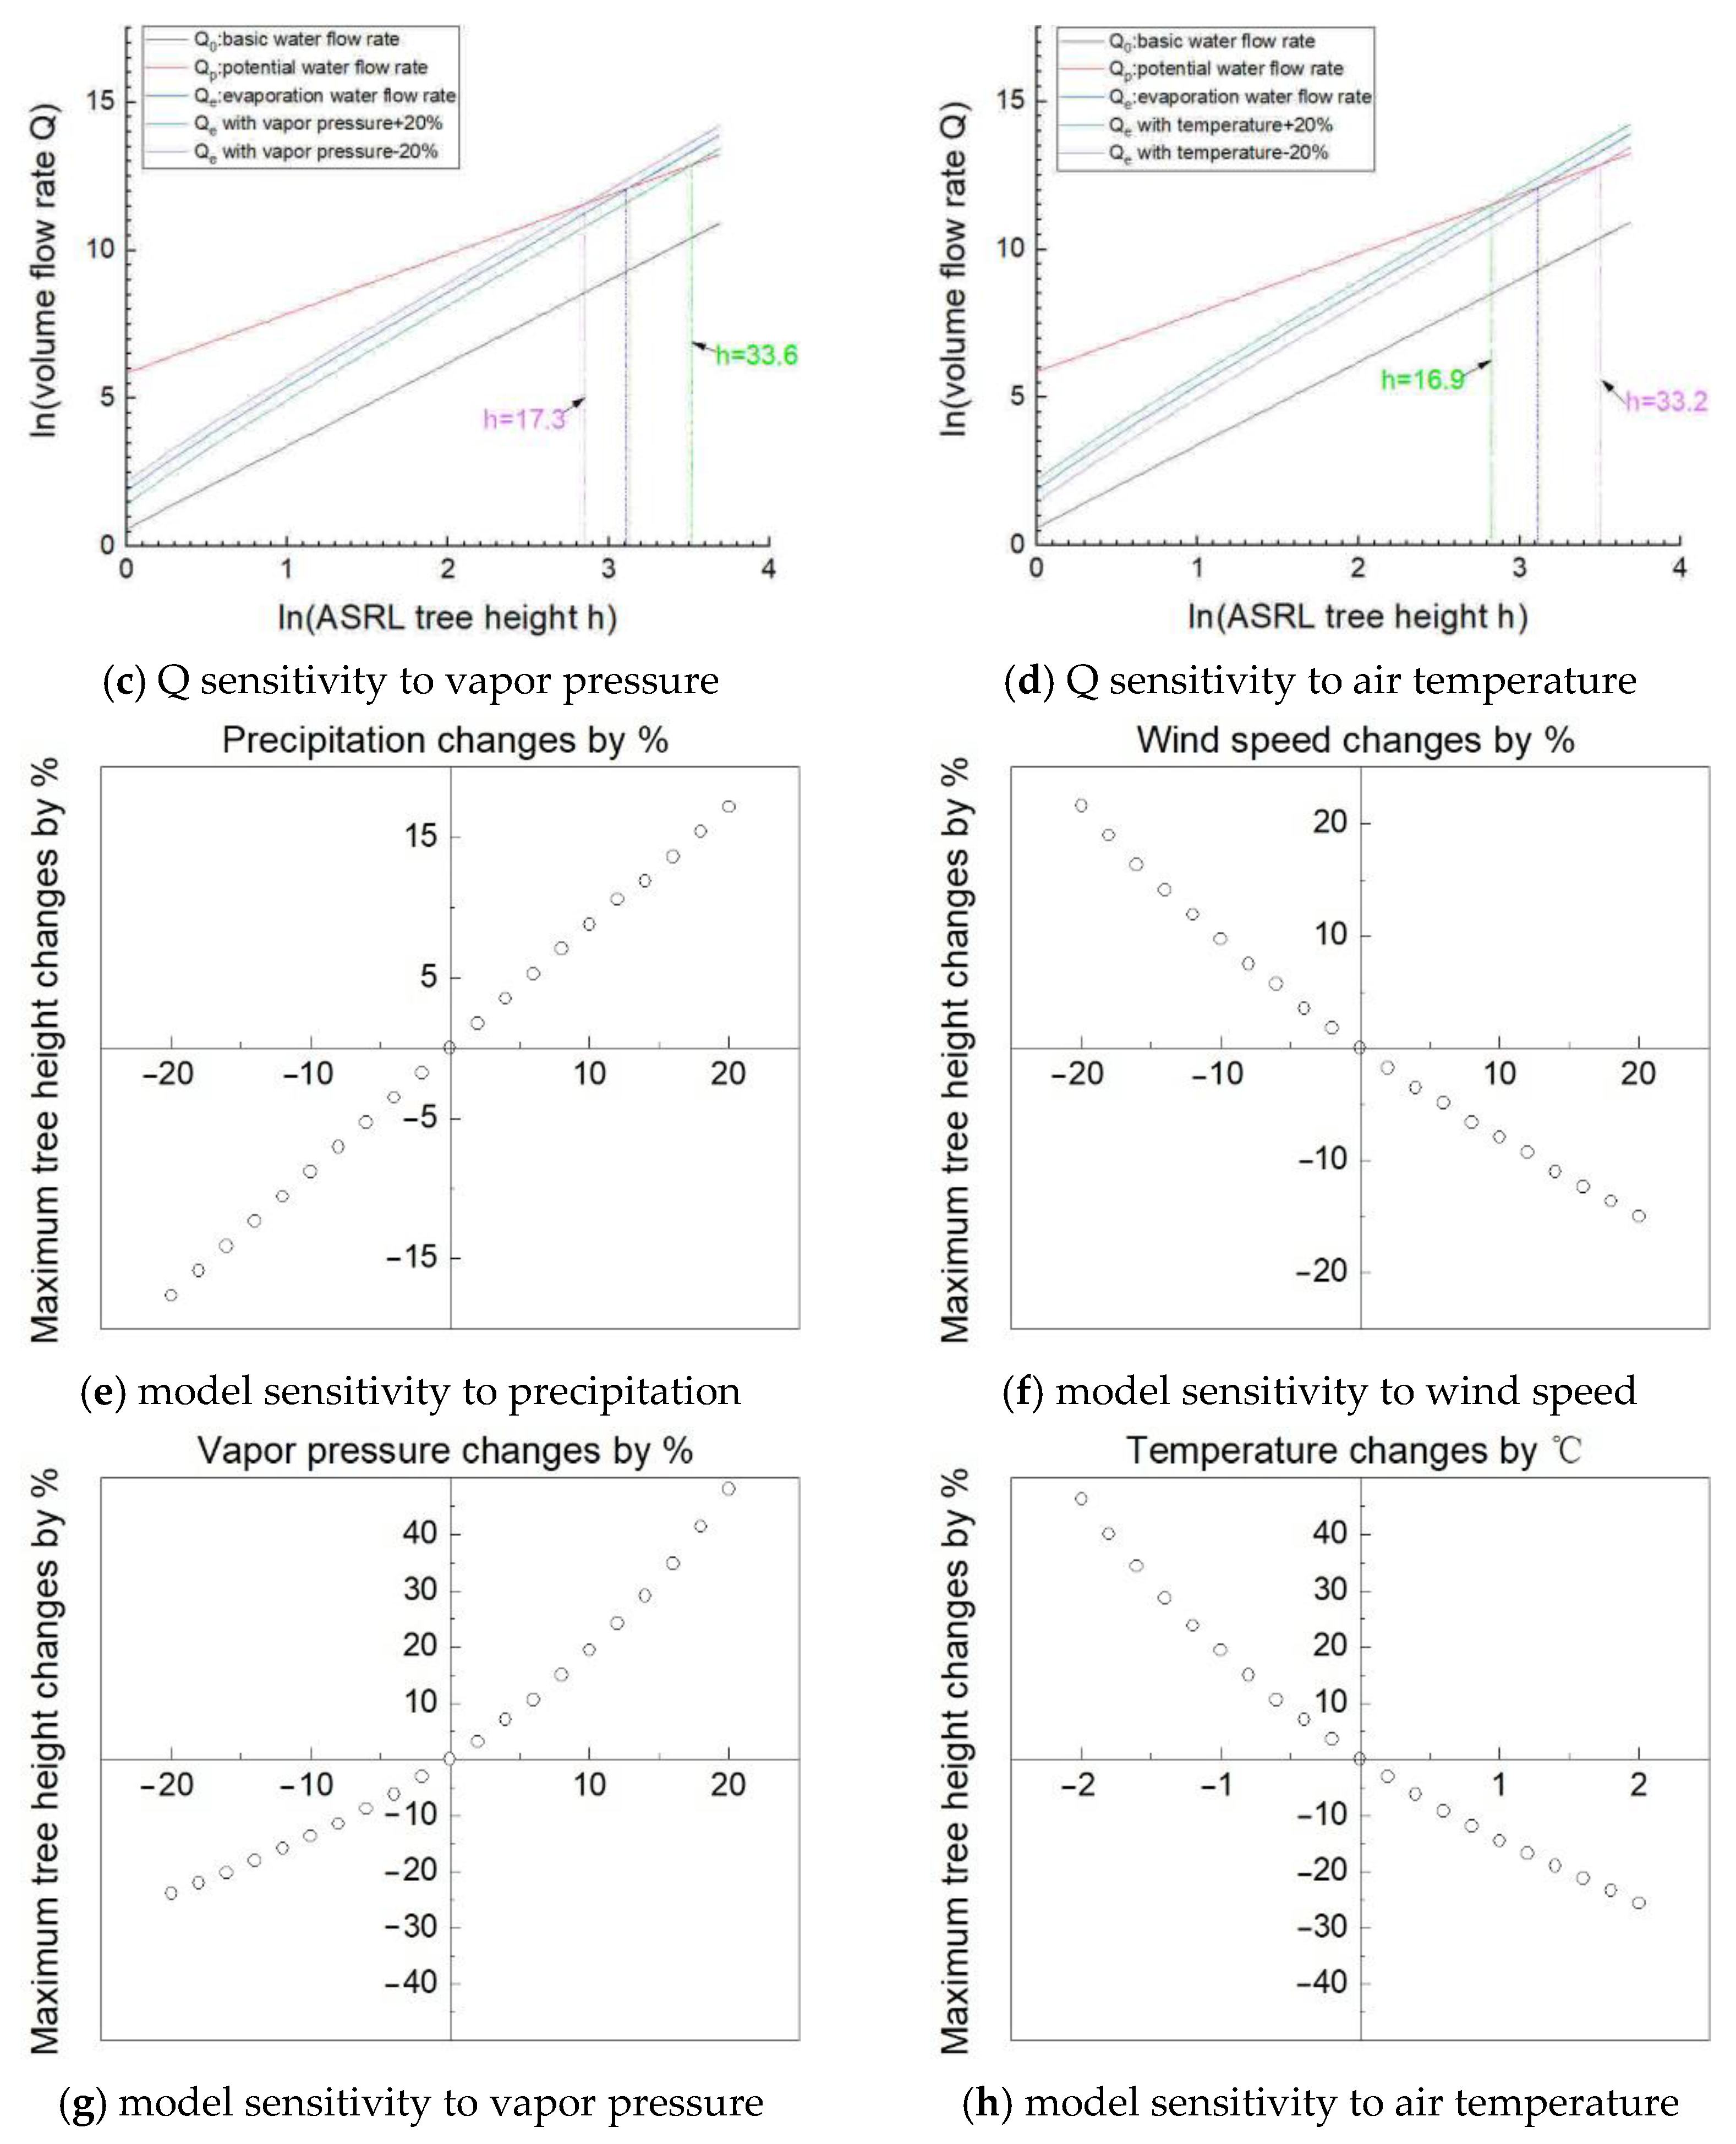
5.2. Model Sensitivity
6. Conclusions
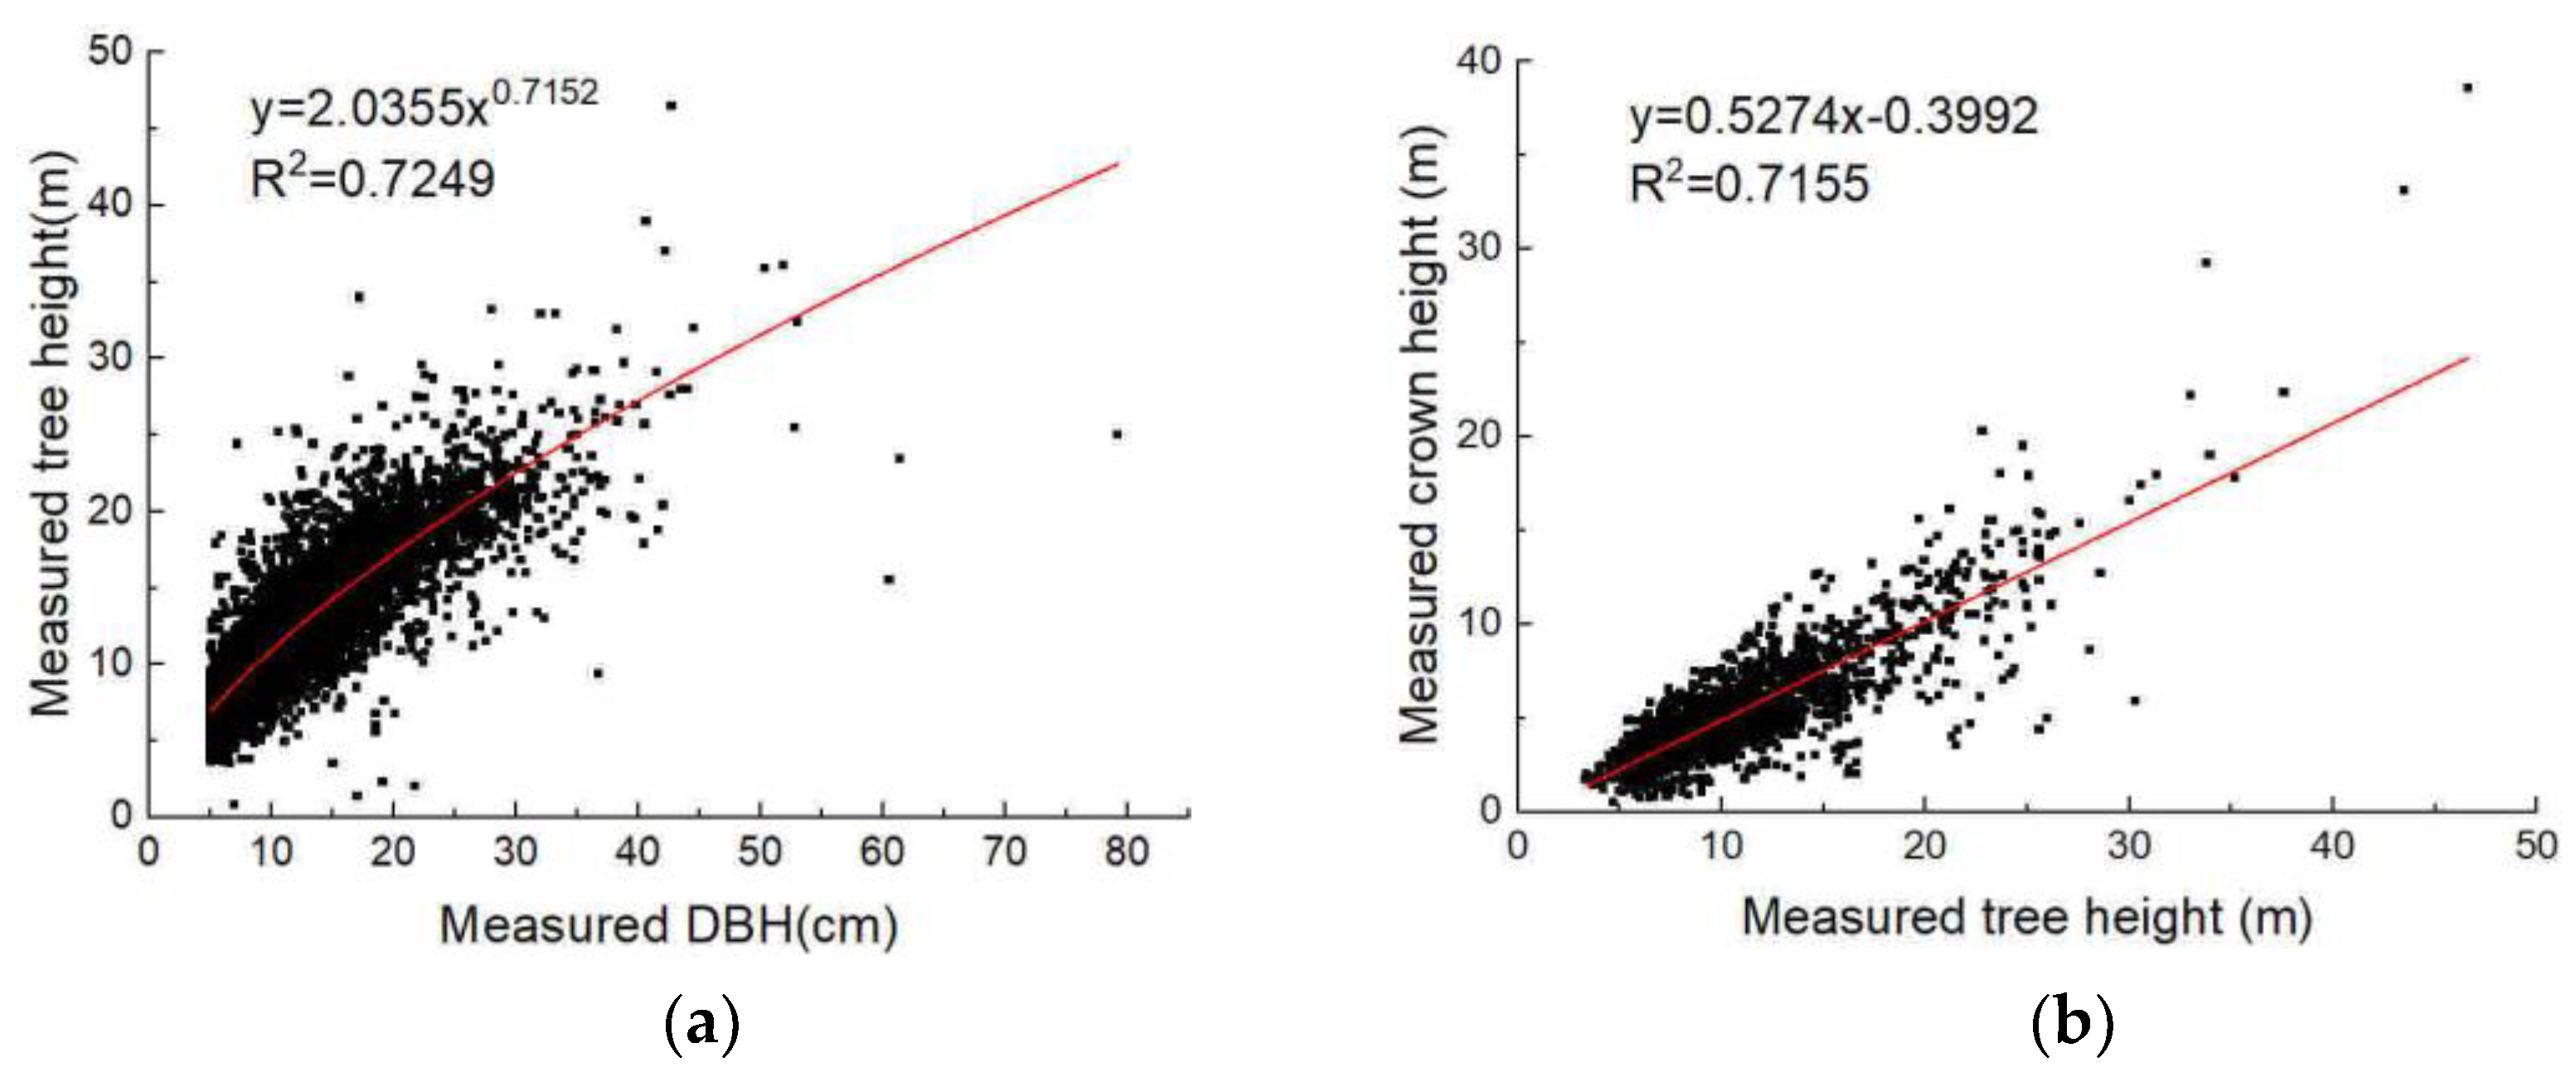
- New values of the scaling coefficients and from field measurements make the model more consistent with the forest growth state of the study area.
- Optimization of three parameters, , , and , improves the accuracy of the model prediction.
- The introduction of a normalized topography index can effectively avoid overestimating short trees’ heights in high slope areas and underestimating tall trees’ heights in low slope areas.
- Sensitivity analysis indicates the ASRL maximum tree height model is more sensitive to temperature and vapor pressure than any other climatic variables.
Author Contributions
Funding
Conflicts of Interest
References
- Clark, D.B.; Clark, D.A. Landscape-scale variation in forest structure and biomass in a tropical rain forest. For. Ecol. Manag. 2000, 137, 185–198. [Google Scholar] [CrossRef]
- Drake, J.B.; Dubayah, R.O.; Clark, D.B.; Knox, R.G.; Blair, J.B.; Hofton, M.A.; Chazdon, R.L.; Weishampel, J.F.; Prince, S. Estimation of Tropical Forest Structural Characteristics Using Large-Footprint Lidar. Remote Sens. Environ. 2002, 79, 305–319. [Google Scholar] [CrossRef]
- Muraoka, H.; Koizumi, H. Satellite Ecology (SATECO)—Linking ecology, remote sensing and micrometeorology, from plot to regional scale, for the study of ecosystem structure and function. J. Plant Res. 2009, 122, 3–20. [Google Scholar] [CrossRef] [PubMed]
- Laumonier, Y.; Edin, A.; Kanninen, M. Landscape-scale variation in the structure and biomass of the hill dipterocarp forest of Sumatra: implications for carbon stock assessments. For. Ecol. Manag. 2010, 259, 505–513. [Google Scholar] [CrossRef]
- West, G.B.; Enquist, B.J.; Brown, J.H. A general quantitative theory of forest structure and dynamics. Proc. Natl. Acad. Sci. USA 2009, 106, 7040–7045. [Google Scholar] [CrossRef] [Green Version]
- Enquist, B.J.; Niklas, K.J. Invariant scaling relations across tree-dominated communities. Nature 2001, 410, 655–660. [Google Scholar] [CrossRef]
- Enquist, B.J.; Brown, J.H.; West, G.B. Allometric scaling of plant energetics and population density. Nature 1998, 395, 163–165. [Google Scholar] [CrossRef]
- Muller-Landau, H.; Condit, R.; Harms, K.; Marks, C.; Thomas, S. Comparing tropical forest tree size distributions with the predictions of metabolic ecology and equilibrium models. Ecol. Lett. 2006, 9, 589–602. [Google Scholar] [CrossRef] [Green Version]
- Enquist, B.J.; West, G.B.; Brown, J.H. Extensions and evaluations of a general quantitative theory of forest structure and dynamics. Proc. Natl. Acad. Sci. USA 2009, 106, 7046–7051. [Google Scholar] [CrossRef] [PubMed] [Green Version]
- Pang, Y.; Zhao, F.; Li, Z. Forest Height Inversion using Airborne Lidar Technology. J. Remote Sens. 2008, 12, 152–158. [Google Scholar]
- Xiyun, M.; Qiuliang, Z. Inversion of Forest Height and Canopy Closure Using Airborne LiDAR Data. J. Northeast For. Univ. 2015, 43, 84–89. [Google Scholar]
- Lefsky, M.A. A global forest canopy height map from the Moderate Resolution Imaging Spectroradiometer and the Geoscience Laser Altimeter System. Geophys. Res. Lett. 2010, 37, 78–82. [Google Scholar] [CrossRef]
- Simard, M.; Pinto, N.; Fisher, J.B. Mapping forest canopy height globally with spaceborne lidar. J. Geophys. Res. Biogeosci. 2015, 116, 4021. [Google Scholar] [CrossRef]
- Xuehui, L.; Ainong, L.; Guangbin, L. An Approach to Decompose ICESat/GLAS Data Waveform and Estimate Canopy Height Based on PSO-LSM Method. Geogr. Geo-Inform. Sci. 2017, 33, 22–29. [Google Scholar]
- Liang, Z.; Xiaoqi, J.; Weiwei, Z. Retrieval of forest canopy height based on large-footprint LiDAR data. Sci. Surv. Map. 2018, 43, 148–153. [Google Scholar]
- Hong, C.; Jinliang, H.; Juan, Q. Estimation of forest aboveground biomass using ICESat/GLAS data and Landsat/ETM+ imagery. Sci. Surv. Map. 2018, 43, 9–16. [Google Scholar]
- Goetz, S.; Dubayah, R. Advances in remote sensing technology and implications for measuring and monitoring forest carbon stocks and change. Carbon Manag. 2011, 2, 231–244. [Google Scholar] [CrossRef] [Green Version]
- Tang, H.; Dubayah, R.; Brolly, M. Large-scale retrieval of leaf area index and vertical foliage profile from the spaceborne waveform lidar (GLAS/ICESat). Remote Sens. Environ. 2014, 154, 18. [Google Scholar] [CrossRef]
- Stojanova, D.; Panov, P.; Valentin, G.B. Estimating Vegetation Height and Canopy Cover from Remotely Sensed Data with Machine Learning. Ecol. Inform. 2010, 5, 256–266. [Google Scholar] [CrossRef]
- Kempes, C.P.; West, G.B.; Crowell, K. Predicting Maximum Tree Heights and Other Traits from Allometric Scaling and Resource Limitations. PLoS ONE 2011, 6, E20551. [Google Scholar] [CrossRef]
- Shi, Y.; Ni, X.; Choi, S. Allometric Scaling and Resource Limitations Model of Tree Heights: Part 1. Model Optimization and Testing over Continental USA. Remote Sens. 2014, 6, 284–306. [Google Scholar] [CrossRef]
- Choi, S.; Ni, X.; Shi, Y. Allometric Scaling and Resource Limitations Model of Tree Heights: Part 2. Site Based Testing of the Model. Remote Sens. 2013, 5, 202–223. [Google Scholar] [CrossRef] [Green Version]
- Ni, X.; Park, T.; Choi, S. Allometric Scaling and Resource Limitations Model of Tree Heights: Part 3. Model Optimization and Testing over Continental China. Remote Sens. 2014, 6, 284–306. [Google Scholar] [CrossRef]
- Nemani, R.R. Climate-Driven Increases in Global Terrestrial Net Primary Production from 1982 to 1999. Science 2003, 300, 1560–1563. [Google Scholar] [CrossRef] [Green Version]
- Zhuoting, W.; Dijkstra, P.; Koch, G.W. Responses of terrestrial ecosystems to temperature and precipitation change: A meta-analysis of experimental manipulation. Glob. Chang. Biol. 2011, 17, 927–942. [Google Scholar]
- Peng, S.; Piao, S.; Ciais, P. Asymmetric effects of daytime and night-time warming on Northern Hemisphere vegetation. Nature 2013, 501, 88–92. [Google Scholar] [CrossRef]
- West, G.B.; Brown, J.H.; Enquist, B.J. A general model for the origin of allometric scaling laws in biology. Science 1997, 276, 122–126. [Google Scholar] [CrossRef]
- Monteith, J.L.; Unsworth, M.H. Principles of environmental physics: Plants, animals, and the atmosphere. Acad. Press Oxf. 2013, 4, 217–247. [Google Scholar]
- Choi, S.; Kempes, C.P.; Park, T. Application of the metabolic scaling theory and water–energy balance equation to model large-scale patterns of maximum forest canopy height. Glob. Ecol. Biogeogr. 2016, 25, 1428–1442. [Google Scholar] [CrossRef]
- Cao, C.; Ni, X.; Wang, X. Allometric scaling theory-based maximum forest tree height and biomass estimation in the Three Gorges reservoir region using multi-source remote-sensing data. Int. J. Remote Sens. 2016, 37, 13. [Google Scholar] [CrossRef]
- Kempes, C.P.; Dutkiewicz, S.; Follows, M.J. Growth, metabolic partitioning, and the size of microorganisms. Proc. Natl. Acad. Sci. USA 2012, 109, 495–500. [Google Scholar] [CrossRef]
- Friedl, M.A.; Sullamenashe, D.; Tan, B. MODIS Collection 5 global land cover: algorithm refinements and characterization of new datasets. Remote Sens. Environ. 2017, 114, 168–182. [Google Scholar] [CrossRef]
- Meinzer, F.C. Functional Convergence in Plant Responses to the Environment. Oecologia 2003, 134, 1–11. [Google Scholar] [CrossRef]
- Schmidtnielsen, K. Scaling: Why Is Animal Size so Important? Cambridge University: Cambridge, UK, 2002. [Google Scholar]
- Brown, J.H.; West, G.B.; Enquist, B.J. A general model for the structure and allometry of plant vascular systems. Nature 1999, 400, 664–667. [Google Scholar]
- Niklas, K.J.; Spatz, H.C. Growth and hydraulic (not mechanical) constraints govern the scaling of tree height and mass. Proc. Natl. Acad. Sci. USA 2004, 101, 15661–15663. [Google Scholar] [CrossRef] [Green Version]
- Niklas, K.J. Maximum plant height and the biophysical factors that limit it. Tree Physiol. 2007, 27, 433–440. [Google Scholar] [CrossRef]
- Pretzsch, H.; Dieler, J. Evidence of variant intra- and interspecific scaling of tree crown structure and relevance for allometric theory. Oecologia (Berlin) 2012, 169, 637–649. [Google Scholar] [CrossRef] [Green Version]
- Lin, Y.; Berger, U.; Grimm, V. Plant Interactions Alter the Predictions of Metabolic Scaling Theory. PLoS ONE 2013, 8. [Google Scholar] [CrossRef]
- Duncanson, L.I.; Dubayah, R.O.; Enquist, B.J. Assessing the general patterns of forest structure: Quantifying tree and forest allometric scaling relationships in the United States. Glob. Ecol. Biogeogr. 2015, 24, 1465–1475. [Google Scholar] [CrossRef]
- Smith, D.D.; Sperry, J.S.; Enquist, B.J. Deviation from symmetrically self-similar branching in trees predicts altered hydraulics, mechanics, light interception and metabolic scaling. New Phytol. 2014, 201, 217–229. [Google Scholar] [CrossRef]


| Parameters | Description | Initial values | Optimized Values |
|---|---|---|---|
| Exponent for tree height and stem radius allometry | 2/3 | 0.7153 | |
| Normalization constant for the basal metabolism | 0.0177 | 0.005 | |
| Water absorption efficiency | 0.5 | 0.31 | |
| Topographic index | \ | Calculated by slope and catchment area | |
| Crown ratio | 0.79 | 0.47 | |
| Area of single leaf | 0.001 | 0.0004 |
| Group | prcp | wnd | vp | tmp | srad |
|---|---|---|---|---|---|
| January | 3 | 0.8 | 0.04 | −28.7 | 4.13 |
| February | 4 | 1 | 0.06 | −23.1 | 7.314 |
| March | 10 | 1.5 | 0.13 | −13.6 | 12.055 |
| April | 23 | 2.1 | 0.3 | −0.9 | 16.313 |
| May | 32 | 2.1 | 0.5 | 7.8 | 19.596 |
| June | 72 | 1.6 | 1.06 | 14.6 | 21.009 |
| July | 112 | 1.4 | 1.46 | 17.4 | 19.576 |
| Auguest | 102 | 1.3 | 1.28 | 14.8 | 16.104 |
| September | 49 | 1.5 | 0.68 | 7.1 | 11.953 |
| October | 19 | 1.5 | 0.29 | −4.2 | 8.073 |
| November | 9 | 1 | 0.11 | −19.1 | 4.649 |
| December | 5 | 0.7 | 0.05 | −27.4 | 3.116 |
| Unit | mm | m s−1 | kPa | °C | MJ m−2 day−1 |
© 2019 by the authors. Licensee MDPI, Basel, Switzerland. This article is an open access article distributed under the terms and conditions of the Creative Commons Attribution (CC BY) license (http://creativecommons.org/licenses/by/4.0/).
Share and Cite
Zhang, Y.; Shi, Y.; Choi, S.; Ni, X.; Myneni, R.B. Mapping Maximum Tree Height of the Great Khingan Mountain, Inner Mongolia Using the Allometric Scaling and Resource Limitations Model. Forests 2019, 10, 380. https://doi.org/10.3390/f10050380
Zhang Y, Shi Y, Choi S, Ni X, Myneni RB. Mapping Maximum Tree Height of the Great Khingan Mountain, Inner Mongolia Using the Allometric Scaling and Resource Limitations Model. Forests. 2019; 10(5):380. https://doi.org/10.3390/f10050380
Chicago/Turabian StyleZhang, Yao, Yuli Shi, Sungho Choi, Xiliang Ni, and Ranga B. Myneni. 2019. "Mapping Maximum Tree Height of the Great Khingan Mountain, Inner Mongolia Using the Allometric Scaling and Resource Limitations Model" Forests 10, no. 5: 380. https://doi.org/10.3390/f10050380