Article

A Regional-Scale Index for Assessing the Exposure of Drinking-Water Sources to Wildfires

1
Canada Wildfire, Renewable Resources, 751 General Services Building, University of Alberta, Edmonton, AB T6G 2H1, Canada
2
Department of Forest Engineering, Resources, and Management, Oregon State University, Corvallis, OR 97331, USA
3
Department of Renewable Resources, University of Alberta, Edmonton, AB T6G 2H1, Canada
4
Department of Civil and Environmental Engineering, University of Waterloo, Waterloo, ON N2L 3G1, Canada
5
Canada Wildfire, Department of Renewable Resources, University of Alberta, Edmonton, AB T6G 2H1, Canada
6
Natural Resources Canada, Canadian Forest Service, Northern Forestry Centre, 5320 122 St., Edmonton, AB T6H 3S5, Canada
7
Natural Resources Canada, Canadian Forest Service; Great Lake Forestry Centre, 1219 Queen Street East, Sault Ste. Marie, ON P6A 2E5, Canada
8
Department of Geography, University of Lethbridge, Alberta Water and Environmental Science Building, 4401 University Drive, Lethbridge, AB T1K-3M4, Canada
9
Applied Behavioral Ecology and Ecosystems Research Unit, University of South Africa, P.O. Box 392, Florida, Pretoria 1710, South Africa
10
Faculty of Social Sciences, Brock University, Niagara Region, 1812 Sir Isaac Brock Way, St. Catharines, ON L2S 3A1, Canada
*
Author to whom correspondence should be addressed.
Forests 2019, 10(5), 384; https://doi.org/10.3390/f10050384
Submission received: 9 March 2019 / Revised: 15 April 2019 / Accepted: 28 April 2019 / Published: 30 April 2019
(This article belongs to the Special Issue Managing Forests and Water for People under a Changing Environment)

Abstract

:
Recent human-interface wildfires around the world have raised concerns regarding the reliability of freshwater supply flowing from severely burned watersheds. Degraded source water quality can often be expected after severe wildfire and can pose challenges to drinking water facilities by straining treatment response capacities, increasing operating costs, and jeopardizing their ability to supply consumers. Identifying source watersheds that are dangerously exposed to post-wildfire hydrologic changes is important for protecting community drinking-water supplies from contamination risks that may lead to service disruptions. This study presents a spatial index of watershed exposure to wildfires in the province of Alberta, Canada, where growing water demands coupled with increasing fire activity threaten municipal drinking-water supplies. Using a multi-criteria analysis design, we integrated information regarding provincial forest cover, fire danger, source water volume, source-water origin (i.e., forested/un-forested), and population served. We found that (1) >2/3 of the population of the province relies on drinking-water supplies originating in forested watersheds, (2) forest cover is the most important variable controlling final exposure scores, and (3) watersheds supplying small drinking water treatment plants are particularly exposed, especially in central Alberta. The index can help regional authorities prioritize the allocation of risk management resources to mitigate adverse impacts from wildfire. The flexible design of this tool readily allows its deployment at larger national and continental scales to inform broader water security frameworks.

Graphical Abstract

1. Introduction

Increasing rates of global environmental change have contributed to widespread water-security challenges [1]. For example, increased occurrence and severity of droughts, pronounced glacial melt, sinking deltas, extraction of timber and other natural resources from forests, wetland urbanization, depleted fisheries, and intensification of agriculture, along with increased water demand associated with population growth, have all increased the vulnerability of the world’s water supply [2,3,4]. Unfortunately, new challenges are also emerging. Over the past two decades a growing number of extreme wildfire events have occurred in many parts of the world [5,6], which have increased concern about the magnitude and longevity of effects on water resources and aquatic ecosystem health [7]. Burned catchments may experience a range of hydrological and morphological perturbations depending on burn severity, area burned, catchment physiography, and post-fire precipitation regimes [8]. Many studies have illustrated post-fire impacts on soil hydraulic properties and runoff [9,10,11], sediment and nutrient concentrations [12,13], and the occurrence of floods and debris flows [14]. Such perturbations can threaten the reliability of downstream water supply for community needs [15,16], with some of these impacts lasting for a decade or more [17,18].
In most jurisdictions, the provision of safe drinking water requires disinfection at a minimum; in the case of surface water supplies, conventional treatment is typically comprised of a series of physico-chemical processes described as “chemically-assisted filtration” that are followed by disinfection [16,19]. The specific treatment process configuration for a community is determined, in part, by the current and projected availability and quality of the source (i.e., raw) water supply [16]. However, severe wildfires can lead to increasingly variable and deteriorated drinking water source quality, potentially leading to substantial challenges for drinking water treatment processes [16,20,21]. In particular, greater variability and increased concentrations of total suspended solids and turbidity, dissolved organic carbon (DOC), and other nutrients such as phosphorus (that can promote algal blooms) after a wildfire can challenge treatment process performance and increase operational costs [16,18]. For instance, treatment of lower-quality source water coming from burned areas may result in difficulties for treatment plants to meet chemical coagulant demand [16] and in greater production of disinfection by-products [21], some of which are a public health concern (if they pass into distributed water supplies) due to their alleged carcinogenic effects from prolonged exposure [22]. In the worst-case scenarios, poor source-water quality following wildfire can force treatment plants to shut down or shift to other water sources so drinking-water delivery to consumers is maintained [23,24].
As such, in regions where community drinking-water supply originates in forests, it is increasingly important to identify and evaluate the potential hazards to municipal treatment systems from post-fire water contamination. Identifying locations where there is a greater probability of adverse effects on key drinking-water sources from wildfire can facilitate coordination of forest management activities and utility operations to mitigate threats from wildfire and ensure protection and distribution of safe drinking water [25]. Moreover, this knowledge can contribute to enabling water treatment vulnerability assessments, developing strategies to rapidly identify water contamination, and responding to the unique challenges often associated with post-wildfire drinking-water treatment [26]. Such knowledge will be critical in adapting to the growing pressures from global environmental change on forest ecosystems and water resources, and consequently, on drinking-water systems [27].
Water and land managers currently lack adequate tools for assessing potential, wildfire-associated risks to municipal drinking-water systems served by forested catchments. As a result, there have been several efforts recently to use geospatial information to develop spatial indices for improving assessments of wildfire hazard and exposure of municipal watersheds to wildfire [28,29,30]. In 2009, a spatial multi-criteria method was used in Eastern USA to quantify source water provision from forested watersheds and rank them according to their exposure to multiple anthropogenic stressors [31]. This approach was later modified in the ‘Forests to Faucets (F2F)’ initiative by the US Forest Service to highlight the importance of forests to downstream drinking-water supplies [32]. The primary objectives of F2F were to explore spatial relationships between forested water sources, the number of downstream consumers, and potential threats from urban development, insects and disease, and wildfire potential [33,34]. While this model was a valuable initial effort, its direct applicability outside of USA is constrained, mainly because of limitations in data availability—yet, the global demand for spatially explicit information combining wildfire hazard and associated risks to community water supply is growing [35].
Here, we provide a spatial index, the Source Exposure Index (SEI), based on a generic multi-criteria framework to assess the exposure of forested watersheds to wildfire hazard. We used the definition of exposure proposed by the United Nations as “the situation of people, infrastructure, housing, production capacities, and other tangible human assets located in hazard-prone areas” [36]. Specifically, we aggregated information pertaining to water availability, water demand, forest cover, and fire danger in watersheds that supply surface water to 94 downstream communities in Alberta, Canada. The SEI is conceptually similar to F2F but differs in the source of data and their integration. Our objectives were to: (a) evaluate the exposure of source water supplying communities downstream of wildfire risk, and (b) develop and propose the first module of a larger pan-Canadian wildfire-water risk assessment framework. In contrast to previous efforts, our index identifies the spatial location of drinking-water supply intakes and relates these to forested water sources and their wildfire danger history. We believe that the flexibility of the index will facilitate its coupling with other water-resource indicators, as well as its integration into a Canadian water-security framework assessing various environmental-change scenarios and their potential impacts on national freshwater resources.

2. Materials and Methods
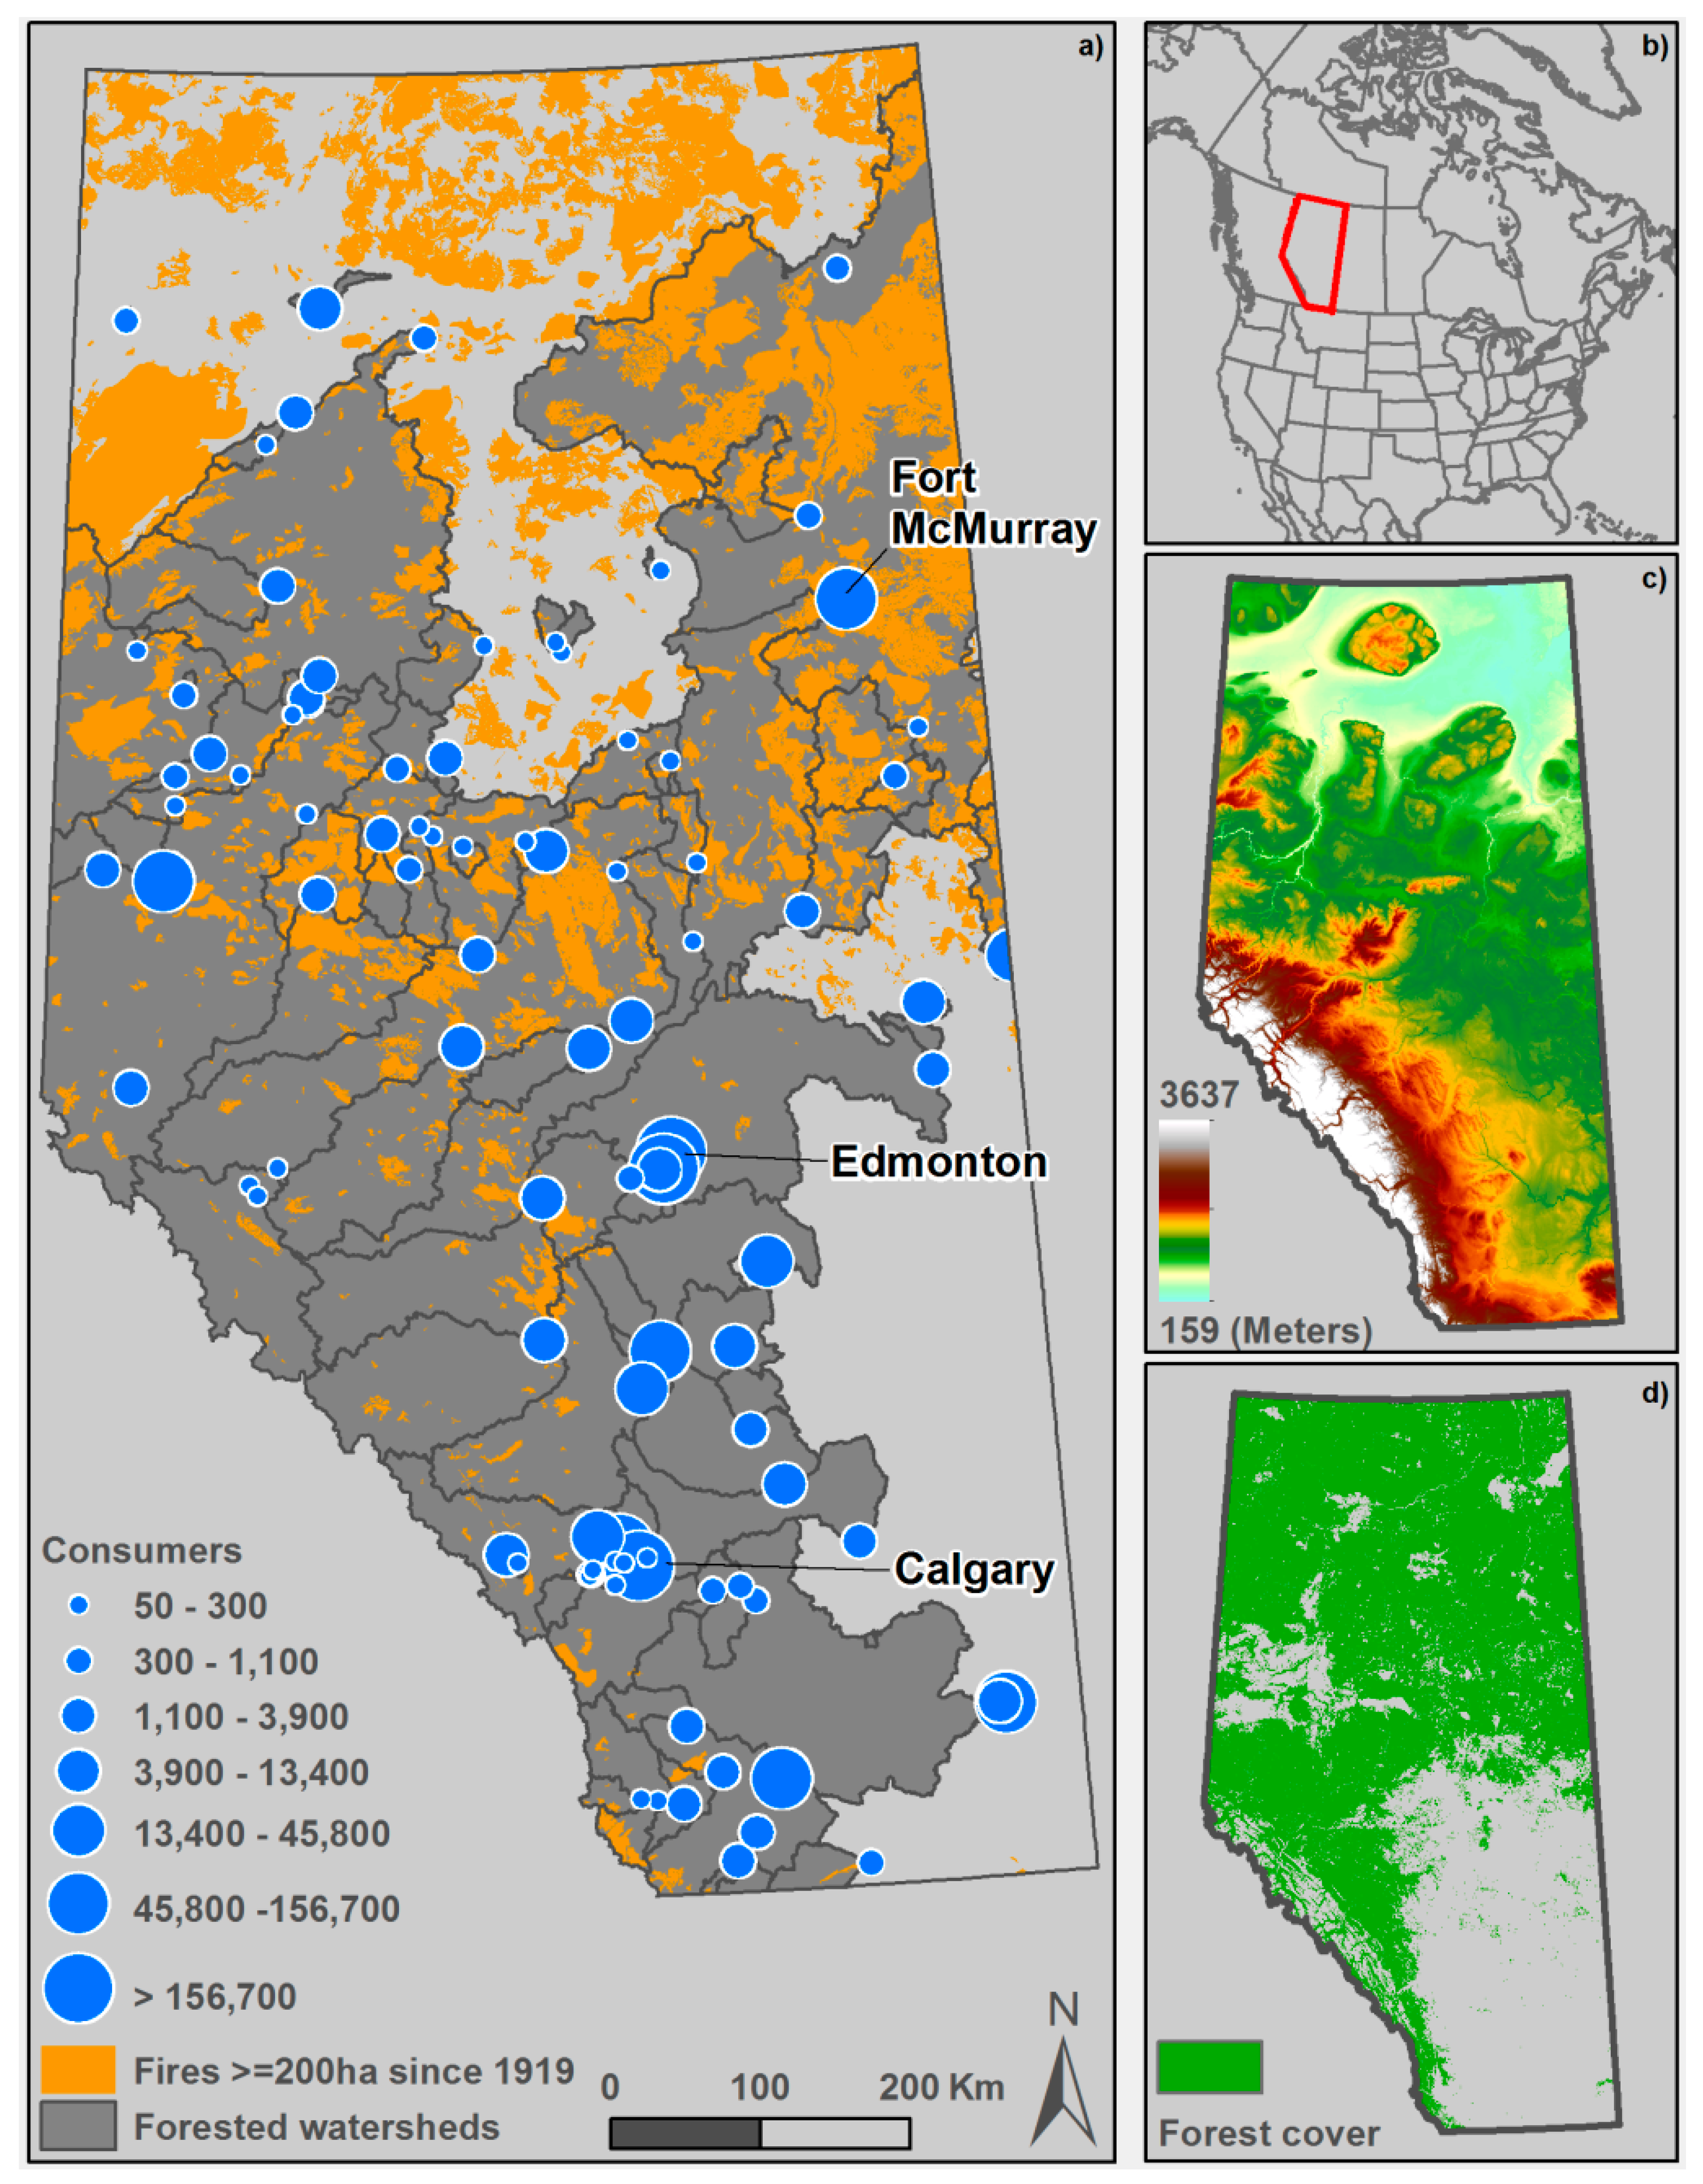
2.1. Study Area

The province of Alberta encompasses a large forested region (approximately 2/3 of the 661,848 km2 total provincial land area) in Boreal Plain and Montane Cordillera ecozones in the Northern and Western regions [37]. The climate of Alberta reflects the generally cold, dry, continental conditions characteristic of Northern interior regions East of the Canadian Rocky Mountains. Mean annual precipitation (510 mm yr−1) varies spatially, reflecting the diverse physiography and forests across the province. The highest annual precipitation (700–1400 mm yr−1) generally coincides with the highest elevations (3747 m above sea level maximum) within the Rocky Mountains (Figure 1). Comparatively, the lowest mean annual precipitation (325–400 mm yr−1) tends to occur in the lower elevation regions (210 MASL minimum) in the Northeast [38]. The hydrologic regime across the entire region is generally snowmelt-dominated with the greatest stream/river flows occurring during May–June, coincident with the late snowmelt freshet and onset of early summer convective and frontal storm activity. Strong variation in mean annual water yield across the province (29–936 mm yr−1, [39]) reflects the integrated interaction between strong spatial gradients in elevation, temperature, precipitation, topography, and geology.
Forest vegetation is characteristic of Northern Boreal and Northern temperate Rocky Mountain regions. The Northern forests of the province are mixedwoods or conifer dominated, where the main tree species in upland landscapes are Populus tremuloides Michx., P. balsamifera L., Picea glauca (Moench) Voss, and Pinus banksiana Lamb. Extensive peatlands in the North are dominated by Picea mariana (Mill.) B.S.P. (Pinaceae) and Larix laricina (Du Roi) K. Koch. Forests in the Western regions of the province are dominated by mixed conifer (Picea engelmannii Parry ex Engelm. and Abies lasiocarpa (Hook.) Nutt.) in the high elevation Rocky Mountain front-range, lodgepole pine (Pinus contorta Douglas ex Loudon) at mid-elevations, and broadleaf and mixedwood forest (Populus tremuloides, Pinus contorta, Picea glauca) in the lower-elevation foothills.
The fire regime of the province is characterized by low-frequency stand-replacing large fires that mostly occur between early April and late September [41]. Over the 2006–2015 period, the average annual area burned was over 280,000 hectares mostly due to lightning-caused fires, although human ignitions have become increasingly influential [42,43,44]. Historically, large fires occurred more frequently in the Northern boreal region relative to the Southern areas of the province [45,46]. However, fire also remains the dominant natural disturbance agent in the Southwestern headwaters of the Rocky Mountain forest region [47] (Figure 1). Recent analyses of national fire records and future climate projections suggest that fire activity in Alberta is likely to increase, with longer fire seasons and a greater potential for large fires [48,49].
The majority (92%) of drinking water supply for Alberta municipalities is provided by surface waters (rivers, lakes) [50], with the majority of large municipalities water-supply originating from forested regions. However, with the exception of the Regional Municipality of Wood Buffalo (which includes the city of Fort McMurray), most of the large municipalities are located in agricultural or parkland regions of the province, which are downstream of forests. Municipal water consumption has increased steadily with population growth (currently ~4.3 million residents) in recent decades. Projected future population growth, along with limits on new water allocation, are expected to constrain municipal development in the province, particularly in the Southern region [51,52].

2.2. Data Preparation

2.2.1. Community Water Systems

The first step in our assessment of drinking-water exposure to wildfire was to identify the source watersheds for each community in the province [53]. Using data provided by the Government of Alberta, we created an ad hoc watershed layer based on the geolocation of the intake for each municipal drinking-water treatment plant reliant on surface water sources (Figure 1). We excluded utilities reliant upon groundwater (including shallow groundwater) and groundwater under the direct influence of surface water sources from this analysis because of the lack of information regarding wildfire impacts on subsurface water supplies. In total, we identified 124 drinking water utilities using surface water sources in the province.
The contributing area of each source watershed was delineated using ArcHydro for ArcGIS 10.X [54,55]. Given the focus of the analysis, we intersected each source watershed with a forest cover layer and retained only the water utilities served entirely or partially by forested sources, which reduced the number of utilities to 94 (Figure 1). Hereafter, we refer to our study catchments as watersheds of interest (WOI). We then used data from the 2006 and 2011 Census of Canada to determine the total population served by each drinking water utility, as well as the population served in each region (Table 1).

2.2.2. Water Yield

The annual water yield, expressed in 1000 m3 km−2 yr−1 (equivalent to 1 mm yr−1), was derived from a dataset by Kienzle and Mueller [56]. Daily streamflow records for Alberta’s unregulated rivers were assembled from the Water Survey of Canada public database for the period 1971–2000 [39] (Table 1). Missing winter flows were estimated by linear interpolation of daily streamflow between the last and first day of available observations. The errors of these estimations were considered to be small relative to the mean annual streamflow. Where watersheds are regulated, naturalized streamflow time series were used, which were computed by Alberta Environment for the time period 1912–2001 [57] by in-filling data gaps and correcting streamflow due to known anthropogenic influences, such as water withdrawals, diversions, and reservoirs.
The original dataset provided streamflow data for 292 gauged sub-watersheds. Mean annual water yield was determined by dividing the mean annual streamflow volumes by the respective watershed areas [58], enabling comparisons of water production between watersheds. Streamflow volumes could only be directly related to the respective watersheds in headwater catchments with no upstream inflows. For nested watersheds with upstream gauging stations, flow volumes measured at upper gauging stations (i.e., inflows) were subtracted from the measured volumes at downstream stations and divided by the partial contributing watershed areas between stations. The resulting watershed layer containing mean annual water yield values was converted to a one km2 spatial grid, whose values were then averaged for each WOI (Figure 2a). Areas showing a negative water yield, where water inputs to the watersheds were greater than the outflow, were given a 0.1 value to avoid negative scores in the final index.

2.2.3. Forest Cover

Forest cover information was extracted from the Alberta Biodiversity Monitoring Institute (ABMI) Wall-to-wall 2010 land cover vector map, which was derived from Landsat 30-m satellite imagery and developed for regional-scale environmental assessments [59]. Based on the 11 land-cover classes available in the dataset, we selected the classes providing information on coniferous, broadleaf, and mixed forest types. We also included the shrubland cover class, as it often represents young or low-canopy forests and post-fire forest regeneration [59]. The polygons pertaining to those classes were then dissolved into a single-value forest cover layer and converted to a raster grid. We compared the ABMI land cover layer with large fire (≥200 ha) perimeters from the National Fire Database polygon layer between 1980–2016 [40], as it is common in many land-cover products to find burned areas classified as non-forested, especially in recently burned regions. Gaps (i.e., no data) in the forest cover where large fire perimeters overlapped were coded as forest as a simple way to account for post-fire vegetation recovery. We used this forest cover layer to calculate the percent forest cover for each WOI (Figure 2b).

2.2.4. Fire Danger

The fire danger data used in this study consisted of raster grids of the Fire Weather Index (FWI) System components. This system is one of two major components of the Canadian Fire Danger Rating System (CFFDRS), the other being the Fire Behavior Prediction (FBP) System (not considered in this study). The FWI System’s components are calculated from daily weather conditions (temperature, relative humidity, wind speed, and 24-h precipitation); these may, in turn, be used in conjunction with data representing flammable vegetation (i.e., fuels) and topography by the FBP System to calculate quantitative measures of fire behavior (e.g., rate of spread, fire intensity). The FWI System is composed of three fuel moisture codes and three fire behavior indices [60]. The three codes, the Fine Fuel Moisture Code (FFMC), the Duff Moisture Code (DMC), and Drought Code (DC) represent the fuel moisture of surface, intermediate, and deep soil layers, respectively. The Initial Spread Index (ISI) is a wind-based indicator of fire danger, whereas the Buildup Index (BUI) is chiefly drought based. The Fire Weather Index (FWI) is an integrated indicator of overall fire danger computed from the ISI and BUI. The Canadian fire-weather database, an interpolated raster product of daily fire weather at a 3-km resolution, was provided by the Canadian Forest Service from historical data, based on surface (i.e., weather station) observations between April 1 and September 30 from 1981 to 2010 [61]. The gridded FWI System components were calculated from the gridded weather data using the fwiRaster function from the “cffdrs” R package [62], which was developed to calculate the components of the Canadian Forest Fire Danger Rating System [61].
Although the FWI System components are calculated solely from meteorological information, they are linked to several facets of fire activity and fire behavior in Canada [63]. For instance, the FFMC, which is sensitive to short-term (i.e., sub-daily) moisture fluctuations, is a strong predictor of fire ignitions [64]. The DC, being an index of drought, is strongly related to monthly area burned [65]. The DMC has been used as an indicator of fire extinguishment [66]. The FWI, as an overall index of fire danger (i.e., not to be confused with the FWI System), is a good predictor of fire activity, but has also been used as a proxy to fire intensity, a measure of energy release that is, in turn, related to the ecological impacts of fire and to biomass loss (i.e., fire severity) [67]. The FWI System thus provides a suite of meaningful and easy-to-compute proxies to fire hazard.
We used the 95th percentile to capture the relative frequency of days conducive to high or extreme wildfire behavior. Wildfires are often driven by extreme conditions and it is during those days of particularly hot, dry, and windy conditions (captured by the FWI) that most of the area burns in the boreal forest [68,69]. The 95th percentile of the FWI was calculated for each grid cell from the ensemble of daily grids, representing extreme conditions that have been encountered less than 5% of the time between 1981 and 2010. Grid cell values were then averaged for each WOI (Figure 2c).

2.3. Data aggregation
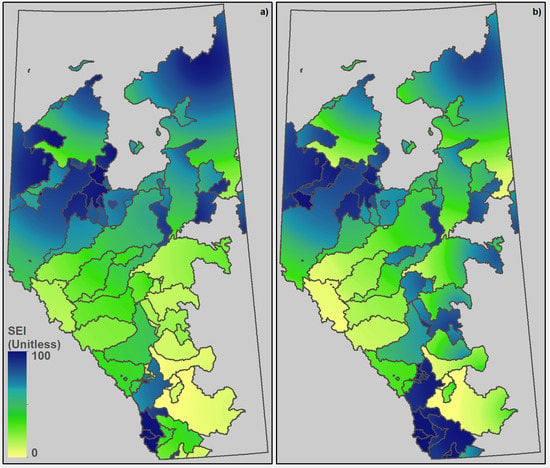
The Source Exposure Index (SEI) is a multi-criteria (i.e., composite) spatial index based on an incremental, multi-step data aggregation process. In other words, the output of each step is the product of the output of the previous step and the information provided from one of the gridded variables (e.g., water yield). We refer to the result (product) of each step as an interim indicator until the final index is produced (Figure 3).
The SEI is primarily based on a simplified representation of the dilution processes that occur along a river network due to the contribution of additional water from tributaries. This means that the further upstream the disturbance occurs, the less likely the downstream water quality will be affected. In other words, we considered contaminant concentration to be an inverse function of the distance to the emission source. Dilution processes were represented for each WOI by first computing the Euclidean distance from the water intake (i.e., the outlet) and then transforming the distance using a decay function, so that locations directly upstream of the intake are given the most influence [34]:
D n = 0.99 ( d )
where Dn was the resulting decayed distance raster grid for a nth WOI and d was the Euclidean distance raster grid values for that WOI.
We then added population (i.e., consumers) information to calculate the interim indicator TC, which was the total number of water consumers within a given WOI. As water yield in a given watershed may also be used in a downstream watershed, we had to account for the fraction of downstream consumers wholly or partially reliant on upstream sources, as those water supplies could also be affected by contamination from wildfire in the upstream catchment. The total number of consumers supplied by a given WOI was calculated as the sum of the people in the WOI and the distance-weighted fraction of the consumers in downstream watersheds, computed as follow:
T C = n = 1 N ( D n ×   P n )
where Pn was the population served within the nth downstream watershed Dn [34].
We then included water yield data (Q) to account for surface-water availability and calculated the interim indicator IMP, which was a measure of upstream landscape importance to the provision of surface drinking water to downstream consumers, as follows:
I M P n = ( Q n ) ×   T C n
where Qn was the water available per unit area for the nth nested watershed. IMP provides information on the distribution of the consumers in the region and the location of major source watersheds. The result was scaled to 0–100 values using an equalization stretch.
We then calculated the interim indicator FIMP, which was the importance of upstream forested landscape to drinking-water supply using the following equation:
F I M P n =   ( I M P n ) × ( F O R n ) 100
where FOR was the percent forest cover per watershed. The output was a 0–100 grid layer showing the importance of forests to the drinking-water supply.
Finally, we calculated the Source Exposure Index (SEI), which provides the overall integrated index of the exposure of forested watersheds providing source water to downstream communities to wildfire using the following equation:
S E I = ( F I M P n ×   F I D n ) 100
where FID was the fire danger for a given watershed as provided by the FWI and reclassified to a 0–100 scale prior to inclusion in the calculation. We rescaled SEI to a 0–100 range using an equalization stretch. The scaled SEI represented the final index, which accounts for the number of drinking-water consumers in and downstream of each catchment, the dependence of downstream catchments on upstream sources of water, the surface water resources available, the forested areas contributing to the supply of this water, and the fire danger in each forested catchment.
We also performed a simple sensitivity analysis (SA) of the SEI to assess the changes in output values associated with a controlled alteration of the input values [70]. Although SA can take many different forms, we focused on ranking (i.e., importance) the four variables (i.e., population, water yield, forest cover, and fire danger) to understand their influence on the spatial pattern of the index. First, we used the “Band Collection Statistics” tool in ArcGIS to quantify the correlation between the final index and the variables. Based on these results, variables with a correlation coefficient >0.5 were assigned a constant value—in this case, their mean value—and the index was computed again, one constant variable at a time to decipher the influence of remaining variables on the final pattern of the index.

3. Results

Forested watersheds are critically important for downstream water supply in the province of Alberta, with 94 surface water utilities relying entirely or partially on water from forested regions. Approximately 70% of these utilities serve smaller communities (<5000 people), while 30% serve a large proportion of the Alberta population in major urban centers and through regionalization of drinking water supplies to nearby communities. In total, these 94 waterworks systems serve >2/3 or ~2.4 million of Alberta’s ~3.6 million people (2011 census). Moreover, on a flow/population weighted basis, these data indicate that 50% of people in Alberta are completely reliant on drinking water from forested sources.
Larger watersheds tended to have lower exposure values; a fact likely due to the greater influence of dilution processes when watershed size increases (Figure 4a). Higher mean SEI scores (i.e., ≥50 and up to 99) occurred in source watersheds mostly located in the Rocky Mountains in Southern Alberta, where watersheds tend to have a forest cover of ~60%, a fire danger >28, and water yields >180 mm/year. Those highly-exposed watersheds supply 12 small (<5000 consumer) to very small (<500 consumers) communities. Fifty-two watersheds have a mean SEI score ranging from 10 to 50, with a forest cover ~61%, a fire danger >25, and water yields around ~100 mm/year. Seventy-seven percent of these watersheds primarily serve small to very small communities across the north-central region of the province. Finally, there are 30 watersheds with mean SEI values lower than 10, which are located in the south-central and the south-east regions of the province, around the city of Edmonton and east of the city of Calgary. Those watersheds have a forest cover ~34% on average, a fire danger >26, water yields >115 mm/year, and 64% serve small to very-small communities. Overall, approximately 48% of source watersheds that supply water to large communities (>5000 people) have SEI scores lower than 10 (Figure 5).
The global sensitivity analysis of the relationship between the SEI and the input variables suggested that the final values of the index were positively correlated to the average forest cover of the watershed (r = 0.51), the water yield (r = 0.34), and the population served (r = 0.25), while being negatively correlated to the average value of the FWI (r = −0.12) (Table 2). One can also note the inverse relationship (r = −0.64) between fire danger and forest cover, which can be explained by opposing spatial patterns between those variables: For the 11 watersheds displaying fire danger values >35, the average forest cover was ~11%, which explains the limited influence on final exposure scores due to the highest FWI values observed in the least-forested watersheds. The spatial pattern of the SEI revealed a local effect of the number of consumers (Figure 6). Setting the forest cover input variable to its mean allows checking for the dependence of other layers, which revealed that the population was, indeed, the most important predictor of exposure, with a positive correlation ≈0.5 and higher index values spatially related to areas of greater population concentration, particularly in the southern part of Alberta (Figure 4b).

4. Discussion

The Source Exposure Index was conceived as an adaptable and generic tool for the evaluation of drinking-water supply exposure from wildfires. Our model relies on a minimum amount of data related to the location of drinking-water utilities and their consumers, water yield per unit area, percent forest cover, and fire danger. Our approach created an exposure index based on the combination of these variables within each forested watershed supplying drinking water in Alberta. Our results show that drinking water source watersheds located in the southern region (i.e., Rocky Mountains) of the province had higher exposure scores, that the forest cover and the total number of downstream consumers drive the exposure scores, and that the source watersheds of smaller drinking-water systems are more exposed comparatively to larger systems.
The creation of our index followed the same general logic as F2F, although fully reproducing this latter method would have been difficult due to major differences in data availability and structure. However, given the potential consequences that wildfires can have on drinking-water sources, it is crucial to obtain such first-order estimates provided by the SEI, even if not all of the data is available. This situation led to several differences between the two indices. First, the exposure model for Alberta focuses on threats from wildfire only. Using the FWI as a fire hazard proxy instead of a probability layer comparable to the US Wildland Fire Potential is the most important difference. The FWI System provides a suite of meaningful and easy-to-compute indicators of fire hazard. Hydrologic information was also treated differently; F2F used what was essentially the result of a water-budget model (i.e., precipitation-evapotranspiration) [71], whereas we used actual water yield information collected from water monitoring gauges. Comparatively, our approach was based on historical measurements of streamflow, which offer the potential to assess alternate scenarios. For example, once compiled, we could use the base data to assess how the regional pattern of exposure changes during dry years with exceptionally low annual flows.

4.1. Wildfires and Drinking-Water Security in Alberta

For the past 10 years, the province of Alberta has experienced ~1500 wildfires per year for an average ~280,000 hectares in area burned each year [72]. However, there was large variability in their effects, and while most fires remained of limited concern, some of these were particularly impactful from a socio-economic perspective. For instance, the Flat Top Complex of 2011, though not particularly large by Canadian standard, exhibited unpredictable behavior and destroyed more than 400 structures in the Town of Slave Lake. Similarly, the Horse River fire of 2016 burned almost 600,000 hectares near the city of Fort McMurray, destroying or damaging nearly 2000 structures and forcing the evacuation of 88,000 people, for an estimated ~$9-billion of insurable losses [73]. This fire has resulted in significant municipal water-treatment costs, including a pre-cautionary three-month boil water order and increased annual treatment chemical consumption of approximately 50% [74,75], thereby illustrating existing wildfire risks to water supply in the province.
The province of Alberta relies on a number of environmental regulations that have put the protection of drinking water source watersheds at the forefront of environmental management, including: Alberta Environment’s Drinking Water Program [76], the Alberta Water Act [77], Water for Life [78], and the Standards and Guidelines for Municipal Waterworks [79]. These policies and regulatory frameworks aim at public health protection through the provision of safe drinking water. The province of Alberta also relies on a number of land and wildfire management practices and forest conservation policies, such as the Forest and Prairie Protection Act [80] and the Land Use Framework [81] to protect communities and other values at risk from wildfires. The protection of source watersheds is the third priority of the Alberta Fire Management Branch [82]. The environmental regulatory context of Alberta therefore lends support to the use of the SEI as a tool to identify those source watersheds with higher exposure to wildfires and where source water protection (SWP) planning should account for post-fire water contamination.
SWP planning involves the identification of threats to source-water supplies, the evaluation of risks, and the implementation of management actions to ensure that the risks to water quality and quantity are prevented or minimized [83]. SWP plan development can be challenging. Delays in SWP planning—especially in small systems (i.e., those serving 5000 consumers or less)—have been attributed to the inherent technical complexity of such endeavors, challenges in engaging all relevant stakeholders, and the costs associated with evaluating and implementing mitigation measures [84,85,86]. The relatively scant analyses of cost-benefit suggest the potential to avoid tens to hundreds of millions of dollars in costs through watershed protection against detrimental fire activity [87,88]. It should be noted, however, that many of those estimates pertain to complete avoidance, rather than mitigation of the impacts associated with severe wildfire, which is likely a more reasonable target for SWP-focused actions. Notably, the SEI can be used as a decision-support tool for informing such decisions through identification of watersheds and community water supplies with the greatest wildfire exposure.

4.2. Accounting for Wildfires in the Future of Canada’s Water Security

Wildfire is increasingly cited as an emerging source of risks to water security [89,90], including in the Canadian water sector where future investments in wildfire risk resilience will be paramount [91]. Efforts to develop a Canadian water security assessment framework, with a strong focus on drinking-water safety will provide a national platform that heavily relies on the use of spatial environmental indicators, such as the SEI [92,93]. The framework outlined herein could be applied at a national scale to complement existing national water indicators [94,95] to specifically identify community watersheds with the greatest exposure to wildfires. Other aspects of freshwater supply can be addressed using the SEI with minor adaptation; for instance, the location of waterworks’ intakes can be substituted with any value at risk, such as a reservoir, a lake used for recreation, or an endangered riverine ecosystem.
At least four of the forested watersheds in our data are a source of drinking water for First Nations, Inuit, or Metis communities, with a SEI score ranging from 5 to 50. Chronic water insecurity of First Nations, Inuit, or Metis communities of Canada, illustrated by the plethora of long-term boil-water advisories, has been a source of tension for decades [96,97]. These difficulties to access clean drinking-water expose Indigenous people to greater water-related health issues, on top of management difficulties inherent to small distribution systems, as noted earlier [98]. Many Indigenous communities are located in fire-prone forests [99], and though wildfire risks faced by those communities have been increasingly addressed [100], there is to date no formal assessment of the additional threat that wildfires would pose to existing water issues. Beyond potential drinking-water issues, it is noteworthy that those communities also depend on water resources for food (e.g., fish) and other uses (e.g., transportation, spiritual value). This creates additional concerns, as several studies have shown increases in heavy metals following wildfires, occasionally rising to dangerous levels for human health [101,102,103,104]. The SEI provides an easy-to-deploy tool to rapidly identify key regions where the range of effects (e.g., water supply, water quantity, and aquatic ecology) from wildfires may threaten the ensemble of freshwater ecosystem services that First Nations, Inuit, and Metis communities depend upon.
Ongoing global change will likely put Canadian forests under higher pressure from human activities and climatic variations, with wildfire activity and hydrologic extremes likely to increase in frequency and severity [49,105,106,107]. Projected changes in precipitation patterns, water availability and quality, and pressures on freshwater resources will also likely increase with Canada-wide human expansion (e.g., urban sprawl, population growth, natural resource exploitation) and its need for larger water amounts [27,91,108]. This combination will likely expose an increasing number of source watersheds to wildfire hazard, which in turn may lead to increased treatment challenges and upsets, and even boil-water advisories, service disruptions, or outages [109,110]. The flexibility of our index can be advantageously used to combine the SEI with the increasing availability of regional environmental change projection data (e.g., FWI forecasts) and water security indicators (e.g., Risk-Based Basin Analysis) so that future land and water governance policies in Canada can better address the effects of wildfires on particularly endangered source watersheds [93,95].

4.3. Limitation and Improvements

Our approach, though informative, does have some limitations. Firstly, solely using a distance variable as a proxy to account for downstream dilution processes implies a linear and unique watershed response to wildfire [111]. It has been shown that the nature and the spatial arrangement of hydrologic features in a watershed partially control its capacity to buffer, or on the contrary, to trigger or accelerate post-fire hydrologic response. Integrating the diversity, the density, and the connectivity of existing hydrologic features could help better represent the exposure of a watershed to wildfire [112,113].
Secondly, the FWI System is a weather-based index that does not explicitly incorporate information on flammable vegetation (i.e., fuels), ignitions, and topography, which precludes the computation of specific measures of fire behavior influencing post-fire hydrologic response (i.e., size and severity). Combining FWI information with spatial data from the Canadian Fire Behavior Prediction System could help refine exposure scores, but reliable fuels data required for FBP System computation is not always available or up to date. This system indeed integrates forest fuel information and provides metrics according to potential fire intensity that could be used as a proxy to fire severity, either as depth of burn or biomass consumed, which is a critical factor of post-fire hydrologic response [114].
Finally, our index only characterizes the exposure of source watersheds, and does not provide any insight regarding the impacts to water quality and treatability, or the vulnerability of specific downstream drinking-water systems. Although Canadian (and North American) drinking-water systems are generally equipped to face some of the source water challenges associated with severe wildfires, the need for additional treatment infrastructure or elevated operational costs post-fire will have to be eventually factored into a larger risk assessment tool [16,115].

5. Conclusions

We have presented a large-scale analysis of drinking-water source exposure to wildfire hazard in Alberta, Canada. Our approach adapted a US framework and made it more generic, thus more broadly applicable to other regions where hydrological resources are exposed to fire activity. Our results show that the forest cover associated with the distribution of water consumers drove exposure levels, making North-central Alberta and the Southern Rocky Mountains particularly exposed. Those results are logical and well-illustrated by the consequences of recent extreme wildfires that occurred in the province, such as the Horse River fire in Fort McMurray, whose impact on water supply was extensively reported in the media [74,116]. They are also exemplified by the recent publication of source-water protection plans integrating wildfire threats to the drinking-water supply for the largest cities in Alberta [117,118]. However, not only are environmental conditions worsening due to global change, but the exposure of communities is increasing by virtue of increasing consumer demand. Our exposure model represents a customizable basis for a comprehensive national risk analysis of community water systems to wildfires. With the foreseen increase in the number of wildfires that could cause negative human impacts, such a simple tool can help quickly project environmental conditions using “what-if” scenarios, thereby facilitating the identification of watersheds at risk, leading to the design of tailored and cost-effective resilience strategies.

Author Contributions

Conceptualization, U.S., M.B.E., M.D.F., D.P.D., and M.-A.P.; methodology, F.-N.R., K.D.B., U.S., D.P.D., and M.B.E.; formal analysis, F.-N.R., K.D.B., M.-A.P., U.S., and M.B.E.; writing—original draft preparation, All Authors; writing—review and editing, All Authors; visualization, F.-N.R.

Funding

The preliminary work for this study was funded by the Canadian Water Network, Alberta Environment and Sustainable Resources Development, and Alberta Environment and Parks through the project “Management of Wildfire Risk to Municipal Waterworks Systems in Alberta”. Further financial support for the publication of this work was provided by the Canadian Partnership for Wildland Fire Science as part of the Global Water Futures research initiative, led by the National Hydrology Research Centre at the University of Saskatchewan and funded by the Canada First Research Excellence Fund.

Acknowledgments

The authors want to thank Jourdan Bird who assisted in the collection of drinking-water treatment plant data.

Conflicts of Interest

The authors declare no conflict of interest.

References

  1. Foley, J.A.; Defries, R.; Asner, G.P.; Barford, C.; Bonan, G.; Carpenter, S.R.; Chapin, F.S.; Coe, M.T.; Daily, G.C.; Gibbs, H.K.; et al. Global consequences of land use. Science 2005, 309, 570–574. [Google Scholar] [CrossRef] [PubMed]
  2. Vörösmarty, C.J.; McIntyre, P.B.; Gessner, M.O.; Dudgeon, D.; Prusevich, A.; Green, P.; Glidden, S.; Bunn, S.E.; Sullivan, C.A.; Liermann, C.R.; et al. Global threats to human water security and river biodiversity. Nature 2010, 467, 555–561. [Google Scholar] [CrossRef] [Green Version]
  3. Carpenter, S.R.; Stanley, E.H.; Vander Zanden, M.J. State of the World’s Freshwater Ecosystems: Physical, Chemical, and Biological Changes. Annu. Rev. Environ. Resour. 2011, 36, 75–99. [Google Scholar] [CrossRef]
  4. Meybeck, M. Global analysis of river systems: From Earth system controls to Anthropocene syndromes. Philos. Trans. R. Soc. Lond. Ser. B Biol. Sci. 2003, 358, 1935–1955. [Google Scholar] [CrossRef] [PubMed]
  5. Jolly, W.M.; Cochrane, M.A.; Freeborn, P.H.; Holden, Z.A.; Brown, T.J.; Williamson, G.J.; Bowman, D.M.J.S. Climate-induced variations in global wildfire danger from 1979 to 2013. Nat. Commun. 2015, 6, 7537. [Google Scholar] [CrossRef] [Green Version]
  6. Bowman, D.M.J.S.; Williamson, G.J.; Abatzoglou, J.T.; Kolden, C.A.; Cochrane, M.A.; Smith, A.M.S. Human exposure and sensitivity to globally extreme wildfire events. Nat. Ecol. Evol. 2017, 1, 0058. [Google Scholar] [CrossRef]
  7. Bladon, K.D.; Emelko, M.B.; Silins, U.; Stone, M. Wildfire and the future of water supply. Environ. Sci. Technol. 2014, 48, 8936–8943. [Google Scholar] [CrossRef] [PubMed]
  8. Shakesby, R.A.; Doerr, S.H. Wildfire as a hydrological and geomorphological agent. Earth-Sci. Rev. 2006, 74, 269–307. [Google Scholar] [CrossRef]
  9. Cawson, J.G.; Sheridan, G.J.; Smith, H.G.; Lane, P.N.J. Effects of fire severity and burn patchiness on hillslope-scale surface runoff, erosion and hydrologic connectivity in a prescribed burn. For. Ecol. Manag. 2013, 310, 219–233. [Google Scholar] [CrossRef]
  10. Hallema, D.W.; Sun, G.; Bladon, K.D.; Norman, S.P.; Caldwell, P.V.; Liu, Y.; McNulty, S.G. Regional patterns of postwildfire streamflow response in the Western United States: The importance of scale-specific connectivity. Hydrol. Process. 2017, 31, 2582–2598. [Google Scholar] [CrossRef]
  11. Ebel, B.A.; Moody, J.A. Synthesis of soil-hydraulic properties and infiltration timescales in wildfire-affected soils. Hydrol. Process. 2017, 31, 324–340. [Google Scholar] [CrossRef]
  12. Bladon, K.D.; Silins, U.; Wagner, M.J.; Stone, M.; Emelko, M.B.; Mendoza, C.A.; Devito, K.J.; Boon, S. Wildfire impacts on nitrogen concentration and production from headwater streams in southern Alberta’s Rocky Mountains. Can. J. For. Res. 2008, 38, 2359–2371. [Google Scholar] [CrossRef] [Green Version]
  13. Silins, U.; Stone, M.; Emelko, M.B.; Bladon, K.D. Sediment production following severe wildfire and post-fire salvage logging in the Rocky Mountain headwaters of the Oldman River Basin, Alberta. Catena 2009, 79, 189–197. [Google Scholar] [CrossRef]
  14. Santi, P.M.; DeWolfe, V.G.; Higgins, J.D.; Cannon, S.H.; Gartner, J.E. Sources of debris flow material in burned areas. Geomorphology 2008, 96, 310–321. [Google Scholar] [CrossRef]
  15. Robinne, F.-N.; Bladon, K.D.; Miller, C.; Parisien, M.-A.; Mathieu, J.; Flannigan, M.D. A spatial evaluation of global wildfire-water risks to human and natural systems. Sci. Total Environ. 2018, 610–611, 1193–1206. [Google Scholar] [CrossRef]
  16. Emelko, M.B.; Silins, U.; Bladon, K.D.; Stone, M. Implications of land disturbance on drinking water treatability in a changing climate: Demonstrating the need for “source water supply and protection” strategies. Water Res. 2011, 45, 461–472. [Google Scholar] [CrossRef]
  17. Rhoades, C.C.; Chow, A.T.; Covino, T.P.; Fegel, T.S.; Pierson, D.N.; Rhea, A.E. The legacy of a severe wildfire on stream nitrogen and carbon in headwater catchments. Ecosystems 2019, 22, 643–657. [Google Scholar] [CrossRef]
  18. Emelko, M.B.; Stone, M.; Silins, U.; Allin, D.; Collins, A.L.; Williams, C.H.S.; Martens, A.M.; Bladon, K.D. Sediment-phosphorus dynamics can shift aquatic ecology and cause downstream legacy effects after wildfire in large river systems. Glob. Chang. Biol. 2016, 22, 1168–1184. [Google Scholar] [CrossRef]
  19. Crittenden, J.C.; Trussell, R.R.; Hand, D.W.; Howe, K.J.; Tchobanoglous, G. MWH’s Water Treatment: Principles and Design, 3rd ed.; John Wiley & Sons, Inc.: Hoboken, NJ, USA, 2012. [Google Scholar]
  20. Sham, C.H.; Tuccillo, M.E.; Rooke, J. Effects of Wildfire on Drinking Water Utilities and Best Practices for Wildfire Risk Reduction and Mitigation; Water Research Foundation: Denver, CO, USA, 2013. [Google Scholar]
  21. Hohner, A.K.; Terry, L.G.; Townsend, E.B.; Summers, R.S.; Rosario, F. Water treatment process evaluation of wildfire-affected sediment leachates. Environ. Sci. Water Resour. Technol. 2017, 3, 352–365. [Google Scholar] [CrossRef]
  22. Richardson, S.D.; Plewa, M.J.; Wagner, E.D.; Schoeny, R.; DeMarini, D.M. Occurrence, genotoxicity, and carcinogenicity of regulated and emerging disinfection by-products in drinking water: A review and roadmap for research. Mutat. Res. Rev. Mutat. Res. 2007, 636, 178–242. [Google Scholar] [CrossRef]
  23. Santín, C.; Doerr, S.H.; Chafer, C.J. Ash deposition during wildfire and its threat to water quality. In Advances in Forest Fire Research; Imprensa da Universidade de Coimbra: Coimbra, Portugal, 2014; Volume 4, pp. 1658–1660. [Google Scholar]
  24. Writer, J.H.; Hohner, A.; Oropeza, J.; Schmidt, A.; Cawley, K.M.; Rosario-Ortiz, F.L. Water treatment implications after the High Park Wildfire, Colorado. J. Am. Water Works Assoc. 2014, 106, E189–E199. [Google Scholar] [CrossRef]
  25. Miller, R.; Nielsen, E.; Huang, C.-H. Ecosystem Service Valuation through Wildfire Risk Mitigation: Design, Governance, and Outcomes of the Flagstaff Watershed Protection Project (FWPP). Forests 2017, 8, 142. [Google Scholar] [CrossRef]
  26. Nunes, J.P.; Doerr, S.H.; Sheridan, G.; Neris, J.; Santín, C.; Emelko, M.B.; Silins, U.; Robichaud, P.R.; Elliot, W.J.; Keizer, J. Assessing water contamination risk from vegetation fires: Challenges, opportunities and a framework for progress. Hydrol. Process. 2018, 32, 687–694. [Google Scholar] [CrossRef] [Green Version]
  27. Delpla, I.; Jung, A.-V.; Baures, E.; Clement, M.; Thomas, O. Impacts of climate change on surface water quality in relation to drinking water production. Environ. Int. 2009, 35, 1225–1233. [Google Scholar] [CrossRef]
  28. Scott, J.; Helmbrecht, D.; Thompson, M.P.; Calkin, D.E.; Marcille, K. Probabilistic assessment of wildfire hazard and municipal watershed exposure. Nat. Hazards 2012, 64, 707–728. [Google Scholar] [CrossRef] [Green Version]
  29. Robinne, F.-N.; Miller, C.; Parisien, M.-A.; Emelko, M.; Bladon, K.; Silins, U.; Flannigan, M. A global index for mapping the exposure of water resources to wildfire. Forests 2016, 7, 22. [Google Scholar] [CrossRef]
  30. Santos, R.M.B.; Sanches Fernandes, L.F.; Pereira, M.G.; Cortes, R.M.V.; Pacheco, F.A.L. Water resources planning for a river basin with recurrent wildfires. Sci. Total Environ. 2015, 526, 1–13. [Google Scholar] [CrossRef]
  31. Barnes, M.C.; Todd, A.H.; Lilja, R.W.; Barten, P.K. Forests, Water and People: Drinking Water Supply and Forest Lands in the Northeast and Midwest United States; USDA Forest Service: Newtown Square, PA, USA, 2009.
  32. USDA. Forests to Faucets. Available online: https://www.fs.fed.us/ecosystemservices/FS_Efforts/forests2faucets.shtml (accessed on 5 April 2018).
  33. Todd, A.H.; Weidner, E. Valuing drinking water as an ecosystem service. Pinchot Lett. 2010, Winter, 10–13. [Google Scholar]
  34. Weidner, E.; Todd, A.H. From the Forest to the Faucet Methods Paper; USDA Forest Service: Washington, DC, USA, 2011.
  35. Hallema, D.W.; Robinne, F.-N.; Bladon, K.D. Reframing the challenge of lobal wildfire threats to water supplies. Earth’s Future 2018, 6, 772–776. [Google Scholar] [CrossRef]
  36. UNISDR. Terminology on Disaster Risk Reduction. Available online: https://www.unisdr.org/we/inform/terminology (accessed on 25 January 2019).
  37. Ecological Stratification Working Group (ESWG). A National Ecological Framework for Canada; Centre for Land and Biological Resources Research, Research Branch, Agriculture and Agri-Food Canada: Ottawa, ON, Canada, 1995. [Google Scholar]
  38. Environment and Climate Change Canada Canadian Climate Normals 1981–2010 Station Data. Available online: http://climate.weather.gc.ca/climate_normals/results_1981_2010_e.html?stnID=1641&autofwd=1 (accessed on 20 May 2018).
  39. Water Survey of Canada HYDAT—Historical Hydrometric Data extracted from Environment and Climate Change Canada’s HYDAT.mdb. Available online: https://wateroffice.ec.gc.ca/mainmenu/historical_data_index_e.html (accessed on 20 May 2018).
  40. Natural Resources of Canada, Canadian Forest Service National Fire Database. Available online: http://cwfis.cfs.nrcan.gc.ca/datamart (accessed on 10 September 2018).
  41. Tymstra, C.; Wang, D.; Rogeau, M.-P. Alberta Wildfire Regime Analysis; Alberta Sustainable Resource Development, Ed.; Government of Alberta: Edmonton, AB, Canada, 2005.
  42. Parisien, M.-A.; Miller, C.; Parks, S.A.; DeLancey, E.R.; Robinne, F.-N.; Flannigan, M.D. The spatially varying influence of humans on fire probability in North America. Environ. Res. Lett. 2016, 11, 075005. [Google Scholar] [CrossRef] [Green Version]
  43. Robinne, F.-N.; Parisien, M.-A.; Flannigan, M. Anthropogenic influence on wildfire activity in Alberta, Canada. Int. J. Wildl. Fire 2016, 25, 1131. [Google Scholar] [CrossRef]
  44. Johnston, L.M.; Flannigan, M.D. Mapping Canadian wildland fire interface areas. Int. J. Wildl. Fire 2018, 27, 1–14. [Google Scholar] [CrossRef]
  45. Héon, J.; Arseneault, D.; Parisien, M.-A. Resistance of the boreal forest to high burn rates. Proc. Natl. Acad. Sci. USA 2014, 111, 13888–13893. [Google Scholar] [CrossRef] [PubMed] [Green Version]
  46. Tymstra, C.; Flannigan, M.D.; Armitage, O.B.; Logan, K.A. Impact of climate change on area burned in Alberta’s boreal forest. Int. J. Wildl. Fire 2007, 16, 153–160. [Google Scholar] [CrossRef]
  47. Rogeau, M.-P.; Flannigan, M.D.; Hawkes, B.C.; Parisien, M.-A.; Arthur, R. Spatial and temporal variations of fire regimes in the Canadian Rocky Mountains and Foothills of southern Alberta. Int. J. Wildl. Fire 2016, 25, 1117. [Google Scholar] [CrossRef]
  48. Hanes, C.C.; Wang, X.; Jain, P.; Parisien, M.; Little, J.M.; Flannigan, M.D. Fire-regime changes in Canada over the last half century. Can. J. For. Res. 2018, 256–269. [Google Scholar] [CrossRef]
  49. Wang, X.; Parisien, M.-A.; Taylor, S.W.; Candau, J.-N.; Stralberg, D.; Marshall, G.A.; Little, J.M.; Flannigan, M.D. Projected changes in daily fire spread across Canada over the next century. Environ. Res. Lett. 2017, 12, 025005. [Google Scholar] [CrossRef]
  50. Government of Alberta; AMEC Earth & Environmental. Water for Life—Current and Future Water Use in Alberta; Government of Alberta: Edmonton, AB, Canada, 2007.
  51. Pernitsky, D.J.; Guy, N.D. Closing the South Saskatchewan River basin to new water licences: Effects on municipal water supplies. Can. Water Resour. J. 2010, 35, 79–92. [Google Scholar] [CrossRef]
  52. Government of Alberta. Alberta Population Projections—Alberta and Census Divisions, 2018-2046; Government of Alberta: Edmonton, AB, Canada, 2018.
  53. Front Range Watershed Protection Data Refinement Work Group. Protecting Critical Watersheds in Colorado from Wildfire: A Technical Approach to Watershed Assessment and Prioritization; USDA Forest Service: Denver, CO, USA, 2009.
  54. Environmental Systems Research Institute. Arc Hydro Tools—Tutorial; ESRI: Redlands, CA, USA, 2009; p. 136. [Google Scholar]
  55. Environmental Systems Research Institute. ArcGIS: Release 10.5 for Desktop; ESRI: Redlands, CA, USA, 2017. [Google Scholar]
  56. Kienzle, S.W.; Mueller, M. Mapping Alberta’s surface water resources for the period 1971–2000. Can. Geogr. 2013, 57, 506–518. [Google Scholar] [CrossRef]
  57. Seneka, M. Trends in Historical Annual Flows for Major Rivers in Alberta; Alberta Environment: Edmonton, AB, Canada, 2004. [Google Scholar]
  58. Agriculture and Agri-Food Canada PFRA Sub-basins of the AAFC Watersheds Project; Government of Canada: Ottawa, ON, Canada, 2013.
  59. Alberta Biodiversity Monitoring Institute Wall-to-Wall Land Cover Map 2010 Version 2.1. Available online: https://abmi.ca/home/data-analytics/da-top/da-product-overview/GIS-Land-Surface/Land-Cover.html (accessed on 25 January 2018).
  60. Van Wagner, C. Development and Structure of the Canadian Forest Fire Weather Index System; Canadian Forestry Service, Ed.; Government of Canada: Ottawa, ON, Canada, 1987.
  61. Stocks, B.J.; Lawson, B.D.; Alexander, M.E.; Van Wagner, C.E.; McAlpine, R.S.; Lynham, T.J.; Dubé, D.E. The Canadian Forest Fire Danger Rating System: An overview. For. Chron. 1989, 65, 450–457. [Google Scholar] [CrossRef]
  62. Wang, X.; Wotton, B.M.; Cantin, A.S.; Parisien, M.-A.; Anderson, K.; Moore, B.; Flannigan, M.D. CFFDRS: An R package for the Canadian Forest Fire Danger Rating System. Ecol. Process. 2017, 6, 5. [Google Scholar] [CrossRef]
  63. Flannigan, M.D.; Harrington, J.B. A study of the relation of meteorological variables to monthly provincial area burned by wildfire in Canada (1953–80). J. Appl. Meteorol. 1988, 27, 441–452. [Google Scholar] [CrossRef]
  64. Wotton, B.M.; Nock, C.A.; Flannigan, M.D. Forest fire occurrence and climate change in Canada. Int. J. Wildl. Fire 2010, 19, 253. [Google Scholar] [CrossRef]
  65. Girardin, M.-P.; Tardif, J.; Flannigan, M.D.; Wotton, B.M.; Bergeron, Y. Trends and periodicities in the Canadian Drought Code and their relationships with atmospheric circulation for the southern Canadian boreal forest. Can. J. For. Res. 2004, 34, 103–119. [Google Scholar] [CrossRef]
  66. Anderson, K. A climatologically based long-range fire growth model. Int. J. Wildl. Fire 2010, 19, 879. [Google Scholar] [CrossRef]
  67. Amiro, B.D.; Logan, K.A.; Wotton, B.M.; Flannigan, M.D.; Todd, J.B.; Stocks, B.J.; Martell, D.L. Fire weather index system components for large fires in the Canadian boreal forest. Int. J. Wildl. Fire 2004, 13, 391. [Google Scholar] [CrossRef]
  68. Parisien, M.-A.; Parks, S.A. An analysis of controls on fire activity in boreal Canada: Comparing models built with different temporal resolutions. Ecol. Appl. 2014, 24, 1341–1356. [Google Scholar] [CrossRef] [PubMed]
  69. Wang, X.; Thompson, D.K.; Marshall, G.A.; Tymstra, C.; Carr, R.; Flannigan, M.D. Increasing frequency of extreme fire weather in Canada with climate change. Clim. Change 2015, 130, 573–586. [Google Scholar] [CrossRef]
  70. Pianosi, F.; Beven, K.; Freer, J.; Hall, J.W.; Rougier, J.; Stephenson, D.B.; Wagener, T. Sensitivity analysis of environmental models: A systematic review with practical workflow. Environ. Model. Softw. 2016, 79, 214–232. [Google Scholar] [CrossRef] [Green Version]
  71. Brown, T.C.; Hobbins, M.T.; Ramirez, J.A. Spatial distribution of water supply in the coterminous United States. J. Am. Water Resour. Assoc. 2008, 44, 1474–1487. [Google Scholar] [CrossRef]
  72. Canadian Interagency Forest Fire Center Inc. Canada Report 2017; Canadian Interagency Forest Fire Center Inc.: Winnipeg, MB, Canada, 2006. [Google Scholar]
  73. KPMG May 2016 Wood Buffalo Wildfire, Post-Incident Assessment Report; Government of Alberta: Edmonton, AB, Canada, 2017.
  74. Thurton, D. Fort McMurray seeing big spike in water-treatment costs. CBC News Edmonton. 2017. Available online: https://www.cbc.ca/news/canada/edmonton/fort-mcmurray-wildfire-water-treatment-costs-contaminants-1.3973249 (accessed on 9 March 2019).
  75. Curtis, P.; Gillis, H. (Eds.) 2016 Annual Report Fort McMurray Waterworks System Approval No.: 690-02-05; Alberta Environment and Parks: Edmonton, AB, Canada, 2017. [Google Scholar]
  76. Government of Alberta. Alberta Environment’s Drinking Water Program—A ‘Source to Tap, Multi-Barrier’ Approach; Alberta Environment: Edmonton, AB, Canada, 2009.
  77. Government of Alberta. Water Act—Revised Statutes of Alberta 2000; Alberta Queen’s Printer: Edmonton, AB, Canada, 2000.
  78. Government of Alberta. Water for Life—Action Plan; Government of Alberta: Edmonton, AB, Canada, 2009.
  79. Government of Alberta. Standards and Guidelines for Municipal Waterworks, Wastewater and Storm Drainage Systems; Reid, D., Ed.; Alberta Queen’s Printer: Edmonton, AB, Canada, 2012.
  80. Government of Alberta. Forest and Prairie Protection Act—Revised Statutes of Alberta 2000; Alberta Queen’s Printer: Edmonton, AB, Canada, 2014.
  81. Alberta Sustainable Resource Development. Land-Use Framework Alberta; Government of Alberta: Edmonton, AB, Canada, 2008.
  82. Alberta Agriculture and Forestry Wildfire Operations. Available online: http://wildfire.alberta.ca/operations/default.aspx (accessed on 17 February 2019).
  83. Federal-Provincial-Territorial Committee on Drinking Water. From Source to Tap: Guidance on the Multi-Barrier Approach to Safe. Drinking Water; Canadian Council of Ministers of the Environment: Winnipeg, MB, Canada, 2004.
  84. Perrier, E.; Kot, M.; Castleden, H.; Gagnon, G.A. Drinking water safety plans: Barriers and bridges for small systems in Alberta, Canada. Water Policy 2014, 16, 1140–1154. [Google Scholar] [CrossRef]
  85. Charrois, J.W.A.; Graham, D.; Hrudey, S.E.; Froese, K.L. Disinfection by-products in small Alberta community drinking-water supplies. J. Toxicol. Environ. Health Part A 2004, 67, 1797–1803. [Google Scholar] [CrossRef]
  86. Islam, N.; Sadiq, R.; Rodriguez, M.J.; Francisque, A. Reviewing source water protection strategies: A conceptual model for water quality assessment. Environ. Rev. 2011, 19, 68–105. [Google Scholar] [CrossRef]
  87. Buckley, M.; Beck, N.; Bowden, P.; Miller, M.E.; Hill, B.; Luce, C.; Elliot, W.J.; Enstice, N.; Podolak, K.; Winford, E.; et al. Mokelumne Watershed Avoided Cost Analysis: Why Sierra Fuel Treatments Make Economic Sense; USDA Forest Service: Auburn, CA, USA, 2014.
  88. Arizona Rural Policy Institute; Alliance Bank Business Outreach Center. Flagstaff Watershed Protection Project Cost Avoidance Study; Flagstaff Watershed Protection Project Monitoring Committee, Ed.; Arizona Rural Policy Institute: Flagstaff, AZ, USA, 2014. [Google Scholar]
  89. Rodrigues, E.L.; Jacobi, C.M.; Figueira, J.E.C. Wildfires and their impact on the water supply of a large neotropical metropolis: A simulation approach. Sci. Total Environ. 2019, 651, 1261–1271. [Google Scholar] [CrossRef]
  90. Murphy, B.P.; Yocom, L.L.; Belmont, P. Beyond the 1984 perspective: Narrow focus on modern wildfire trends underestimates future risks to water security. Earth’s Future 2018, 6, 1492–1497. [Google Scholar] [CrossRef]
  91. Moncrieff-Gould, G.; Quigley, K.; Burns, C. Strengthening the Resilience of the Canadian Water Sector; MacEachen Institute, Dalhousie University: Halifax, NS, Canada, 2018. [Google Scholar]
  92. Norman, E.S.; Dunn, G.; Bakker, K.; Allen, D.M.; Cavalcanti de Albuquerque, R. Water security assessment: Integrating governance and freshwater indicators. Water Resour. Manag. 2013, 27, 535–551. [Google Scholar] [CrossRef]
  93. Dunn, G. Canadian Water Security Assessment Framework; Bakker, K., Allen, D.M., Eds.; Canadian Water Network: Waterloo, ON, Canada, 2015. [Google Scholar]
  94. Bakker, K.; Cook, C. Water governance in Canada: Innovation and fragmentation. Int. J. Water Resour. Dev. 2011, 27, 275–289. [Google Scholar] [CrossRef]
  95. Dunn, G.; Bakker, K. Fresh water-related indicators in Canada: An inventory and analysis. Can. Water Resour. J. 2011, 36, 135–148. [Google Scholar] [CrossRef]
  96. Patrick, R.J. Uneven access to safe drinking water for First Nations in Canada: Connecting health and place through source water protection. Health Place 2011, 17, 386–389. [Google Scholar] [CrossRef]
  97. Marshall, R.E.; Levison, J.K.; Mcbean, E.A.; Brown, E.; Harper, S.L. Source water protection programs and Indigenous communities in Canada and the United States: A scoping review. J. Hydrol. 2018, 562, 358–370. [Google Scholar] [CrossRef]
  98. Smith, D.W.; Guest, R.K.; Svrcek, C.P.; Farahbakhsh, K. Public health evaluation of drinking water systems for First Nations reserves in Alberta, Canada. J. Environ. Eng. Sci. 2006, 5, S1–S17. [Google Scholar] [CrossRef]
  99. Natural Resources Canada Social Aspects of Wildfire Management. Available online: https://www.nrcan.gc.ca/forests/fire-insects-disturbances/fire/14444 (accessed on 26 February 2019).
  100. Christianson, A. Social science research on indigenous wildfire management in the 21st Century and future research needs. Int. J. Wildl. Fire 2015, 24, 190–200. [Google Scholar] [CrossRef]
  101. Kelly, E.N.; Schindler, D.W.; St. Louis, V.L.; Donald, D.B.; Vladicka, K.E. Forest fire increases mercury accumulation by fishes via food web restructuring and increased mercury inputs. Proc. Natl. Acad. Sci. USA 2006, 103, 19380–19385. [Google Scholar] [CrossRef] [Green Version]
  102. Biswas, A.; Blum, J.D.; Klaue, B.; Keeler, G.J. Release of mercury from Rocky Mountain forest fires. Glob. Biogeochem. Cycles 2007, 21, GB1002. [Google Scholar] [CrossRef]
  103. Ranalli, A.J.; Stevens, M.R. Streamwater Quality Data from the 2002 Hayman, Hinman, and Missionary Ridge Wildfires, Colorado, 2003; U.S. Geological Survey: Reston, VA, USA, 2004.
  104. Silins, U.; Anderson, A.; Bladon, K.D.; Emelko, M.B.; Stone, M.; Spencer, S.A.; Williams, C.H.S.; Wagner, M.J.; Martens, A.M.; Hawthorn, K. Southern Rockies Watershed Project: Impact of Natural Disturbance by Wildfire on Hydrology, Water Quality, and Aquatic Ecology of Rocky Mountain Watersheds Phase I (2004-2008); Alberta Sustainable Resource Development: Edmonton, AB, Canada, 2009. [Google Scholar]
  105. Webster, K.L.; Beall, F.D.; Creed, I.F.; Kreutzweiser, D.P. Impacts and prognosis of natural resource development on water and wetlands in Canada’s boreal zone. Environ. Rev. 2015, 23, 78–131. [Google Scholar] [CrossRef] [Green Version]
  106. Burn, D.H.; Sharif, M.; Zhang, K. Detection of trends in hydrological extremes for Canadian watersheds. Hydrol. Process. 2010, 24, 1781–1790. [Google Scholar] [CrossRef]
  107. Wotton, M.B.; Flannigan, M.D.; Marshall, G.A. Potential climate change impacts on fire intensity and key wildfire suppression thresholds in Canada. Environ. Res. Lett. 2017, 12, 095003. [Google Scholar] [CrossRef] [Green Version]
  108. Mosley, L.M. Drought impacts on the water quality of freshwater systems; review and integration. Earth-Sci. Rev. 2015, 140, 203–214. [Google Scholar] [CrossRef]
  109. Wheater, H.; Gober, P. Water security in the Canadian Prairies: Science and management challenges. Philos. Trans. R. Soc. A Math. Phys. Eng. Sci. 2013, 371, 20120409. [Google Scholar] [CrossRef] [PubMed]
  110. Canadian Water Network. 2014 Canadian Municipal Water Priorities Report; Canadian Water Network: Waterloo, ON, Canada, 2014. [Google Scholar]
  111. Ebel, B.A.; Mirus, B.B. Disturbance hydrology: Challenges and opportunities. Hydrol. Process. 2014, 28, 5140–5148. [Google Scholar] [CrossRef]
  112. Fergus, C.E.; Lapierre, J.-F.; Oliver, S.K.; Skaff, N.K.; Cheruvelil, K.S.; Webster, K.; Scott, C.; Soranno, P. The freshwater landscape: Lake, wetland, and stream abundance and connectivity at macroscales. Ecosphere 2017, 8, e01911. [Google Scholar] [CrossRef]
  113. Nielsen, S.; DeLancey, E.; Reinhardt, K.; Parisien, M.-A. Effects of Lakes on Wildfire Activity in the Boreal Forests of Saskatchewan, Canada. Forests 2016, 7, 265. [Google Scholar] [CrossRef]
  114. Forestry Canada Fire Danger Group. Development of the Canadian Forest Fire Behavior Prediction System—Information Report ST-X-3; Forestry Canada: Ottawa, ON, Canada, 1992.
  115. Price, J.I.J.I.; Renzetti, S.; Dupont, D.; Adamowicz, W.; Emelko, M.B. Production costs, inefficiency, and source water quality: A stochastic cost frontier analysis of Canadian water utilities. Land Econ. 2017, 93, 1–11. [Google Scholar] [CrossRef]
  116. Cecco, L. Fire and Water. Available online: http://www.theglobeandmail.com/news/alberta/wildfires-have-major-impact-on-waterquality/article30512613/ (accessed on 13 September 2018).
  117. EPCOR Water Services Inc. Source Water Protection Plan—Edmonton’s Drinking Water System; EPCOR Water Services Inc.: Edmonton, AB, Canada, 2017. [Google Scholar]
  118. EPCOR Water Services Inc. Source Water Protection Plan—City of Calgary; EPCOR Water Services Inc.: Calgary, AB, Canada, 2017. [Google Scholar]
Figure 1. Details of the study area, including: (a) the location of drinking-water treatment facilities reliant on surface water supplies from forested watersheds in Alberta (symbol size indicates population size class served by the utility) and historic spatial distribution of large fires (>200 ha) [40]; (b) the location of Alberta in North America; (c) Alberta terrain (elevation); and (d) Alberta forest cover.
Forests 10 00384 g001
Figure 2. Grid inputs used in the Source Exposure Index, including: (a) the water yield per unit area, (b) the percent forest cover per watershed, and (c) the mean of the 95th percentile of the fire danger per watershed of interest. We only used raster grid values located in the watersheds of interest in the calculation of the Source Exposure Index.
Forests 10 00384 g002
Figure 3. Flowchart describing the incremental steps for the creation of the Source Exposure Index (SEI), representing inputs, geoprocessing, and outputs. Adapted from Weidner and Todd (2011). Note that interim indicators are created following an incremental design that builds on the output of the previous step and updates it with the values of a new input. Blue parallelograms represent additional inputs, rectangles represent processes, green parallelograms represent interim indicators, and pink parallelogram represents the final composite index.
Forests 10 00384 g003
Figure 4. (a) Source Exposure Index for forested watersheds providing drinking water in Alberta. Higher values indicate higher exposure levels. (b) Wildfire exposure index for forested watersheds providing drinking water in Alberta as a result of the sensitivity analysis where the forest layer was set to its mean value. Higher values indicate higher exposure levels.
Forests 10 00384 g004
Figure 5. Distribution of Source Exposure Index scores for utilities serving variable number of consumers, with very small, small, and large systems serving less than 500, 500 to 5000, and more than 5000 people, respectively.
Forests 10 00384 g005
Figure 6. Scatterplots showing the relationship between the SEI score per source watershed and the three variables used to compute the index, namely the water yield, the forest cover, and the Fire Weather Index. The size of the dots are scaled by number of consumers served per drinking-water treatment plant, with very small, small, and large systems serving less than 500, 500 to 5000, and more than 5000 people, respectively. The shade of the dots helps to visualize change in the values of the different variables, darker tones showing greater values than lighter tones.
Forests 10 00384 g006
Table 1. Datasets used in the Source Exposure Index (SEI). Mean and Standard Deviation (SD) are for the raster grids extracted using the forested watersheds only.
VariableProxySourceYearUnitMean (SD)
ConsumersSource watershed & watershed importanceGovernment of Alberta, Government of Canada2013Number of people26,000 (94,900)
WatershedsDistance to water intakeGovernment of Alberta2013km215,000 (27,000)
Water yieldQuantity of water supply provided per watershedEnvironment Canada, University of Lethbridge2013m3 km−2 yr−1116,000 (125,000)
Forest percent coverProtective forest cover per watershedAlberta Biodiversity Monitoring Institute, Environment Canada2013%52.2
(33.3)
Fire Weather IndexExtreme fire hazard threatening water protection forestsEnvironment Canada, Canadian Forest Service2015Unitless26.7
(9.2)
Table 2. Correlation coefficients between input variables and the exposure index. Values relative to the total amount of downstream consumers (TC), a raster grid of population distribution, were added to the analysis.
LayerConsumersWater YieldForest CoverFire HazardSEI
Consumers (TC)1
Water yield (Q)0.091
Forest cover (FOR)−0.190.321
Fire danger (FID)−0.05−0.63−0.641
Exposure index (SEI)0.250.340.51−0.121

