Article

Combining Global Remote Sensing Products with Hydrological Modeling to Measure the Impact of Tropical Forest Loss on Water-Based Ecosystem Services

by
Michael S. Netzer
1,*,
Gabriel Sidman
1,
Timothy R.H. Pearson
1,
Sarah M. Walker
2 and
Raghavan Srinivasan
3
1
Winrock International, 2121 Crystal Drive #500, Arlington, VA 22202, USA
2
Parkview Square, 600 North Bridge Road #10-01, Singapore 188778, Singapore
3
Texas A & M University, Department of Ecosystem Science and Management, 534 John Kimbrough Blvd, College Station, TX 778430-2120, USA
*
Author to whom correspondence should be addressed.
Forests 2019, 10(5), 413; https://doi.org/10.3390/f10050413
Submission received: 15 April 2019 / Revised: 5 May 2019 / Accepted: 8 May 2019 / Published: 13 May 2019
(This article belongs to the Special Issue Managing Forests and Water for People under a Changing Environment)

Abstract

:
In the Lower Mekong River Basin (LMB), deforestation rates are some of the highest in the world as land is converted primarily into intensive agriculture and plantations. While this has been a key for the region’s economic development, rural populations dependent on the freshwater water resources that support their fishing and agriculture industries are increasingly vulnerable to the impacts of flood, drought and non-point source pollution. Impacts of deforestation on ecosystem services (ES) including hydrological ES that control the availability and quality of fresh water across the landscape, regulating floods and droughts, soil erosion and non-point source pollution are known. Despite this understanding at the hillslope level, few studies have been able to quantify the impact of wide-scale deforestation on larger tropical watersheds. This study introduces a new methodology to quantify the impact of deforestation on water-based ES in the LMB with a focus on Cambodia by combining spatial datasets on forest loss from remote sensing and spatially-explicit hydrological modeling. Numerous global and regional remote sensing products are synthesized to develop detailed land use change maps for 2001 to 2013 for the LMB, which are then used as inputs into a hydrological model to develop unique spatial datasets that map ES changes due to deforestation across the LMB. The results point to a clear correlation between forest loss and surface runoff, with a weaker but upward trending relationship between forest loss and sediment yield. This resulted in increased river discharge for 17 of the 22 watersheds, and increased sediment for all 22 watersheds. While there is considerable variability between watersheds, these results could be helpful for prioritizing interventions to decrease deforestation by highlighting which areas have experienced the greatest change in water-based ES provision. These results are also presented in a web-based platform called the Watershed Ecosystem Service Tool.

1. Introduction

1.1. The Importance of Water-Based Ecosystem Services Provided by Forests

It is well recognized that forests are important sinks for carbon dioxide (CO2), mitigating the impacts of global climate change [1]. It is estimated that the greenhouse gas (GHG) emissions that result from tropical deforestation contribute 7%–14% of total global anthropogenic CO2 emissions [2,3,4]. However, carbon emissions are just one of the ecosystem services (ES) benefits of forests, and some have suggested that hydrological services could be seen as more important for their impacts to local communities, as vital resources for downstream industry and users, and even as large scale regulators of regional climates through transpiration and cloud formation [5,6,7,8].
As a hydrological regulator, natural forests and their trees slow the flow of water across the earth’s surface reducing runoff and enhancing soil infiltration that can in some cases increase groundwater recharge [9,10,11]. Vegetation and roots control the erosion of soil and nutrients, and slow above ground runoff which can increase ground water infiltration that filters and purifies the ground and surface water [10,12]. At the same time, the slow percolation of water through the soil profile in a mature forest often slows the rate of water returning to the river and can help maintain river base flows during dry periods and avoid flash floods that are exacerbated by high runoff rates [12,13]. In contrast, deforestation that results in the conversion of land to agriculture, plantation and other types of typical development can often increase surface runoff which disturbs soils, causes water pollution, and creates a large demand on groundwater resources [8,14]. During high rainfall events these types of land use changes can lead to flashfloods, and lower groundwater recharge rates in the wet season can lead to well water shortages in the dry season [13]. Increased runoff from agricultural lands can lead to non-point source pollution from excessive nutrients from organic and inorganic fertilizer in the rivers and lakes leading to eutrophication that can devastate fisheries, and at extreme levels be poisonous to humans [8,14,15].
In Cambodia, which makes up a large portion of the Lower Mekong Basin (LMB), some of the key ES provided by forests include the regulation of water flow and filtration, seasonal flooding and soil nutrient cycling, carbon sequestration and biodiversity [16,17,18]. These ES are critical to the region’s major industries, fishing and agriculture, which depend on seasonal wet season flows for lowland rice, and for healthy fish stocks [16,19,20]. Cambodia’s inland freshwater fishery is one of the largest in the world, yielding around 1.2 million tons of fish per year, employing about 2 million people, and is vital for food security for the vast majority of Cambodians [21]. Agriculture, primarily lowland rice, is the largest industry in Cambodia, making up 35% of GDP and employing around 56% of the labor force [22]. Rice production is not only vital for domestic food security in the region, but is also 90% of Cambodia’s economic exports, making it the cornerstone of its global income [21,23,24]. At the same time a significant portion of rural Cambodians depend directly on forest products for things like fuel, timber and non-timber forest production [25].
Agricultural production has grown over the last decade facilitating significant drops in poverty from 48% in 2007 to 18% in 2012, and a doubling of per capita GDP between 1998 and 2007, making Cambodia one of the fastest growing economies in the world [24]. About 90% of the poor are in rural areas and most of the population remain highly vulnerable to poverty and are dependent on the availability of natural resources from freshwater and forest for a significant portion of their incomes [24,26]. Thus, forest and the ES that they provide support a significant portion of Cambodia’s livelihoods and economy and act as an important buffer against the impacts of climate change. At the same time this economic development has contributed to Cambodia having one of the highest deforestation rates in the world [27,28]. Therefore, Cambodia and its people are at risk of losing vital ES that support their economy, livelihoods and provide a buffer against the potential impacts of climate change [23].

1.2. Quantifying the Impact of Deforestation at the Large Watershed Level

Within the LMB and around the world it is increasingly evident that the impacts of land use changes on ES are costly to land owners, companies, and to society in general in the short term, and especially over the long-term [29,30,31,32]. However, decision makers in developing countries often lack the tools to assess at any scale the impact of land use change on ES, and to tie ES impacts together within the larger landscape for a more holistic and integrated assessment [5,31]. This is especially true for the dynamics between tropical deforestation and water-based ES given that few methodologies exist for studying this impact [31]. Studies that use stream gauge and other field measurements to assess impacts cannot decouple variability in other factors through time, including rainfall, water abstractions for human use and post-conversion land uses which make it difficult to isolate the impact of forest loss alone [13]. One solution to this problem is hydrological modeling, which can create scenarios that isolate land cover change from other changes on the landscape [33,34]. However, hydrological modeling of tropical forest loss at the landscape level in the LMB has been limited by the lack of a consistent, spatially-explicit land cover mapping series that allow for explicit linkages between the loss of forest cover and change in hydrological indicators [33,35]. Where tropical land cover change maps have been created, they are only for small watersheds and not replicated across entire landscapes [36,37,38].
Over the last decade global remote sensing products have begun to map deforestation and land cover annually with a high degree of accuracy, allowing for consistent wall-to-wall mapping of land cover changes at the landscape level anywhere in the world [27,39,40]. These products have largely been developed in the context of Reducing Emissions from Deforestation and Forest Degradation (REDD) programs and have largely been utilized to measure greenhouse gas (GHG) emissions [41,42]. In large part this has been driven by the demand from the international community after the Kyoto Protocol in 1997 and the establishment of the UNFCCC to mitigate the amount of GHG emission and impacts of climate change [43]. However, less attention has been paid to using these products for assessing impacts of hydrological conditions [5]. This is in part because of the complex and dynamic nature of the hydrological cycle [44]; but today with improving hydrological modeling and remote sensing data land surface modeling has evolved to a state where they can provide realistic depictions of the water cycle over large scales with acceptable errors when driven by accurate meteorological data [44,45,46,47]. This data has the potential to help quantify the impact of deforestation on water-based ES over large areas and consistently across different parts of the world, showing which regions, watersheds and sub-watersheds have been most impacted by tree cover loss. Decision-makers in tropical countries could better understand what areas are more prone to larger floods and landslides as a result of deforestation or prioritize areas to prevent further deforestation to mitigate negative water-based impacts.
This study uses a global tree cover and tree-loss dataset from Hansen et al. (2013) [27] combined with other global, regional and local spatial datasets on land use to create yearly land use/land cover change (LULCC) maps across Cambodia. The Hansen et al. (2013) [27] dataset analyzed a time series of images Landsat satellites to detect where forest has been lost each year between 2001 and 2013. The dataset is the first global forest loss layer, which provides a unique opportunity to compare and contrast the magnitude of forest loss across large landscapes and a relatively high resolution of 900 m2 pixels. The maps are used as inputs into the Soil and Water Assessment Tool (SWAT) hydrological model to show spatially how deforestation impacts hydrological indicators of water-based ES across the LMB. The SWAT results are validated using available ground data and compared against local and regional peer-reviewed studies to help ensure results are accurately representing actual conditions.
The output of the study will provide a better understanding of the impacts of forest cover loss on water-based ES in the LMB, and an assessment of the potential for using existing land cover change data and hydrological modeling to understand those impacts.

2. Materials and Methods

The study required development of a land use/land cover change (LULCC) map for the LMB from existing global and regional remote sensing productions, then separately running the land cover maps for 2001 and 2013 through a hydrological model to assess the impacts that forest loss had on water-based ES. Model calibration occurred through use of seven different hydrological gauging stations in Cambodia, and through comparisons with regional peer-reviewed studies on erosion and sediment loss rates. Forest loss and the impact to water-based ES was assessed through multiple regressions, and spatial analysis of SWAT derived sub-basins and the major watersheds that make up the LMB.

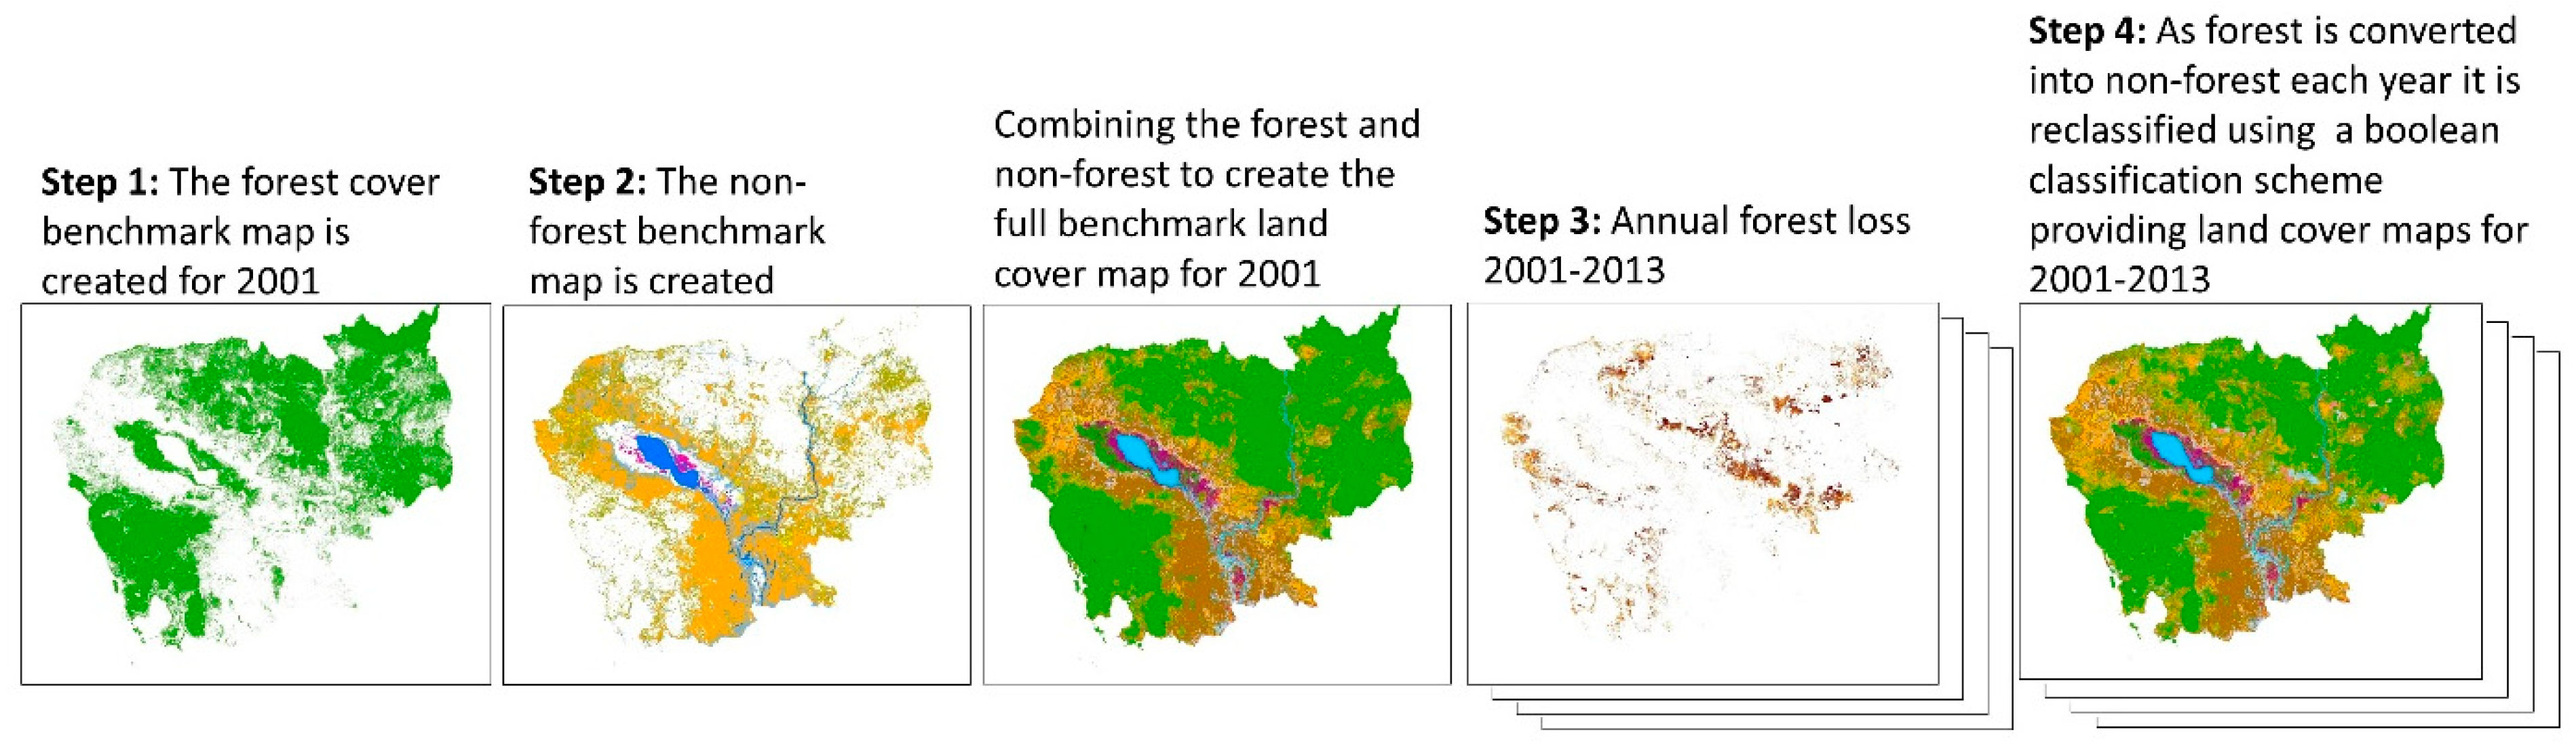
2.1. Developing the Land Use/Land Cover Change Map

The development of annual LULCC maps relied on a compilation of maps from different published sources. The process of development took a stepwise approach:
  • Establish a forest cover benchmark map for 2001: The benchmark map included a combination of the following datasets:
    (a)
    The 2001 forest cover dataset from Hansen et al., (2013) [27] at the 30 × 30-m Landsat resolution. This dataset was used for all upland evergreen forests.
    (b)
    A map of dry deciduous dipterocarp forest of Southeast Asia developed by Wohlfart et al., 2014 [48].
    (c)
    A wetland forest map developed by combining the Hansen et al. (2013) [27] 2001 forest cover map and the extent of the 2002 flood in Cambodia from the Mekong River Commission [49].
  • Establish non-forest classes in the benchmark map: Non-forest classes from the European Space Agency’s 300 m resolution Globe Land Cover (GLC) product for 2015 [50] were used to determine land use in non-forest areas of the benchmark land cover/land use map.
  • Establishing land use changes over time: Deforestation was identified as forest loss from the Hansen et al. (2013) forest loss dataset. The forest loss dataset provides annual forest loss from 2000 to 2013. The forest loss dataset was used to create a new land cover map for each year (see “classifying deforestation areas”). It is with this dataset that annual LULCC maps were created. Hansen’s forest loss methodology was updated after 2013 affecting comparability between the data produced pre and post 2013. Therefore, this analysis focused only on the years up till 2013.
  • Classifying deforested areas: Deforested areas from the Hansen et al. (2013) forest loss dataset were reclassified using a Boolean classification scheme in the following manner:
    • If a deforested area is inside an Economic Land Concession (ELC) granted by the Government of Cambodia, the resulting non-forest class was converted to that ELC’s designated development type. Each concession is designated for some type of development, for example rubber, oil palm or rice. Therefore, if an area deforested inside an ELC that was designated for rubber, the area was assessed to be converted to rubber. The ELC dataset was produced by the Government of Cambodia and distributed by Open Development Cambodia [51].
    • If a deforested area was not in an ELC, the GLC 2015 [50] map was consulted. If the deforestation occurred over a non-forest GLC class, the area was assigned that GLC 2015 class. If the deforested area was occurred over a forested GLC class, the simplifying assumption was made that the area was mosaic cropland (50% cropland and 50% forest).
These steps result in a LULCC maps that show land cover for every year from 2001 to 2013 (Figure 1).
A stakeholder review was conducted (workshop in March 2015 in Phnom Penh) to finalize and agree classifications. During this review, it was determined that for the Cambodian context, the GLC shrubland class should be changed to swidden farming (mosaic cropland) and grassland changed to pasture.

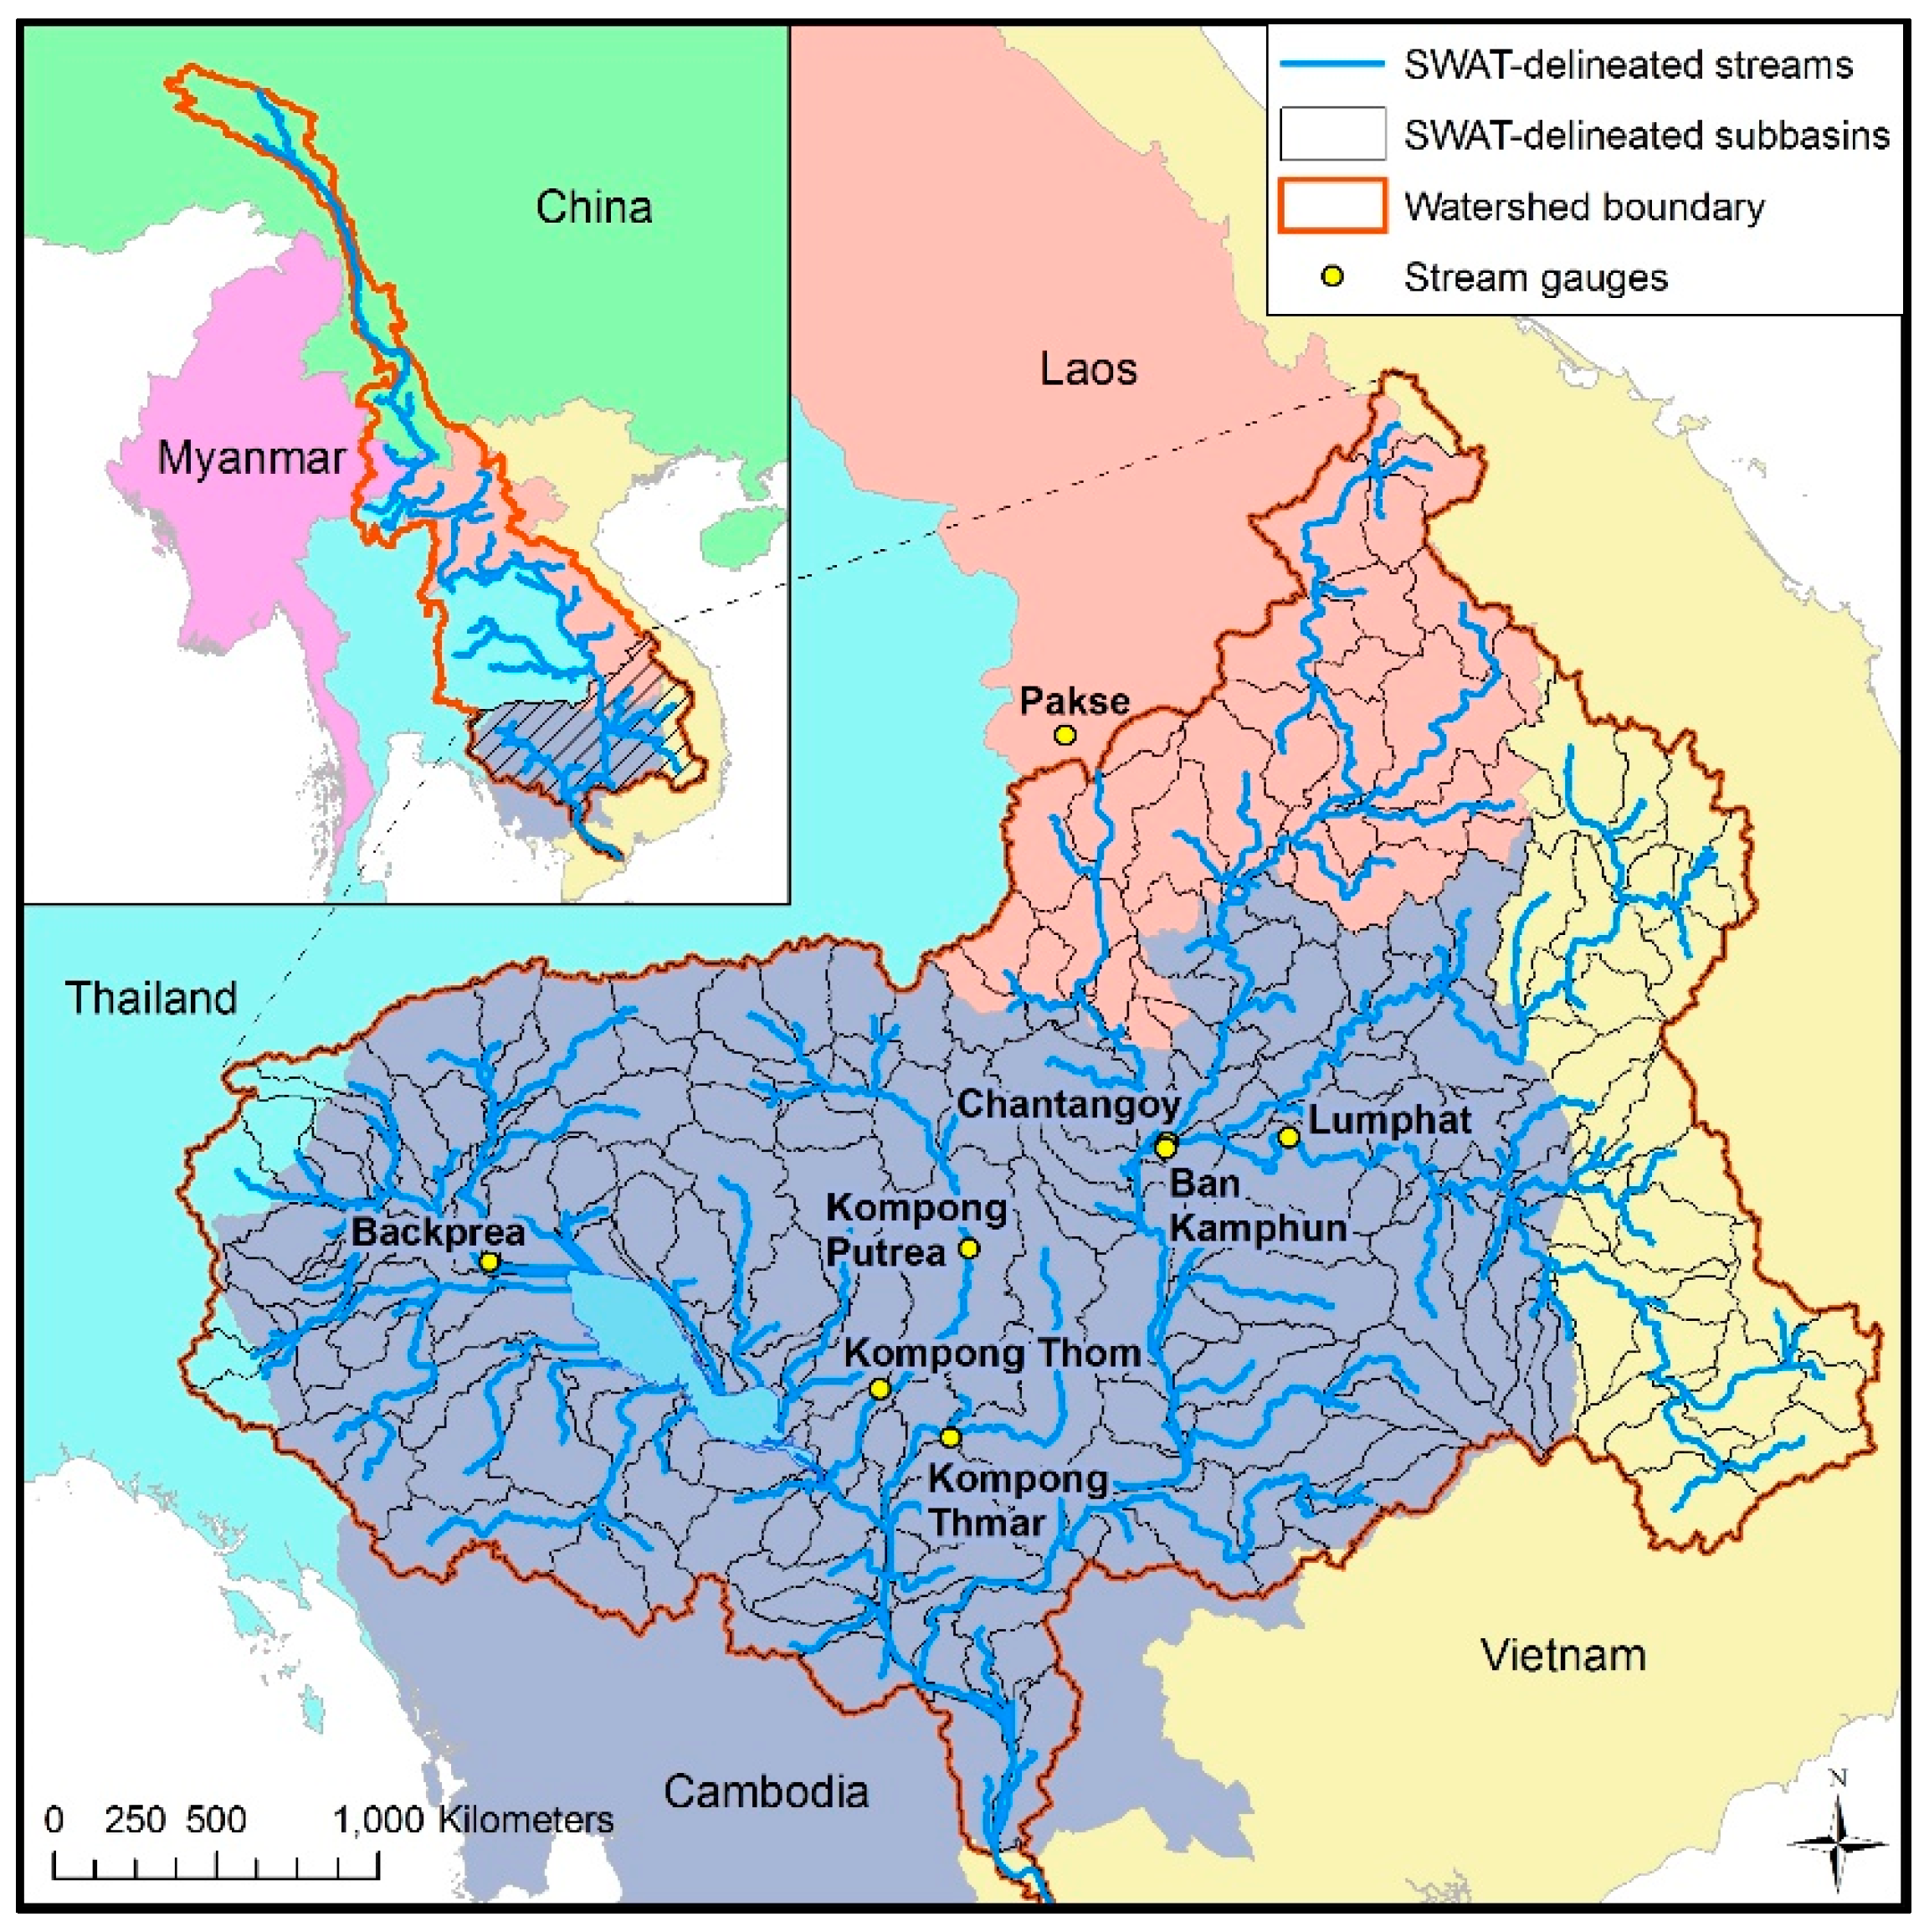
2.2. Developing Hydrological Data

To evaluate ES related to water such as freshwater provision and regulation, groundwater recharge and soil erosion, the SWAT model was used. SWAT was run using the ArcSWAT interface (Available online at: http://swat.tamu.edu/software/arcswat/). SWAT requires the user to input several spatial data sources along with auxiliary tabular data (Table 1).
The (Shuttle Radar Topography Mission) SRTM DEM was used to delineate the Mekong watershed below the town of Pakse, located a few hundred kilometers above the Cambodia border in Laos (Figure 2). The Pakse gauge (a hydrological gauging station maintained by the Mekong River Commission in the town of Pakse) was used to input actual discharge, sediment and nutrient loading parameters into the SWAT model, and therefore enabled modeling below that point in the Mekong River. SWAT performed a watershed segmentation, dividing the larger LMB into sub-watersheds and river segments, or “reaches” to be modeled individually before routing upstream segments into downstream segments. These segments, both watersheds and reaches were assigned an ID, allowing for results to be viewed at different locations throughout the LMB.
SWAT output discharge was calibrated against Mekong River Commission (MRC) stream gauges within Cambodia. This was a process of comparing actual gauging station data for discharge (flow) and sediment concentration (mg L−1) to the SWAT results, then checking and editing the SWAT model to fit the SWAT results as best as possible to the actual discharge and sediment. The calibration period was 1993–2002 which was selected because it was the period with the most consistent and accurate data available from the most number of MRC gauges. Discharge between the SWAT and MRC data was compared at four stations (Chantangoy, Ban Kamphun, Kompong Thom, and Kompong Putra) using two statistical measures: the Nash–Sutcliffe efficiency (NSE) for daily discharge, and a goodness-of-fit R2 statistic for monthly averages. The NSE was developed to assess the accuracy of modeled river discharge by comparing the relative magnitude of the residual variance of the observed data versus the simulated data [59]. The intervals are generally interpreted as follows; 0.75 < NSE < 1 is a “very good” performance rating, 0.65 < NSE < 0.75 is a “good” performance rating, 0.50 < NSE < 0.65 is a “satisfactory” performance rating, and NSE < 0.50 is an “unsatisfactory” performance rating [59]. The monthly R2 statistic was used to show where the model was performing well simulating the monthly trends [59,60]. This helps show that even when the model’s daily NSE was performing poorly it was still representative of the more general monthly trend. The R2 statistic gives the variance of the data and assesses a goodness of fit with 1 indicating perfect fit.
For sediment concentration the MRC data was less consistent therefore the available gauge data was summarized (average, min and max) by month over the same period. Also, not all the stations where there was good discharge data had good sediment data, therefore sediment was calibrated at Kompong Thom, Lumphat, Backprea, and Kompong Thmar (Figure 2). Sediment was assessed using the R2 statistic.
The SWAT model was run twice with the developed LULCC maps from both 2001 and 2013. Other than the LULCC maps, all other parameters in the model remained the same between the two runs so that any changes in results could be directly associated with land cover change and not other variables such as rainfall or development of river infrastructure such as dams. All results are therefore representative of the land uses present in 2001 and 2013.
The effect of forest loss between 2001–2013 on the hydrological cycle and the associated water-based ES was evaluated using SWAT outputs as indicators of these ES. Change was evaluated using surface runoff as an indicator of flood mitigation and sediment yield as an indicator for erosion prevention. In both cases, an increase in these indicators was considered a loss of ES provision, assuming that higher surface runoff leads to more flooding and higher sediment yield is the result of increased erosion. Given that only limited gauges were available for model calibration, results were only measured in percent change rather than absolute values.
Multiple regression analysis was performed to attempt to find variables in the SWAT model that were driving percent change in water-based ES indicators besides general percent forest loss. The percent change in runoff, discharge and sediment indicators were used to estimate which areas of the LMB were most impacted by forest loss from the standpoint of hydrological ES. Percent change indicators have been shown to consistently identify the same areas as high change even in uncalibrated watersheds [61].

3. Results

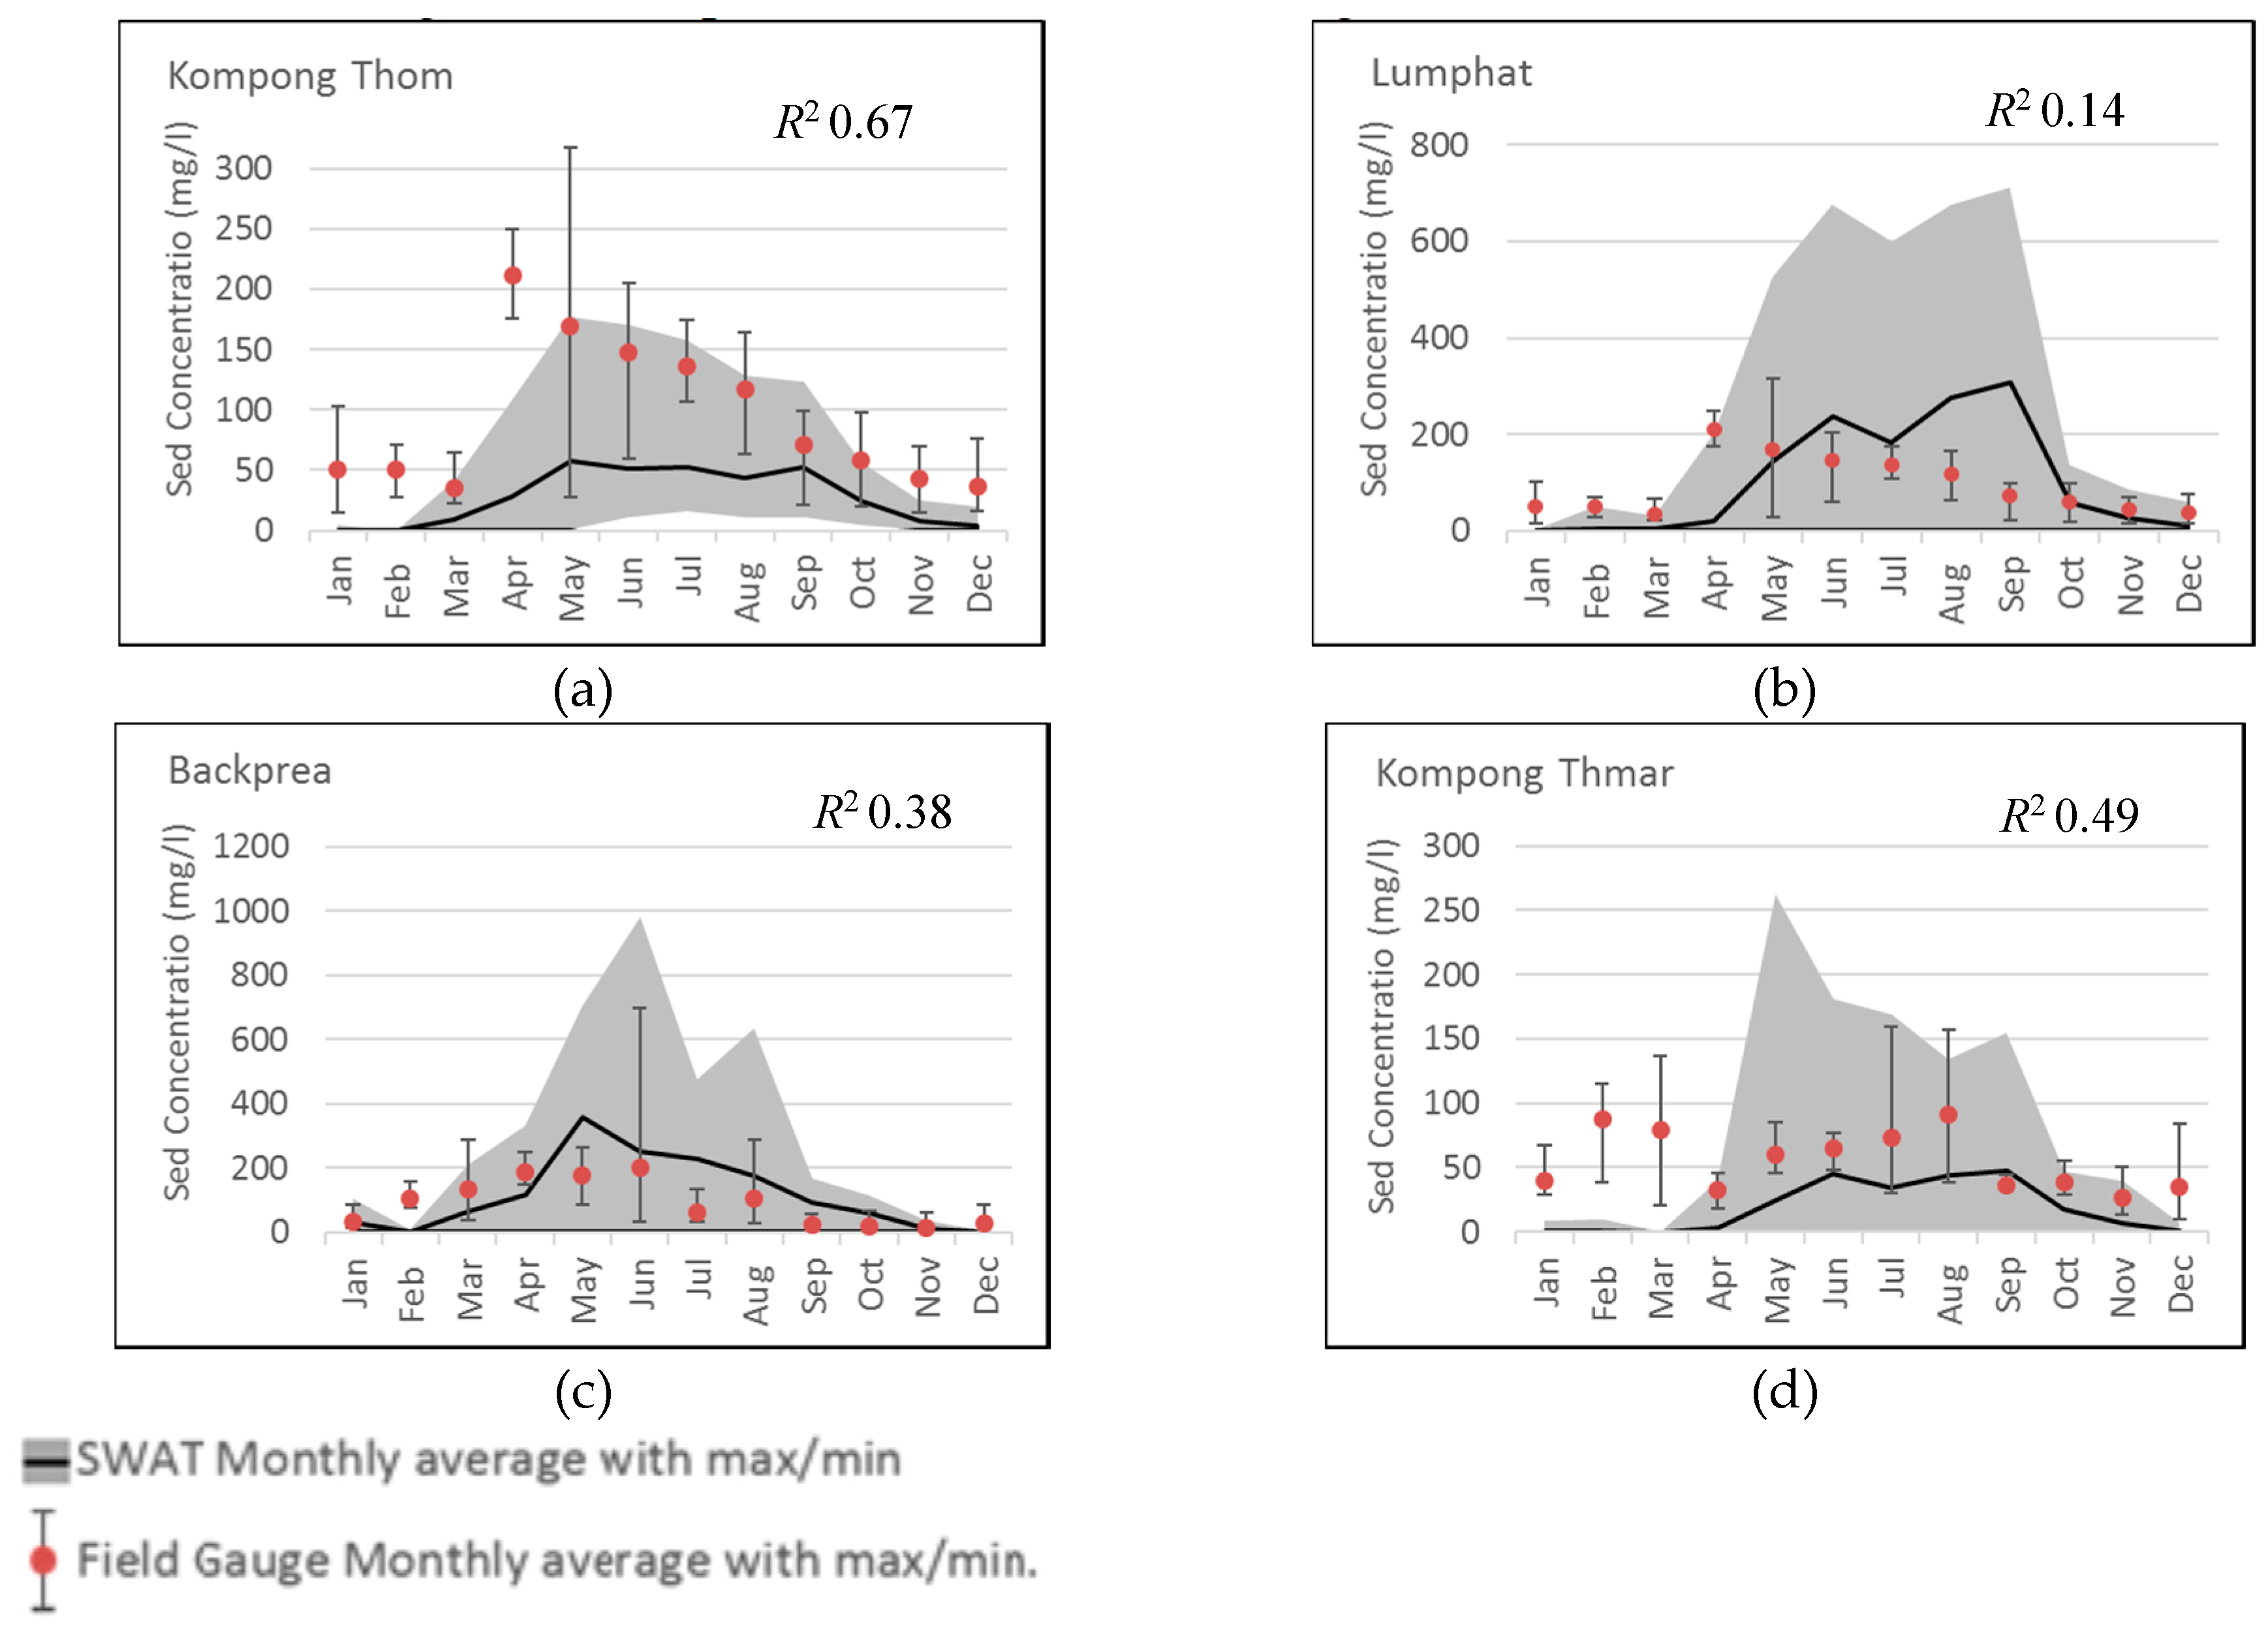
3.1. Calibration of Hydrological Model

The hydrological model was validated at four locations for river flow and four locations for sediment. On average the SWAT model predicted lower flows than the gauges, with some exceptions during high flow periods (Figure 3). The model did better during lower flow events, and in most cases showed a strong correlation with the seasonal fluctuations. While significant improvements could be made on individual watersheds, the goal was to make the model run well across all subwatersheds—mimicking flows—within the lower Mekong without adjusting too many parameters so that the uncertainty and bias of model parameters affected the overall performance. Furthermore, there are a number of dams and other types of hydrological infrastructure that are affecting flows that were not accounted for in the model. This made it unfeasible for a tight calibration of the model without parameterizing the model to account for the dams, which was not a focus of this study. However, improvements could be made with more gauge data, better information on hydrological infrastructure, and improving the model’s distribution of rainfall (e.g., some models are using NEXRAD radar for more accurate spatial distribution of rainfall) [62].
Sediment concentrations were also calibrated at four MRC locations. Despite a few relatively low R2 values, general seasonal fluctuations were well correlated, and most results from MRC gauges fell within the range that was predicted in the SWAT (Figure 4).

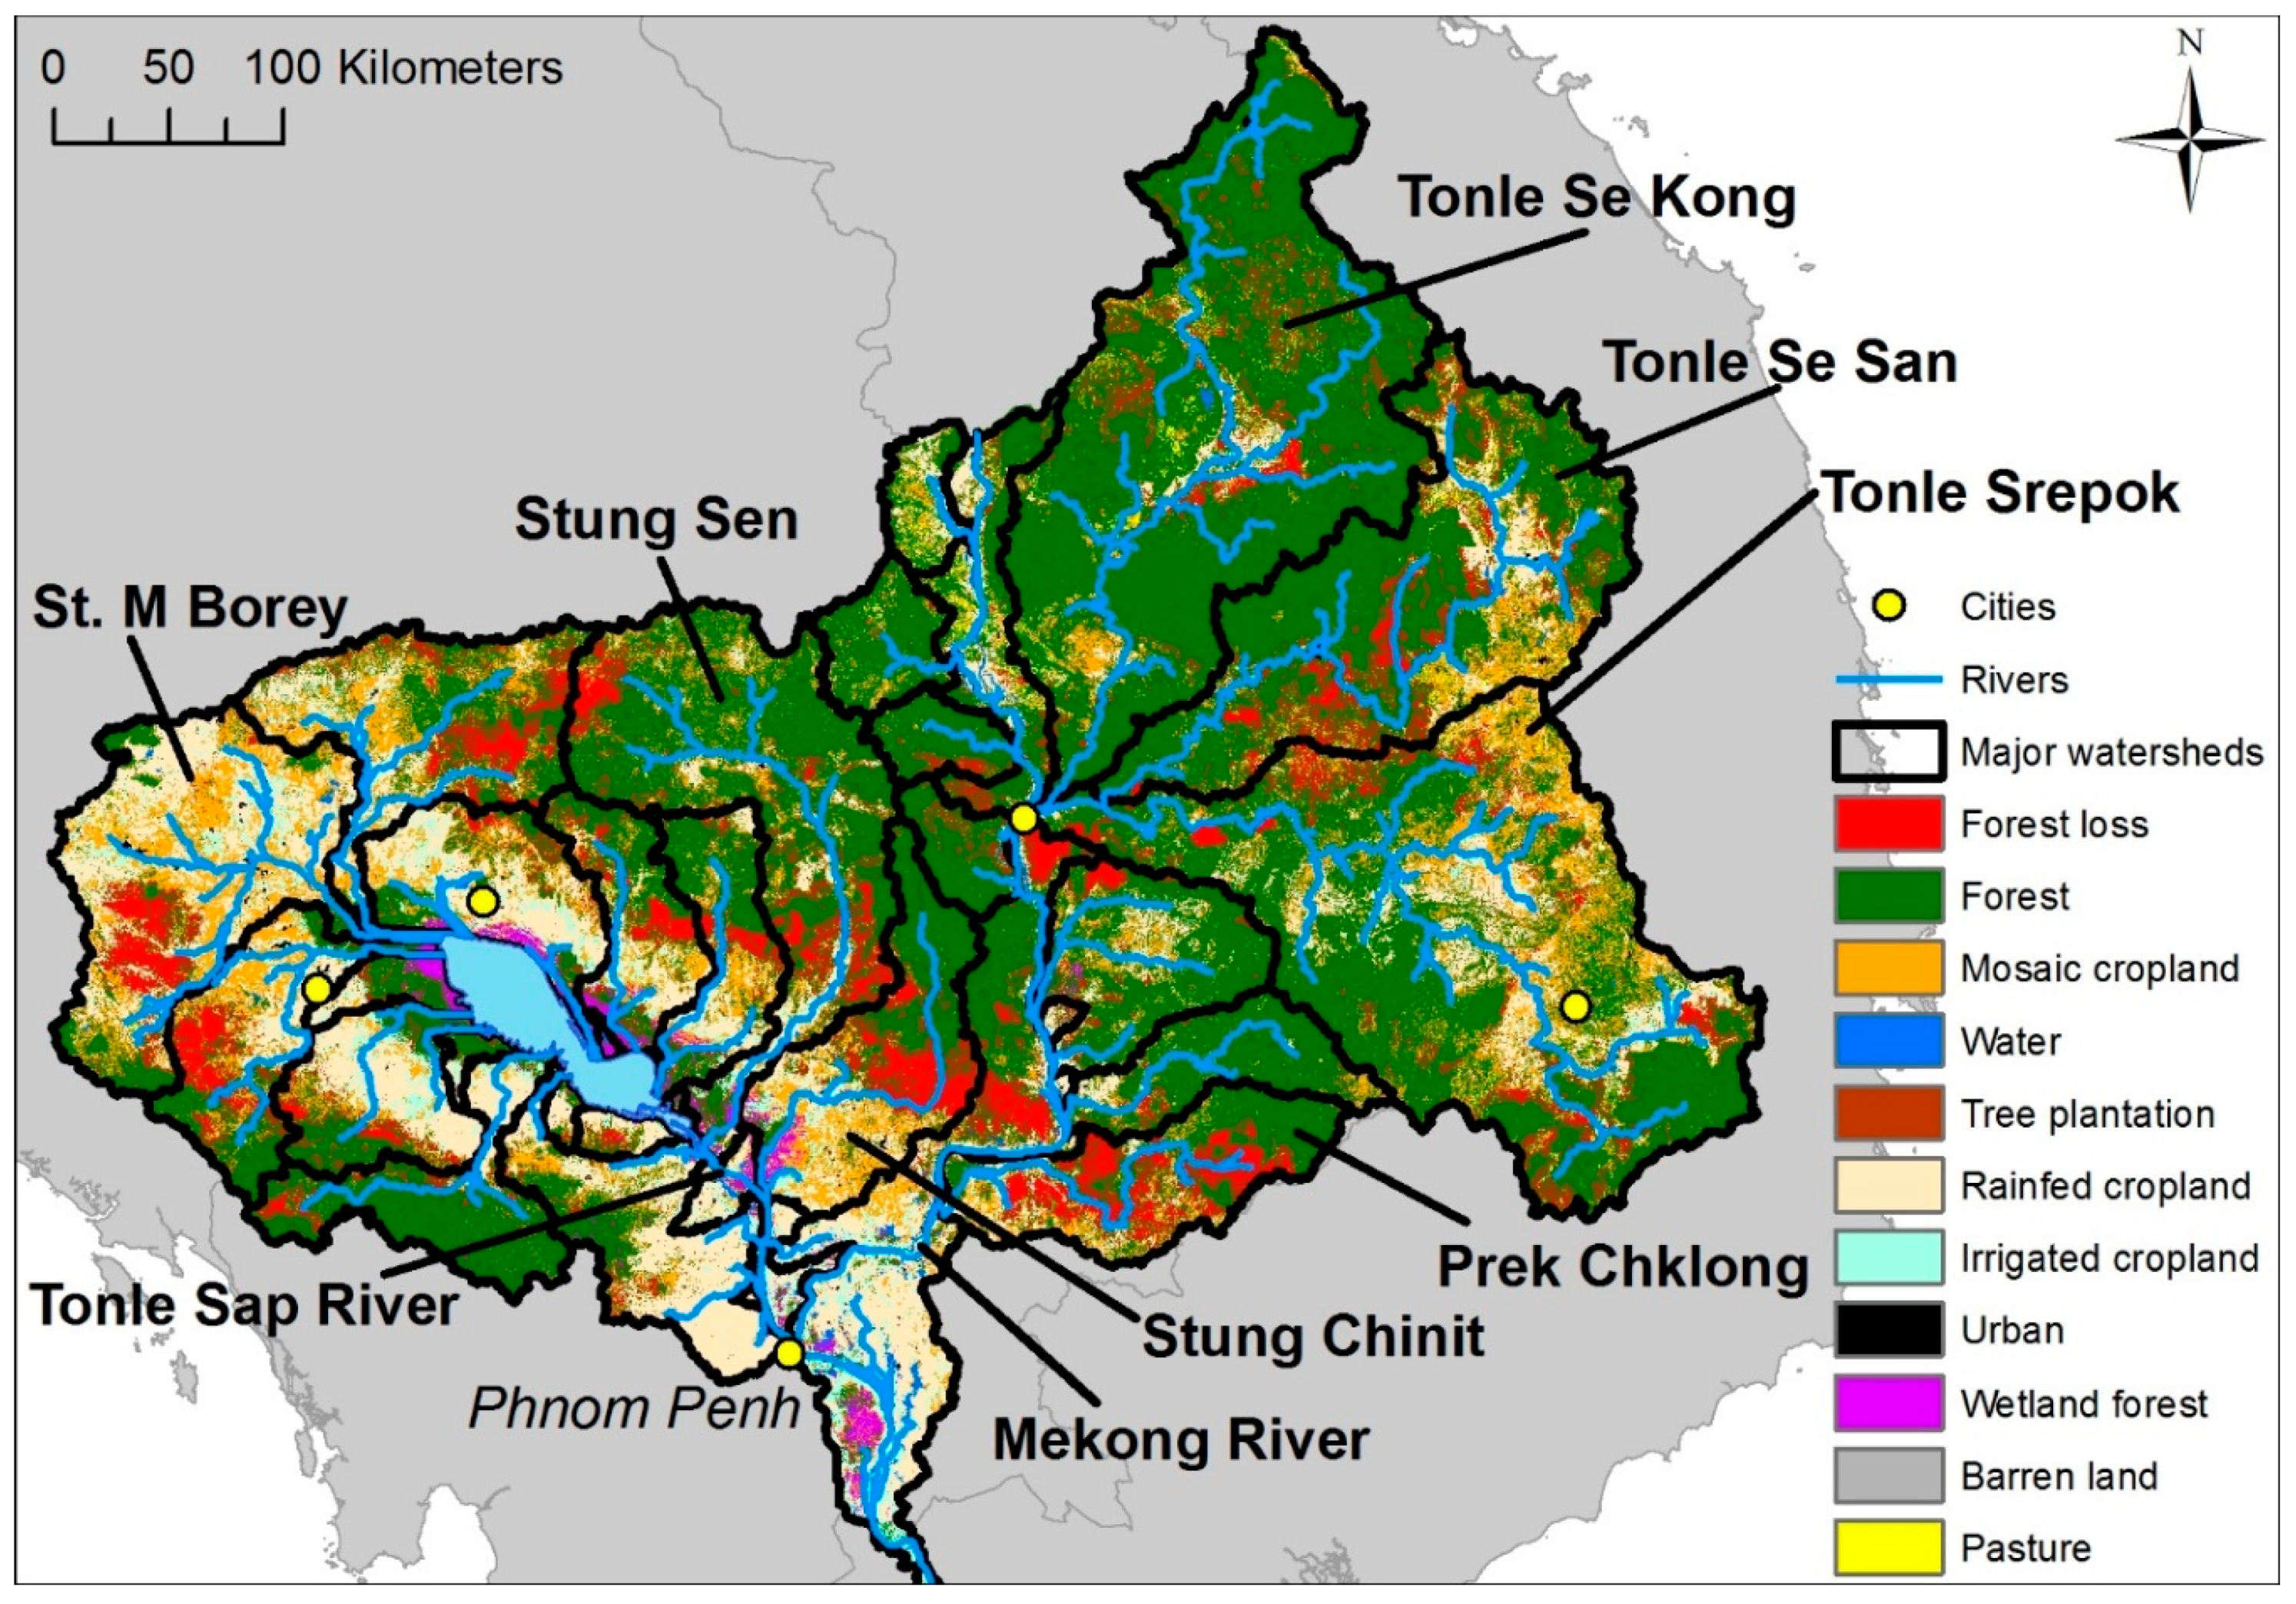
3.2. Land Cover Change due to Forest Loss

Between 2001 and 2013 the LMB lost 13% of its forest area (18,953 km2), with an average annual loss of 1.08% per year (1579 km2) (Figure 5 and Table 2). The majority of forest loss (82%) was conversion to cropland (predominantly rice), which is divided into rainfed mosaic crop land (assumes a mix of crop and fallow/forest land), rainfed crop land, and irrigated crop land. Tree plantations made up 11% of the forest loss, with the remaining 7% pasture and urban development. The major watersheds with the most tree loss were the Tonle Se San and Tonle Srepok (each with about 2000 km2 loss) in the eastern portion of the basin. However, these watersheds were among the largest in size and didn’t lose the most forest in terms of percentage—only 15% and 11% respectively. The watersheds that lost the greatest percentage of their forest area were the Prek Chklong in the south (35%) and the St. M. Boery in the northwest of the basin (34%). The Prek Chklong and St. M. Boery saw their forest replaced almost entirely by agricultural land uses, while the eastern watersheds of Tonle Se Kong, Se San and Srepok also saw a majority of conversion to agriculture but had higher portions of conversion to tree plantations and pasture.

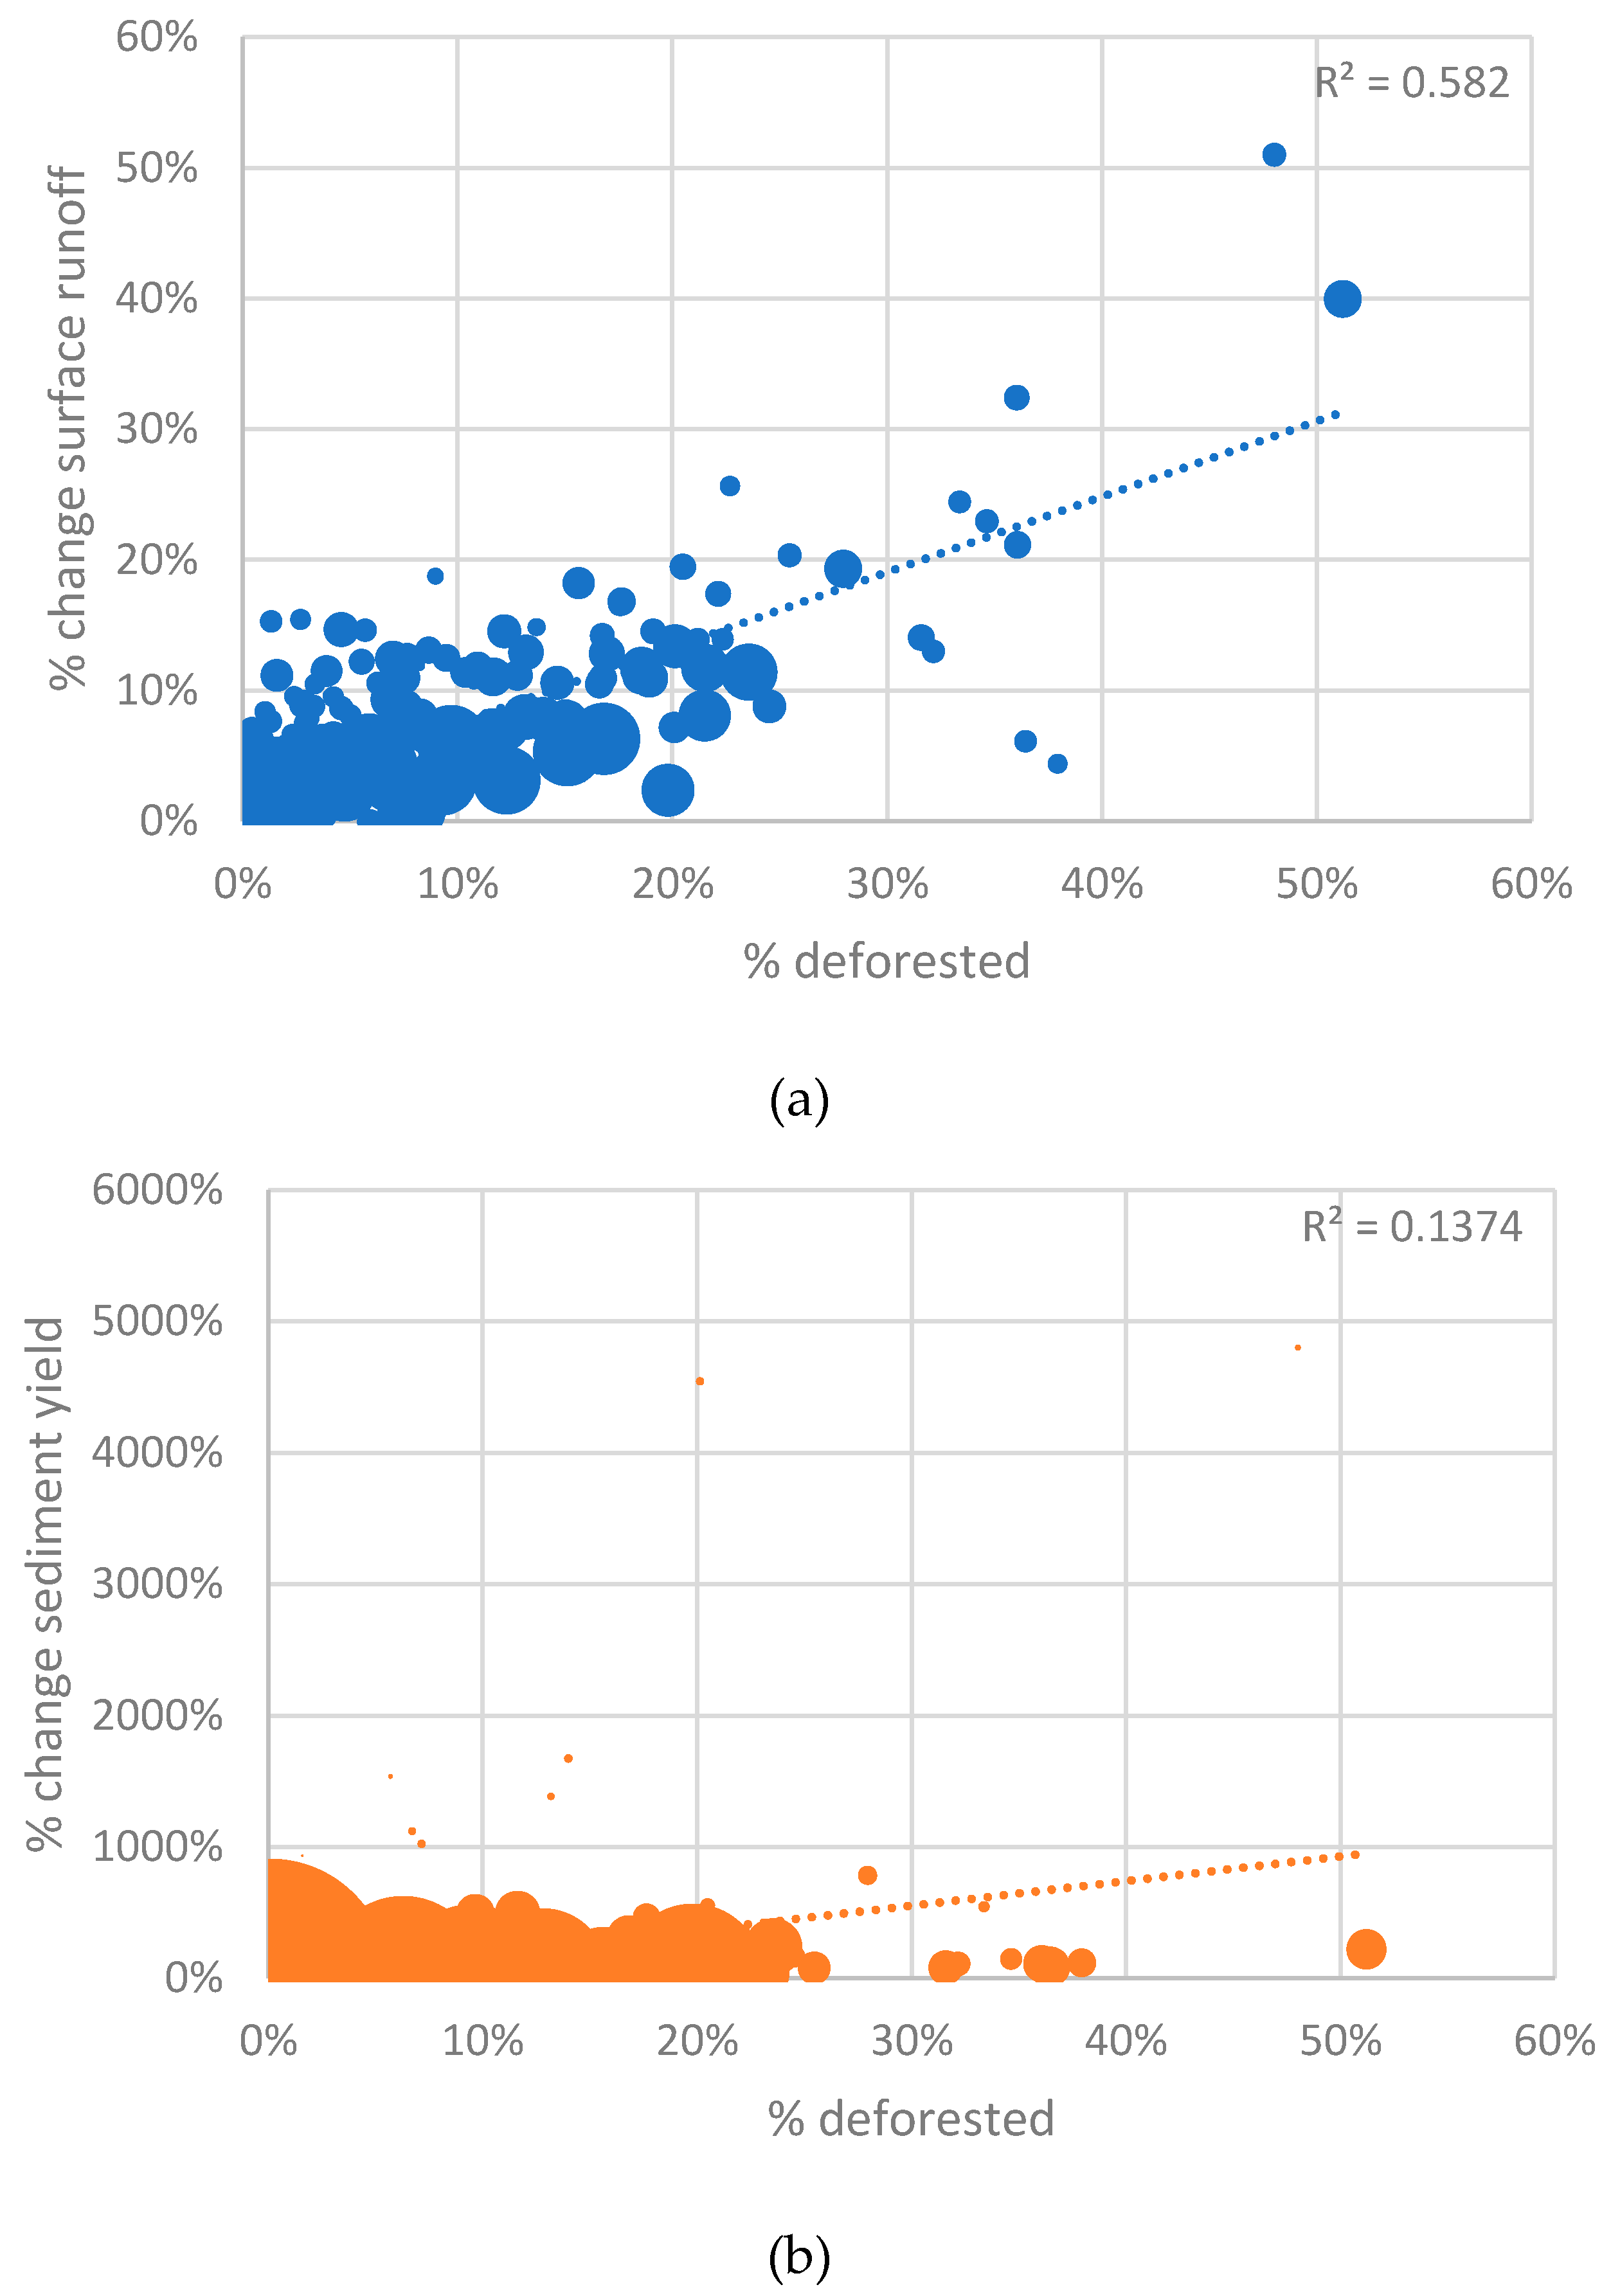
3.3. Correlation between Forest Loss and Hydrological Ecosystem Services

The effect of forest loss between 2001–2013 on water-based ES is presented in Figure 6 as percent change in surface runoff and sediment yield. Increase in these indicators was considered a loss of ES provision, assuming that higher surface runoff leads to more flooding and higher sediment yield is the result of increased erosion.
For both indicators, there was a positive trend between percent of watershed deforested and percent change in surface runoff and sediment yield. However, the correlation for surface runoff was much stronger with an R2 of 0.58 compared to 0.14 for sediment yield (Figure 6). The R2 of the sediment yield relationship appears to be heavily affected by sub-basins with small amounts of absolute yield that experienced large percent changes.
Results from the multiple regression analysis showed that for surface runoff, the highest adjusted R2 achieved was 0.79 by adding three variables: percent change in runoff curve number, rainfall and slope (Table 3). For sediment yield, the highest R2 relationship observed was 0.16 using two variables: percent change in Manning’s “n” for overland flow and absolute sediment yield (t/ha) from 2001.
These results can be seen spatially across the SWAT derived sub-basins (Figure 7). The results show that forest loss is highly correlated with increases in runoff and sediment yield, with 85% of sub-basins with forest loss experiencing an increase in both runoff and sediment yield. However, as the results in Figure 6 show this upward trend is highly variable between sub-basins depending on and the biophysical characteristics mentioned above like runoff curve number, rainfall and slope. Figure 7 highlights ‘hot-spots’ where deforestation results in higher loss to water-based ES.
Figure 7 also shows that increased runoff and sediment yield results in increased river discharge and sediment flow that accumulates downstream.
If we scale up the results to the larger watershed we eliminate the influence of sub-basin size, and because the watersheds are an aggregation across many sub-basins the results are more muted, reducing the extreme highs and lows; however the same trend remains—as deforestation increase so does runoff and sediment yield, which impacts river discharge rates and sediment flows (Table 4).
Across the LMB all watersheds experienced increases in sediment, and 17 of the 22 watersheds had increased discharge. However, the results between watersheds are highly variable depending on the biophysical factors of the watershed (Figure 8). For example, Table 4 shows the Prek Chklong and St. M. Borey watersheds both lost more than 30% of their forest area, but St. M. Borey only had a 3% increase in discharge and 29% increase in sediment yield, compared to Prek Chklok’s 17% increase in discharge and 135% increase in sediment. These differences are the results of M. Borey having lower overall forest area to start with, but also due to biophysical conditions in the watershed, predominantly very low slopes. While variability is high between watersheds, it may be these differences that are important for understanding which watershed are more or less sensitive to the impacts of deforestation on water-based ES. It is also important to understand that percent change is relative to each watershed. Some watersheds may have a small sediment yield to start with and a 100% increase is not going to be extremely impactful. However, percent change does help us understand the magnitude and direction of change, and therefore again highlights watersheds that maybe be more or less sensitive to forest loss.

4. Discussion

The results from the hydrological modeling show that as forest is converted to other land uses there is generally an increase in surface runoff and sediment into the river, however the increases vary greatly by location. These rates of erosion were roughly validated against published reports for Southeast Asia from Douglas (1999) [63] and Sidle et al. (2006) [64]. These results follow general hydrological theory that forests reduce surface runoff and erosion, slowing the flow of water across the ground, promoting infiltration into the soil which is either captured by plants or allowed to filter through the soil to ground water reservoirs or slowly returning to the stream [5,13,65]. The results from this analysis show that existing remote sensing products combined with hydrological modeling can be used across broad spatial scales to improve our understanding of the impacts deforestation has on water-based ES. While the modeling could be improved with better data and more ground calibration, the results are helpful for understanding the direction and magnitude of change of water-based ES for different sub-basins and watersheds.

4.1. Correlation of Forest Loss and Change with Water-Based ES Provision

Modeling results point to a clear relationship between forest loss and surface runoff with a high correlation. This shows that runoff is highly impacted by loss of vegetation, with forest being replaced mostly by agricultural land uses and to a lesser extent tree plantations and urban development, which will likely have detrimental impacts on flood mitigation, and could impede the ability of efficient hydrological management, for example for year-round irrigation. Slope clearly played a role in the impact that forest loss had on surface runoff, with the hilly eastern portion of the LMB showing larger percent change in surface runoff and especially higher river discharge than average. This points to the need for greater efforts to protect forested areas with high slopes.
While there was a correlation between an increase in forest loss and an increase in sediment yield, it was very weak even with multivariable regression. This points to the need for further model calibration with sediment variables, which are often scarcely monitored in the field. Clearly the range of absolute values in sediment yield affected the percent change correlation as well, with many small watersheds with very low sediment yield showing massive increases in percent change with relatively low absolute change in tonnes per hectare. These results may also point to the importance of soil type on sediment yield and erosion, something that is not altered with land use change. Some soils may mitigate the impact of land use change, while others exacerbate it.

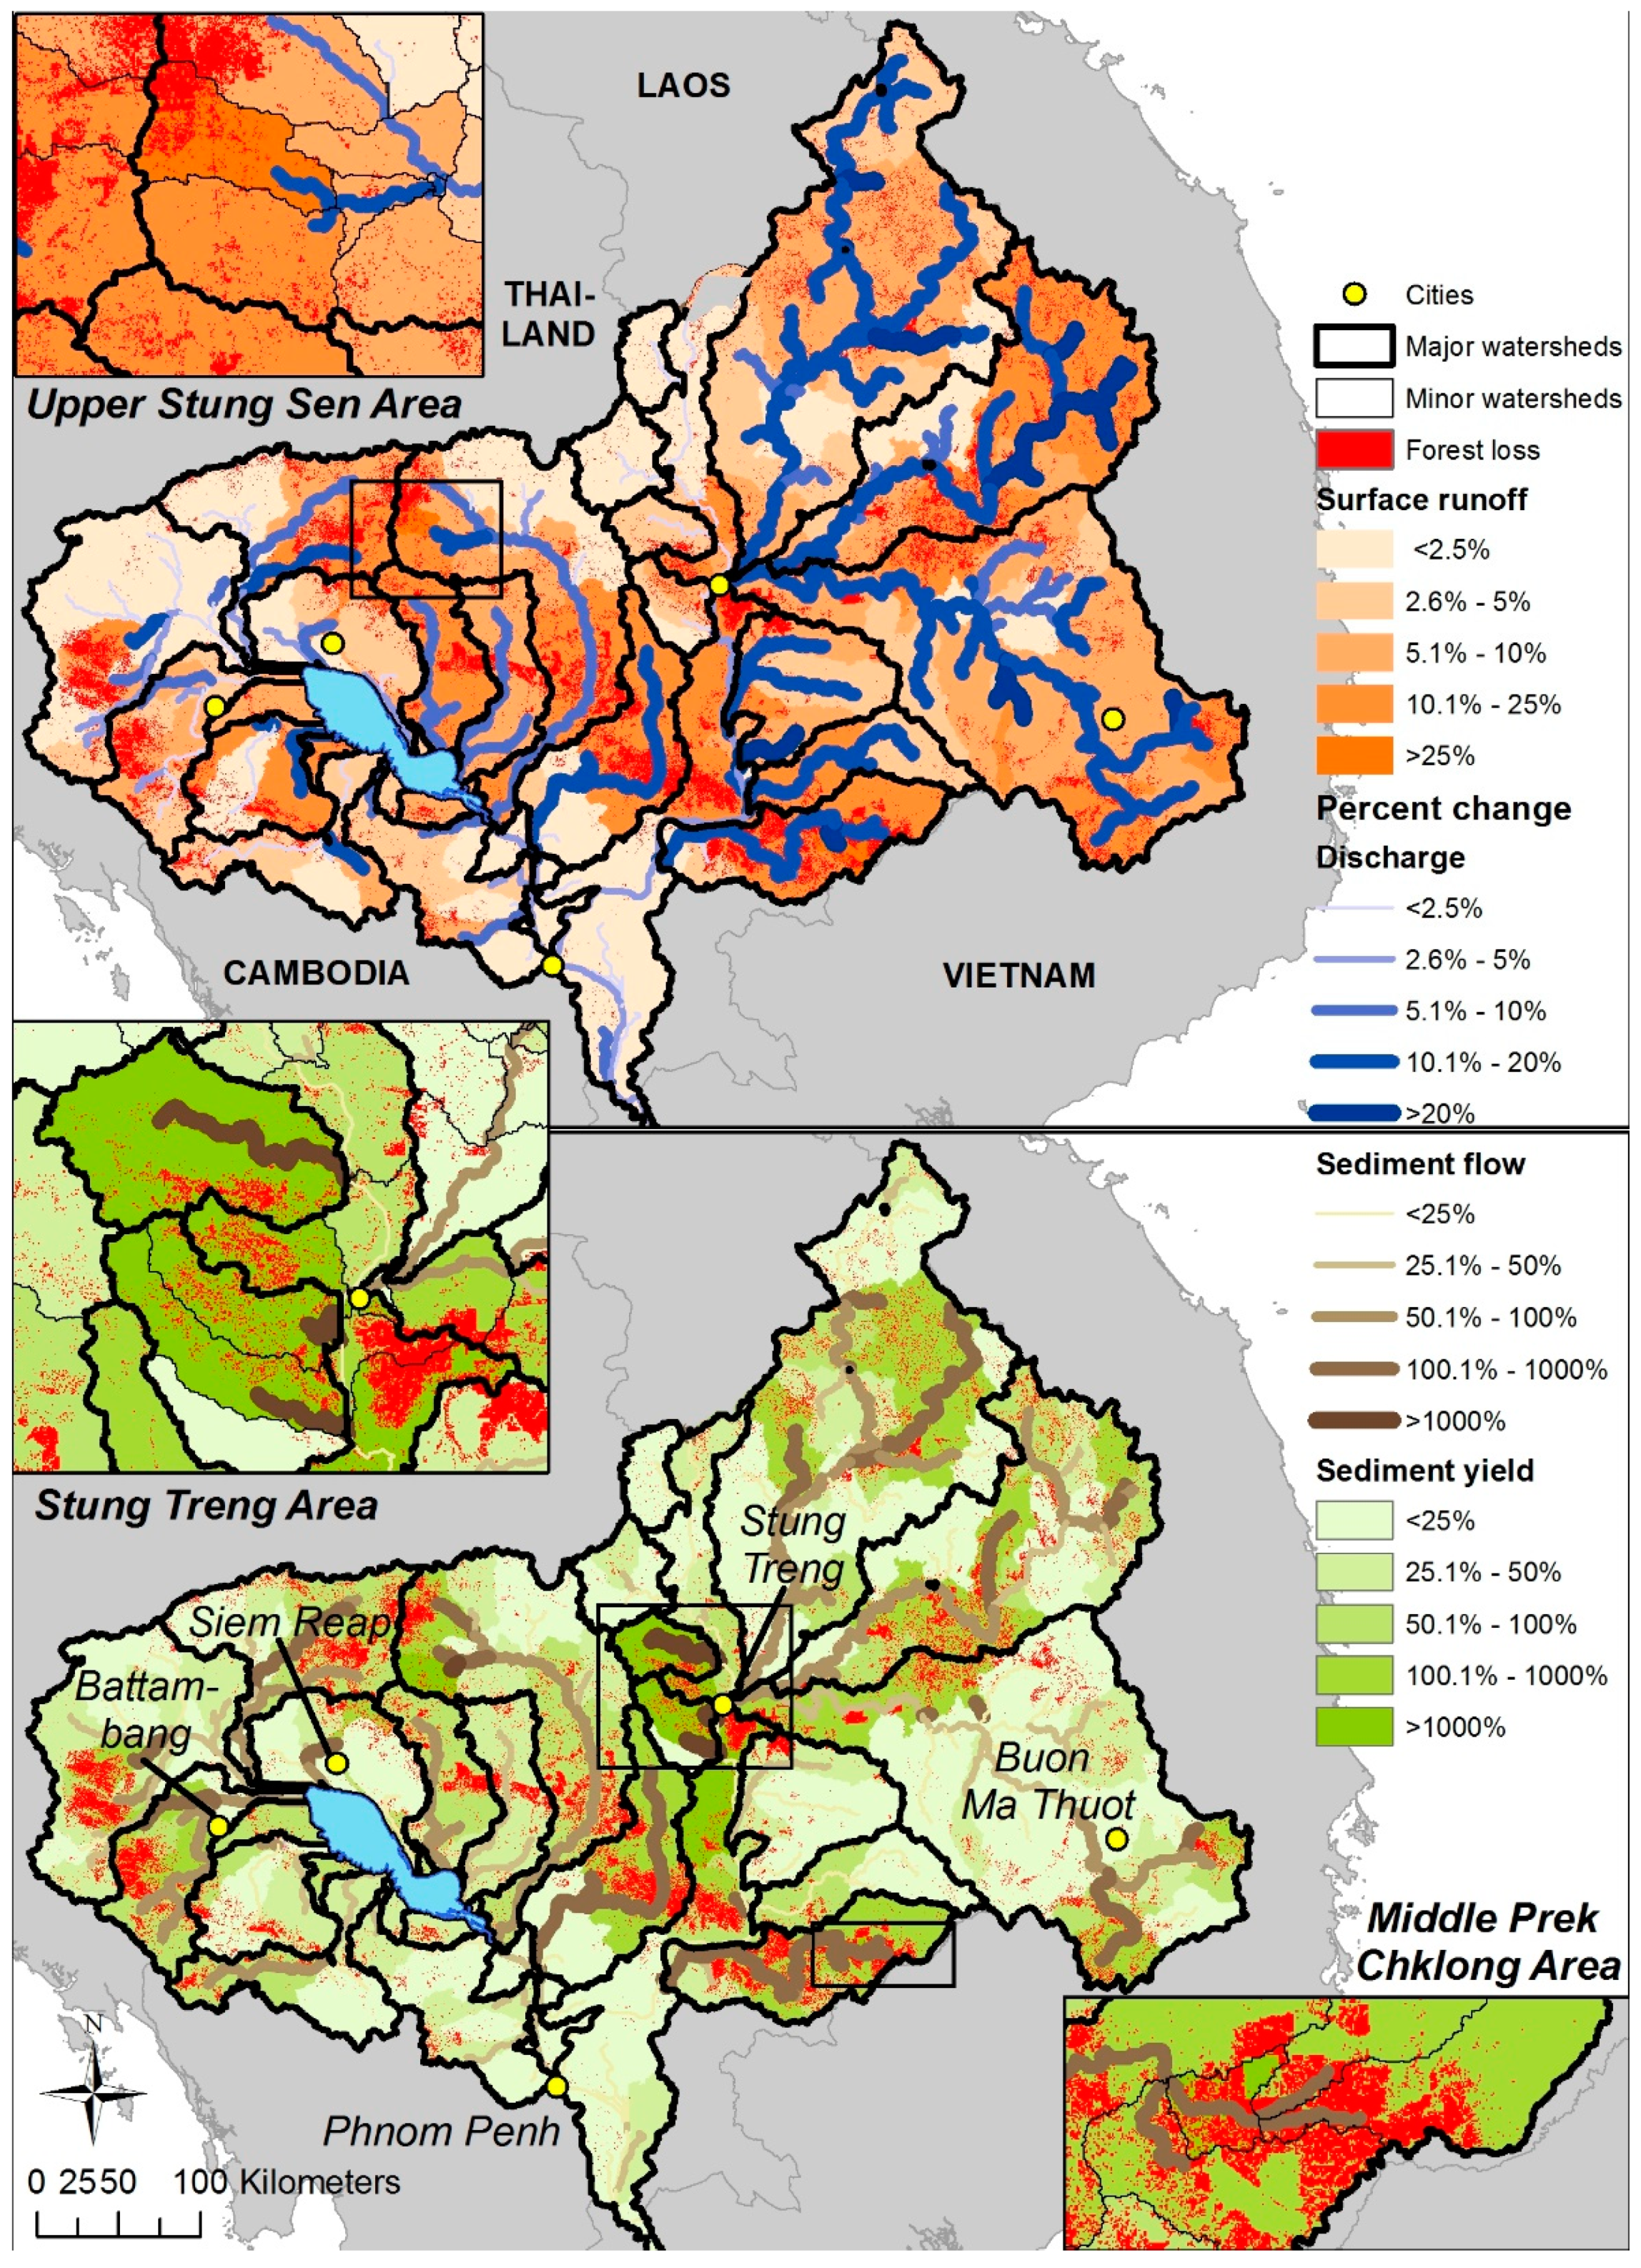
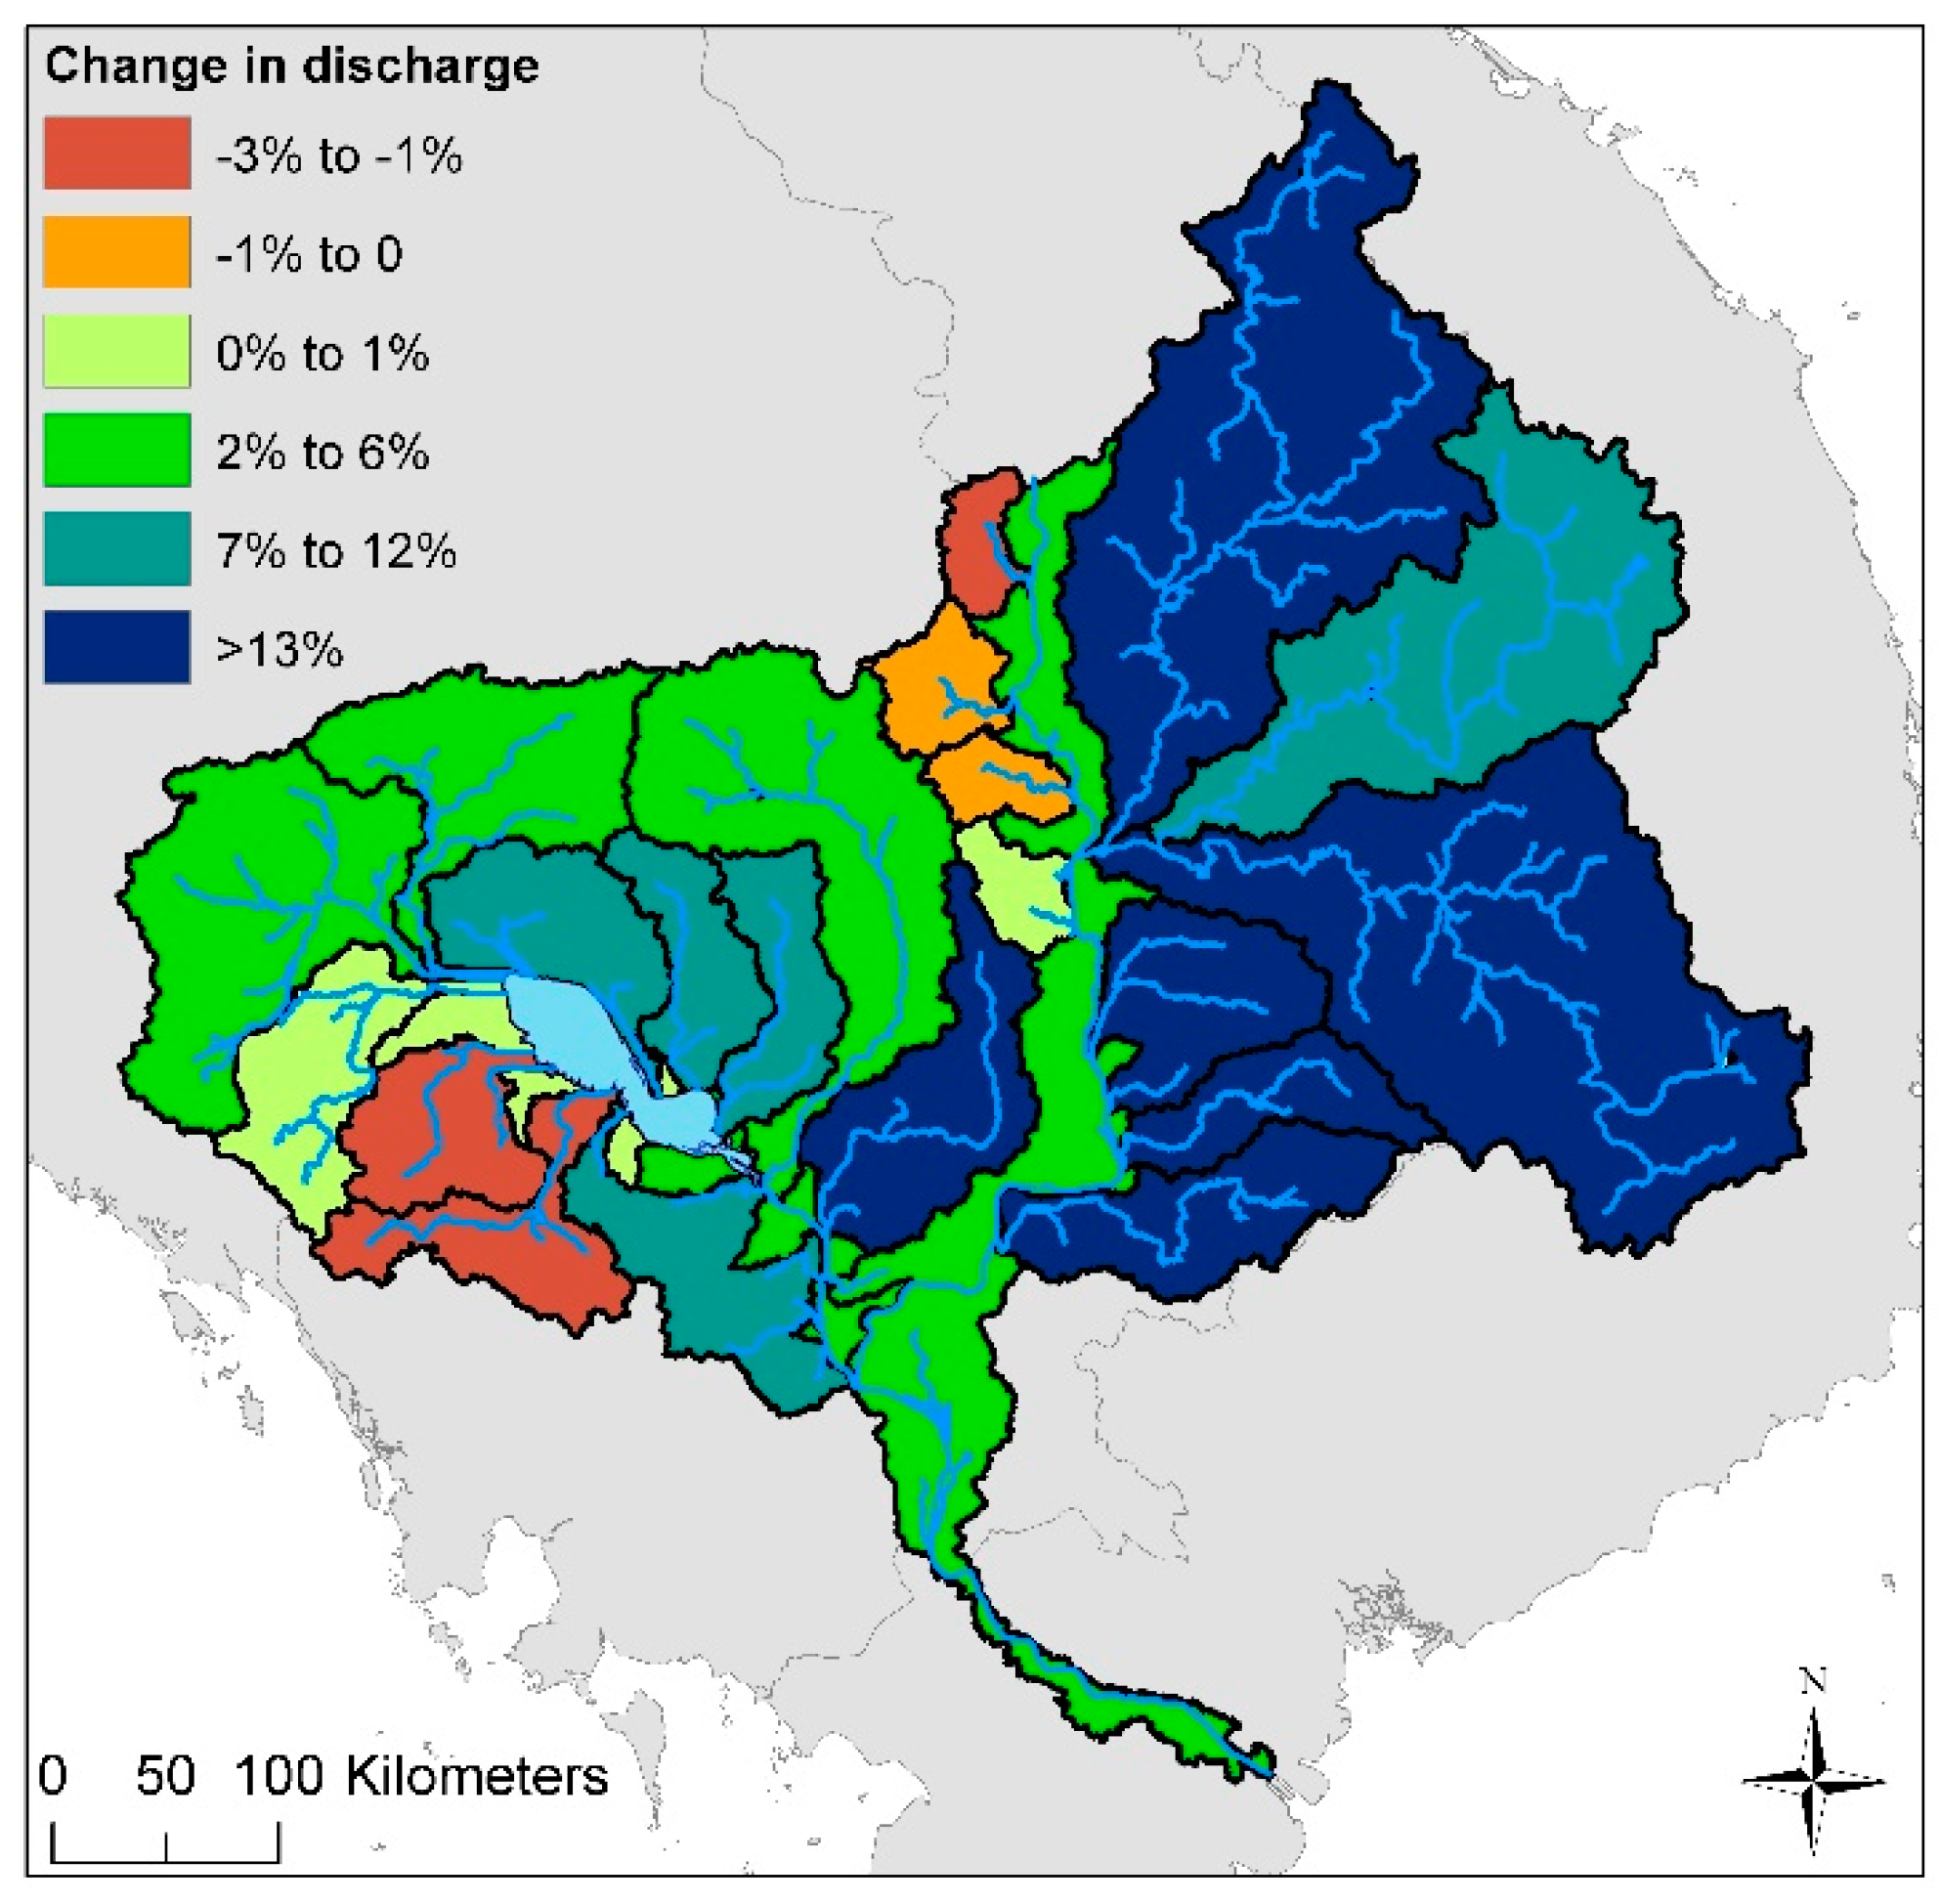
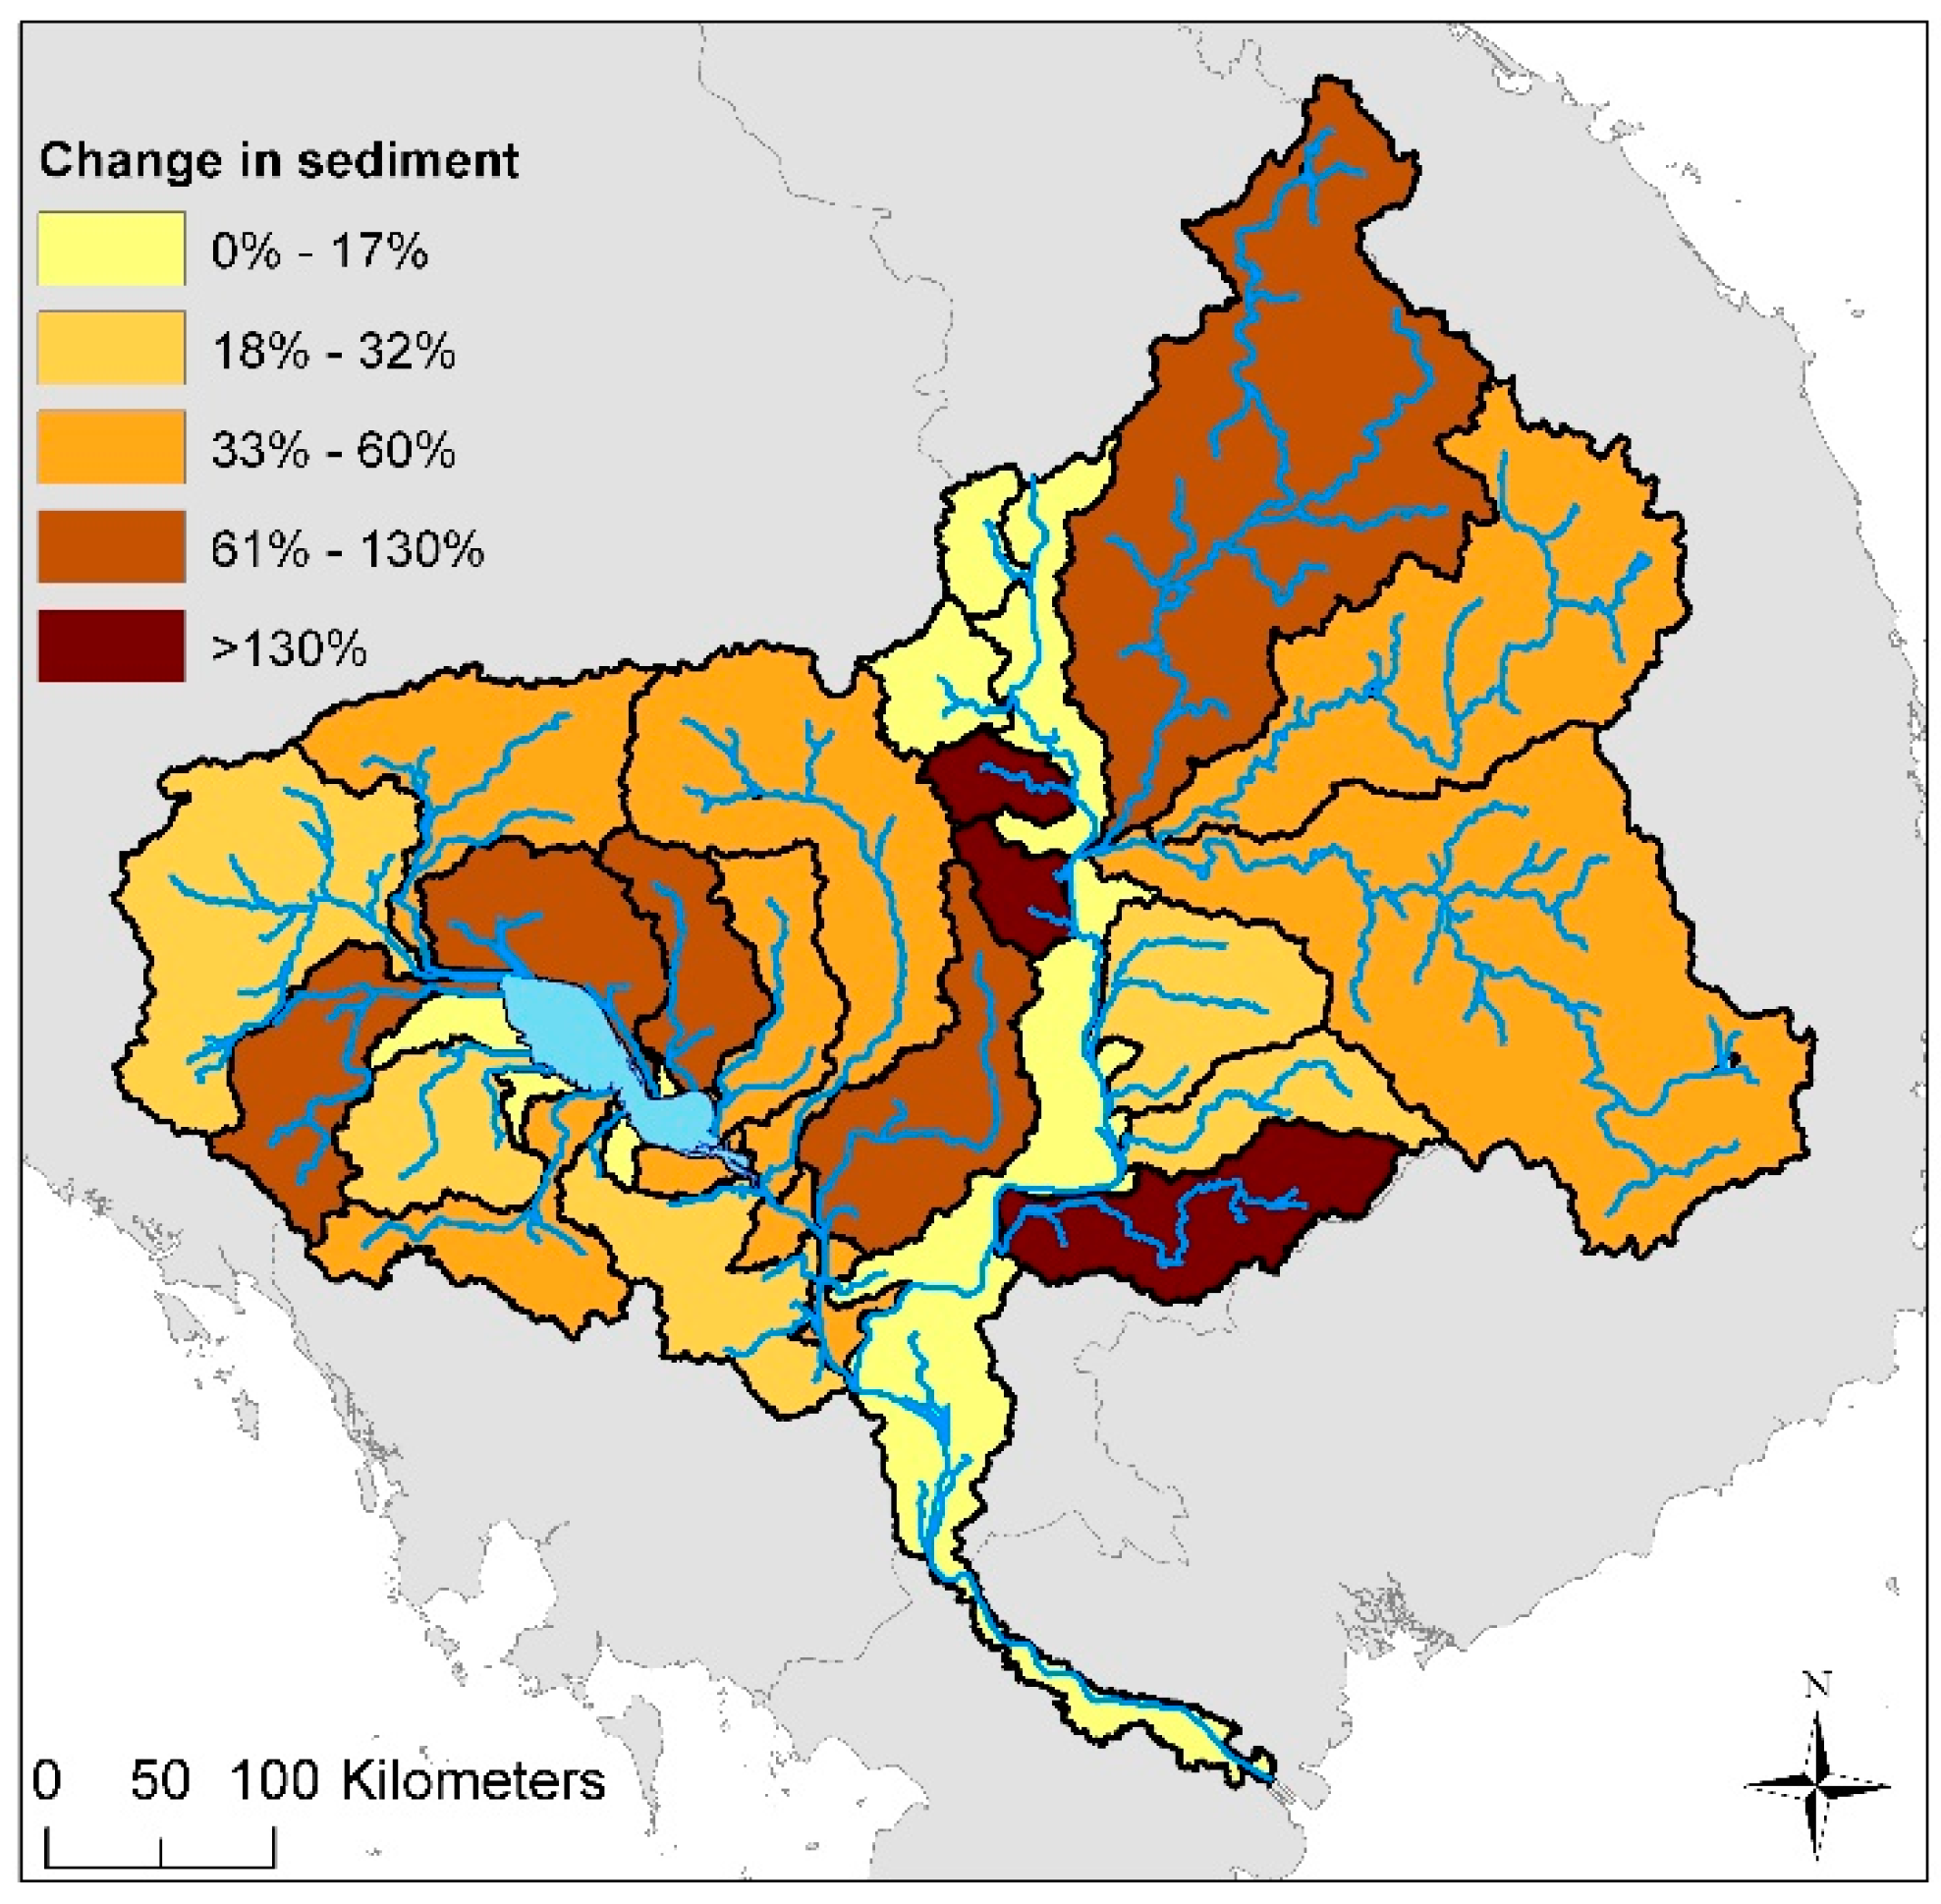
4.2. Hotspots of Water-Based ES Deterioration

The results point to certain watersheds within the LMB that experienced very high changes in surface runoff and sediment yield, pointing to land use change having a large detrimental effect on water-based ES provision. These locations were mostly in areas in upper watersheds along agricultural frontiers. In these areas forest loss from agricultural development (including plantations) is a mix of small farmers and development of large Economic Land Concessions (ELCs).
The ‘Three S’ rivers in the northeast of Cambodia, that include the Se San, Sre Pok, and Sekong rivers, constitute a significant part of the LMB (Figure 5). These rivers come together just before merging with the Mekong river near the town of Stung Treng a region described as a “rural agricultural frontier” where livelihoods center on fish production, rice, vegetable and cash crop farming, livestock, and a number of non-timber forest products [66]. A recent major development in the area is the 400 megawatt Sesan II Dam located at the confluence of the Se San and Sekong rivers. Results from this analysis show that Between 2001 and 2013 the Se San lost 15% of its forest area, the Srepok 11%, and the Sekong 6%. As a result, the model shows increases in river discharge of between 13–14% and sediment flow increase of 59% for the Se San, 58% for the Srepok and 71% for the Se Kong. The loss of these water-based ES was primarily due to forest loss in sub-basins in the mountainous upper watersheds where slopes were steeper, and rainfall is some of the highest in the region.
South of the Three S rivers is the Prek Chklong watershed, dominated by the agriculture crops of cassava, rubber, maize, and rice. The agriculture land includes local farmers, but also a large portion of the watershed (16% of the watershed—113,000 ha) was granted to large agricultural and plantation ELCs (Results from the WESTool https://www.winrock.org/westool/). The agricultural development in the Prek Chklong watershed resulted in the loss of 35% of its forest between 2001 and 2013 (the highest of any watershed in Cambodia). Results indicate that this development increased river discharge by 17% on average, and sediment flow by 135%. These results do not tell us what the actual impact is on the ground (e.g., impacts on infrastructure or fish populations), however they do highlight substantial increases in both discharge and sediment that could help land manages identify this as a priority watershed for further studies on.
The upper watersheds of the Tonle Sap are also where a large amount of agricultural expansion is occurring. Between 2001 and 2013 the Tonle Sap lost 17% of its forest area (Results from the WESTool https://www.winrock.org/westool/). Two examples of this are the St. Sen and St. Chinit watersheds. Important infrastructure in the watersheds includes the Chinit Reservoir which feeds the largest irrigation program in Cambodia [67]. Between 2001 and 2013 the upper Sen watershed lost approximately 13% of its forest and the Chinit 27%. This resulted in a 60% increase in sediment in the Sen and an 84% increase in the Chinit, with average flows increasing by 5% and 15% respectively. These changes can have serious detrimental impacts to reservoir and irrigation systems on the lower reaches of the river.
Many of the hotspots are located in or around protected areas. This included the newly established Snuol and Keo Seima Wildlife Sanctuary, and the Prey Long Wildlife Sanctuary. This points to two important observations: (1) that recent efforts at establishing wildlife sanctuary are timely, well placed, and if effective could have substantial hydrological ES benefits; and (2) that Cambodia’s protected areas are under considerable threat. Results from this analysis indicate that between 2001 and 2013 there was a 12% loss of forests across Cambodia’s 20 Wildlife Sanctuary’s (covering approximately 20% of the total area of Cambodia) (Results from the WESTool https://www.winrock.org/westool/). This supports results from Collins and Mitchard (2017) [68] that Cambodia had one of the highest deforestation rates in protected areas in the world.
These ‘hot spot’ areas may be priority locations for reforestation efforts or forest conservation, given that the forests that have been lost not only have contributed to climate change through CO2 emissions but also clearly held great value for local hydrological ES.

4.3. Not All Forest Loss or Hydrological Impacts Are Significant or Detrimental

Not all watersheds with deforestation experienced high rates of water-based ES loss. This is primarily a result of low slopes; however soil and rainfall also are important factors. These areas, in contrast to the ‘hot-spots,’ may be areas where development could be more sustainable and therefore prioritized over more sensitive areas. Also, the larger rivers with bigger watersheds saw muted impacts, as the drastic impacts in upper watersheds were diluted as the runoff and sediment traveled downstream, mixing with runoff and sediment from less impacted areas. The main stem of the Mekong river especially showed very little change. This is largely due to the unmodeled impact of the upper Mekong Basin. Further basin-wide analysis could be completed to better understand the impact of land use change on cities and population centers that are located on the banks of the Mekong. Despite the muted impacts of larger rivers there were still substantial impacts. The Tonle Sap River experienced a 4% increase in river discharge and a 42% increase in sediment yield. These increases near Phnom Penh could lead to loss of ES provision, for example in the form of higher costs for water treatment at the Phnom Penh treatment plant.
Despite the utility of percent change indicators in showing the impact of land use change on hydrological indicators, it is important to point out that high percent changes in modeling cannot be directly interpreted as increases in flooding and erosion—the reality of hydrology is dependent on the specific rainfall events that occur. Therefore, future flooding or drought will in large part be regulated by increases or decreases in precipitation. These potential changes in climate were not considered in this study. However, the results do point to the fact that extreme rainfall events in the wet season will be exacerbated by forest loss and therefore could cause greater flooding and erosion in some areas. Therefore, the modeling performed in this study provides an important unbiased indication of the effect of only one variable (land use change) on hydrological ES provision that could be used for prioritization in forest protection and reforestation efforts, rather than a prediction of future flooding or erosion events.
Furthermore, flooding and sedimentation in the LMB is not always considered a bad thing. Normal flooding and sediment, especially in the Tonle Sap River and Lake area, provide vital waters for flooding rice crops and nutrients for fisheries. Therefore, it is possible that many areas of the LMB could welcome a small increase in surface runoff or sediment flow in their rivers, given the changes are gradual and within historical boundaries.

4.4. The WESTool: An Online Platform for Disbursement of Data and Results

In order to share the results of this study with those in the LMB that could most benefit from the associated data, the Watershed Ecosystem Service Tool (WESTool) https://www.winrock.org/westool/, was built. WESTool is a platform that compiles the hydrological outputs of the SWAT analyses, land cover maps along with supplemental local field data, remote sensing products, and climate change data for Cambodia into an easy to use web-based interface. The WESTool attempts to bridge the gap between technological advancements, and the non-technical users that need tools to make responsible land use decisions. The Tool is at the national and watershed scale, allowing decision-makers in Cambodia to zoom into a small watershed or perform a more macro national study. The benefit of this is that the results can be used for detailed land use planning in Cambodia. Users can see the impacts that deforestation have had on watersheds, sub-basins or even other areas of interest that do not align with SWAT-delineated watersheds like protected areas or provinces. The WESTool helps them answer questions about land use changes and their impacts on the major ES related to water.

5. Conclusions

This study shows a novel way of combining big datasets that use remote sensing for forest monitoring purposes—primarily Hansen et al. 2013 and Globe Land Cover [50]—with hydrological modeling to show the impacts that forest loss has on water-based ES across large landscapes. The methodology, applied to the lower Mekong Basin, gave results showing that the impacts are highly variable across space and depend on many factors such as percent of forest lost, slope, rainfall and the post-conversion land use. Such a combination of remote sensing products and hydrological modeling could be used to understand and quantify ES for many other locations besides Cambodia and the LMB, given many of the data sources are global or readily available at a national scale in many countries. Such results could help national, regional and local stakeholders prioritize areas of intervention, from REDD+ (Reduces Emissions from Deforestation and Degradation) strategies to watershed plans. The results also give further quantitative value to certain forests, helping decision-makers make difficult choices about which forests to focus on for protection or where to prioritize limited resources for reforestation efforts.
Further research is suggested for the LMB, including more rigorous SWAT model calibration using sediment, nutrient and groundwater variables that may allow for a more comprehensive analysis of more hydrological ES including nutrient runoff and groundwater recharge.
To further engage stakeholders within the LMB, the results of this study for Cambodia are presented in WESTool (https://www.winrock.org/westool/), a platform that compiles local field data, remote sensing products, and large-scale hydrological modeling for Cambodia into an easy to use web-based interface. As such, this methodology along with the WESTool seek to fill a niche that numerous scientists and policy makers have called for, to provide an integrated assessment tool for decision-making on climate change adaptation, mitigation, land use and water management [5,31].

Author Contributions

M.S.N. conceptualized and led the technical methodology, formal analysis, investigation and writing. G.S. conducted the technical methodology, formal analysis, investigation and writing. G.S. conducted the hydrological modeling and the interpretation of those results. G.S. played a large role in the writing and editing of the paper. T.R.H.P. provided supervision and helped significantly in the writing and conceptualization of the paper. T.R.H.P. provided the final review and editing of the report. S.M.W. provided some of the initial conceptualization for this work and helped as a scientific advisor throughout the process. S.M.W. was also a final reviewer of the report. R.S. provided critical review and supervision of the hydrological modeling as a SWAT developer and expert. R.S. also helped in the interpretation, validation and data curation to ensure the hydrological results were robust and accurately presented.

Funding

This research was funded by the United States Agency for International Development’s Supporting Forests and Biodiversity Project (Cooperative Agreement Number AID-442-A-13-00002).

Acknowledgments

The authors would like to thank Winrock International and the staff of the USAID project “Supporting Forests and Biodiversity” in Cambodia. Without the local staff this project would not have been possible. The authors would also like to thank all the staff from Winrock’s Ecosystem Services unit that supported and contributed to this work.

Conflicts of Interest

The authors declare no conflict of interest.

References

  1. Intergovernmental Panel on Climate 2006 IPCC Guidelines for National Greenhouse Gas Inventories. Intergovernmental Panel on Climate Change, 2006. Available online: https://www.ipcc-nggip.iges.or.jp/public/2006gl/ (accessed on January 2019).
  2. Baccini, A.; Goetz, S.J.; Walker, W.S.; Laporte, N.T.; Sun, M.; Sulla-Menashe, D.; Hackler, J.; Beck, P.S.A.; Dubayah, R.; Friedl, M.A. Estimated carbon dioxide emissions from tropical deforestation improved by carbon-density maps. Nat. Clim. Chang. 2012, 2, 182. [Google Scholar] [CrossRef]
  3. Harris, N.L.; Brown, S.; Hagen, S.C.; Saatchi, S.S.; Petrova, S.; Salas, W.; Hansen, M.C.; Potapov, P.V.; Lotsch, A. Baseline Map of Carbon Emissions from Deforestation in Tropical Regions. Science 2012, 336, 1573–1576. [Google Scholar] [CrossRef] [PubMed]
  4. Houghton, R.A. Land-use change and the carbon cycle. Glob. Chang. Biol. 1995, 1, 275–287. [Google Scholar] [CrossRef]
  5. Ellison, D.; Morris, C.E.; Locatelli, B.; Sheil, D.; Cohen, J.; Murdiyarso, D.; Gutierrez, V.; Van Noordwijk, M.; Creed, I.F.; Pokorny, J. Trees, forests and water: Cool insights for a hot world. Glob. Environ. Chang. 2017, 43, 51–61. [Google Scholar] [CrossRef] [Green Version]
  6. Maes, W.H.; Heuvelmans, G.; Muys, B. Assessment of land use impact on water-related ecosystem services capturing the integrated terrestrial−aquatic system. Environ. Sci. Technol. 2009, 43, 7324–7330. [Google Scholar] [CrossRef]
  7. Malmer, A.; Murdiyarso, D.; Bruijnzeel, L.A.; Ilstedt, U. Carbon sequestration in tropical forests and water: A critical look at the basis for commonly used generalizations. Glob. Chang. Biol. 2010, 16, 599–604. [Google Scholar] [CrossRef]
  8. Neary, D.G.; Ice, G.G.; Jackson, C.R. Linkages between forest soils and water quality and quantity. For. Ecol. Manag. 2009, 258, 2269–2281. [Google Scholar] [CrossRef]
  9. Calder, I.R. Forests and water—Ensuring forest benefits outweigh water costs. For. Ecol. Manag. 2007, 251, 110–120. [Google Scholar] [CrossRef]
  10. Hoover, M.D. Effect of removal forest vegetation upon water-yields. Eos Trans. Am. Geophys. Union 1944, 25, 969–977. [Google Scholar] [CrossRef]
  11. Ilstedt, U.; Tobella, A.B.; Bazié, H.R.; Bayala, J.; Verbeeten, E.; Nyberg, G.; Sanou, J.; Benegas, L.; Murdiyarso, D.; Laudon, H. Intermediate tree cover can maximize groundwater recharge in the seasonally dry tropics. Sci. Rep. 2016, 6, 21930. [Google Scholar] [CrossRef] [PubMed] [Green Version]
  12. Chang, M. Forest Hydrology: An Introduction to Water and Forests; CRC Press: London, UK, 2012; ISBN 1-4665-8667-2. [Google Scholar]
  13. Bruijnzeel, L.A. Hydrological functions of tropical forests: Not seeing the soil for the trees? Agric. Ecosyst. Environ. 2004, 104, 185–228. [Google Scholar] [CrossRef]
  14. Foley, J.A.; DeFries, R.; Asner, G.P.; Barford, C.; Bonan, G.; Carpenter, S.R.; Chapin, F.S.; Coe, M.T.; Daily, G.C.; Gibbs, H.K. Global consequences of land use. Science 2005, 309, 570–574. [Google Scholar] [CrossRef] [PubMed]
  15. Uriarte, M.; Yackulic, C.B.; Lim, Y.; Arce-Nazario, J.A. Influence of land use on water quality in a tropical landscape: A multi-scale analysis. Landsc. Ecol. 2011, 26, 1151–1164. [Google Scholar] [CrossRef] [PubMed]
  16. Arias, M.E.; Cochrane, T.A.; Lawrence, K.S.; Killeen, T.J.; Farrell, T.A. Paying the forest for electricity: A modelling framework to market forest conservation as payment for ecosystem services benefiting hydropower generation. Environ. Conserv. 2011, 38, 473–484. [Google Scholar] [CrossRef]
  17. Johnston, R. Rethinking Agriculture in the Greater Mekong Subregion: How to Sustainably Meet Food Needs, Enhance Ecosystem Services and Cope with Climate Change; IWMI: Phnom Penh, Cambodia, 2010; ISBN 92-9090-724-X. [Google Scholar]
  18. Leinenkugel, P.; Wolters, M.L.; Oppelt, N.; Kuenzer, C. Tree cover and forest cover dynamics in the Mekong Basin from 2001 to 2011. Remote Sens. Environ. 2015, 158, 376–392. [Google Scholar] [CrossRef]
  19. Bell, R.W.; Seng, V. Rainfed lowland rice-growing soils of Cambodia, Laos, and North-east Thailand. 2003. Available online: https://researchrepository.murdoch.edu.au/id/eprint/11189/ (accessed on 13 May 2019).
  20. Nuorteva, P.; Keskinen, M.; Varis, O. Water, livelihoods and climate change adaptation in the Tonle Sap Lake area, Cambodia: Learning from the past to understand the future. J. Water Clim. Chang. 2010, 1, 87–101. [Google Scholar] [CrossRef]
  21. Wildlife, S.C. Atlas of Cambodia: Maps on Socio-Economic Development and Environment; Save Cambodia’s Wildl: Phnom Penh, Cambodia, 2014; 178 p. [Google Scholar]
  22. Mundi Index Cambodia Economy Profile. 2017. Available online: http://www.indexmundi.com/cambodia/economy_profile.html (accessed on 28 September 2017).
  23. Guimbert, S. Cambodia 1998–2008: An Episode of Rapid Growth. 2010. Available online: https://openknowledge.worldbank.org/handle/10986/3758 (accessed on 13 May 2019).
  24. Hill, H.; Menon, J. Cambodia: Rapid growth with weak institutions. Asian Econ. Policy Rev. 2013, 8, 46–65. [Google Scholar] [CrossRef]
  25. FAO Cambodia Forestry Outlook Study Working Paper No. APFSOS II/WP/2010/32; Food Agricultural Organization United Nations Regional Office Asia Pacific: Bangkok, Thailand, 2010.
  26. Nguyen, T.T.; Do, T.L.; Bühler, D.; Hartje, R.; Grote, U. Rural livelihoods and environmental resource dependence in Cambodia. Ecol. Econ. 2015, 120, 282–295. [Google Scholar] [CrossRef]
  27. Hansen, M.C.; Potapov, P.V.; Moore, R.; Hancher, M.; Turubanova, S.A.; Tyukavina, A.; Thau, D.; Stehman, S.V.; Goetz, S.J.; Loveland, T.R.; et al. High-Resolution Global Maps of 21st-Century Forest Cover Change. Science 2013, 342, 850–853. Available online: http://earthenginepartners.appspot.com/science-2013-global-forest (accessed on 13 May 2019). [CrossRef]
  28. Miettinen, J.; Shi, C.; Liew, S.C. Deforestation rates in insular Southeast Asia between 2000 and 2010. Glob. Chang. Biol. 2011, 17, 2261–2270. [Google Scholar] [CrossRef]
  29. Costanza, R.; d’Arge, R.; De Groot, R.; Farber, S.; Grasso, M.; Hannon, B.; Limburg, K.; Naeem, S.; O’neill, R.V.; Paruelo, J. The value of the world’s ecosystem services and natural capital. Nature 1997, 387, 253–260. [Google Scholar] [CrossRef]
  30. Trucost, P.L.C. Natural Capital at Risk: The Top 100 Externalities of Business; TEEB Geneva: Geneva, Switzerland, 2013. [Google Scholar]
  31. Turner, K.G.; Anderson, S.; Gonzales-Chang, M.; Costanza, R.; Courville, S.; Dalgaard, T.; Dominati, E.; Kubiszewski, I.; Ogilvy, S.; Porfirio, L. A review of methods, data, and models to assess changes in the value of ecosystem services from land degradation and restoration. Ecol. Model. 2016, 319, 190–207. [Google Scholar] [CrossRef]
  32. Von Braun, J.; Gerber, N.; Mirzabaev, A.; Nkonya, E. The Economics of Land Degradation ZEF Working Paper Series; Center for Development Research: Bonn, Switzerland, 2013; p. 109. [Google Scholar]
  33. Mohammed, I.; Bolten, J.; Srinivasan, R.; Lakshmi, V. Improved hydrological decision support system for the Lower Mekong River Basin using satellite-based earth observations. Remote Sens. 2018, 10, 885. [Google Scholar] [CrossRef] [PubMed]
  34. Srinivasan, R.; Arnold, J.G. Integration of a Basin-Scale Water Quality Model with Gis1. JAWRA J. Am. Water Resour. Assoc. 1994, 30, 453–462. [Google Scholar] [CrossRef]
  35. Lacombe, G.; Pierret, A. Hydrological impact of war-induced deforestation in the Mekong Basin. Ecohydrology 2013, 6, 901–903. [Google Scholar] [CrossRef]
  36. Baker, T.J.; Miller, S.N. Using the Soil and Water Assessment Tool (SWAT) to assess land use impact on water resources in an East African watershed. J. Hydrol. 2013, 486, 100–111. [Google Scholar] [CrossRef]
  37. Huong, H.T.L.; Pathirana, A. Urbanization and climate change impacts on future urban flooding in Can Tho city, Vietnam. Hydrol. Earth Syst. Sci. 2013, 17, 379–394. [Google Scholar] [CrossRef] [Green Version]
  38. Ohana-Levi, N.; Karnieli, A.; Egozi, R.; Givati, A.; Peeters, A. Modeling the effects of land-cover change on rainfall-runoff relationships in a semiarid, eastern mediterranean watershed. Adv. Meteorol. 2015, 2015, 838070. [Google Scholar] [CrossRef]
  39. Gebhardt, S.; Wehrmann, T.; Ruiz, M.; Maeda, P.; Bishop, J.; Schramm, M.; Kopeinig, R.; Cartus, O.; Kellndorfer, J.; Ressl, R. MAD-MEX: Automatic wall-to-wall land cover monitoring for the Mexican REDD-MRV program using all Landsat data. Remote Sens. 2014, 6, 3923–3943. [Google Scholar] [CrossRef]
  40. Potapov, P.V.; Dempewolf, J.; Talero, Y.; Hansen, M.C.; Stehman, S.V.; Vargas, C.; Rojas, E.J.; Castillo, D.; Mendoza, E.; Calderón, A. National satellite-based humid tropical forest change assessment in Peru in support of REDD+ implementation. Environ. Res. Lett. 2014, 9, 124012. [Google Scholar] [CrossRef] [Green Version]
  41. Pearson, T.R.; Brown, S.; Murray, L.; Sidman, G. Greenhouse gas emissions from tropical forest degradation: An underestimated source. Carbon Balance Manag. 2017, 12, 3. [Google Scholar] [CrossRef]
  42. Tyukavina, A.; Baccini, A.; Hansen, M.C.; Potapov, P.V.; Stehman, S.V.; Houghton, R.A.; Krylov, A.M.; Turubanova, S.; Goetz, S.J. Aboveground carbon loss in natural and managed tropical forests from 2000 to 2012. Environ. Res. Lett. 2015, 10, 074002. [Google Scholar] [CrossRef] [Green Version]
  43. Cutajar, M.Z. Reflections on the Kyoto Protocol: Looking back to see ahead. Int. Rev. Environ. Strateg. 2004, 5, 61–69. [Google Scholar]
  44. Sheffield, J.; Wood, E.F.; Chaney, N.; Guan, K.; Sadri, S.; Yuan, X.; Olang, L.; Amani, A.; Ali, A.; Demuth, S. A drought monitoring and forecasting system for sub-Sahara African water resources and food security, B. Am. Meteorol. Soc. 2014, 95, 861–882. [Google Scholar] [CrossRef]
  45. Brocca, L.; Melone, F.; Moramarco, T.; Wagner, W.; Naeimi, V.; Bartalis, Z.; Hasenauer, S. Improving runoff prediction through the assimilation of the ASCAT soil moisture product. Hydrol. Earth Syst. Sci. 2010, 14, 1881. [Google Scholar] [CrossRef]
  46. Milzow, C.; Krogh, P.E.; Bauer-Gottwein, P. Combining satellite radar altimetry, SAR surface soil moisture and GRACE total storage changes for hydrological model calibration in a large poorly gauged catchment. Hydrol. Earth Syst. Sci. 2011, 15, 1729–1743. [Google Scholar] [CrossRef] [Green Version]
  47. Van Dijk, A.; Renzullo, L.J. Water resource monitoring systems and the role of satellite observations. Hydrol. Earth Syst. Sci. 2011, 15, 39–55. [Google Scholar] [CrossRef] [Green Version]
  48. Wohlfart, C.; Wegmann, M.; Leimgruber, P. Mapping Threatened Dry Deciduous Dipterocarp Forest in South-East Asia for Conservation Management. Trop. Conserv. Sci. 2014, 7, 597–613. [Google Scholar] [CrossRef] [Green Version]
  49. MRC Mekong River Commission. Available online: http://www.mrcmekong.org/ (accessed on 20 March 2016).
  50. ESA/ESA Globcover 2005 Project. 2005. Available online: http://due.esrin.esa.int/page_globcover.php (accessed on 13 May 2019).
  51. Open Development Cambodia. Available online: https://opendevelopmentcambodia.net (accessed on 15 February 2017).
  52. Jarvis, A.; Reuter, H.I.; Nelson, A.; Guevara, E. Hole-Filled SRTM for the Globe; Version 4; Available CGIAR-CSI SRTM 90m Database http://srtm. csi. cgiar. org: London, England, 2008. [Google Scholar]
  53. FAO/IIASA/ISRIC/ISSCAS/JRC. Harmonized World Soil Database, version 1.2; FAO and IIASA: Rome, Italy; Laxenburg, Austria, 2012. [Google Scholar]
  54. Sanchez, P.A.; Ahamed, S.; Carré, F.; Hartemink, A.E.; Hempel, J.; Huising, J.; Lagacherie, P.; McBratney, A.B.; McKenzie, N.J.; de Lourdes Mendonça-Santos, M. Digital soil map of the world. Science 2009, 325, 680–681. [Google Scholar] [CrossRef] [PubMed]
  55. Menne, M.J.; Durre, I.; Vose, R.S.; Gleason, B.E.; Houston, T.G. An overview of the global historical climatology network-daily database. J. Atmos. Ocean. Technol. 2012, 29, 897–910. [Google Scholar] [CrossRef]
  56. Fuka, D.R.; Walter, M.T.; MacAlister, C.; Degaetano, A.T.; Steenhuis, T.S.; Easton, Z.M. Using the Climate Forecast System Reanalysis as weather input data for watershed models. Hydrol. Process. 2014, 28, 5613–5623. [Google Scholar] [CrossRef]
  57. MRC State of the Basin Report 2003; Mekong River Commission (MRC): Phnom Penh, Cambodia, 2003.
  58. Vibol, S.; Towprayoon, S. Estimation of methane and nitrous oxide emissions from rice field with rice straw management in Cambodia. Environ. Monit. Assess. 2010, 161, 301–313. [Google Scholar] [CrossRef] [PubMed]
  59. Nash, J.E.; Sutcliffe, J.V. River flow forecasting through conceptual models part I—A discussion of principles. J. Hydrol. 1970, 10, 282–290. [Google Scholar] [CrossRef]
  60. Bredesen, A.; Brown, C.J. Comparison of Hydrologic Model Performance Statistics Using Rain Gauge and NEXRAD Precipitation Input at Different Watershed Spatial Scales and Rainfall Return Frequencies for the Upper St. Johns River, Florida USA; The Multidisciplinary Digital Publishing Institute Proceedings: Basel, Switzerland, 2018; Volume 7, p. 11. [Google Scholar]
  61. Sidman, G.; Guertin, D.P.; Goodrich, D.C.; Unkrich, C.L.; Burns, I.S. Risk assessment of post-wildfire hydrological response in semiarid basins: The effects of varying rainfall representations in the KINEROS2/AGWA model. Int. J. Wildland Fire 2015, 25, 268–278. [Google Scholar] [CrossRef]
  62. Cho, Y.; Engel, B.A. NEXRAD Quantitative Precipitation Estimations for Hydrologic Simulation Using a Hybrid Hydrologic Model. J. Hydrometeorol. 2017, 18, 25–47. [Google Scholar] [CrossRef]
  63. Douglas, I. Hydrological investigations of forest disturbance and land cover impacts in South–East Asia: A review. Philos. Trans. R. Soc. Lond. B Biol. Sci. 1999, 354, 1725–1738. [Google Scholar] [CrossRef] [PubMed]
  64. Sidle, R.C.; Ziegler, A.D.; Negishi, J.N.; Nik, A.R.; Siew, R.; Turkelboom, F. Erosion processes in steep terrain—truths, myths, and uncertainties related to forest management in Southeast Asia. For. Ecol. Manag. 2006, 224, 199–225. [Google Scholar] [CrossRef]
  65. Filoso, S.; Bezerra, M.O.; Weiss, K.C.; Palmer, M.A. Impacts of forest restoration on water yield: A systematic review. PLoS ONE 2017, 12, e0183210. [Google Scholar] [CrossRef]
  66. Try, T.; Chambers, M. Situation Analysis: Stung Treng Province, Cambodia. Mekong Wetlands Biodiversity Conservation and Sustainable Use Programme. Available online: https://scholar.googleusercontent.com/scholar?q=cache:04_36WS-m7sJ:scholar.google.com/+Situation+Analysis:+Stung+Treng+Province,+Cambodia.+Mekong+Wetlands+Biodiversity+Conservation+and+Sustainable+Use+Programme,+Vientiane,+Lao+PDR.+93+pp&hl=en&as_sdt=0,4 (accessed on 4 February 2019).
  67. Baran, E.; Jantunen, T.; Chong, C.K. Values of Inland Fisheries in the Mekong River Basin; WorldFish: Penang, Malaysia, 2007. [Google Scholar]
  68. Collins, M.B.; Mitchard, E.T.A. A small subset of protected areas are a highly significant source of carbon emissions. Sci. Rep. 2017, 7, 41902. [Google Scholar] [CrossRef] [Green Version]
Figure 1. The general steps in the development of the land use/land cover change map for 2001 to 2013.
Forests 10 00413 g001
Figure 2. Study area showing the SWAT-derived basin and sub-basins. The map also shows the location of the Mekong River Commission gauges used in the modeling and calibration of the model.
Forests 10 00413 g002
Figure 3. Calibration of the SWAT model’s discharge (flow) at 4 Mekong River Commission gauging stations ((a) Kompong Putrea, (b) Kompong Thom, (c) Ban Kamphun, (d) Chantangoy). The line charts compare flow (m3 s−1) from the SWAT mode (dashed lines) with actual MRC Gauging stations flow (solid line).
Forests 10 00413 g003
Figure 4. Calibration of the SWAT model’s sediment (Sed.) concentration at 4 MRC gauging stations ((a), Kompong Thom, (b) Lumphat, (c) Backprea, (d) Kompong Thmar). The charts compare SWAT monthly average (black line) with min and max (gray), and actual MRC average (red point) with error bars showing min and max.
Forests 10 00413 g004
Figure 5. 2001 land cover map (this paper) with subsequent forest loss between 2001–2013 from Hansen et al. (2013) [27]. Key watersheds are identified.
Forests 10 00413 g005
Figure 6. Linear correlations between percent forest loss and percent change in indicators of water-based ES. Each circle represents one sub-watershed within the Lower Mekong Basin, scaled by size of absolute value (mm for surface runoff (a) and t/ha for sediment yield (b)).
Forests 10 00413 g006
Figure 7. Percent change in several hydrological indicators due to forest loss in the lower Mekong watershed from 2001–2013. The upper figure shows change in surface runoff and stream discharge, while the lower figure shows sediment yield and flow.
Forests 10 00413 g007
Figure 8. Results by watershed for percent change in river discharge and sediment yield as a result of land cover changes between 2001 and 2013.
Forests 10 00413 g008aForests 10 00413 g008b
Table 1. Data sources for Soil and Water Assessment Tool model inputs.
Spatial Data SourcesSourceCitation
Land use/land coverCustom map developedThis paper
Elevation/slopeShuttle Radar Topography Mission (SRTM) 90 m digital elevation model (DEM)Jarvis et al., (2008) [52]
Soil typeFood and Agriculture Organization’s (FAO) Digital Soil Map of the WorldFAO (2012), Sanchez et al., (2009) [53,54]
Weather station locationsGlobal Summary of the Day and Global Historical Climatology Network rain gauge locations, downloaded from the National Climatic Data Center (NCDC)Menne et al., (2012) [55]
Tabular data sources
Rain gauge recordsSelected gauges between 1986–2013, downloaded from NCDCMenne et al., (2012) [56]
Weather station recordsClimate Forecast System Reanalysis (CFSR) data for relative humidity, solar radiation, temperature and wind speedFuka et al., (2014) [57]
Management (Crop cycles, irrigation, fertilizer)Government publications and scientific literatureMRC, (2003); Vibol and Towprayoon, (2010) [58,59]
Table 2. Areas and percentages of forest loss and major drivers for select watersheds in the LMB.
Total LMBSelect Watersheds
Prek ChklongSt. M. BoreyStung SenTonle Se KongTonle Se San
Total forest loss (km2)18,95319041125166517232206
% forest loss13%35%34%13%6%15%
Forest to mosaic cropland13,1061405510128611361324
% of total forest loss69%74%45%77%66%60%
Forest to irrigated cropland8056532353255
% of total forest loss4%3%3%2%2%3%
Forest to rainfed cropland17842695826066120
% of total forest loss9%14%52%4%4%5%
Forest to urban6-0011
% of total forest loss0%0%0%0%0%0%
Forest to tree plantation2001162-27561335
% of total forest loss11%9%0%16%4%15%
Forest to pasture1223118425362
% of total forest loss6%0%0%0%25%16%
Table 3. Results of multiple regression analysis for surface runoff and sediment yield. Variables for the regressions with the highest four R2 values are shown. The number of observations was 268 (equal to the number of SWAT-created sub-basins) for all regressions. The *** for significance F implies values are <0.001.
ES Indicatorx1x2x3x4R2 RankEquationR2Adjusted R2Significance F
Surface runoff% of watershed with forest loss% change in Curve NumberAverage annual rainfall% slope1y = 0.025 + 0.437x1 + 1.540x2 + 0.000x3 − 0.037x40.7930.790***
% of watershed with forest loss% change in Curve NumberAverage annual rainfall 2y = 0.024 + 0.438x1 + 1.529x2 + 0.000x30.7920.790***
% of watershed with forest loss% change in Curve Number 3y = -0.002 + 0.447x1 + 1.365x20.7580.756***
% of watershed with forest lossAverage annual rainfall 4y = 0.027 + 0.580x1 + 0.000x20.5870.584***
Sediment yield% change in Manning’s nSediment yield in 2001 1y = 0.187 - 0.074x1 + 30.372x20.1680.162***
% of watershed with forest loss% change in Manning’s n 2y = −0.045 + 4.189x1 + 25.207x20.1650.159***
% change in Manning’s n 3y = 0.036 + 30.636x10.1640.161***
% of watershed with forest loss% change in Curve Number 4y = −0.382 + 16.626x1 + 21.840x20.1480.141***
Table 4. Results for 7 different watersheds in Cambodia showing the area of forest in 2001, percent deforestation, and the resulting change in discharge and sediment between 2001 and 2013.
WatershedArea of Forest in 2001 (km2)DeforestedChange in DischargeChange in Sediment Yield
2001–2013
Prek Chklong547835%17%135%
St. M. Borey348134%3%29%
St. Chinit517327%15%84%
Tonle Se San16,27715%13%59%
St. Sen12,72813%5%60%
Tonle Srepok22,07911%14%58%
Tonle Se Kong29,4506%14%71%

