Overhead Protection Increases Fuel Quality and Natural Drying of Leaf-On Woody Biomass Storage Piles


Department of Forest and natural Resources Management, College of Environmental Science and Forestry, State University of New-York, Syracuse, NY 13210, USA
*
Author to whom correspondence should be addressed.
Forests 2019, 10(5), 390; https://doi.org/10.3390/f10050390
Submission received: 19 February 2019
/
Revised: 13 April 2019
/
Accepted: 26 April 2019
/
Published: 1 May 2019
(This article belongs to the Special Issue Short Rotation Woody Crop Production Systems for Ecosystem Services and Phytotechnologies)
Abstract
:Short-rotation woody crops (SRWC) have the potential to make substantial contributions to the supply of biomass feedstock for the production of biofuels and bioproducts. This study evaluated changes in the fuel quality (moisture, ash, and heating value) of stored spring harvested shrub willow (Salix spp.) and hybrid poplar (Populus spp.) chips with respect to pile protection treatments, location within the storage piles, and length of storage. Leaf-on willow and poplar were harvested in the spring, and wood chips and foliage with moisture content in the range of 42.1% to 49.9% (w.b.) were stored in piles for five months, from May to October 2016. Three protection treatments were randomly assigned to the piles. The control treatment had no cover (NC), so piles were exposed to direct solar radiation and rainfall. The second treatment had a canopy (C) installed above the piles to limit direct rainfall. The final treatment had a canopy plus a dome aeration system (CD) installed over the piles. Covering piles reduced and maintained the low moisture content in wood chip piles. Within 30 days of establishment, the moisture content in the core of the C pile decreased to less than 30%, and was maintained between 24%–26% until the end of the storage period. Conversely, the moisture content in the NC piles decreased in the first two months, but then increased to the original moisture content in the core (>45 cm deep) and up to 70% of the original moisture content in the shell (<45 cm deep). For all the treatments in the tested conditions, the core material dried faster than the shell material. The higher heating value (HHV) across all the treatments increased slightly from 18.31 ± 0.06 MJ/kg at harvest to 18.76 ± 0.21 MJ/kg at the end of the storage period. The lower heating value (LHV) increased by about 50% in the C and CD piles by the end of the storage period. However, in the NC piles, the LHV decreased by 3% in the core and 52% in the shell. Leaf-on SRWC biomass stored in piles created in late spring under climatic conditions in central and northern New York showed differing moisture contents when stored for over 60–90 days. Overhead protection could be used to preserve or improve the fuel quality in terms of the moisture content and heating value if more than two months of storage are required. However, the implementation of such management practice will depend on whether the end users are willing to pay a higher price for dryer biomass and biomass with a higher LHV.
1. Introduction
To meet the goal of annually supplying a billion tons of biomass in the future, energy crops are projected to be the greatest source of biomass in the United States, with an estimated contribution in the range of 411 to 736 million tons by 2040 [1]. Short-rotation woody crops (SRWC) such as poplar (Populus spp.) and willow (Salix spp.) are an asset for the development of a biomass system for bioenergy and bioproducts. Willow has been in development in the United States and Canada for more than 30 years [2,3]. These crops have shown desirable characteristics such as high annual yield and the ability to regenerate by re-sprouting multiple stems after each harvest while having similarities to other woody biomass (i.e., heating value, cellulose, hemicellulose, and lignin content), as well as differences (i.e., bark to wood ratio) [4,5].
A SRWC biomass supply system includes all the processes from cultivation, harvesting, and collection, storage, and transportation to the end user, and may include some preprocessing steps depending on the conversion pathway. Management considerations may dictate that the harvested biomass material be stored prior to delivery to a conversion plant or depot [6]. Most recently, harvested willow biomass has been mixed with forest residues to produce biopower at a 60-MW facility (Black River) and power at another 22-MW facility (Lyonsdale) in northern New York (NY). Moisture content, ash content, heating value, and particle size distribution are among the key quality parameters for biopower systems, because they influence the handling and conversion systems’ efficiency, and thus the cost of production. High moisture content in biomass feedstock may increase the transportation cost and affect the combustion behavior in terms of system efficiency and emissions when used in thermochemical conversion processes [7]. Moisture in biomass reduces the net calorific value, because a fraction of the heat is used to vaporize the water. Freshly harvested willow chips have a moisture content of 44 ± 2.2%, an ash content of 2.1 ± 0.59%, a lower heating value of 10.4 ± 0.52 MJ/kg, and a higher heating value of 18.6 ± 0.19 MJ/kg [8].
Several research studies have examined the effect of various factors such as the particle size, composition of the material, geometries of storage piles, geographic location, covering system, microbial communities, initial moisture, and length of storage on the fuel quality of stored wood chips [9,10,11,12,13,14]. High moisture content is an important driver for the development of fungal and bacterial communities that play a key role in reducing fuel quality and catalyzing the process of self-ignition [9]. Also, the temperature profile and moisture content in storage piles have links with weather conditions [14], which depend on the geographic location and time of year when material is stored.
To reduce the moisture content after harvest, biomass could be either stored in open-air piles [15,16,17,18] or subjected to drying measures [19,20], but both approaches have limitations. Unprotected biomass piles suffer high dry matter losses (up to 20%), while active drying requires energy consumption and incurs additional costs [15,20]. Whittaker et al. [18] investigated dry matter losses from two short rotation willow storage piles that were constructed in March and April, and found that there was a significant reduction in the moisture content in addition to an overall loss of 1.5 GJ/Mg in a six-month-old pile and 1.1 GJ/Mg in another four-month-old pile. Moisture is redistributed during the storage of wood chips in piles, resulting in a general differentiation between a wetter outside layer (shell) and a drier inside layer (core). Rates of changes in moisture in the shell and core also differ by season [21]. For instance, during late spring and the summer, the overall moisture content of the pile could decrease from 50% to 25% moisture content after several months. However, heavy rain and high air humidity could rapidly increase moisture in unprotected piles [14,22].
An alternative approach to maintain biomass quality during storage in piles is to protect the biomass from rewetting by snow or rain [22,23,24,25]. The use of gas-permeable and waterproof membranes that have several agricultural and construction applications can contribute to improved wood chip quality [25]. Covers can be deployed as a means to protect piles from precipitation and allow air flow at nominal cost with no direct energy input; however, limited information is available in the literature investigating these covers in the northeastern United States. The objective of this work was to investigate the effects of cover, storage duration, and depth in storage piles on the moisture content, ash content, and higher and lower heating value of a mixture of leaf-on willow and poplar biomass stored at the edge of the field.
2. Materials and Methods
2.1. Harvests and Storage
A mixture of approximately 50% willow and 50% poplar biomass crops were harvested in late spring starting on 26 May 2016 in a field located at Lafayette, NY (42.980° N, 76.112° W). The field was previously harvested in 2005 and 2010. Due to the layout of the plots in this field and the logistics of the commercial harvest operation, it would be challenging to harvest the poplar and willow plots separately. Leaf proportion from four samples collected from the harvested materials was less than 10% of the total mass. The site was planted in double rows in 1997 with poplar and willow cultivars including SV1 (Salix × dasyclados), NM6 (P. nigra × P. maximowiczii), S25 (Salix eriocephala), S365 (S. caprea × S. cinerea), and S301 (S. interior). Harvesting was conducted with a New Holland FR9080 forage harvester equipped with a New Holland 130FB coppice header [26]. The cutting length was set at 33 mm (the largest size for its configuration). Eisenbies [27] reported the bulk density and particle size distribution of willow chips harvested with the same setting on the harvester. The harvested biomass was transported 21.3 km by dump truck to the Tully Experiment Station (College of Environmental Science and Forestry; 42.797° N, 76.120° W). A wood chip sample comprised of several scoops distributed around the dumped material was collected from each load.
The delivered chips were used to establish wood chips piles on flat and open ground at the site. The Köppen–Geiger climate class of the site is Dfb (snow, fully humid, warm summer) [28]. The piles contained 25 to 40 Mg of wood chips. A bucket loader was used to create the wood chip piles from the multiple loads. A 15-cm base of chips was maintained during pile construction to prevent soil contamination. Pile heights ranged from 2.4 to 3.5 m and the diameter of pile bases varied from 6.1 to 8.0 m.
2.2. Study Plan
To address the objectives of this study, we set up a repeated measurement experiment design. From a total of six storage piles created, we applied three protection treatments. We monitored the moisture content, ash content, and heating value in the piles for five consecutive months at two pile depth levels and two positions.
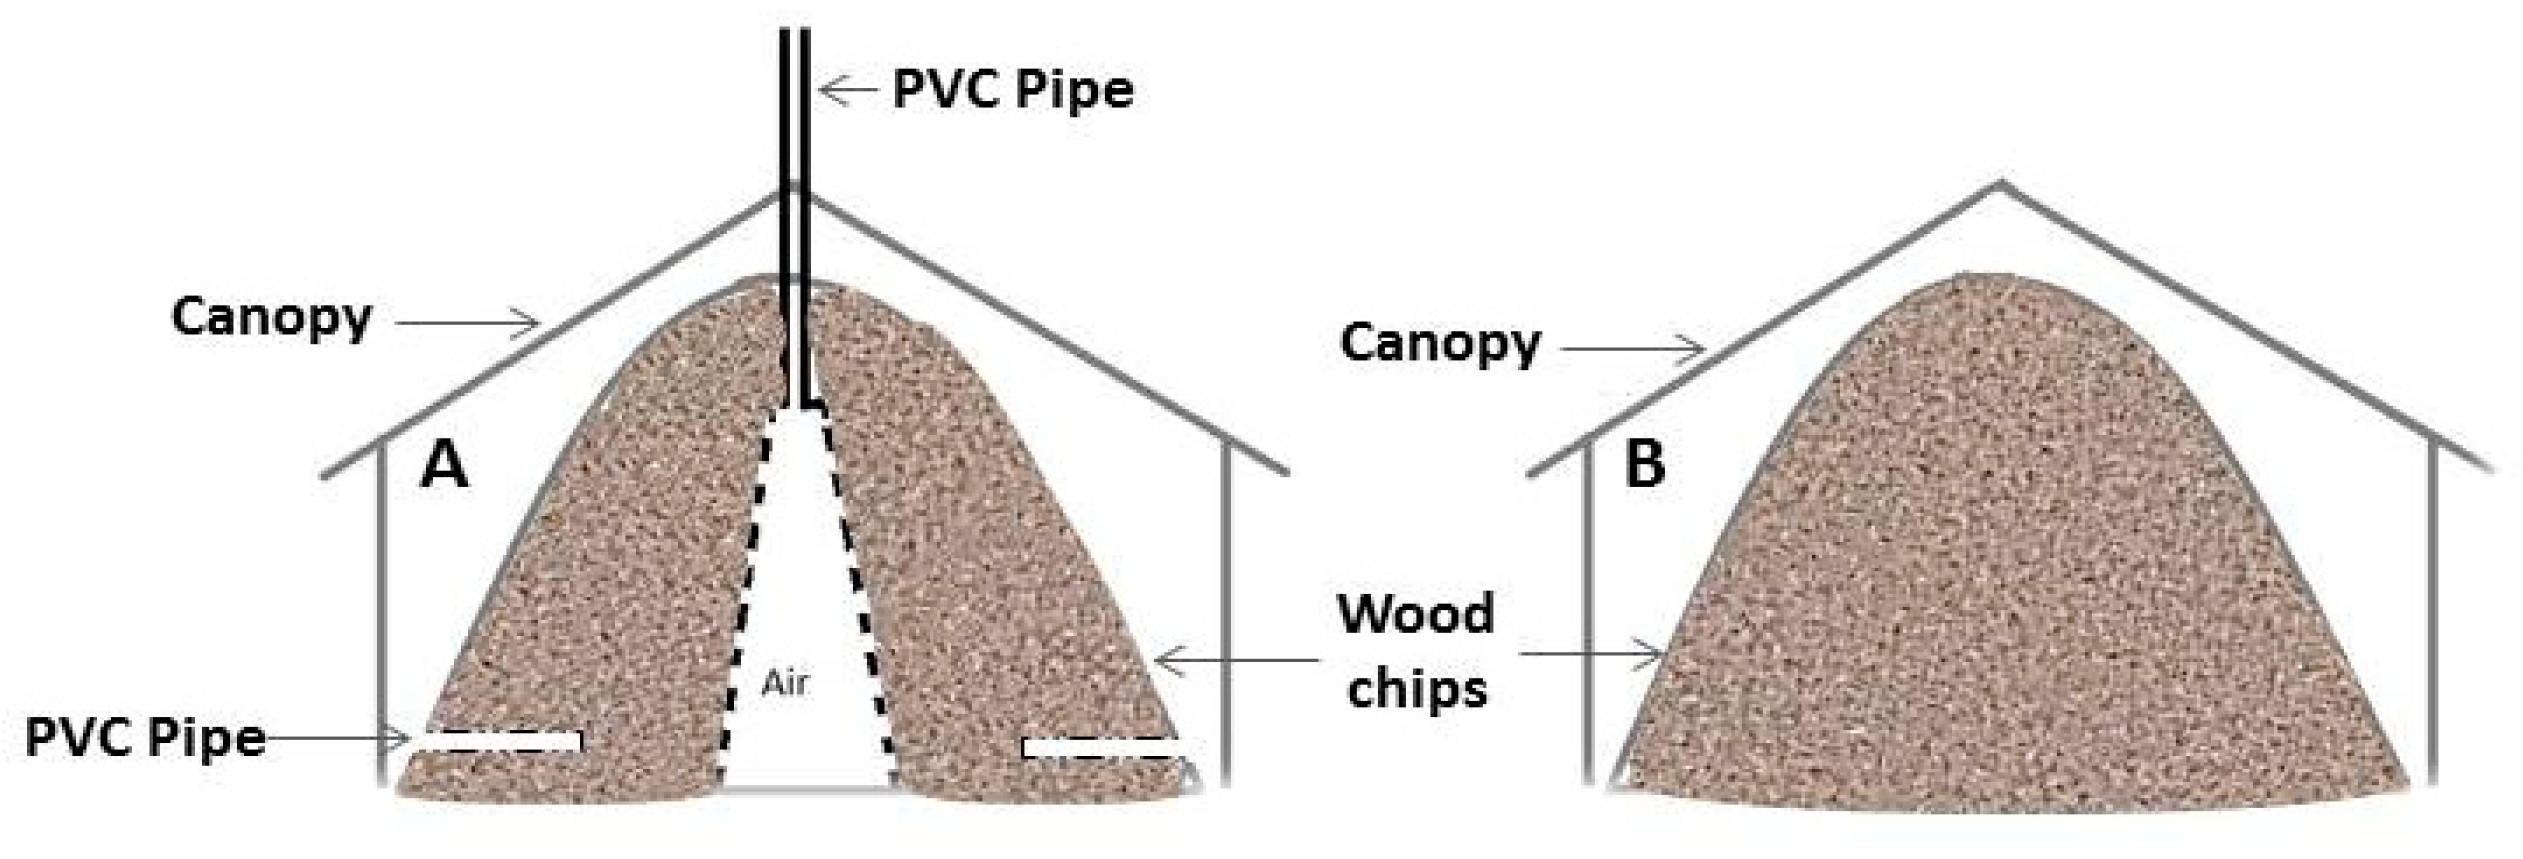
Three protection treatments were randomly assigned to the piles. Unprotected piles had no cover (NC), and were exposed to direct solar radiation and rainfall. The next group of piles had canopies (C) erected to limit direct rainfall, while allowing air to flow from one side to the other (Figure 1). The 3 × 6 m canopies were made of white powder-coated steel frames and white drawstring covers. The final group of piles had canopies plus a dome aeration system (CD). Dome aeration [24] is a method of passive aeration that is used in the aerobic biological degradation of biomass that facilitates gas (including water vapors) accumulation in the interior of the dome and flow through a pipe from the interior to the exterior of the pile. The dome structure was made of construction wood and chicken wire by creating an irregular hexahedron. A 10-cm diameter perforated, polyvinyl chloride pipe was placed at the top of the wooden structure to facilitate the air exchange between the ambient atmosphere and the core of the pile. Wood chips were mounded around the wooden structure to form a chip pile over six to eight perforated PVC pipes, followed by the erection of the canopy. Air was allowed to flow underneath the canopy between the tarp and the wood chip pile in order to maximize the flow of moisture out of the pile.
2.3. Monitoring, Sampling, and Laboratory Analysis
Temperature probes were inserted at two depths in the shell (<45 cm) and core (~1/2 pile height) at two positions: two at the top and two on the sides of the piles. Precise insertion depth was achieved by attaching the probe to a threaded rod with a piece of vinyl tape and a small nut, inserting and raising a three-cm angle iron point side up to create a linear void, and inserting the probe inserted to the required depth. A detailed description of this technique and the cross-section of a pile profile showing the sample and temperature probe locations within the pile can be found in [21]. Then, the angle iron was removed, collapsing the void, and the rod was unscrewed and removed. Temperature loggers (HOBO U12-008) recorded pile temperatures automatically every 30 minutes. A weather station (HOBO U30) was installed on the site to monitor climatic conditions such as air temperature, precipitation, and relative air humidity for the first 100 days. For the remaining storage period, there was a technical issue with the power system of our installed weather station; thus, reported temperature and precipitation data for this period were gathered from PRISM (Parameter-elevation Regressions on Independent Slopes Model) climate data for Tully, NY [29]. PRISM uses elevation and measured climate data to develop climate data sets for smaller spatial grids across the United States [30].
The piles were monitored for five consecutive months; the canopies were not expected to hold up to the snow season, but freshly harvested biomass would be available by November. A minimum of six physical samples was collected monthly from the shell and the core of each pile. To have a better representation of each pile, samples were taken from both positions (the top and side) and depths (shell and core) of the pile. The shell samples were collected by using a drain spade, and the pile surface was recontoured. In order to minimize the disturbances, a custom augur was used to collect samples from the core of the pile by following the technique described by Eisenbies [21]. Then, the samples were weighed immediately to the nearest 0.1 g, and transferred to the laboratory. Moisture content was determined after drying at 60 °C until constant weight was achieved. Dried samples were ground using a Wiley mill and screened through a 0.5-mm screen before they were submitted for heating value and ash content determination. The higher heating value (HHV) was determined in accordance with ASTM (American Society for Testing and Materials) method D5865-13: The standard test method for the gross calorific value of coal and coke was completed using a Parr 6200 Oxygen bomb calorimeter [31]. The lower heating value (LHV) was calculated using the formula described by Krigstin and Wetzel [32] that takes into account the loss of energy associated with moisture and the heat of vaporization. The ash content was determined by combustion in a thermolyne muffle furnace (Model F30400) in accordance with the National Renewable Energy Laboratory NREL/TP-510-42622 method [33].
2.4. Statistical Analyses
The statistical data analysis was conducted in SAS v9.4 (Cary, NC, USA) by using the MIXED procedure. This experiment was a 3 × 2 × 2 factorial design with three protection treatments (no cover, NC; canopy, C; and canopy with a dome aeration system, CD), two depths (core and shell), and two positions (top and side). Wood chips samples were collected at regular time intervals (~four weeks); therefore, repeated measures analysis was performed. To take into account the autocorrelation resulting from the repeated measurements over time, a first-order autoregressive AR (1) covariance structure was applied. The model used includes all the main effects and the interaction terms: (Model = Protection Depth Position Period Protection × Depth Protection × Position Protection × Period Depth × Position Depth × Period Position × Period Protection × Depth × Position Protection × Depth × Period Protection × Position × Period Depth × Position × Period Protection × Depth × Position × Period). The differences of the least squares means were calculated for the factors that are included in the model. Significant differences were claimed for P-values less than 0.05, but the interaction tests were evaluated at a more liberal p-value of 0.10 [34].
3. Results
3.1. Weather Conditions and Pile Temperatures
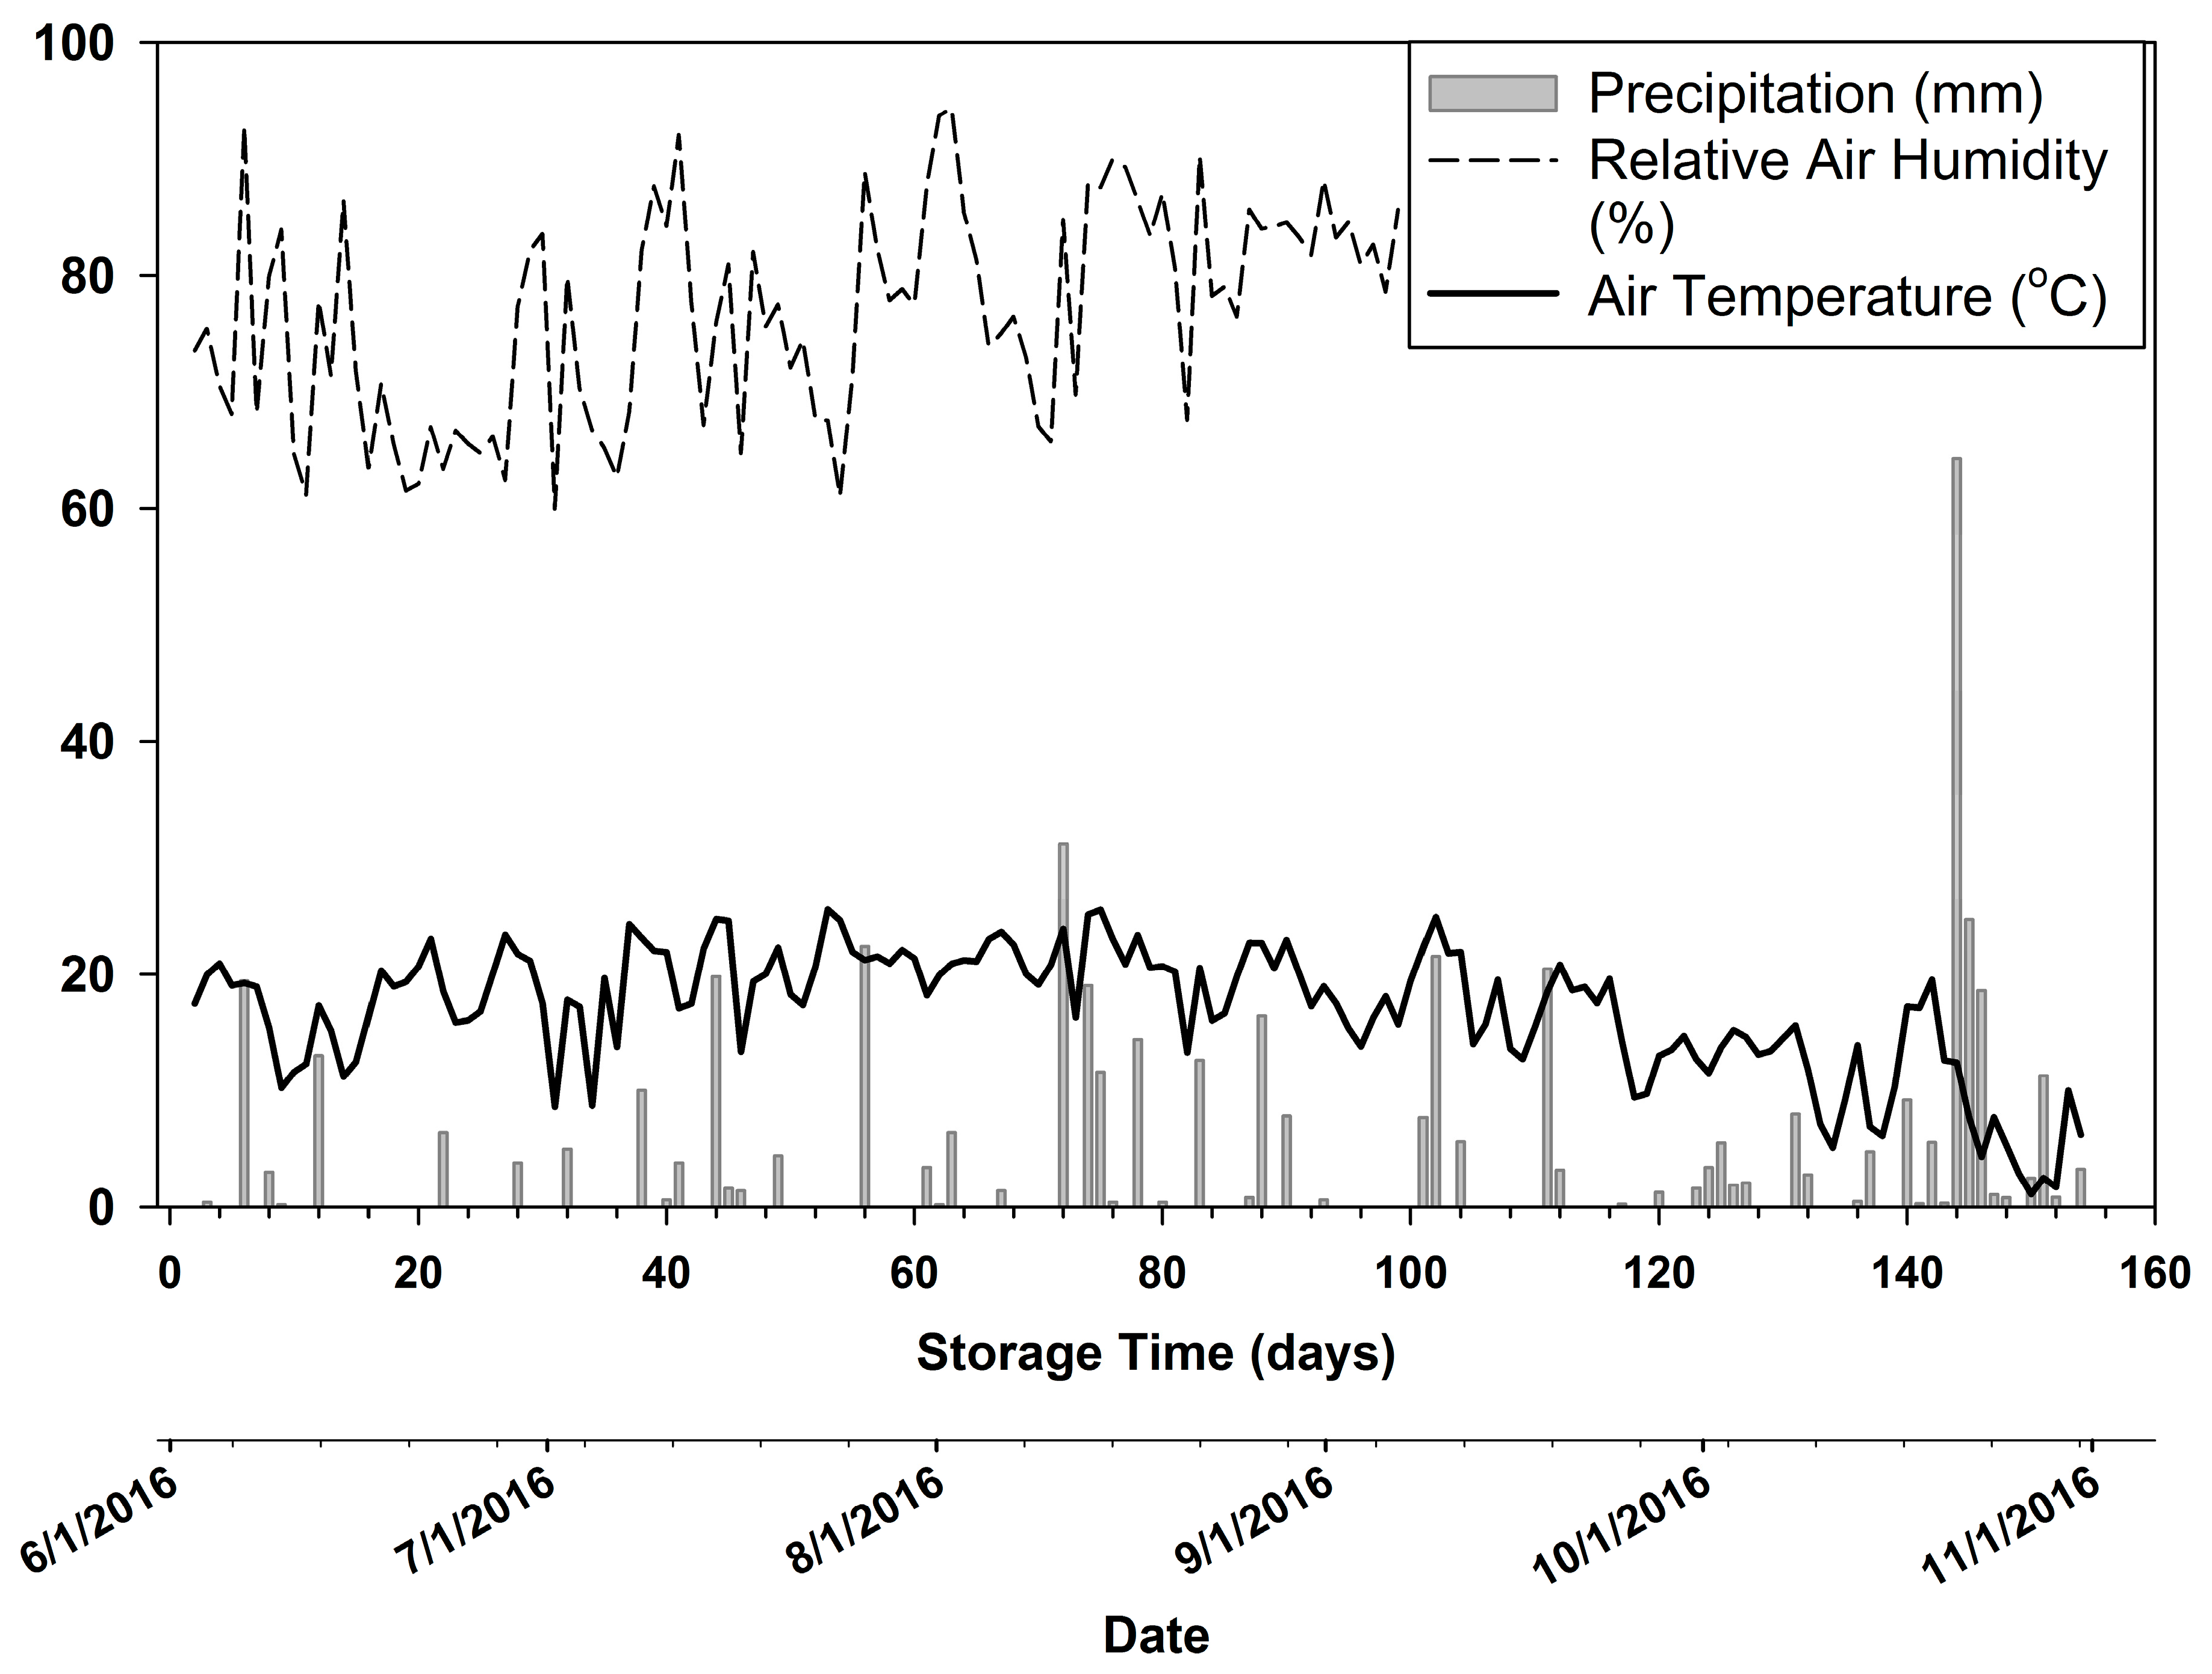
During the first three months, the relative air humidity oscillated between 60–94% and was less than 70% for 10 consecutive days starting from 17 June (Figure 2). Daily mean temperature for the site ranged from 1.1 to 25.5 °C for the entire storage period, and the average daily mean temperature was 17 °C. From 1 June to 1 November, the site received more than 474 mm of rainfall. The months of June and July received about 115 mm of rainfall, while the month of October had 170 mm of rainfall.
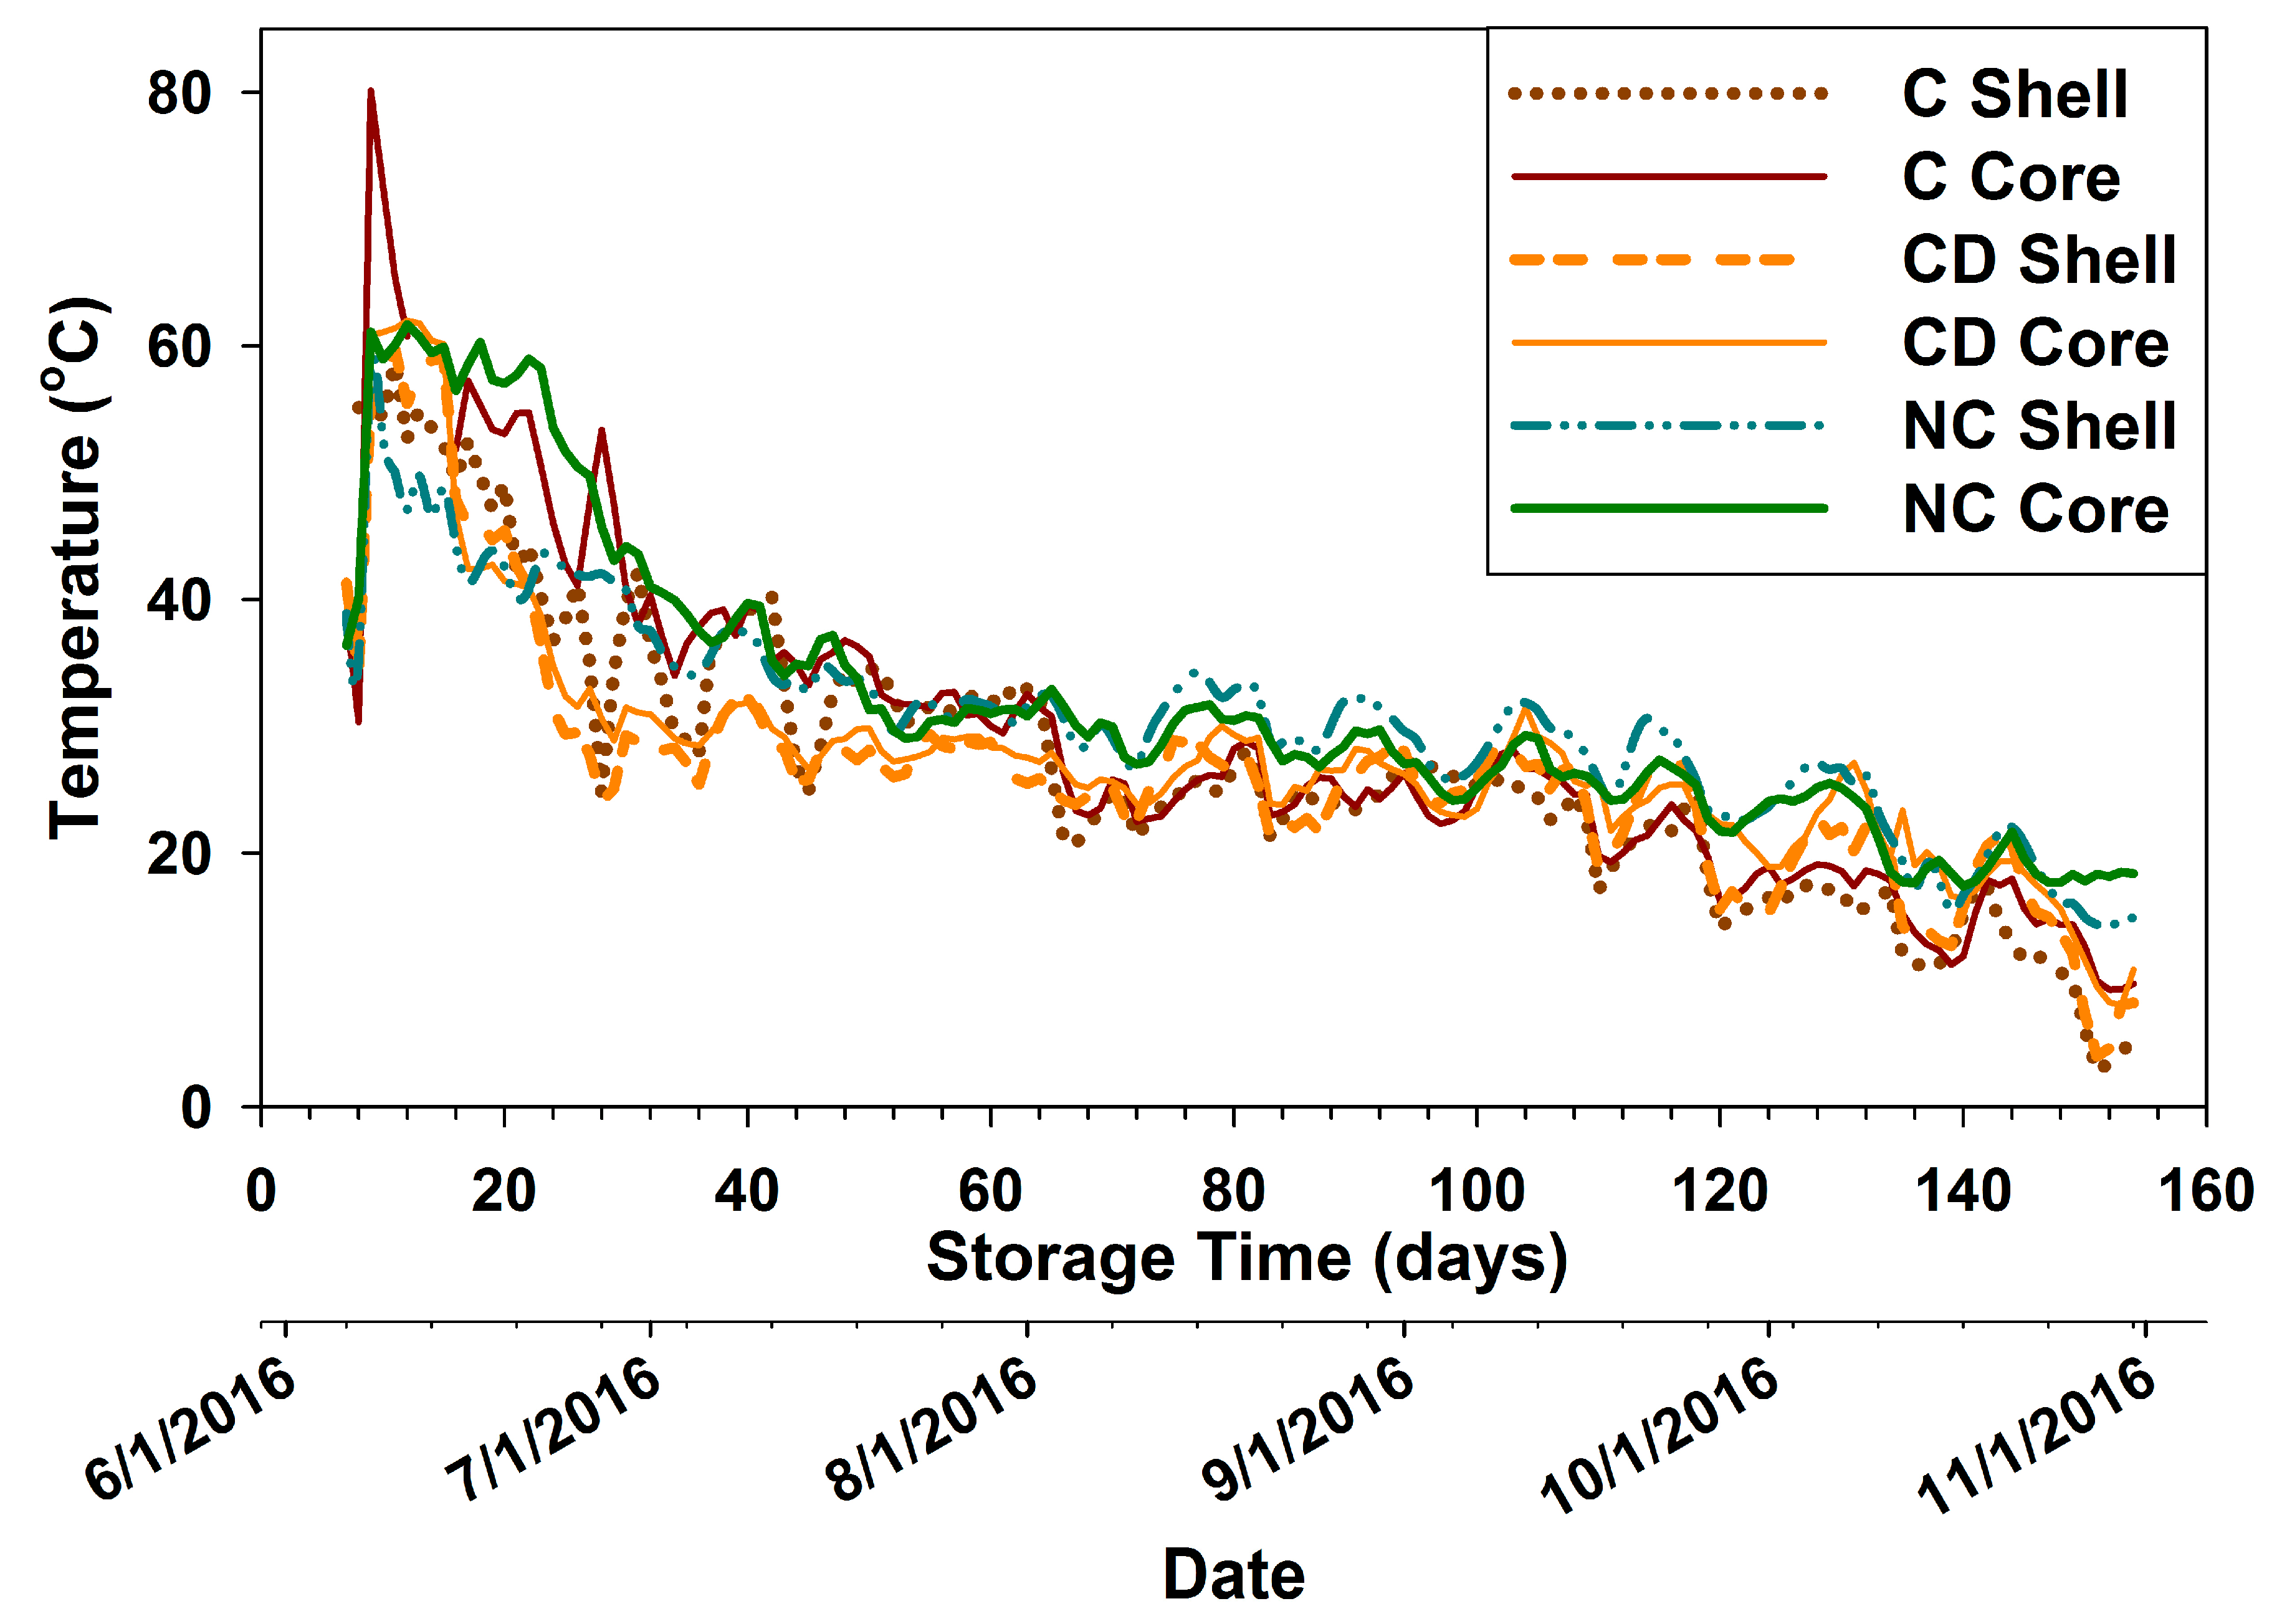
Temperature in the piles increased rapidly, nearing 60 °C after the first week of storage and decreasing thereafter (Figure 3). The temperature in the cores of the CD piles decreased to 35 °C within 30 days of storage, while the temperature in the cores of the NC piles reached the same level after 45 days of storage. After two months, the temperatures in the shells and cores of the NC piles were generally higher than those of both the C and CD piles. The aggregate monthly temperature in the cores and the shells indicated that the shell had a lower temperature than the core for the C and CD piles. However, temperatures in the cores of the NC piles were 9.9 °C higher than those of the shell for the first month, and 1 °C higher for the second month of storage; however, during the third and fourth months, the temperatures in the shells of the NC piles were higher than those in the core.
3.2. Moisture
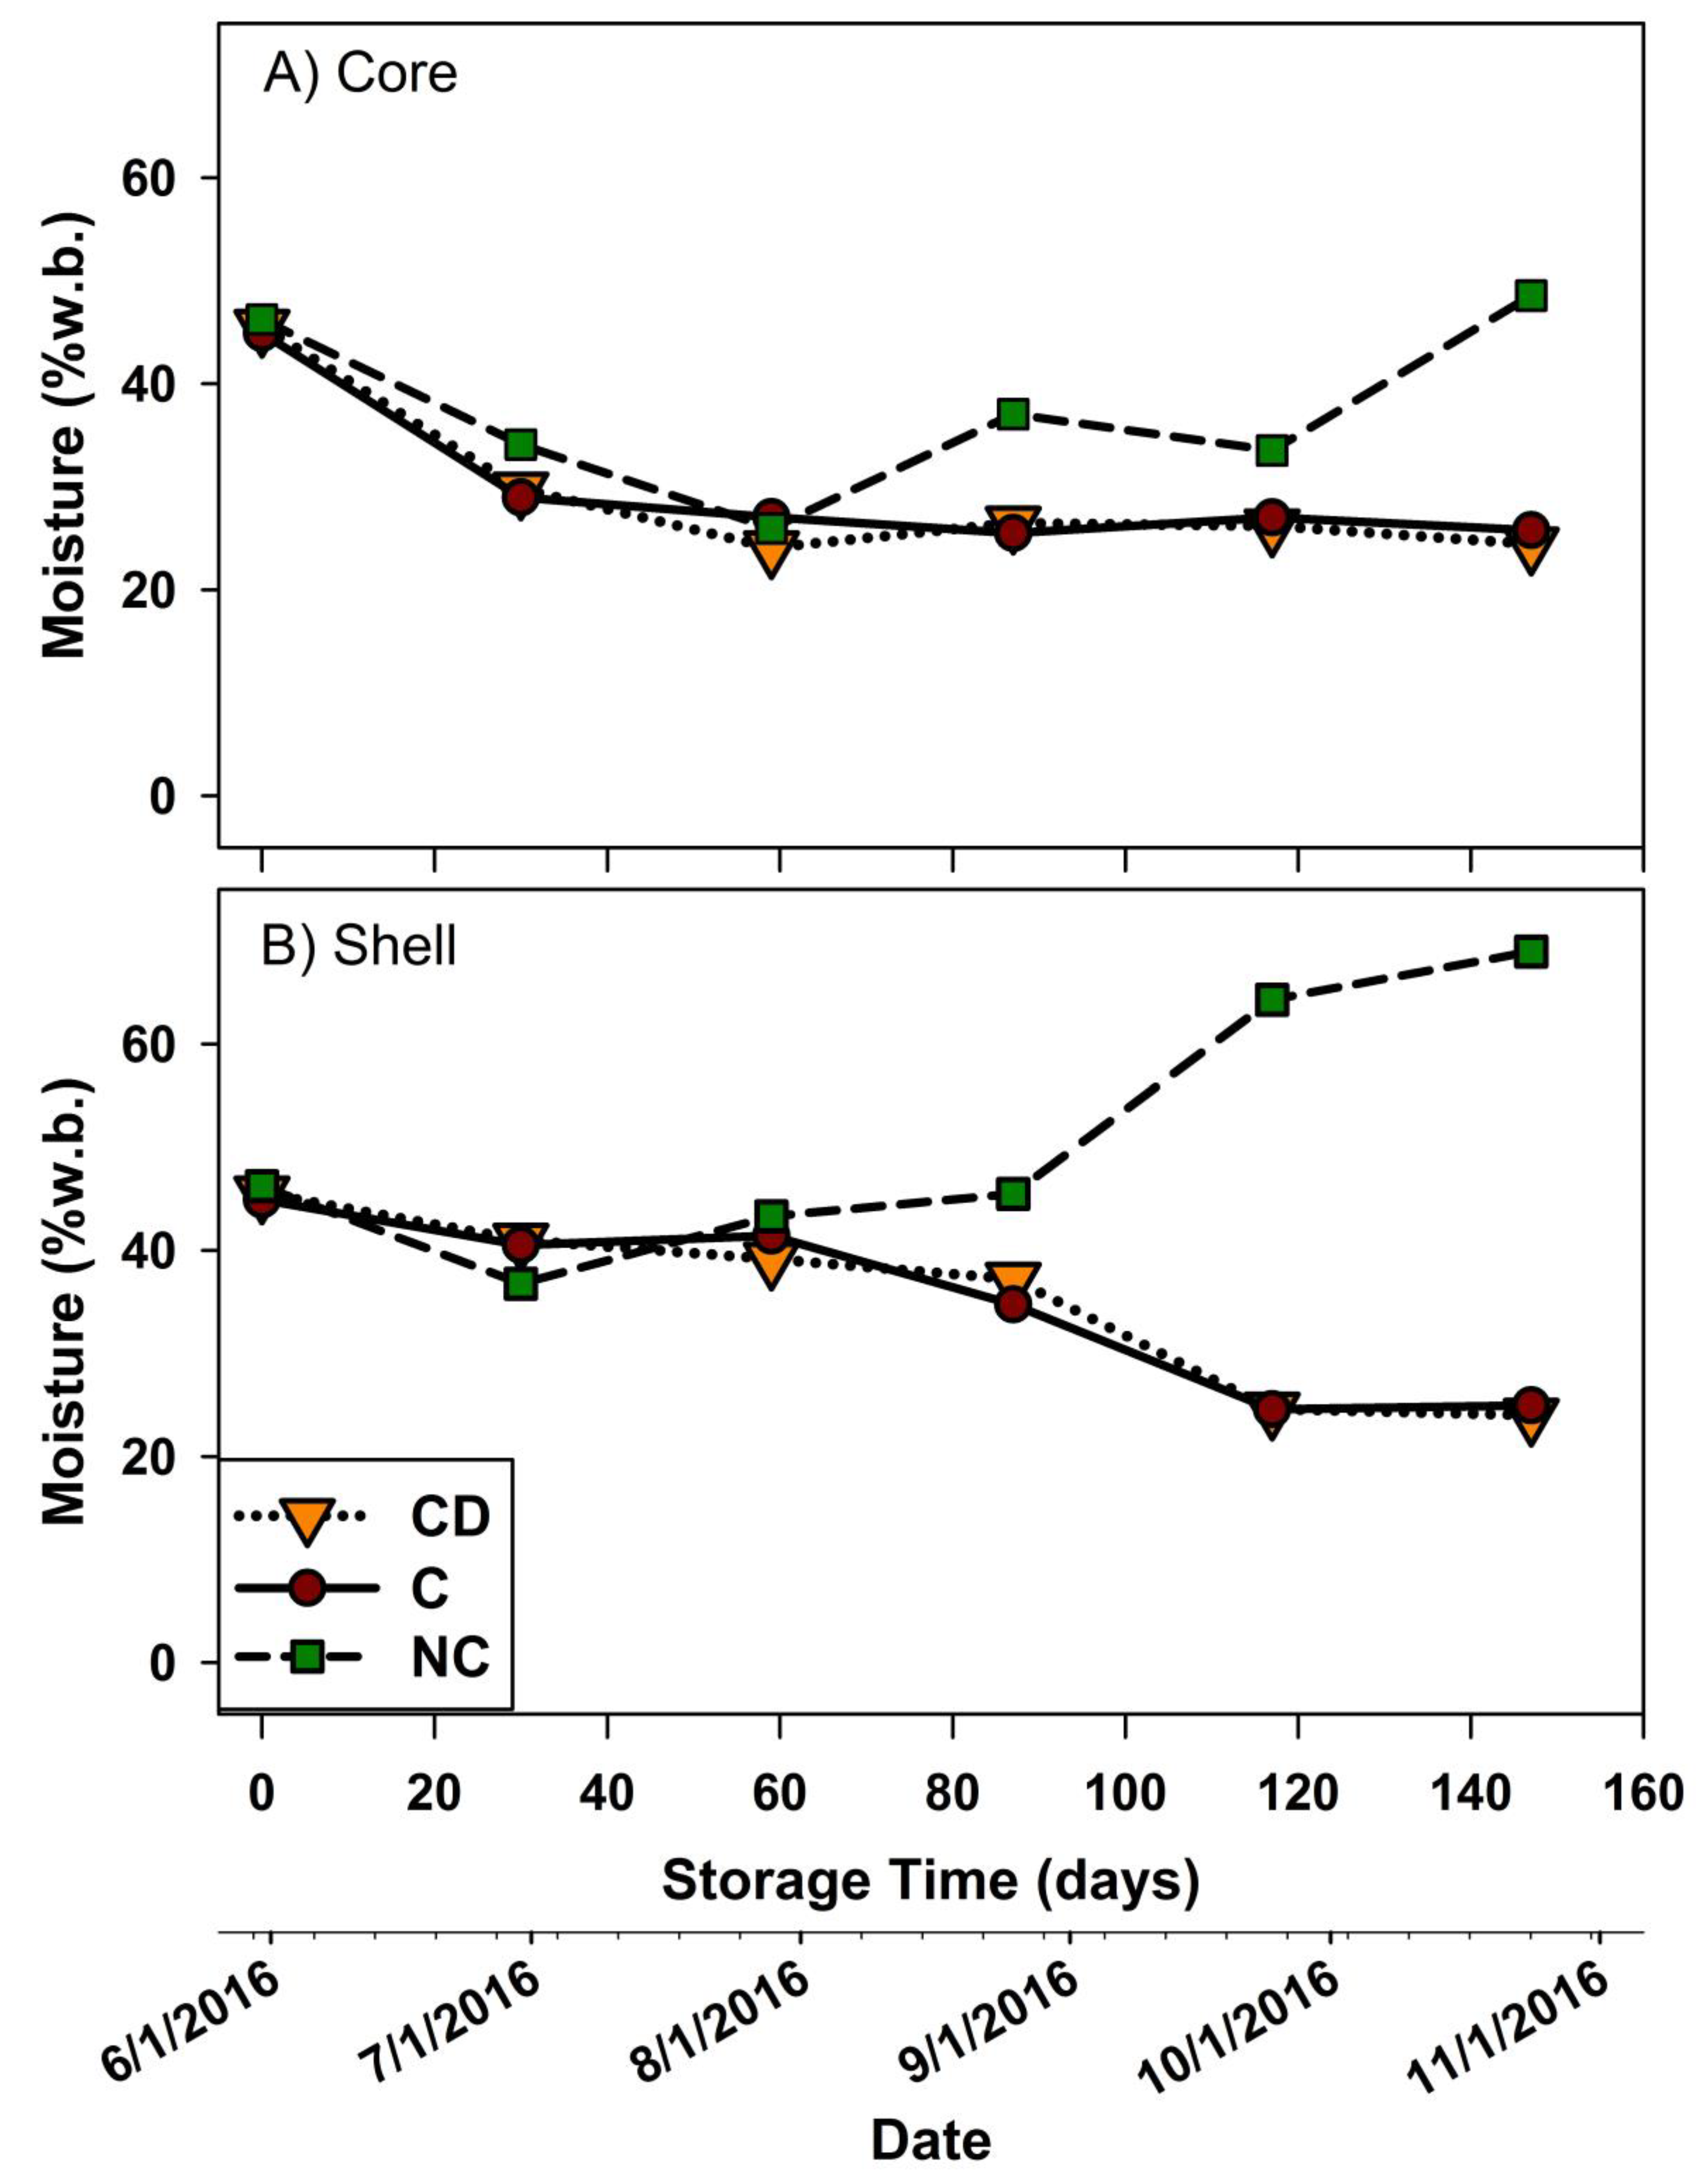
The three-way interaction of depth, protection, and period was significant for moisture content (p = 0.0002) (Table 1). The cores of the NC piles were significantly drier than the shells after 60 days of storage. The C and CD piles had significantly drier cores within the first 90 days of storage, but beyond this period, the shells were slightly drier than the cores, with no statistical significance (Figure 4). The interaction between position and depth was significant (p = 0.0025).
Core samples collected from both the side and the top of the pile were not significantly different (p = 0.7529) to each other, but shell samples from the side were 8.8% drier than the shell samples from the top of the piles (p < 0.0001). The C piles were drier than the NC piles by 9% in the core and 18.6% in the shell. However, the dome feature did not result in significant moisture differences when compared to the C piles (Figure 4), suggesting that passive ventilation in piles of this size did not facilitate additional drying.
Cover was a significant factor in decreasing and maintaining low moisture content. The moisture content in the core of both types of C piles decreased from 45% to less than 30% within 30 days of storage, and remained between 24–27% for the remainder of the storage period. Meanwhile, the biomass in the shells did not dry as quickly as that in the cores of the C piles, which could be attributed to the condensation of water vapors that migrated from the core of the piles. The most significant decrease of moisture content in the shells of the C piles occurred between 60–120 days of storage, and after the moisture content in the core had already equilibrated. Unlike the C piles, the moisture content of the NC piles initially decreased from 46% to 37% in the shell, and 26% in the core after 60 days of storage, and increased thereafter until the end of the storage period.
3.3. Higher and Lower Heating Values
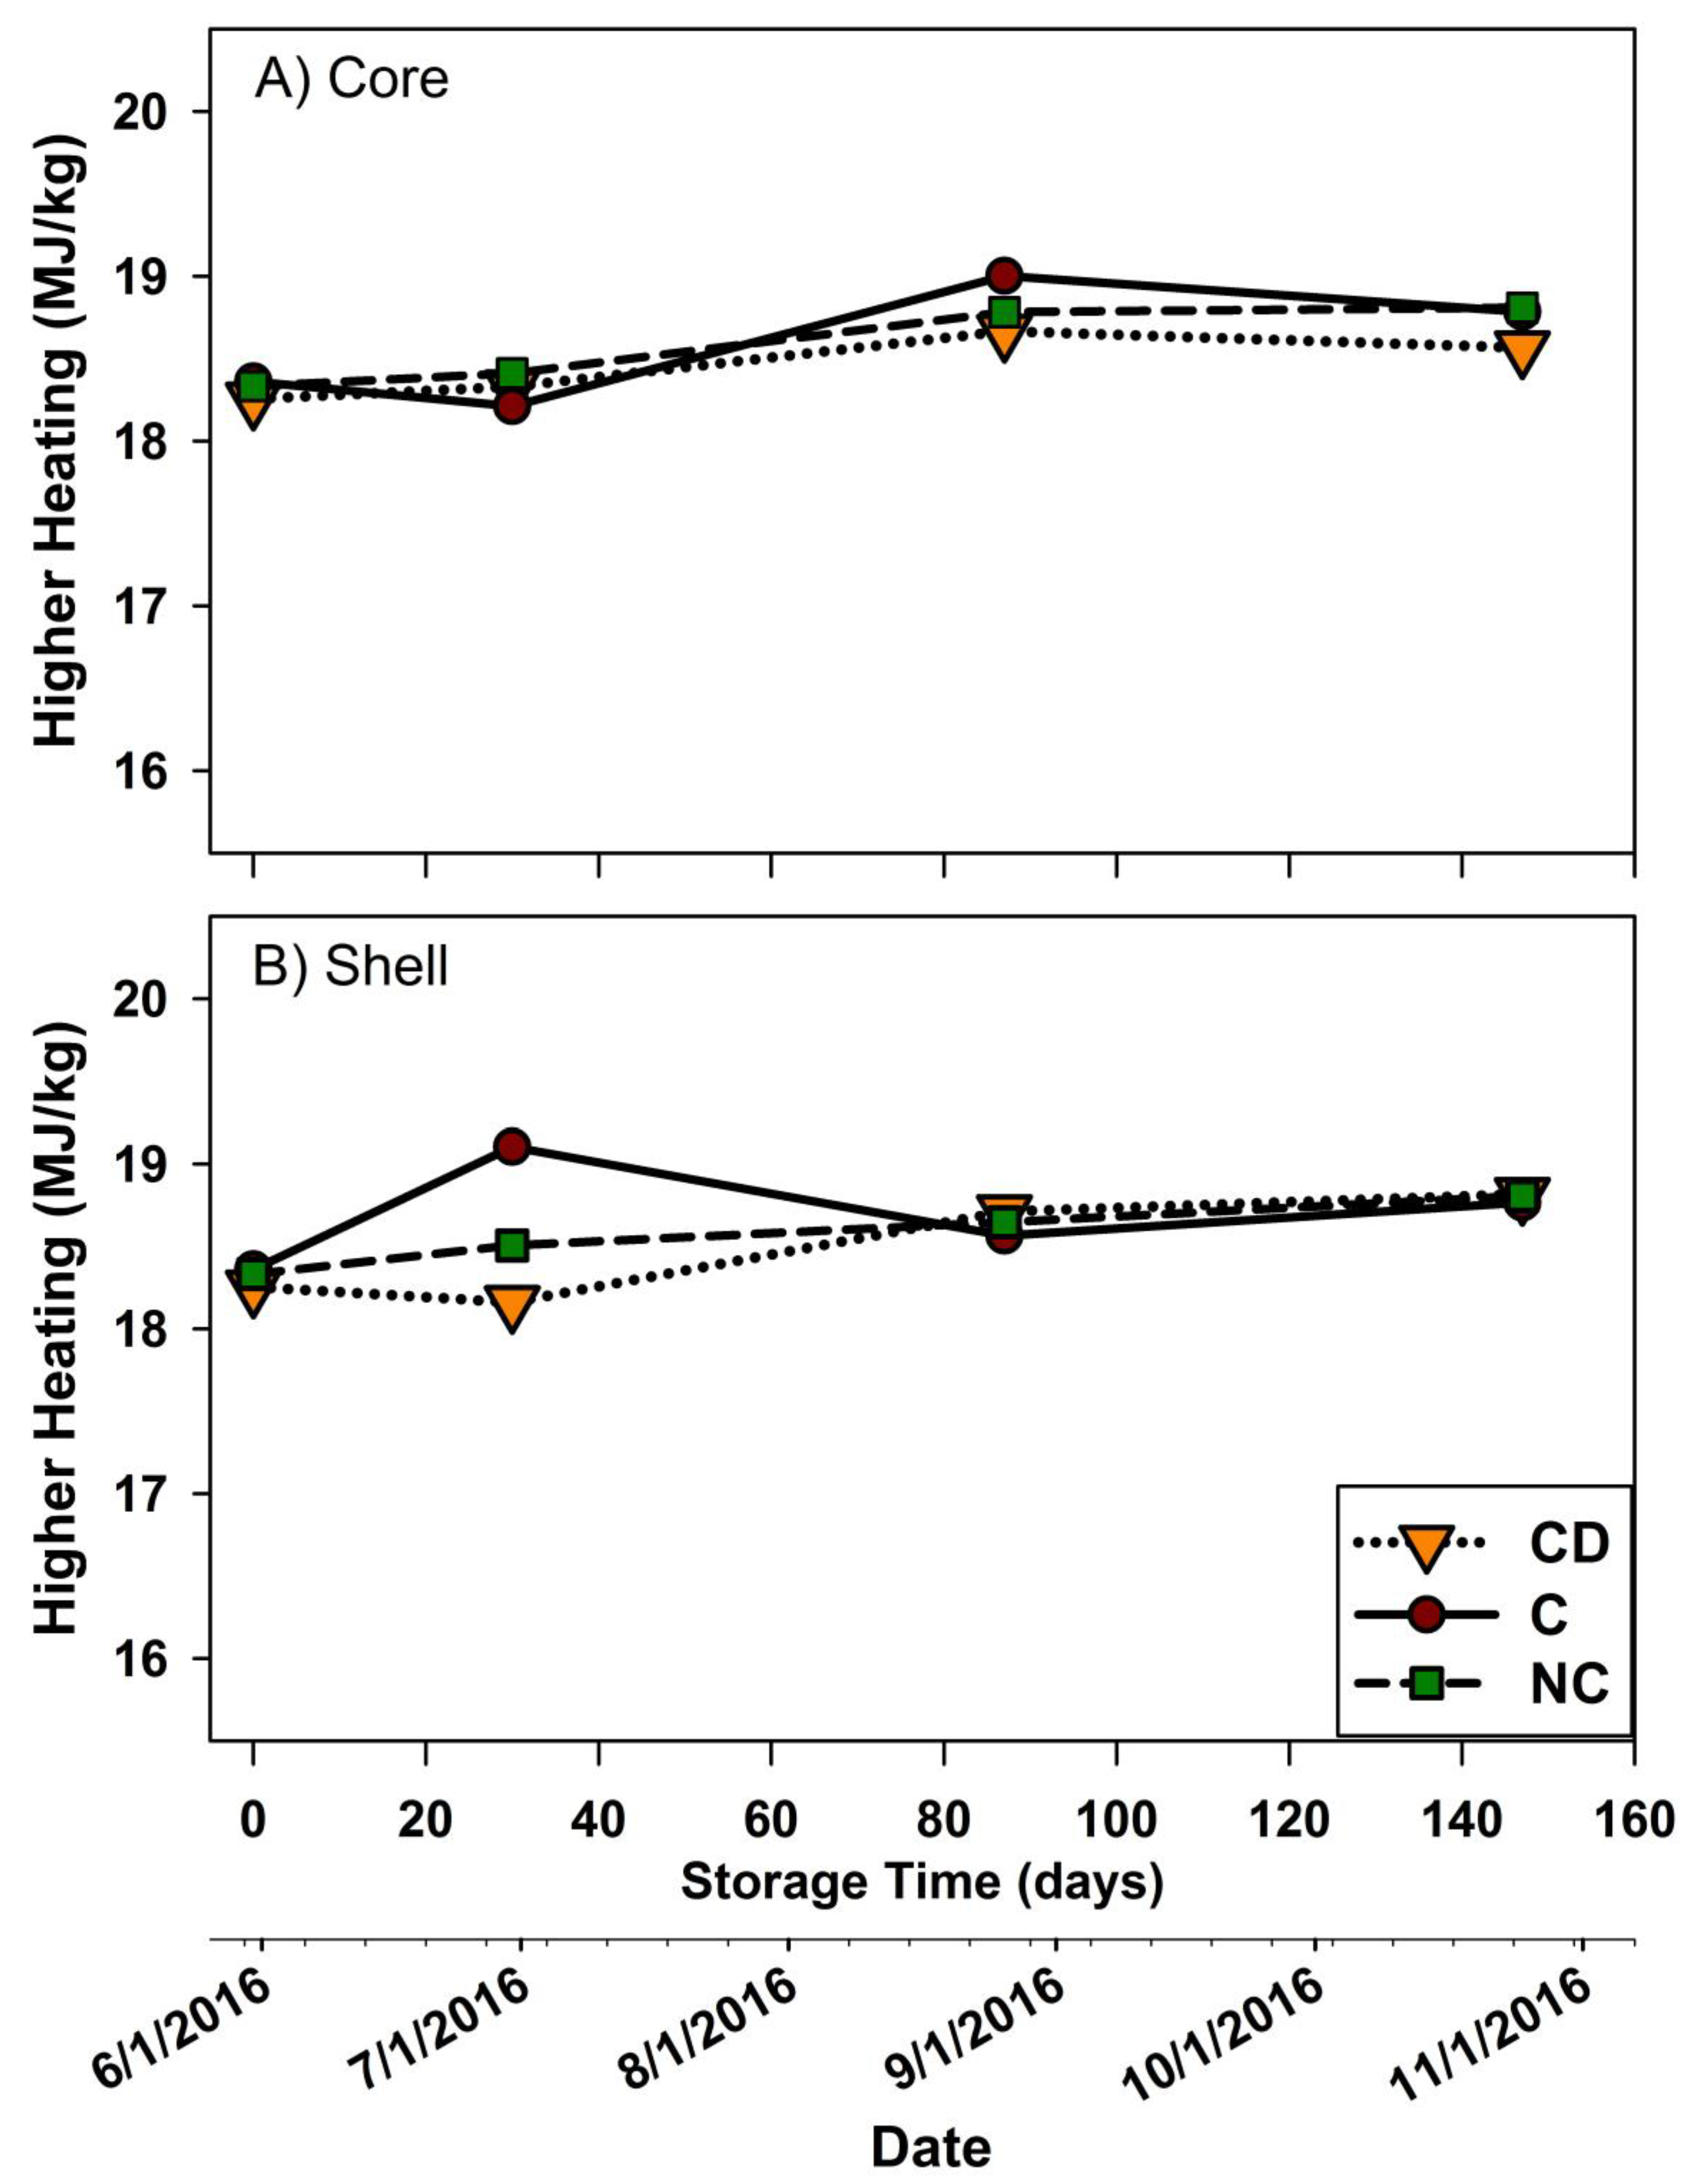
The higher heating value (HHV) of stored willow chips was significantly affected by the storage time (p = 0.0002), but not by the factors such as cover and sample location. There was a significant linear relationship (HHV = 18.355 + 0.0031 t, R2 = 0.18, p < 0.0001 and n = 96) between the HHV and storage time across all the treatments and sample locations (Figure 5), but the change over time was small. The results suggested that the mid-term (up to 150 days) storage of leaf-on willow and poplar chips immediately after harvest in piles increased slightly from 18.31 MJ/kg to 18.76 MJ/kg.
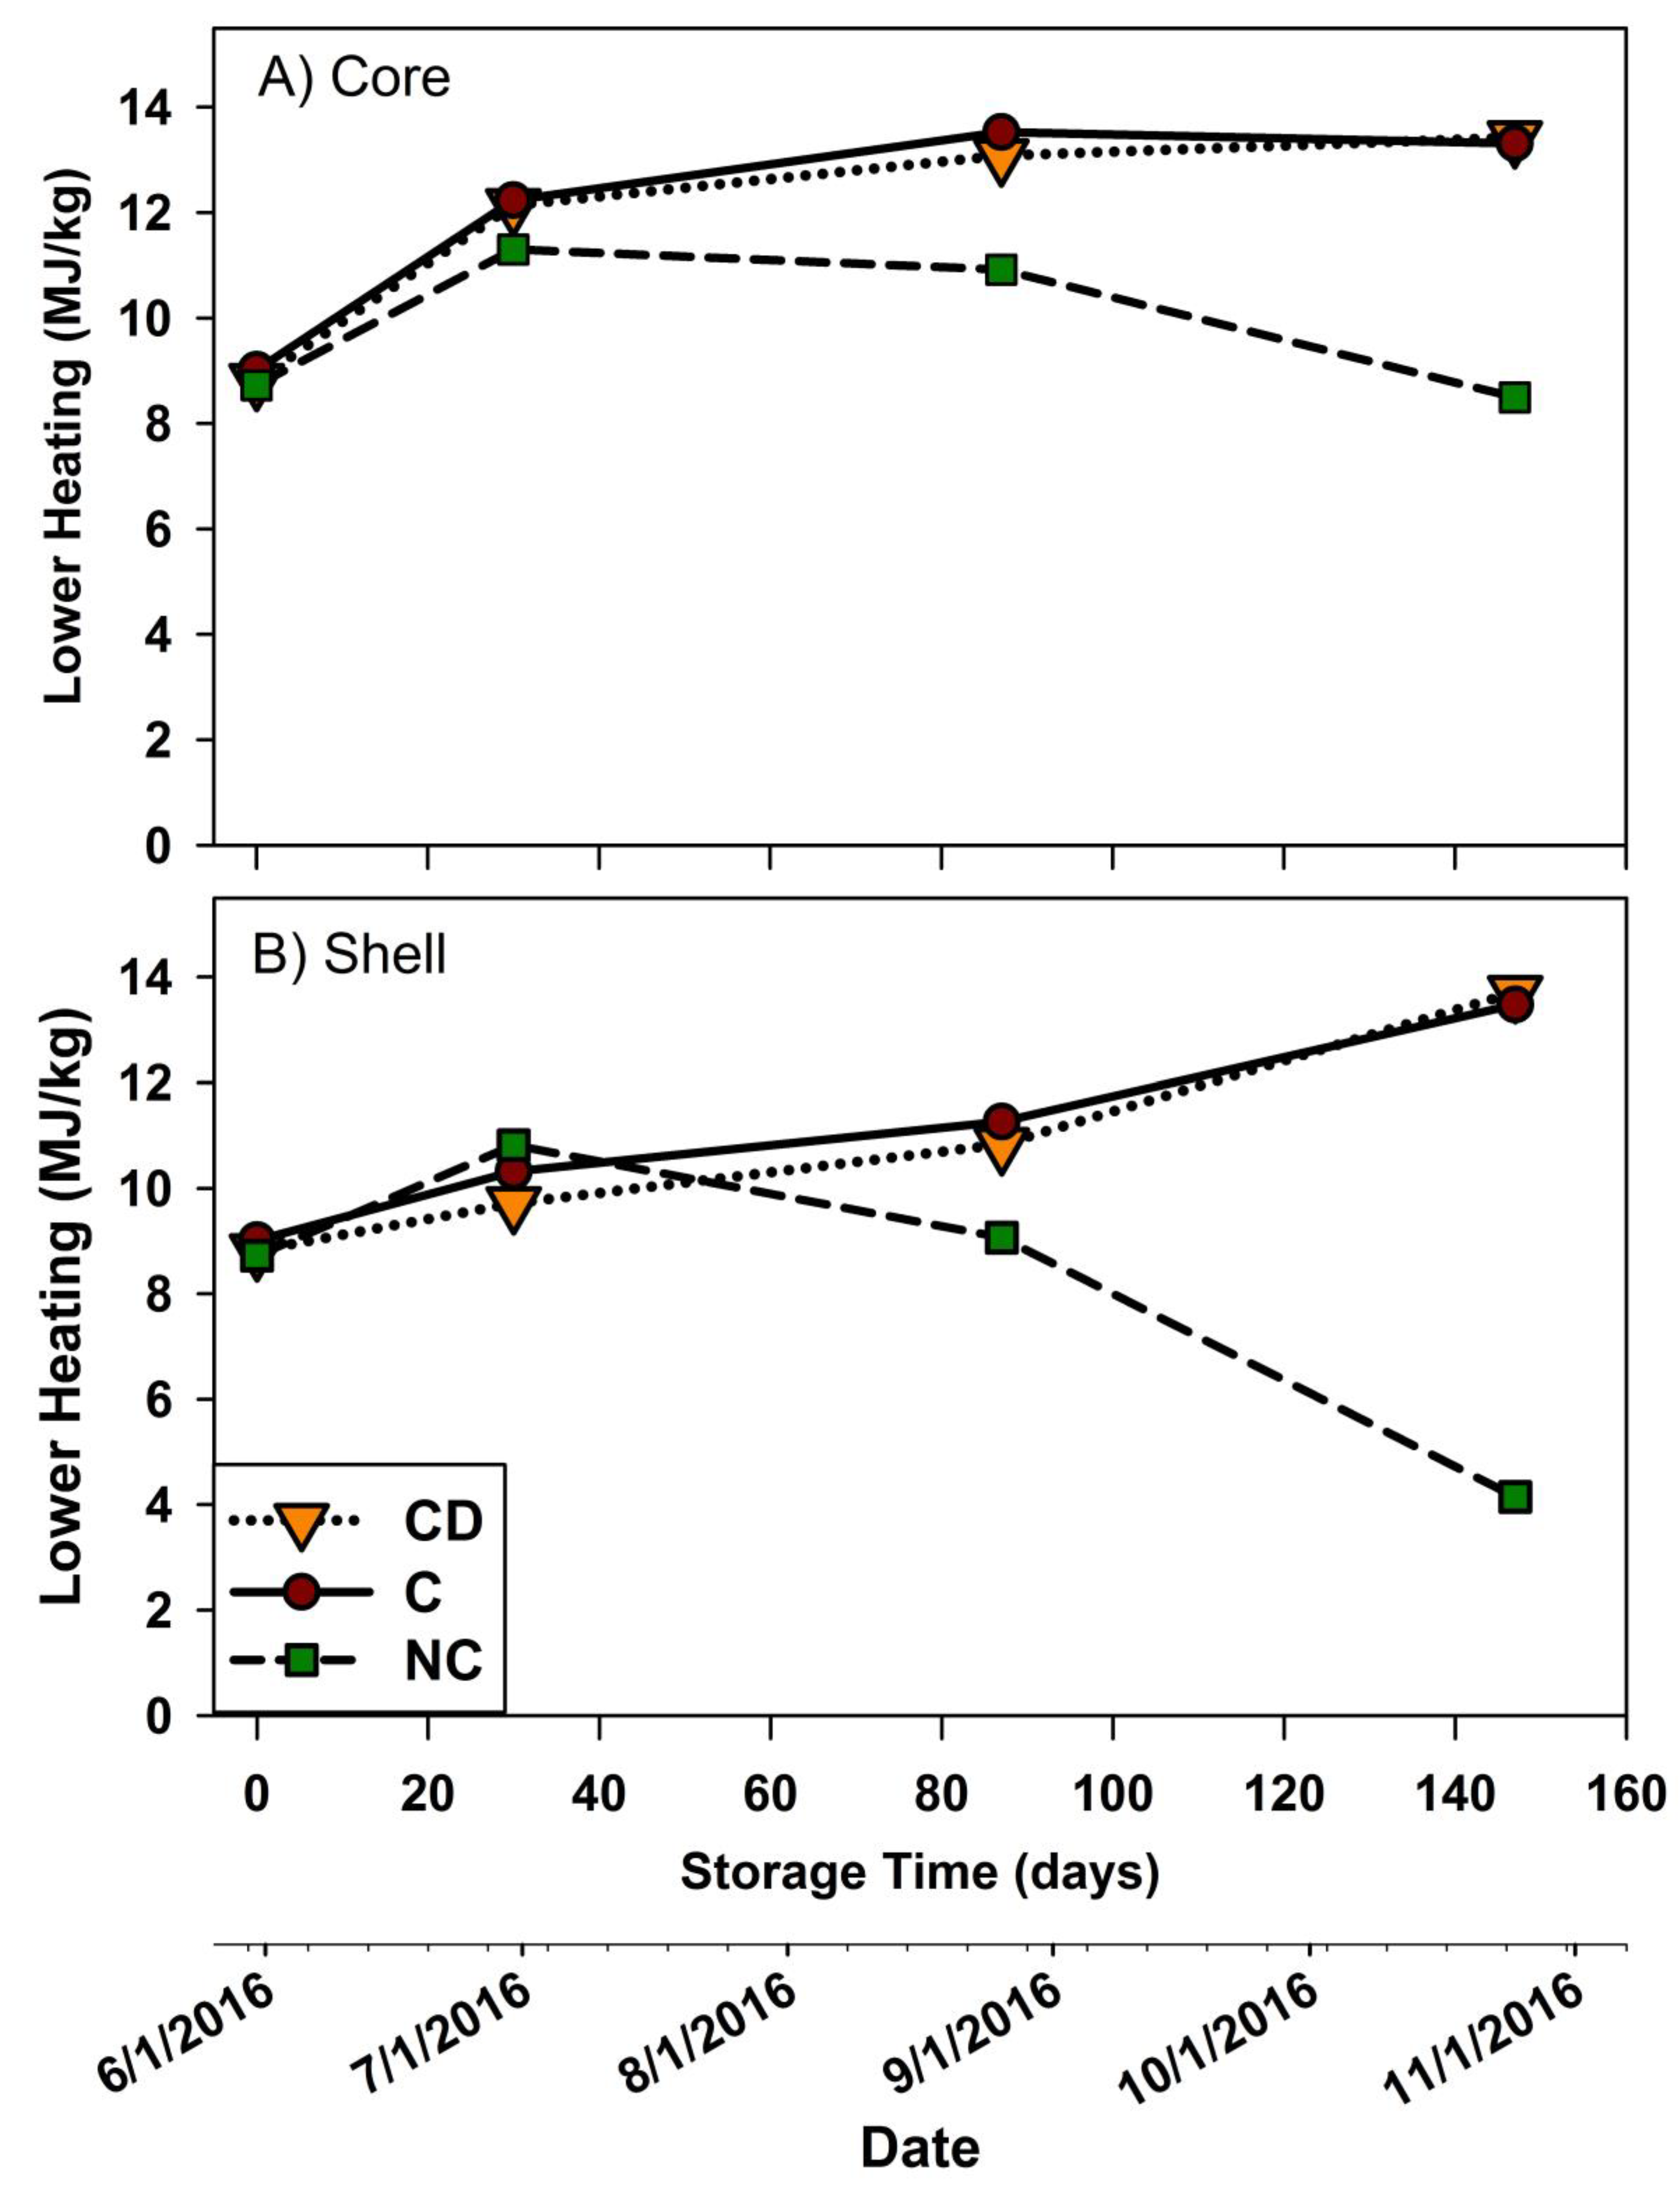
As for moisture content, the three-way interaction between depth, protection, and period was significant for the LHV (p = 0.013) (Table 1, Figure 6). Comparisons of the LHV in the shells and the cores during the storage period indicated that the LHV of the NC piles was higher in the cores than in the shells for the entire storage period. The same observation was true for the C and CD piles for the first 117 days of the trials, but by 147 days, the LHV in the shell and core were not statistically different. The LHV in the core was 4.35 MJ/kg greater than the shell for the NC piles, and the difference was less than 0.29 MJ/kg for the CD piles.
The interaction between depth, position, and period was significant for the LHV (p = 0.051). The LHV of the core samples from the side of the piles was 11.3 MJ/kg, and was not significantly different than the LHV of the core samples from the top (p = 0.79) and the shell samples from the side (p = 0.23) for the entire storage trial. However, the LHV of the shell samples from the top of the piles was 9.2 MJ/Kg, which was significantly lower than the LHV of the shell samples from the side (1.1 to 3 MJ/kg) and the core samples from the top (1.5 to 3.3 MJ/kg).
Pile protection can contribute to the enhanced fuel quality of willow and poplar chips during storage through an increase in the LHV over its initial value and providing a higher value than the NC piles. Initially, the LHV of the willow and poplar biomass chips was 8.85 MJ/kg due to the high moisture content of the freshly harvested material. Although the differences between the LHV of the C and NC piles were not significant after 30 days of storage (p > 0.73), cover became a significant factor resulting in a higher LHV for the rest of the trial. Furthermore, the LHV of the C and CD piles increased over time and remained higher until the end of the storage period. However, in the case of the NC piles, the LHV increased slightly during the first 30 days, and subsequently decreased to about 8.50 MJ/kg in the core and 4.15 MJ/kg in the shell at the end of the trial. These observations suggest that leaf-on willow and poplar biomass that is stored immediately after being harvested for a very short term does not require any protection to get an increase of the LHV, but protection would be necessary to maintain or improve LHV if storage was to occur for more than 60 days.
3.4. Ash
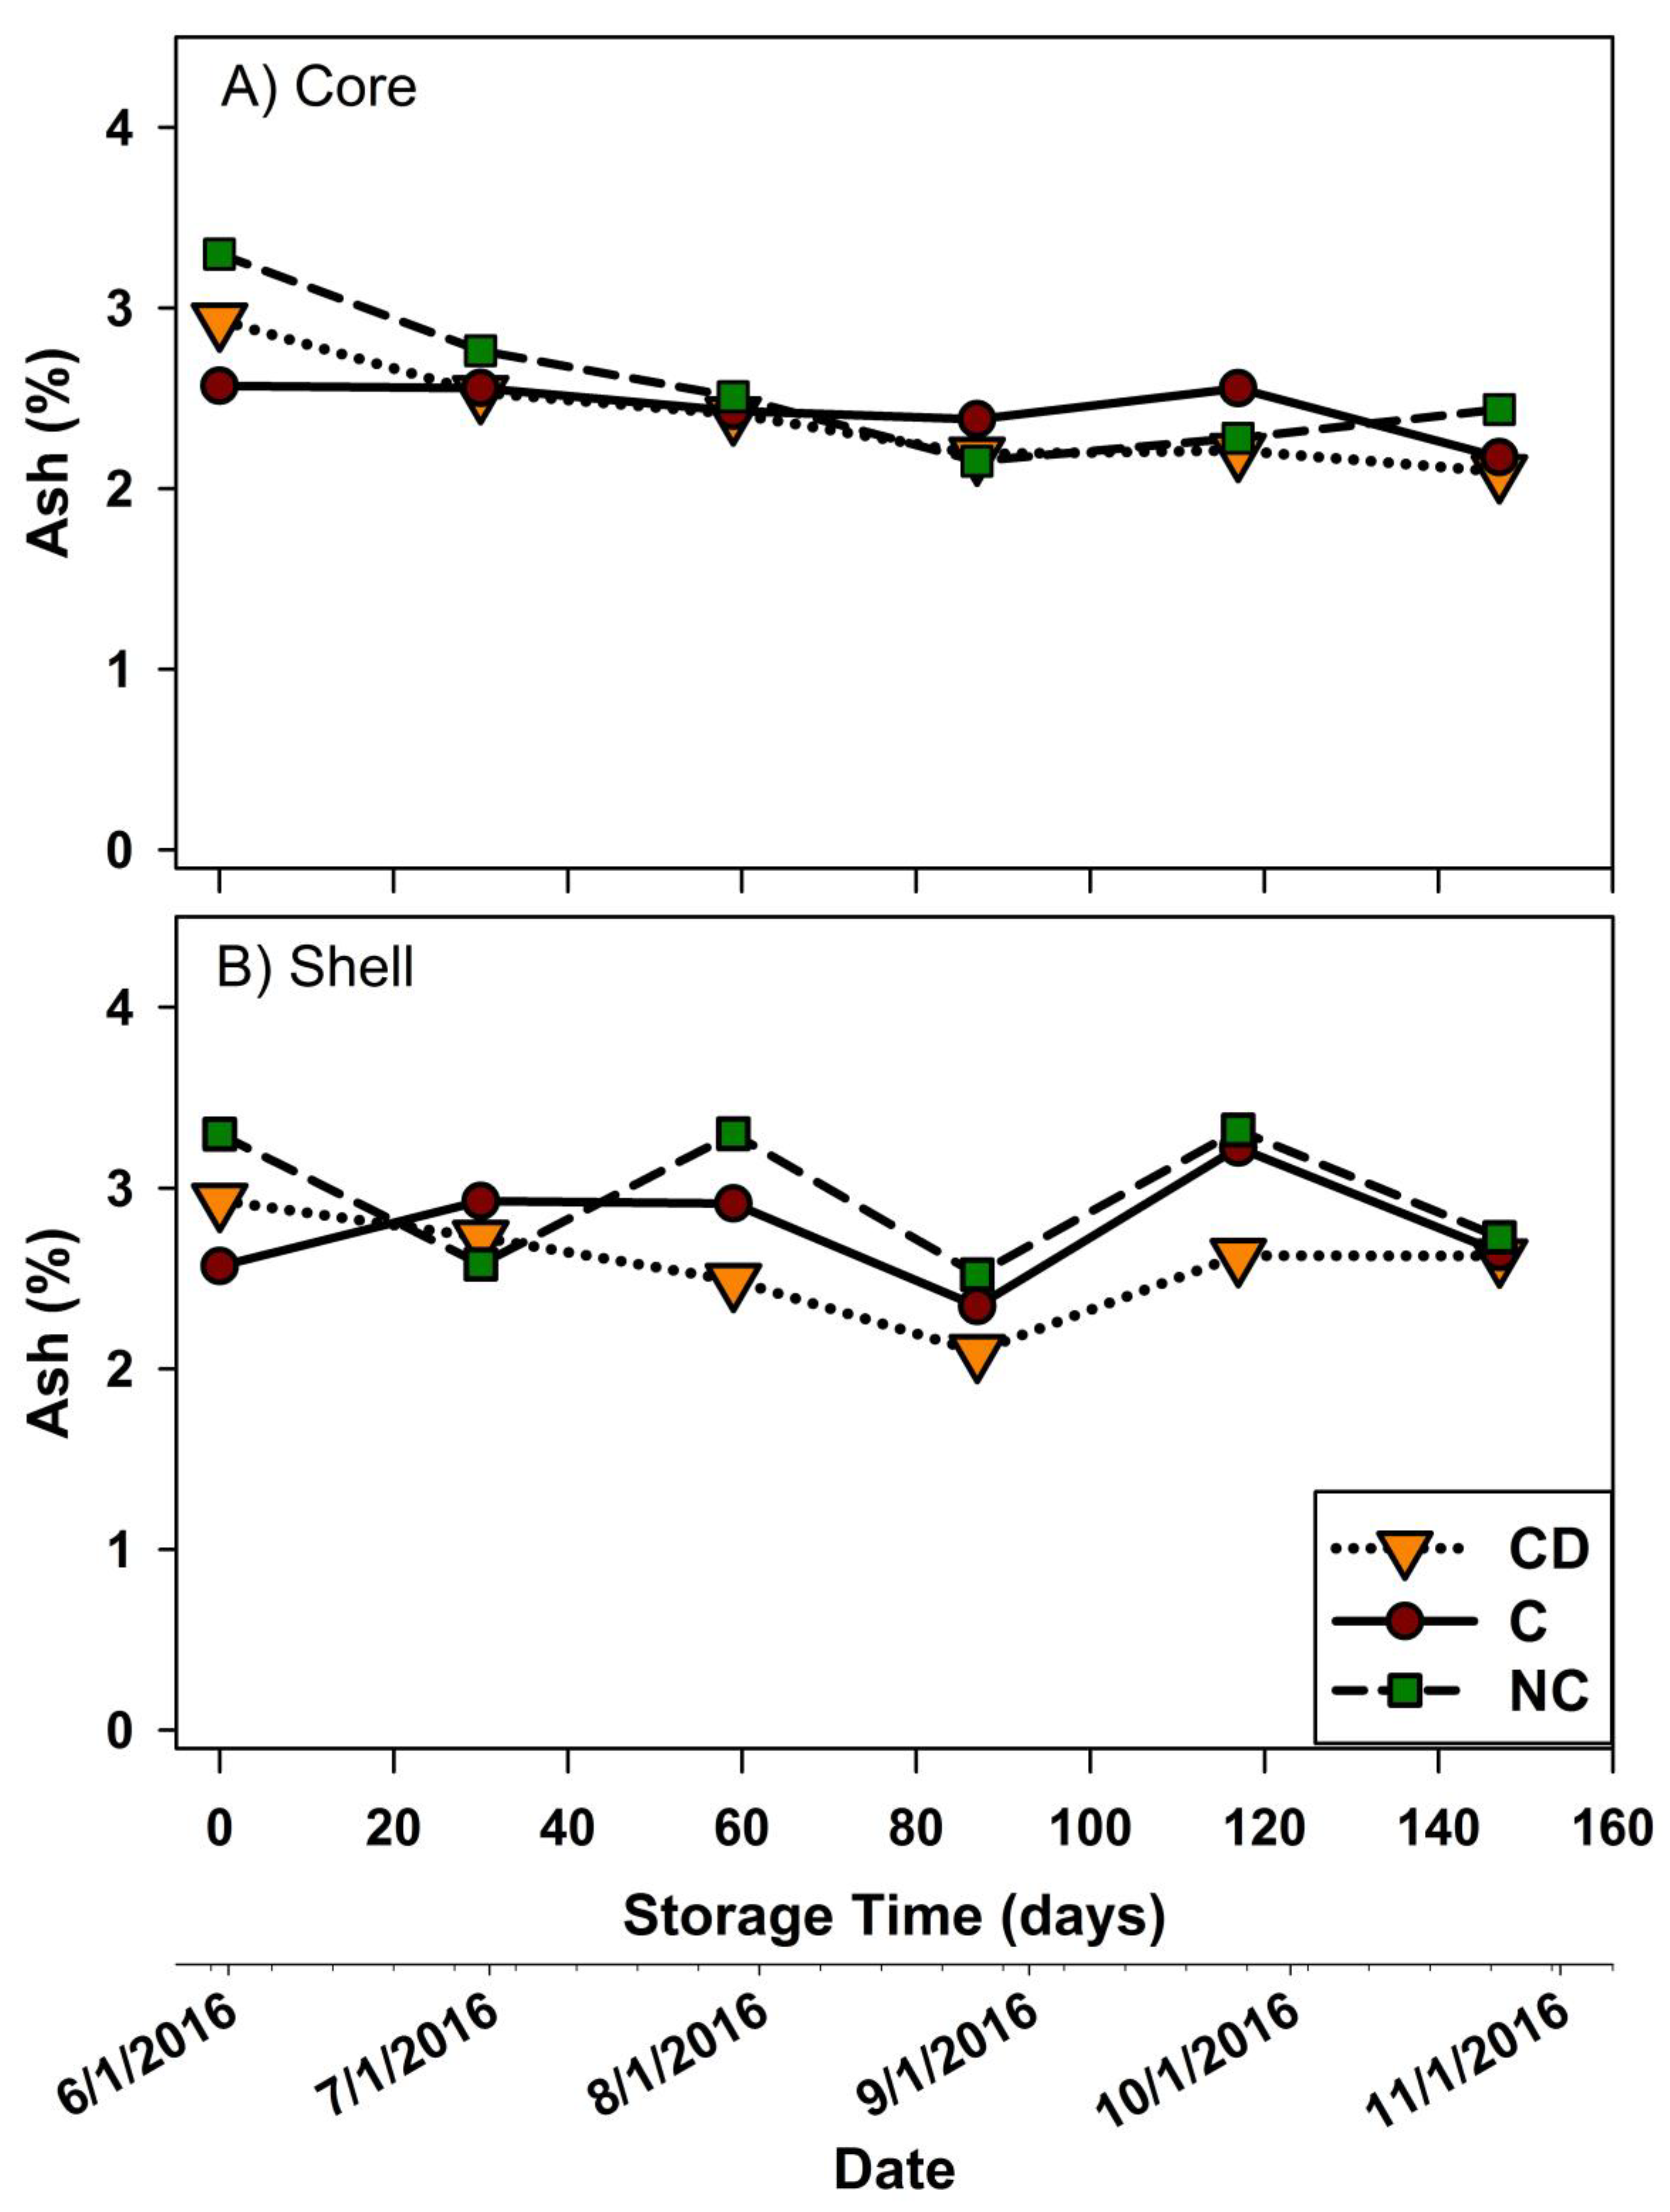
There was a significant DepthxPeriod interaction (p = 0.055) and a significant PositionxPeriod interaction for ash content (p = 0.0138) (Table 1). While there were statistical differences in ash content, mean values were all within a small range of 2.1% to 3.3% in the shell and in the core (Figure 7). The ash content of samples from the shell was more variable over time than the values in the core, and was 0.37% higher than that of the samples from the core across the entire trial.
4. Discussion
Studies on wood chip storage in Europe [12,15,25] corroborate the findings of this study in regards to pile protection. Krzyżaniak [25] found that moisture content decreased from 52.5% to 20.0% over one year when biomass materials were protected with covers made of gas-permeable materials, while observing increases in moisture content for unprotected piles. The benefits associated with covering piles occur when the material is stored for longer periods of time, which will vary based on the timing of the harvest of the material and local weather conditions. In this trial, the benefits of covering the pile were most apparent after 60 days of storage.
The significant decrease in the moisture content of the NC piles during the first two months of this study could be attributed to the high temperature in the pile, low relative air humidity, and low cumulative rainfall during the first two months (Figure 2). Temperature increases in these storage piles primarily occurred due to wood respiration and microbial activities facilitated by high initial moisture content and the presence of leaves and bark in the wood chips. These conditions favor the transfer of moisture from the wood chips to the atmosphere based on the principle that moisture will migrate from the more humid (wet chips) to the less humid (dried air) environment.
Although not measured directly in this study, shoot diameter and branchiness are important parameters, as they can indirectly influence the quality of the wood chip. Previous studies reported models to predict the bark content of willow and poplar stems when the diameter is known [35,36]. Bark content decreases as the stem diameter and branchiness increase. The bark content of two three-year-old willow cultivars from two sites ranged from 14.9% to 22.6% [36]. The mean bark content of two-year-old poplar (cultivar Lux) decreased from 33.9% to 15.1% as the stem diameter increased from 1 to 9 cm [35]. Results from two experimental plots of hybrid poplar located in northern Italy demonstrated the positive correlation between nitrogen content and branchiness [37].
Increased rainfall, the lower pile temperature, and the lower air temperature thereafter were responsible for the increase in the moisture content of the NC piles (Figure 2, Table 2). Although the dome system did not show better performance in terms of moisture content than the canopy system alone, it allowed a faster dissipation of heat from the CD piles. This resulted from the higher surface to volume ratio of the CD pile, and the additional cooling by the perforated pipes installed on the side and top of the piles. The wooden structure from the center of the CD piles increased the surface area of the piles.
The achievement of similar moisture content in the shells of the C and CD piles during the last two sampling periods suggested that the chip piles trend toward equilibrium moisture content. The equilibrium moisture content will vary relative to the ambient air and pile temperatures, precipitation patterns, and humidity conditions in the surroundings [32].
Maintaining low moisture content during storage is desirable to preserve feedstock quality as a fuel source. Low moisture content limits the associated dry matter loss and spontaneous combustion risk [22]. Whittaker et al. [18] reported dry matter loss in the range of 13% to 23% with the higher losses occurring in wetter samples. Other advantages are the reduction of transportation cost per ton of dry matter and better combustion efficiency. The combustion of wet biomass is less efficient; a fraction of the heat produced by the combustion process is required to evaporate the moisture in the biomass, thus reducing the lower heating value of the biomass.
Numerous studies on wood storage have reported no significant change or a decrease of the higher heating value [13,15,21,38], while others have reported a slight increase of heating value [10,16,25] at the end of the storage. Eisenbies [21] found stable HHVs in the range of 18.6 to 19.0 MJ/kg during a six-month winter storage of leaf-off willow biomass in the northeastern United States. Alternatively, a small increase of the HHV of willow biomass from 19.5 to 20.0 MJ/kg was reported in studies conducted in Poland [25]. The increase of HHV in that case, and in our study, may be associated with the degradation of the low-energy content components (e.g., leaf material) that were easily accessible to the microbial community in the storage piles. Krigstin and Wetzel [32] explained in their review that changes to the proportion of components in the biomass will affect energy content. For example, the preferential decomposition of hemicellulose will result in increased heating values, but the loss of extractives or the preferential fungal decomposition of lignin would tend to reduce heating values.
Despite the potential benefit afforded by cover in terms of increased LHV and the decrease of moisture content, the adoption of a storage pile protection system by SRWC growers in the northeastern United States would be affected by whether the value of biomass includes moisture or energy content, or is just based on as delivered mass. The current market for woody biomass in upstate NY primarily pays for wood chips based on the mass of material received, although some smaller facilities have begun to incorporate moisture content into their price. Assuming that the price of biomass is $25/Mg as received, and using the LHV of the material, the end user would pay about $2.77–2.87/MJ at the time of harvest. For NC piles, the price would decrease slightly, and then increase to $3.95/MJ at the end of the storage period (Table 3). For C piles, the price would steadily decrease over time to be $1.87/MJ at the end of the storage period.
From the SRWC grower’s perspective, the value of a 35-Mg pile of chips that are purchased at $25/Mg as received (no dry matter loss is assumed) is greatest ($1141) at the end of the storage period for the NC piles, but greatest at the start of the storage period ($875) for the C piles. Factoring in different rates of dry matter loss [39,40] does not change the decision on when to sell chips. From the grower’s point of view, covering storage piles does not make sense, because there is additional cost and a loss of revenue when chips are purchased on a weight as-received basis.
If end users want to stimulate growers to bring better quality biomass that has lower moisture and higher LHV, paying for chips on LHV should be considered. Using a fixed price of $2.81/MJ, the value of a 35-Mg pile for a grower is greatest at 30 days in a NC pile and at the end of the storage period for C piles. After five months, the gross value of the chips in the C piles is about 17% greater than that of the NC piles. Comparing the highest value for the NC and C piles shows that chips in the C pile after five months ($972) are worth about 7% more than the chips in the NC pile after one month ($906). When dry matter loss is factored in, the pattern is the same for the NC piles, with the highest gross value occurring at one month, but the greatest value for C piles occurs after about three months, rather than five months. There are dynamics associated with changes in the quality of biomass in storage piles, and the way that chips are purchased that will impact the supply chain dynamics of chips from SRWC.
Ash content is one of the most critical parameters for the quality testing of biomass to be used in the thermochemical conversion process. The International Standardization Organization specified three classes (A1.0, A1.5, and A3.0) for ash content in the ISO 17225 standard for solid biofuels [41]. Overall, for all the samples collected during this storage trial, 77% complied with class A3.0. However, 95% of the samples had ash content less than 3.5%, which is lower than many herbaceous biomass sources [42]. Throughout the entire trial, the ash content of the chips was consistent, and there was little variation. Consistency in the ash content with a limited amount of variation in biomass supply over time is important for end users [42]. If end users require lower ash values than are present in SRWC from this kind of harvesting and storage system, then pretreatments such as hot water extraction, washing, or air classification could be employed [43,44], or different types of woody material could be blended.
5. Conclusions
This study characterizes the changes in biomass quality (moisture, ash, and heating values) during the storage of SRWC chips over a five-month period with respect to overhead protection and sample location. Storage piles constructed in late spring went through a natural drying process during the first 60 days. For a longer storage time, covering piles impacted the changes in moisture content. The LHV varied based largely on moisture content, because the HHV variation was small for the duration of the study. Ash content was fairly low and consistent. A covering system is desirable and perhaps necessary to maintain the fuel quality (moisture and LHV) of biomass stored for more than two months, such as wood chip piles in New York state or other regions with similar climatic conditions. However, how end users value wood chips will influence how storage piles are managed at the edge of the field.
Author Contributions
Conceptualization, O.T., M.H.E., and T.A.V.; formal analysis, O.T. and M.H.E.; investigation, O.T.; data curation, O.T.; writing—original draft preparation, O.T.; writing—review and editing, M.H.E., O.T. and T.A.V.; visualization, O.T.; project administration and funding acquisition, T.A.V.
Funding
Funding to complete this research was provided by the US Department of Energy Bioenergy Technologies Office under award number DE- EE0002992, the New York State Energy Research and Development Authority (NYSERDA) Award 30713, and the Agriculture and Food Research Initiative Competitive Grant No. 2012-68005-19703 from the USDA National Institute of Food and Agriculture.
Acknowledgments
The authors would like to thank Karl Hallen for his contribution in the construction of the storage piles, Qian Wang, Dana J. Carris, Eleanor C. Clark, Allison Rutherford and Vanessa Gravenstine for their contribution in samples collection and processing. We thank Dr. Stephen V. Stehman, Distinguished Teaching Professor at SUNY ESF, for reviewing the sampling design and analysis. The comments from three anonymous reviewers contribute to the improvement of this manuscript.
Conflicts of Interest
The authors declare no conflict of interest.
References
- Brandt, C.C.; Davis, M.R.; Davison, B.; Eaton, L.M.; Efroymson, R.A.; Hilliard, M.R.; Kline, K.; Langholtz, M.H.; Myers, A.; Sokhansanj, S.; et al. 2016 Billion-Ton Report: Advancing Domestic Resources for a Thriving Bioeconomy, Volume 1: Economic Availability of Feedstocks; Oak Ridge National Lab (ORNL): Oak Ridge, TN, USA, 2016. [Google Scholar]
- Amichev, B.Y.; Hangs, R.D.; Konecsni, S.M.; Stadnyk, C.N.; Volk, T.A.; Bélanger, N.; Vujanovic, V.; Schoenau, J.J.; Moukoumi, J.; Van Rees, K.C. Willow Short-Rotation Production Systems in Canada and Northern United States: A Review. Soil Sci. Soc. J. 2014, 78, 78. [Google Scholar] [CrossRef]
- Volk, T.; Abrahamson, L.; Nowak, C.; Smart, L.; Tharakan, P.; White, E. The development of short-rotation willow in the northeastern United States for bioenergy and bioproducts, agroforestry and phytoremediation. Biomass Bioenergy 2006, 30, 715–727. [Google Scholar] [CrossRef]
- Volk, T.A.; Abrahamson, L.; Buchholz, T.; Caputo, J.; Eisenbies, M. Development and Deployment of Willow Biomass Crops. In Cellulosic Energy Cropping Systems; Wiley: Hoboken, NJ, USA, 2014; pp. 201–217. [Google Scholar]
- Volk, T.A.; Eisenbies, M.H.; Heavey, J.P. Recent developments in shrub willow crops in the U.S. for bioenergy, bioproducts and bioremediation. In Proceedings of the Biomass and energy crops V, Brussels, Belgium, 20–22 October 2015; Association of Applied Biologists: Wellesbourne, UK, 2015; pp. 1–10. [Google Scholar]
- Lamers, P.; Tan, E.C.D.; Searcy, E.M.; Scarlata, C.J.; Cafferty, K.G.; Jacobson, J.J. Strategic supply system design—A holistic evaluation of operational and production cost for a biorefinery supply chain: Strategic biorefinery feedstock supply system design. Biofuels Bioprod. Biorefining 2015, 9, 648–660. [Google Scholar] [CrossRef]
- Yang, Y.; Sharifi, V.; Swithenbank, J. Effect of air flow rate and fuel moisture on the burning behaviours of biomass and simulated municipal solid wastes in packed beds. Fuel 2004, 83, 1553–1562. [Google Scholar] [CrossRef]
- Eisenbies, M.H.; Volk, T.A.; Posselius, J.; Foster, C.; Shi, S.; Karapetyan, S. Evaluation of a Single-Pass, Cut and Chip Harvest System on Commercial-Scale, Short-Rotation Shrub Willow Biomass Crops. BioEnergy Res. 2014, 7, 1506–1518. [Google Scholar] [CrossRef]
- Noll, M.; Jirjis, R. Microbial communities in large-scale wood piles and their effects on wood quality and the environment. Appl. Microbiol. Biotechnol. 2012, 95, 551–563. [Google Scholar] [CrossRef] [PubMed]
- Brand, M.A.; De Muñiz, G.I.B.; Quirino, W.F.; Brito, J.O. Storage as a tool to improve wood fuel quality. Biomass Bioenergy 2011, 35, 2581–2588. [Google Scholar] [CrossRef]
- Filbakk, T.; Høibø, O.A.; Dibdiakova, J.; Nurmi, J. Modelling moisture content and dry matter loss during storage of logging residues for energy. Scand. J. 2011, 26, 267–277. [Google Scholar] [CrossRef]
- Pari, L.; Civitarese, V.; Del Giudice, A.; Assirelli, A.; Spinelli, R.; Santangelo, E. Influence of chipping device and storage method on the quality of SRC poplar biomass. Biomass Bioenergy 2013, 51, 169–176. [Google Scholar] [CrossRef]
- Pari, L.; Brambilla, M.; Bisaglia, C.; Del Giudice, A.; Croce, S.; Salerno, M.; Gallucci, F. Poplar wood chip storage: Effect of particle size and breathable covering on drying dynamics and biofuel quality. Biomass Bioenergy 2015, 81, 282–287. [Google Scholar] [CrossRef]
- Bedane, A.H.; Afzal, M.T.; Sokhansanj, S. Simulation of temperature and moisture changes during storage of woody biomass owing to weather variability. Biomass Bioenergy 2011, 35, 3147–3151. [Google Scholar] [CrossRef]
- Lenz, H.; Idler, C.; Hartung, E.; Pecenka, R. Open-air storage of fine and coarse wood chips of poplar from short rotation coppice in covered piles. Biomass Bioenergy 2015, 83, 269–277. [Google Scholar] [CrossRef]
- Barontini, M.; Scarfone, A.; Spinelli, R.; Gallucci, F.; Santangelo, E.; Acampora, A.; Jirjis, R.; Civitarese, V.; Pari, L. Storage dynamics and fuel quality of poplar chips. Biomass Bioenergy 2014, 62, 17–25. [Google Scholar] [CrossRef]
- Hofmann, N.; Mendel, T.; Schulmeyer, F.; Kuptz, D.; Borchert, H.; Hartmann, H. Drying effects and dry matter losses during seasonal storage of spruce wood chips under practical conditions. Biomass Bioenergy 2017, 111, 196–205. [Google Scholar] [CrossRef]
- Whittaker, C.; Yates, N.E.; Powers, S.J.; Misselbrook, T.; Shield, I. Dry Matter Losses and Greenhouse Gas Emissions from Outside Storage of Short Rotation Coppice Willow Chip. BioEnergy Res. 2016, 9, 288–302. [Google Scholar] [CrossRef]
- Gigler, J.; Van Loon, W.; Vissers, M.; Bot, G. Forced convective drying of willow chips. Biomass Bioenergy 2000, 19, 259–270. [Google Scholar] [CrossRef]
- Shahrukh, H.; Oyedun, A.O.; Kumar, A.; Ghiasi, B.; Kumar, L.; Sokhansanj, S. Net energy ratio for the production of steam pretreated biomass-based pellets. Biomass Bioenergy 2015, 80, 286–297. [Google Scholar] [CrossRef]
- Eisenbies, M.H.; Volk, T.A.; Patel, A. Changes in feedstock quality in willow chip piles created in winter from a commercial scale harvest. Biomass Bioenergy 2016, 86, 180–190. [Google Scholar] [CrossRef]
- Shinners, K.J.; Wepner, A.D.; Muck, R.E.; Weimer, P.J. Aerobic and Anaerobic Storage of Single-pass, Chopped Corn Stover. BioEnergy Res. 2011, 4, 61–75. [Google Scholar] [CrossRef]
- Shah, A.; Darr, M.J.; Webster, K.; Hoffman, C. Outdoor Storage Characteristics of Single-Pass Large Square Corn Stover Bales in Iowa. Energies 2011, 4, 1687–1695. [Google Scholar] [CrossRef]
- Trois, C.; Polster, A. Effective pine bark composting with the Dome Aeration Technology. Waste Manag. 2007, 27, 96–105. [Google Scholar] [CrossRef] [PubMed]
- Krzyżaniak, M.; Stolarski, M.J.; Niksa, D.; Tworkowski, J.; Szczukowski, S. Effect of storage methods on willow chips quality. Biomass Bioenergy 2016, 92, 61–69. [Google Scholar] [CrossRef]
- Eisenbies, M.H.; Volk, T.A.; Posselius, J.; Shi, S.; Patel, A. Quality and Variability of Commercial-Scale Short Rotation Willow Biomass Harvested Using a Single-Pass Cut-and-Chip Forage Harvester. BioEnergy Res. 2014, 8, 546–559. [Google Scholar] [CrossRef]
- Eisenbies, M.H.; Volk, T.A.; Therasme, O.; Hallen, K. Three bulk density measurement methods provide different results for commercial scale harvests of willow biomass chips. Biomass Bioenergy 2019, 124, 64–73. [Google Scholar] [CrossRef]
- Kottek, M.; Grieser, J.; Beck, C.; Rudolf, B.; Rubel, F. World Map of the Köppen-Geiger climate classification updated. Meteorol. Z. 2006, 15, 259–263. [Google Scholar] [CrossRef]
- PRISM Climate Group, Oregon State University. Available online: http://prism.oregonstate.edu (accessed on 27 December 2018).
- Daly, C.; Halbleib, M.; Smith, J.I.; Gibson, W.P.; Doggett, M.K.; Taylor, G.H.; Curtis, J.; Pasteris, P.P. Physiographically sensitive mapping of climatological temperature and precipitation across the conterminous United States. Int. J. Clim. 2008, 28, 2031–2064. [Google Scholar] [CrossRef]
- ASTM Standard Test Method for Gross Calorific Value of Coal and Coke; ASTM standard D5865; American Society for Testing and Materials: West Conshohocken, PA, USA, 2013.
- Krigstin, S.; Wetzel, S. A review of mechanisms responsible for changes to stored woody biomass fuels. Fuel 2016, 175, 75–86. [Google Scholar] [CrossRef]
- Sluiter, A.; Hames, B.; Scarlata, C.; Sluiter, J.; Templeton, D. Determination of Ash in Biomass; National Renewable Energy Laboratory (NREL): Golden, CO, USA, 2008; p. 8. [Google Scholar]
- Stehman, S.V.; Meredith, M.P. Practical analysis of factorial experiments in forestry. Can. J. For. Res. 1995, 25, 446–461. [Google Scholar] [CrossRef]
- Guidi, W.; Piccioni, E.; Ginanni, M.; Bonari, E.; Nissim, W.G. Bark content estimation in poplar (Populus deltoides L.) short-rotation coppice in Central Italy. Biomass Bioenergy 2008, 32, 518–524. [Google Scholar] [CrossRef]
- Eich, S.; Volk, T.A.; Eisenbies, M.H. Bark Content of Two Shrub Willow Cultivars Grown at Two Sites and Relationships with Centroid Bark Content and Stem Diameter. BioEnergy Res. 2015, 8, 1661–1670. [Google Scholar] [CrossRef]
- Paris, P.; Mareschi, L.; Sabatti, M.; Tosi, L.; Scarascia-Mugnozza, G. Nitrogen removal and its determinants in hybrid Populus clones for bioenergy plantations after two biennial rotations in two temperate sites in northern Italy. iFor. Biogeosci. For. 2015, 8, 668–676. [Google Scholar] [CrossRef]
- Jirjis, R. Effects of particle size and pile height on storage and fuel quality of comminuted Salix viminalis. Biomass Bioenergy 2005, 28, 193–201. [Google Scholar] [CrossRef]
- Whittaker, C.; Yates, N.E.; Powers, S.J.; Misselbrook, T.; Shield, I. Dry matter losses and quality changes during short rotation coppice willow storage in chip or rod form. Biomass Bioenergy 2018, 112, 29–36. [Google Scholar] [CrossRef] [PubMed]
- Wihersaari, M. Evaluation of greenhouse gas emission risks from storage of wood residue. Biomass Bioenergy 2005, 28, 444–453. [Google Scholar] [CrossRef]
- ISO 17225-4 Solid biofuels—Fuel specifications and classes 2014; ISO: Geneva, Switzerland, 2014.
- Kenney, K.L.; A Smith, W.; Gresham, G.L.; Westover, T.L. Understanding biomass feedstock variability. Biofuels 2013, 4, 111–127. [Google Scholar] [CrossRef]
- Therasme, O.; Volk, T.A.; Cabrera, A.M.; Eisenbies, M.H.; Amidon, T.E. Hot Water Extraction Improves the Characteristics of Willow and Sugar Maple Biomass with Different Amount of Bark. Front. Energy Res. 2018, 6, 93. [Google Scholar] [CrossRef]
- Williams, C.L.; Emerson, R.M.; Hernandez, S.; Klinger, J.L.; Fillerup, E.P.; Thomas, B.J. Preprocessing and Hybrid Biochemical/Thermochemical Conversion of Short Rotation Woody Coppice for Biofuels. Front. Energy Res. 2018, 6, 74. [Google Scholar] [CrossRef]
Figure 1.
Cross-section of protected piles with dome (A) and protected piles (B).

Figure 2.
Daily weather patterns at the site where willow and poplar chips were stored in piles for five months (day zero is 31 May 2016).
Figure 2.
Daily weather patterns at the site where willow and poplar chips were stored in piles for five months (day zero is 31 May 2016).

Figure 3.
Daily mean temperature in the core (about ½ depth) and shell (<45-cm depth) of C, NC, and CD piles of willow and poplar wood chips (NC—no cover on pile; C—covered pile; CD—covered pile with dome ventilation).
Figure 3.
Daily mean temperature in the core (about ½ depth) and shell (<45-cm depth) of C, NC, and CD piles of willow and poplar wood chips (NC—no cover on pile; C—covered pile; CD—covered pile with dome ventilation).

Figure 4.
Variation of the moisture content of willow and poplar wood chips stored for five months in piles with three different treatments (NC—no cover on pile; C—covered pile; CD—covered pile with dome ventilation); (A) samples from the core; (B) samples from the shell.
Figure 4.
Variation of the moisture content of willow and poplar wood chips stored for five months in piles with three different treatments (NC—no cover on pile; C—covered pile; CD—covered pile with dome ventilation); (A) samples from the core; (B) samples from the shell.

Figure 5.
Variation of the higher heating value of willow and poplar wood chips stored for five months in piles with three different treatments (NC—no cover on pile; C—covered pile; CD—covered pile with dome ventilation); (A) samples from the core; (B) samples from the shell.
Figure 5.
Variation of the higher heating value of willow and poplar wood chips stored for five months in piles with three different treatments (NC—no cover on pile; C—covered pile; CD—covered pile with dome ventilation); (A) samples from the core; (B) samples from the shell.

Figure 6.
Variation of the lower heating value of willow and poplar wood chips stored for five months in piles with three different treatments (NC—no cover on pile; C—covered pile; CD—covered pile with dome ventilation); (A) samples from the core; (B) samples from the shell.
Figure 6.
Variation of the lower heating value of willow and poplar wood chips stored for five months in piles with three different treatments (NC—no cover on pile; C—covered pile; CD—covered pile with dome ventilation); (A) samples from the core; (B) samples from the shell.

Figure 7.
Variation of the ash content of willow and poplar wood chips stored for five months in piles with three different treatments (NC—no cover on pile; C—covered pile; CD—covered pile with dome ventilation); (A) samples from the core; (B) samples from the shell.
Figure 7.
Variation of the ash content of willow and poplar wood chips stored for five months in piles with three different treatments (NC—no cover on pile; C—covered pile; CD—covered pile with dome ventilation); (A) samples from the core; (B) samples from the shell.


Table 1.
Analyses of variance (ANOVA) for moisture, ash, higher heating value (HHV) and lower heating value (LHV) of willow and poplar chip piles that were sampled over six month period (June–October).
Table 1.
Analyses of variance (ANOVA) for moisture, ash, higher heating value (HHV) and lower heating value (LHV) of willow and poplar chip piles that were sampled over six month period (June–October).
| Moisture | Ash | HHV | LHV | |||||||
|---|---|---|---|---|---|---|---|---|---|---|
| Source of Variation | df a | F Value | p > F | F Value | p > F | df | F Value | p > F | F Value | p > F |
| Protection | 2 | 18.05 | 0.0213 | 3.27 | 0.1764 | 2 | 1.12 | 0.4321 | 30.43 | 0.0102 |
| Depth | 1 | 38.85 | <0.0001 | 12.3 | 0.0008 | 1 | 0.33 | 0.5692 | 18.74 | <0.0001 |
| Position | 1 | 12.91 | 0.0006 | 0.86 | 0.3581 | 1 | 0.01 | 0.919 | 9.06 | 0.0043 |
| Period | 5 | 13.79 | <0.0001 | 6.6 | <0.0001 | 3 | 7.88 | 0.0002 | 24.31 | <0.0001 |
| Error (Protection) | 3 | - | - | - | - | 3 | - | - | - | - |
| Depth × Protection | 2 | 3.87 | 0.0255 | 0.49 | 0.614 | 2 | 0.21 | 0.81 | 0.52 | 0.5997 |
| Depth × Period | 5 | 4.12 | 0.0025 | 2.29 | 0.0555 | 3 | 1.5 | 0.2276 | 3.48 | 0.0234 |
| Depth × Position | 1 | 9.89 | 0.0025 | 1.61 | 0.209 | 1 | 0.1 | 0.7593 | 6.94 | 0.0115 |
| Protection × Period | 10 | 10.96 | <0.0001 | 1.26 | 0.2735 | 6 | 0.4 | 0.8757 | 16.95 | <0.0001 |
| Protection × Position | 2 | 0.87 | 0.4236 | 1.96 | 0.1486 | 2 | 1.49 | 0.2369 | 0.98 | 0.3826 |
| Position × Period | 5 | 1.13 | 0.3518 | 3.12 | 0.0138 | 3 | 0.32 | 0.8104 | 2.02 | 0.1248 |
| Protection × Position × Period | 10 | 1.23 | 0.2854 | 0.92 | 0.5176 | 6 | 1.29 | 0.2823 | 1.86 | 0.1091 |
| Protection × Depth × Position | 2 | 0.56 | 0.5762 | 0.09 | 0.9117 | 2 | 1.05 | 0.3577 | 0.28 | 0.7541 |
| Depth × Position × Period | 5 | 1.74 | 0.1371 | 1.34 | 0.2576 | 3 | 0.04 | 0.9881 | 2.79 | 0.0511 |
| Protection × Depth × Period | 10 | 4.03 | 0.0002 | 0.78 | 0.6463 | 6 | 1.79 | 0.1234 | 3.07 | 0.0132 |
| Protection × Depth × Position × Period | 10 | 0.88 | 0.55 | 0.76 | 0.6647 | 6 | 0.88 | 0.5177 | 1.48 | 0.2064 |
| Error | 68 b | - | - | - | - | 45 | - | - | - | - |
| Total Error | 142 c | - | - | - | - | 95 | - | - | - | - |
a Degree of freedom; b df = 65 for ash; c df = 139 for ash.
Table 2.
Changes in moisture content from previous sampling period and cumulative rainfall over one, five, and 10 days prior to the dates when the samples were collected from poplar and willow chip piles (NC—no cover on pile; C—covered pile; CD—covered pile with dome ventilation). A positive sign indicates an increase in moisture content, and a negative sign shows a decrease in moisture content).
| Storage Time (Days) | Moisture Content Differences (% Point) | Cumulative Rainfall in Days Prior to Sampling (mm) | |||||||
|---|---|---|---|---|---|---|---|---|---|
| NC | C | CD | |||||||
| Shell | Core | Shell | Core | Shell | Core | 1 Day | 5 Days | 10 Days | |
| 30 | −9.5 | −12.1 | −4.4 | −16.0 | −4.6 | −15.8 | 0 | 3.8 | 10.2 |
| 59 | +6.5 | −8.1 | +0.9 | −1.9 | −1.8 | −5.7 | 0 | 22.4 | 26.8 |
| 87 | +2.2 | +11.1 | −6.7 | −1.5 | −2.0 | +2.4 | 0 | 12.6 | 27.4 |
| 117 | +18.8 | −3.5 | −10.2 | +1.5 | −12.6 | −0.3 | 0 | 3.2 | 23.6 |
| 147 | +4.7 | +15.0 | +0.4 | −1.3 | −0.6 | −1.8 | 18.6 | 113.4 | 127.6 |
Table 3.
Biomass price and gross revenue for a storage pile with fuel purchase on a wet weight basis or an energy basis.
Table 3.
Biomass price and gross revenue for a storage pile with fuel purchase on a wet weight basis or an energy basis.
| Protection | Storage Duration (Days) | Moisture (%) | LHV (MJ/Mg) | Paid $25/Mg as Received | Paid $2.81/MJ | ||||||
|---|---|---|---|---|---|---|---|---|---|---|---|
| Biomass | Gross Revenue ($) for a 35-Mg Rile | Biomass | Gross Revenue ($) for a 35-Mg Rile | ||||||||
| Price | Price | ||||||||||
| ($/MJ) | ($/Mg) | ||||||||||
| 0% | 5% DML | 15% DML | 0% DML | 5% DML | 15% DML | ||||||
| DML a | |||||||||||
| NC | 0 | 46.2 | 8.7 | 2.87 | 875 | 875 | 875 | 24.52 | 858 | 858 | 858 |
| NC | 30 | 35.4 | 11.1 | 2.26 | 729 | 721 | 707 | 31.08 | 906 | 897 | 879 |
| NC | 59 | 34.6 | - | - | 720 | 705 | 677 | - | - | - | - |
| NC | 87 | 41.3 | 10 | 2.5 | 801 | 777 | 729 | 28.07 | 900 | 873 | 819 |
| NC | 117 | 48.9 | - | - | 921 | 884 | 810 | - | - | - | - |
| NC | 147 | 58.8 | 6.3 | 3.95 | 1141 | 1084 | 970 | 17.77 | 811 | 770 | 689 |
| C | 0 | 44.9 | 9 | 2.77 | 875 | 875 | 875 | 25.33 | 887 | 887 | 887 |
| C | 30 | 34.7 | 11.3 | 2.22 | 739 | 731 | 716 | 31.69 | 936 | 927 | 908 |
| C | 59 | 34.2 | - | - | 733 | 718 | 689 | - | - | - | - |
| C | 87 | 30.1 | 12.4 | 2.02 | 690 | 669 | 628 | 34.83 | 961 | 932 | 875 |
| C | 117 | 25.8 | - | - | 650 | 624 | 572 | - | - | - | - |
| C | 147 | 25.3686 | 13.4 | 1.87 | 646 | 613 | 549 | 37.64 | 972 | 924 | 826 |
a DML: dry matter loss. The gross revenue is estimated under three assumed scenarios: no account for dry matter loss (DML = 0), 1% monthly loss (DML = 5%), and 3% monthly dry matter loss (DML = 15).
© 2019 by the authors. Licensee MDPI, Basel, Switzerland. This article is an open access article distributed under the terms and conditions of the Creative Commons Attribution (CC BY) license (http://creativecommons.org/licenses/by/4.0/).
Share and Cite
MDPI and ACS Style
Therasme, O.; Eisenbies, M.H.; Volk, T.A. Overhead Protection Increases Fuel Quality and Natural Drying of Leaf-On Woody Biomass Storage Piles. Forests 2019, 10, 390. https://doi.org/10.3390/f10050390
AMA Style
Therasme O, Eisenbies MH, Volk TA. Overhead Protection Increases Fuel Quality and Natural Drying of Leaf-On Woody Biomass Storage Piles. Forests. 2019; 10(5):390. https://doi.org/10.3390/f10050390
Chicago/Turabian StyleTherasme, Obste, Mark H. Eisenbies, and Timothy A. Volk. 2019. "Overhead Protection Increases Fuel Quality and Natural Drying of Leaf-On Woody Biomass Storage Piles" Forests 10, no. 5: 390. https://doi.org/10.3390/f10050390
Note that from the first issue of 2016, this journal uses article numbers instead of page numbers. See further details here.