Devising Urban Biodiversity Habitat Provision Goals: Ecosystem Services Analysis


School of Architecture, Victoria University of Wellington, Wellington 6011, New Zealand
Forests 2019, 10(5), 391; https://doi.org/10.3390/f10050391
Submission received: 28 February 2019
/
Revised: 4 April 2019
/
Accepted: 25 April 2019
/
Published: 1 May 2019
(This article belongs to the Special Issue Increasing Cities, Decreasing Green Areas – Challenge to Urban Green Professionals)
Abstract
:This paper employs a unique ecosystem services analysis methodology to evaluate how cities could support or generate ecosystem services. Ecosystem services analysis can provide quantifiable goals for urban ecological regeneration that are determined by the site-specific ecology and climate of an urban area. In this research, the ecosystem service of habitat provision is the key focus. The role of urban green space and urban forests is crucial within this. Setting ambitious targets for urban ecological performance and ecosystem services provision is of great importance due to the large negative environmental impact that cities currently have on ecosystems and, therefore, ecosystem service provision, and because healthier ecosystems enable humans to better adapt to climate change through creating potentials for increased resilience. A comparative case study analysing the ecosystem service of habitat provision in two existing urban environments with similar climates (Cfb according to the Köppen Climate Classification System) but in different parts of the world, namely Wellington, New Zealand and Curitiba, Brazil, was conducted to examine how the ecosystem services analysis concept can used to devise urban habitat provision goals. The paper concludes that, although achieving habitat provision goals derived from ecosystem services analysis in urban areas is likely to be difficult, determining quantitative site- and climate-specific staged goals could enable urban design professionals to increase the effectiveness of conservation and regeneration efforts in terms of ecosystem service provision from urban green and blue spaces.
1. Introduction
The convergence of the drivers and impacts of climatic change and biodiversity loss will profoundly affect civilisation and, therefore, cities in coming decades [1,2]. At the same time, the growing human population now mostly lives in cities, and urbanisation rates are increasing, particularly in developing nations [3]. Despite occupying only approximately 3% of global land area, cities are sites of tremendous concentrations of energy use, water use, materials, greenhouse gas emissions, and other pollutants [4]. Cities and the people within them are also high consumers of ecosystem services [5,6]. Strategies focused on the built environment to effect change will not solve all of humanity’s ecological and climatic challenges, but could make an important contribution [7]. One way to reduce or to reverse the negative ecological impact of the built environment may be to re-design cities so that they provide, integrate with, or support ecosystem services and, therefore, reduce pressure on both local and distant ecosystems [8].
Ecosystems, which are made up of organisms and relationships between organisms and abiotic elements, are arguably the best example of effective organisation of life on the planet. Understanding how ecosystems work and what they do is proposed as an effective model for reorganising and prioritising urban development ecological performance targets. The aspects of ecosystem functioning that enable human survival and wellbeing can be thought of as “ecosystem services” (Table 1). Humans consume ecosystem services or benefit from them either directly or indirectly [9,10].
Many ecosystem services, such as pollination, purification of air, water and soil, and habitat provision, often do not fall within typical economic value systems. This can mean that people do not understand the critical importance of these ecosystem services for human wellbeing and, consequently, their protection or regeneration does not factor into decision-making including urban planning and design. The problem of how to enable cities to evolve so they become complex self-regulating systems that create and regenerate ecological and societal health must, therefore, be addressed because healthier ecosystems enable humans to better adapt to climate change through creating potentials for increased resilience [11].
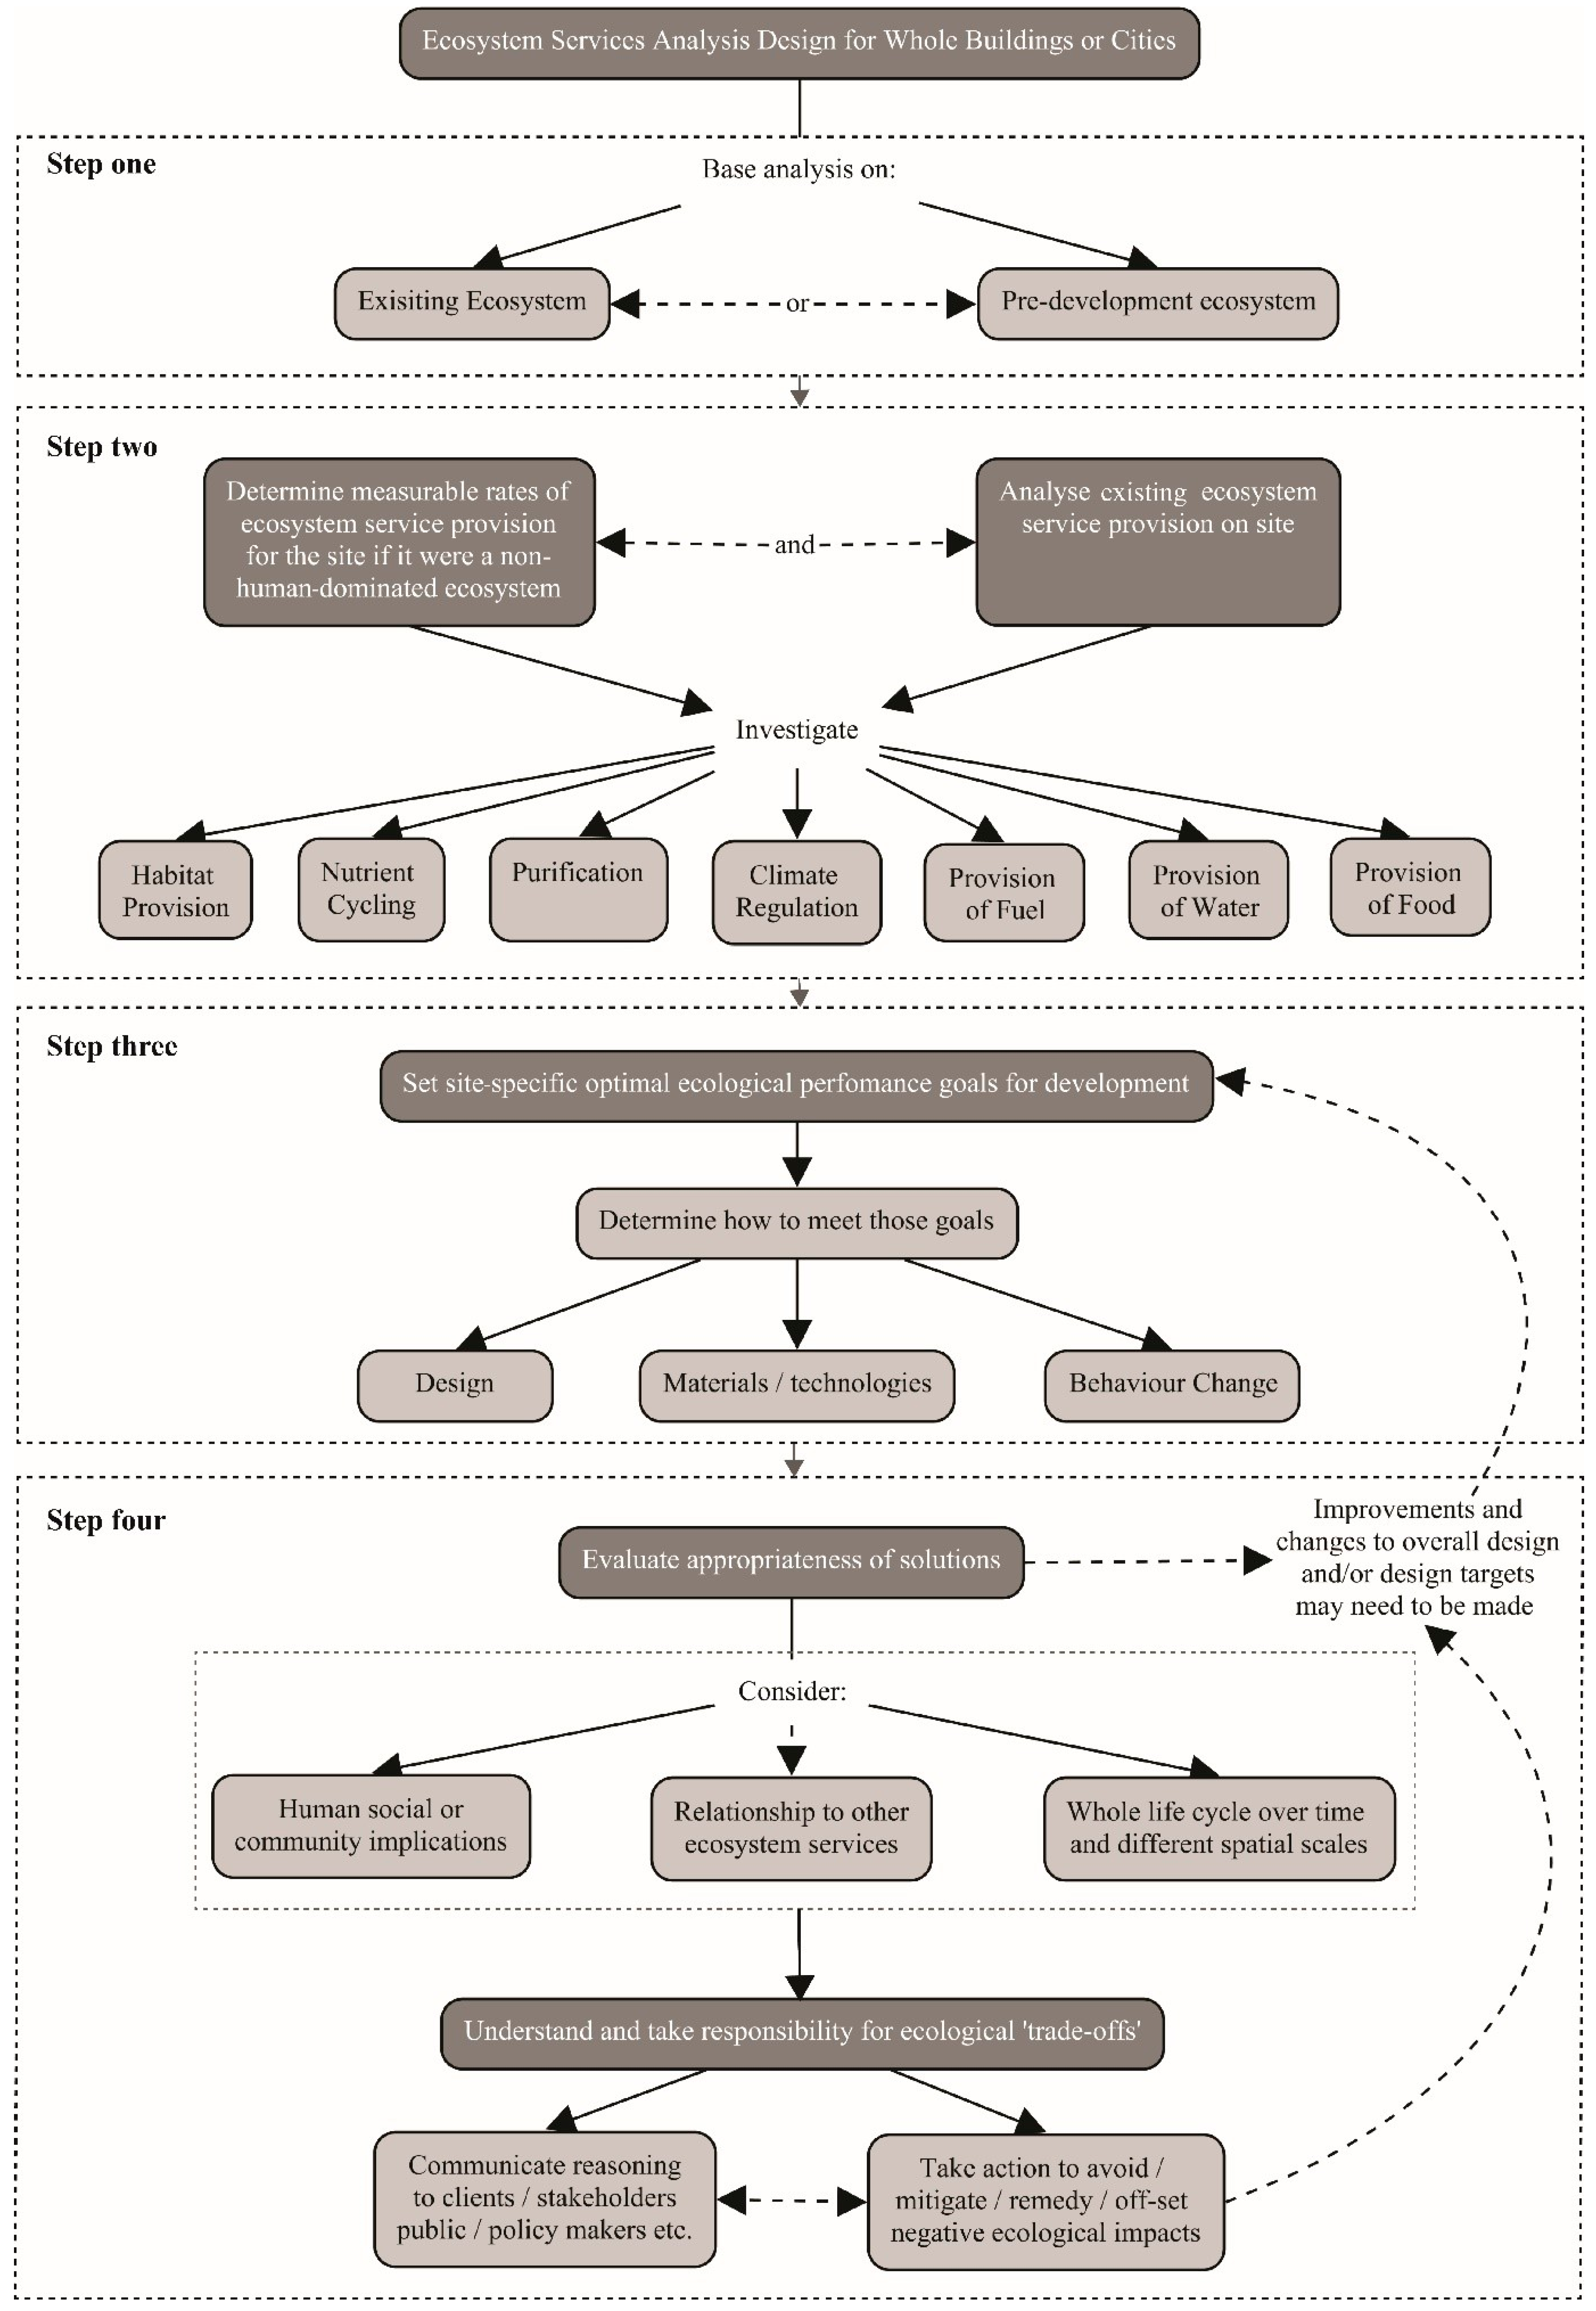
In light of this, the aim of this research is twofold: (1) to test whether the proposed ecosystem services analysis (ESA) methodology (Figure 1) can be applied to real-world urban situations and to determine how it can be used to set urban design goals to increase ecosystem services in urban areas in terms of both quantity and quality, and (2) to understand to what extent the regeneration or creation of the ecosystem service of habitat provision is feasible within existing cities.
1.1. Research Sites
By comparing two cities with physical and climatic similarities, but also key historical and cultural differences, the appropriateness of the ESA methodology in different contexts can be examined, and implications for urban design and planning deduced. Wellington, New Zealand and Curitiba, Brazil were selected as the research sites. These cities were chosen because, although they are in similar climates and are comparable in terms of actual area, they represent different ecological contexts, ages of settlement, states of development, rates of urbanisation, population densities and levels, and cultural conditions (Table 2). What they have in common is that they are both cities of colonised lands that were covered predominantly in various forms of indigenous forests before fairly rapid periods of development and deforestation in the 1800s [11,12]. They are both within classified global biodiversity hotspots, and both have reputations, whether correct or not, as being “sustainable” cities.
Wellington is New Zealand’s capital city. It is a coastal city nestled into steep hills surrounding one side of a large harbour at the southernmost end of the North Island. The urban area hugs the harbour leaving the area to the west of the city (also deemed part of “Wellington City”) mostly unpopulated. The “urban area of Wellington” refers to the inhabited eastern part of Wellington City. Wellington City produces high ratios of its electricity renewably through wind [11], and it is a recognised “biophilic city”, meaning special attention is given to understanding and fostering the relationship of people and nature in the city [13].
Curitiba is the capital city of Paraná State in Brazil’s south. It is Brazil’s seventh biggest city in terms of population. The city of Curitiba is within the Curitiba metropolitan area and is a fairly flat land-locked city located on the First Paranaese Plateau, between the Serra do Mar mountain ranges and Devoniana Cliff [14]. It is a humid city (average of 80.7% relative humidity) and is often wet and cloudy. The city has areas prone to flooding, which are often managed through urban green and blue space strategies. Curitiba is referred to internationally for its innovative sustainable urban planning practices [15,16], particularly in terms of public transport and culturally appropriate ecological remediation of brownfield sites to cope with urban flooding [17].
1.2. The Ecosystem Service of Habitat Provision
In this research, one ecosystem service relevant to urban environments was studied: the provision of habitat for wildlife species. The provision of habitat supports urban biodiversity, which is an important foundation for many other ecosystem services provisions in urban contexts [18]. By conserving, regenerating, or providing wildlife habitat in cities, the nexus of a bundle of other ecosystem services that cannot be physically provided by buildings or built infrastructure itself is formed [19]. These services include pollination, biological control, species maintenance, provision of genetic material, prevention of disturbance, and fixation of solar energy.
Typical strategies for designing for increased habitat provision in cities include planning for and regenerating habitat for non-humans, reducing fragmentation and edge effect of habitat, and building adaptation to climate change into habitat provisions [20]. Climate change/biodiversity implications of increased urban habitat provision include increased ecosystem resilience, sequestration of carbon, increased air, water and soil quality and purity, more fertile soil meaning greater potential for the growth of biomass and therefore increased human health and resilience, remediation of some forms of water, air and soil pollution through increased urban vegetation, increased protection from wind or wave surges, reduced erosion, reduction of stormwater peak flows, and cooler urban temperatures [21,22,23,24,25,26,27,28,29].
2. Methodology: Ecosystem Services Analysis (ESA)
2.1. Ecosystem Services Analysis (ESA) Process in Brief
This paper presents findings of research employing the ESA methodology, which was previously developed by the author. Pedersen Zari [11] provides an in-depth explanation of the process and methodology for devising the ESA logic and structure, along with calculation tables and indicators examined. This research seeks to test that novel methodology further by using real city examples. ESA can be used to evaluate how cities could support or generate ecosystem services. Specifically, ESA can provide quantifiable goals for urban ecological regeneration that are determined by comparing ecological pre-development base states for a particular site to current ecosystem services provision. Future scenarios are then devised to determine appropriate urban design ecological performance targets that are based on what was produced by the pre-development ecosystem on the same site. Figure 1 illustrates the basic ESA methodology (in this research, only the ecosystem service of habitat provision was examined in Step 2).
The first step of the research was to devise design performance targets based on understanding the ecosystems that existed onsite prior to the development of each city. This involved an extensive ecological history exercise to determine the types and extents of ecologies that existed before development. Step 2(a) involved the determination of measurable rates of ecosystem service provision that existed before development. The kinds of calculations and units studied for the provision of each ecosystem service vary; however, in the case of habitat provision, it is possible to determine the spatial extent of ecosystems that existed before development and use this, combined with other metrics such as fragmentation thresholds, to determine minimum future land-cover type, extent, and spatial location targets. Step 2(b) was determining the levels of habitat provision that currently exist in each city. Determining targets for the optimal environmental performance of the built environment in terms of habitat provision that is (or will be) in each city site based on results from Steps 1 and 2 was the third step of the ESA process (Table 3).
2.2. Data Collection
Data collection for Steps 1, 2a, and 2b of the ESA process comprised a literature-based ecological history study, study of maps created at different time periods, direct observations in areas of ecological significance in each city, expert interviews, and a spatial analysis of the current extent of land cover types using geographic information systems (GIS).
The ecological history study of each site included examining information about original and current ecosystems and habitat cover for each city site, land-cover changes over time, and land-use issues in the cities. This provided key information on pre-development and current ecosystem services in each city (with particular regard to habitat provision in this research) and was used to facilitate setting urban design goals for the provision of habitat based on existing site-specific potentials. Detailed information on the literature reviewed and key findings and discussion of the ecological history process undertaken can be found in Pedersen Zari [11].
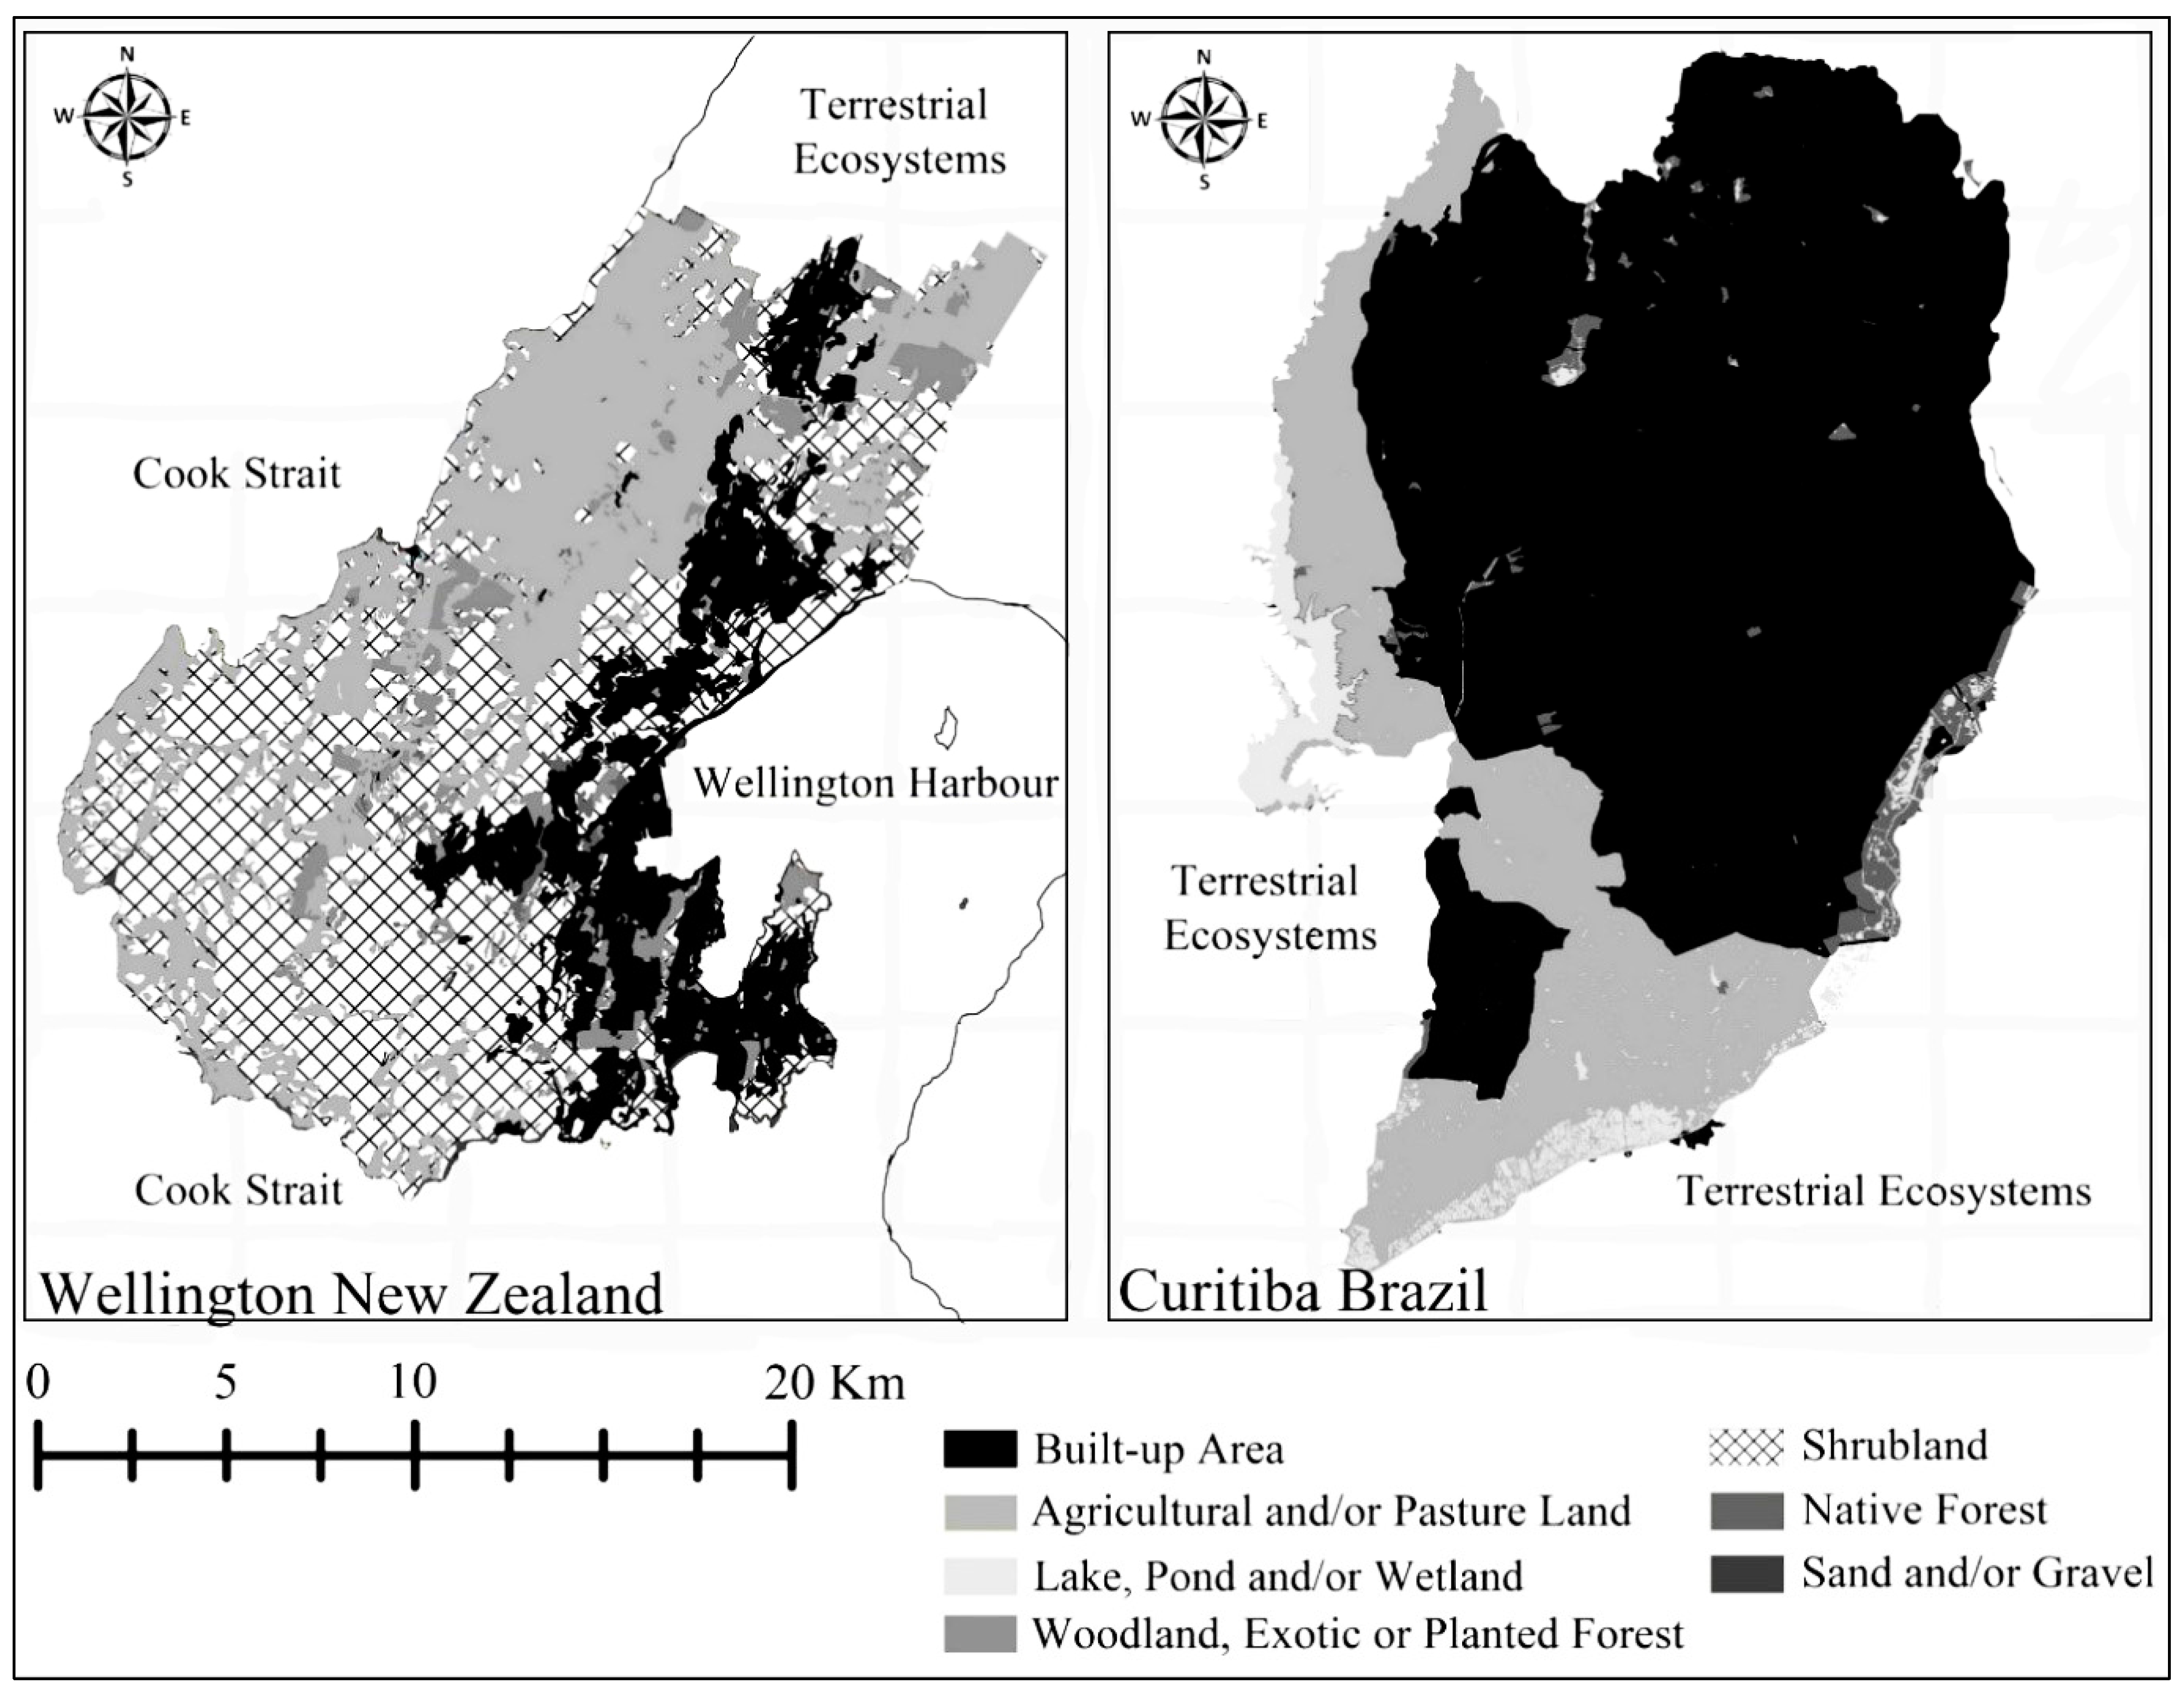
A spatial analysis of urban landscapes in Curitiba and Wellington was carried out using geographic information systems (GIS) in the Arc Map v.1.4.1 environment. Existing datasets were utilised for mapping both Curitiba [30] and Wellington [31]. Land-cover types were re-classified to provide a comparable land-cover classification system for both cities. Five land-cover types were defined to represent the land-cover type extent of the two cities (Table 4).
Field observation and interviews in Curitiba were conducted between December 2016 and February 2017 to ascertain if data gathered from literature and GIS analysis were accurate, and to address specific gaps in knowledge not available from literature or remote GIS analysis. Discussions were with local experts (identified through existing literature, and through local government or non-governmental organisation role descriptions). Direct observations in sites of ecological or biodiversity significance across the urban landscapes were conducted. These included urban parklands, riparian zones, and regenerating urban woodlands and/or forests. Direct observations and interviews were carried out in Wellington between 2012 and 2017.
3. Results
This results section is structured so that it relates to the steps of the ESA process outlined in Figure 1. In the context of this research, the analysis is based on pre-development ecosystems.
3.1. Key Findings from the Ecological History Analysis (Step 1 of the ESA Process)
3.1.1. Wellington
Wellington was the first large-scale area settled by British colonisers in New Zealand, beginning in 1839, although various groups of Māori (the indigenous people of New Zealand) settled in the area much earlier than this. Before 1839, when European immigrants started to clear forest and drain wetlands to create pasture for grazing animals, Wellington was covered with forest ecosystems ranging from coastal communities to systems on steep inland terrain. Low-land broadleaf podocarp forest covered approximately 20,000 hectares (at least 70%) of Wellington [32]. The area was densely forested except for small areas that Māori had cleared [33]. Pre-1839 Wellington forest was predominantly a mixture of rimu, tawa, and mataī broadleaf trees with some areas of beech and other podocarp species [34]. The forest where Wellington now stands was described as follows: “trees such as the northern rata, with its bright red flowers, would have been a common sight, along with rimu, mataī, kahikatea, and tōtara. These would have been emerging through a solid canopy of tawa, kohekohe, kāmahi, tītoki, pukatea, and kōwhai. The forest interior would have been thick with climbers like kiekie and supplejack, and the forest carpeted with ferns” [32].
In 1841, Wellington’s town plan was the first in New Zealand to set aside land for a green belt (the forested Te Ahumairangi Hill). The green belt was thought of as the lungs of the city, and was to be used for public recreation for Wellington residents. Although some mountainous areas to the north and east were saved from deforestation after the government purchased them in 1870, the loss of forest, combined with the introduction of mammalian predators that were foreign to New Zealand’s mostly avian fauna, had a devastating effect on animal life [23]. Most species once found in the region are now locally extinct or extremely rare [35]. By 1875, Wellington was described as “chiefly pastural” [36]. Due to the absence of native birds to carry and disperse the seeds of native trees, it is difficult for forest remnants to regenerate [37].
Active reforestation in the city began as early the 1930s, although exotic rather than native tree species were commonly planted. By the 1950s, many farmers had started to let the poorer farmland pastures surrounding the city regenerate naturally into native bush. This process is on-going. Large areas of what was once native forest in the mostly uninhabited western part of Wellington are now “scrub”, which is a mixture of native and non-native (mostly invasive) species on land regenerating from once pastoral or cleared land. Currently, only 0.6% to 2% of Wellington’s original forest remains [38], most of which is contained in remote areas or within several important urban biodiversity sanctuary areas. Although an extensive outer green belt now surrounds the city, including a mixture of public and private lands, a high level of fragmentation exists in the remaining forested areas [36]. Detailed pre-development and current habitat cover maps are provided by Pedersen Zari [39] and Rastandeh et al. [40].
Wellington has several current initiatives to conserve native flora and fauna within the city, including Zealandia, a fenced ecosanctuary project to return 225 hectares to a pre-human state, and Otari Native Botanic Gardens and Wilton’s Bush Reserve, a plant sanctuary and forest reserve including 100 hectares of native forest and five hectares of plant collections. Wellington City Council has a goal of planting two million native trees in and around the city by 2020.
3.1.2. Curitiba
The indigenous people of the Curitiba area are the Tingüi. For more than 300 years, anthropogenic development in Curitiba led to widespread ecosystem degradation [41]. Curitiba, meaning “abundant with pine trees” was established in 1693 when gold prospectors from the coast travelled to the Serra do Mar and arrived eventually at the plains, almost 200 years after the Portuguese first colonised Brazil. An early observation of the land where Curitiba now stands reinforces the forested nature of the landscape: “toward eventide, we sighted land! Firstly, a large mountain, very tall and round; then other, lower hills, lying southward of the mountain, and beyond that, flat land. And mighty woods… As to the jungle, it seemed very large… Look as we would, we could see nothing but land and woods…” (Pero Vaz de Caminha in a letter to the King of Potugal 1500).
Rainforests, wetlands, lakes, and rivers were the main land-cover types in the region pre-development. Curitiba was likely ombrophilous mixed forest (evergreen Araucaria moist forest) which is a kind of Atlantic forest. The Brazilian Atlantic Forest is one of the world’s most important biodiversity hotspots, and because less than 7% of it remains, it is also one of the most threatened of the world’s rainforest types [42]. The economic exploitation and changes in land use and cover of the southeastern Brazilian Atlantic Forest began with logging, followed by coffee and sugarcane plantations and then cattle ranching [43]. During the mid-1800s, a wave of European immigrants arrived and settled in Curitiba and it became a “city” in 1842 [16]. Settlers drained many rivers and lakes and replaced wetlands and forests with settlements, agricultural areas, and pastural lands. In 1885, economic growth resulting from the Curitiba railroad resulted in increased deforestation rates and more biodiversity loss.
Currently, in Curitiba, there is very little original forest left, but some important habitat areas were conserved and/or regenerated. Since the 1970s, more than 1.5 million trees were planted in the city, and the ratio of open space per inhabitant increased from 0.5 m2 to 64.5 m2 [44]. Many of Curitiba’s larger green spaces are integrated with flood control measures and include critical designed lake and storm water systems.
3.2. Pre-Development Primary Habitat (Step 2a of the ESA Process)
Approximately 38,629 hectares of Curitiba (100% of the current city’s area) was primary Atlantic Forest habitat before development. In Wellington, approximately 20,000 hectares (70% of the current city’s area) was primary temperate rainforest habitat of various types.
3.3. Current Primary Habitat for Urban Wildlife: GIS Examination Results (Step 2b of the ESA Process)
Curitiba lost almost all areas of native forests, while as little as 0.6% of the total area of Wellington is still covered by native forests. The percentage of areas covered by inland water bodies was calculated for Curitiba as 5%, while only 1% of Wellington is covered by inland water bodies (Figure 2, Table 5).
3.4. Setting Urban Design Goals for Habitat Provision (Step 3 of the ESA Process)
3.4.1. Wellington Habitat Provision Targets
When habitat reserves are less than 10% of an area, a decline in biodiversity and an increase in fragmentation are likely to occur in a New Zealand context [23]. This implies that 10% indigenous land cover may be an appropriate initial target to begin the process of restoration of the ecosystem service of habitat provision. Other research suggests that 20% forest cover may be a more effective urban habitat provision target in an Oceanic context [38]; therefore, for the purposes of this research, the smaller percentage is used as a preliminary target, and 20% as the second.
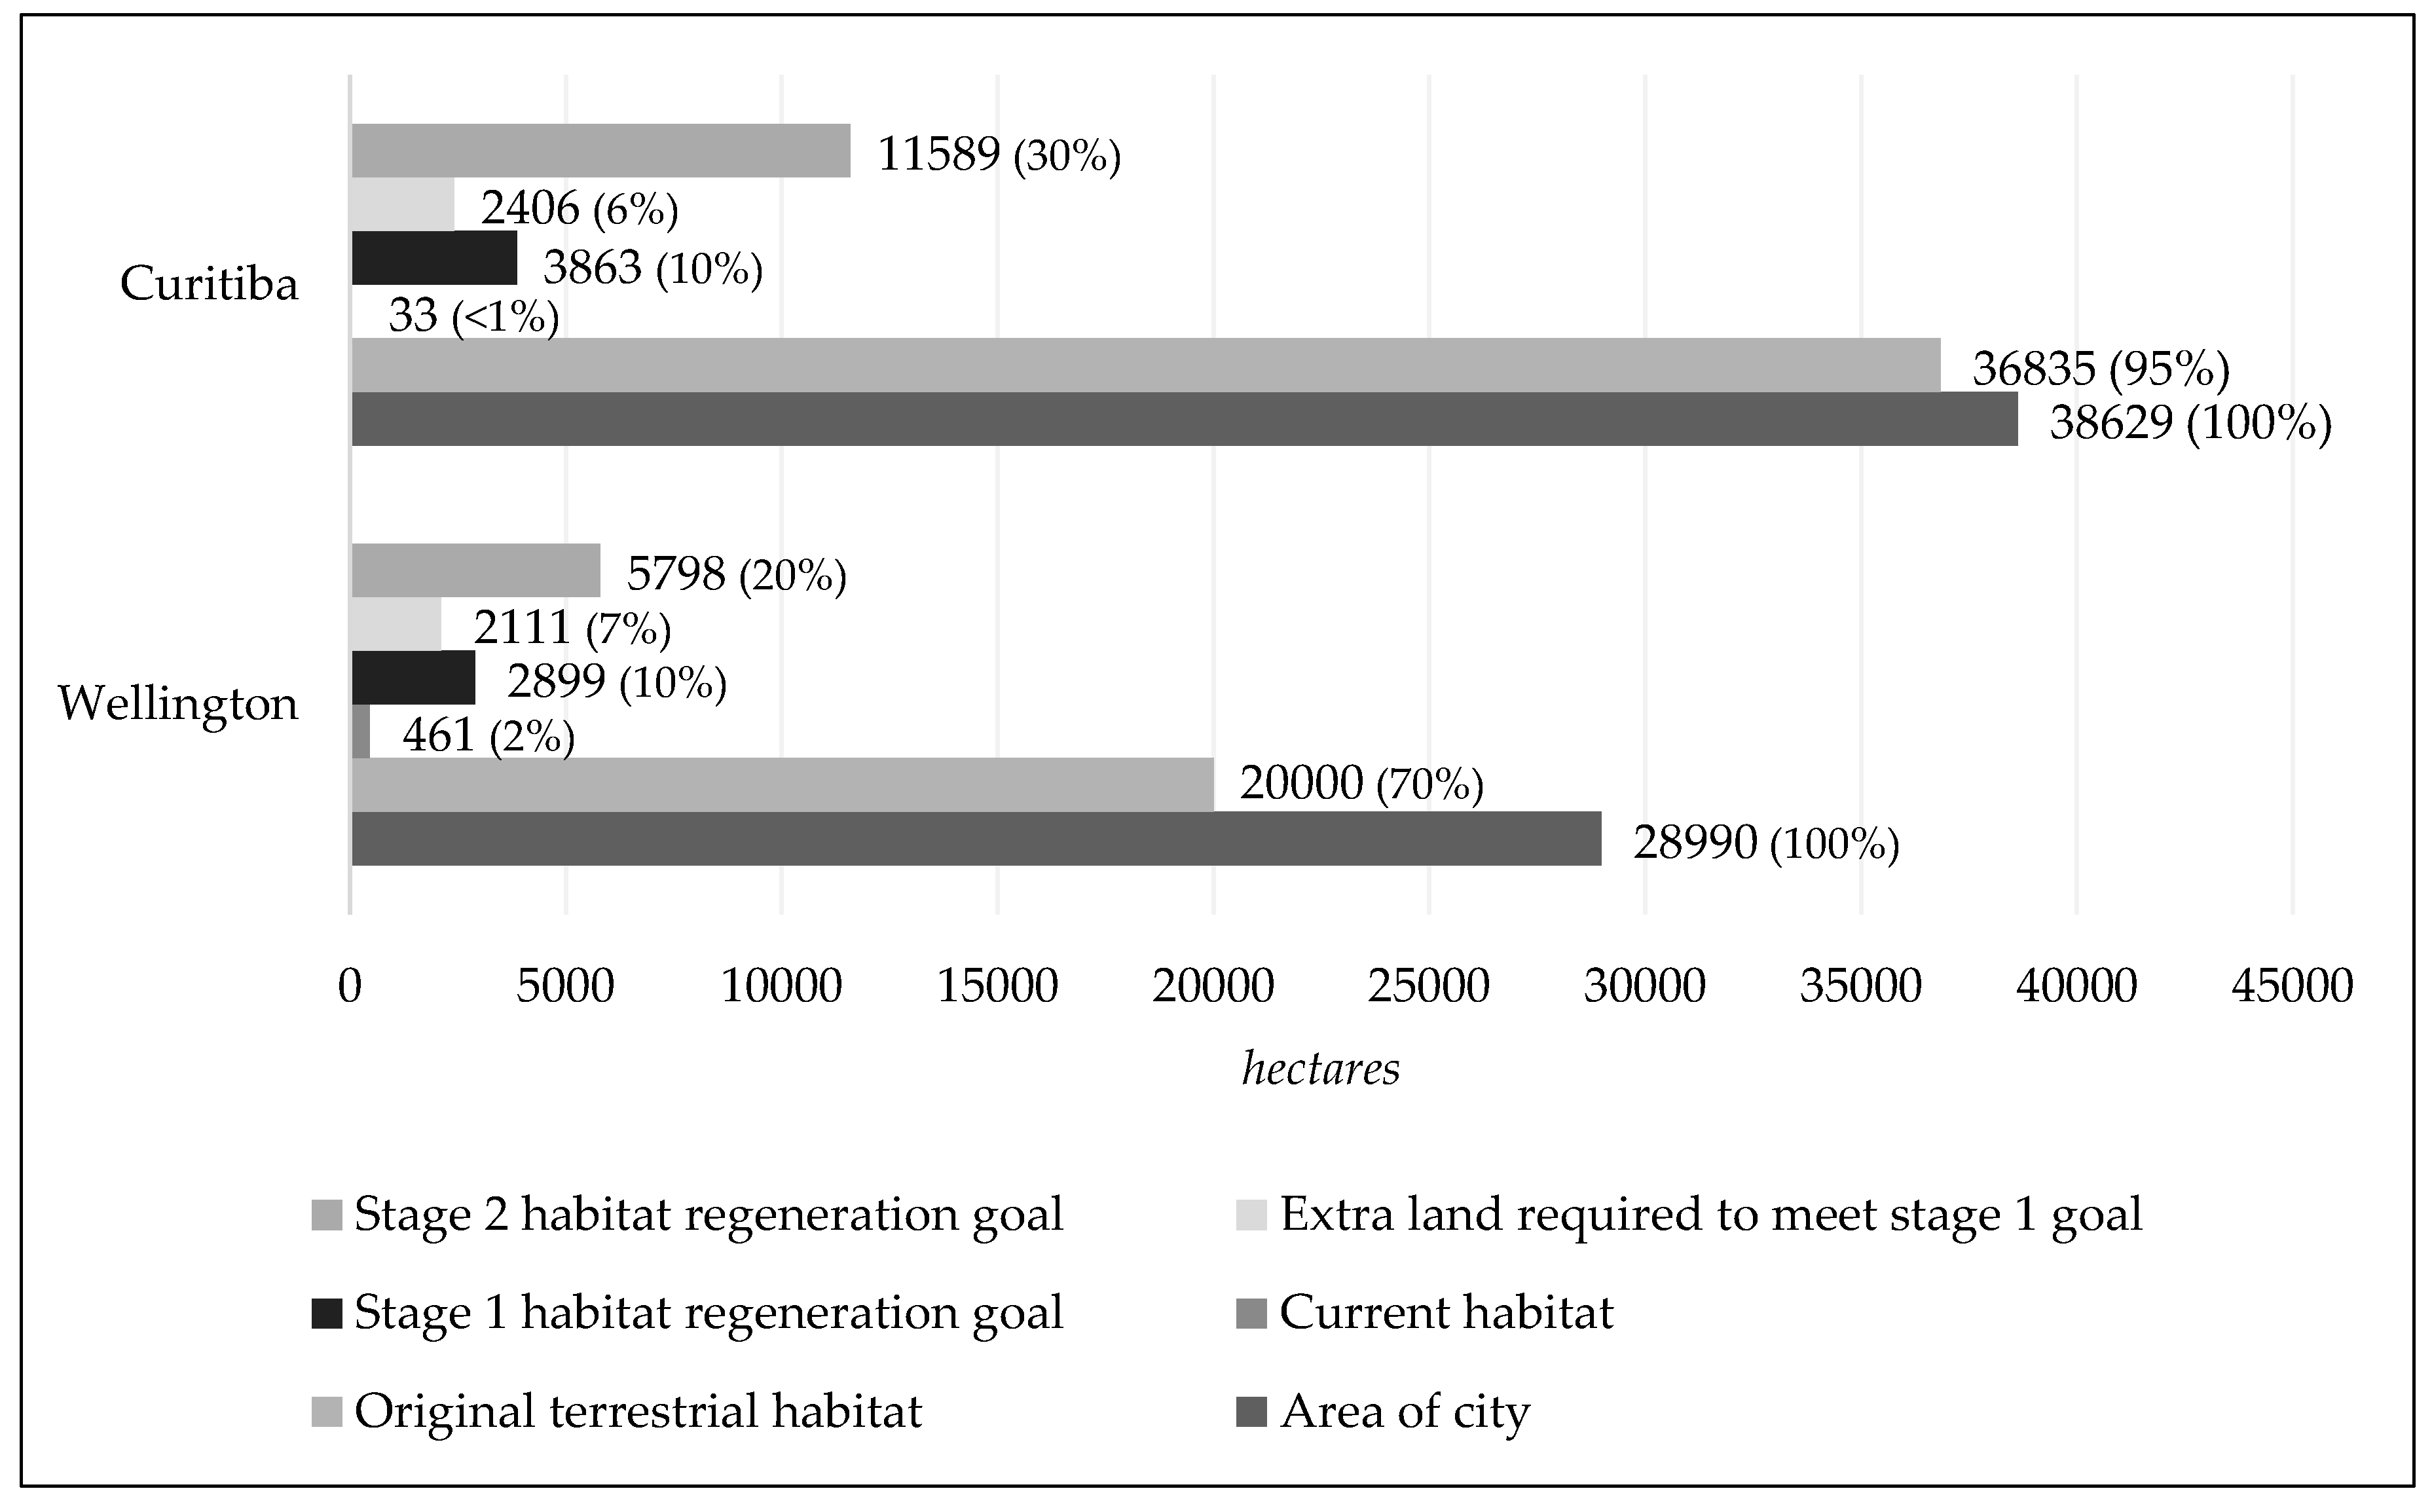
With an absolute maximum of 2% indigenous cover existing in Wellington, the city should aim for a minimum 8% increase (2319 hectares) in indigenous habitat just to reach a relatively stable state of habitat needed to maintain biodiversity levels. If all city council-owned park, grass areas, and roadside planting areas were used for this task, an additional 0.7% of habitat cover could be gained (208 hectares), assuming there was no compromise on habitat provision from concurrent recreation or food-growing activities. This suggests a minimum additional 7% (2111 hectares) of habitat would need to come from newly acquired council land or privately owned green space, roof tops, or other developments within the city. Given the large amount of privately owned land, it is reasonable to expect part of this target could be reached if incentivised [45]. However, the extra 2111 hectares might more realistically come from intensive managed regeneration of bush and scrub outside of the urban area in the western part of Wellington. Each additional hectare beyond the requisite 2319 hectares would contribute to the ecosystem service of habitat provision by beginning a process of restoration. The stage 2 target of 20% habitat coverage equates to 5798 hectares. This provides tangible targets for integrating the ecosystem service of habitat provision into Wellington. It would take between 100 and 500 years for complete regeneration of areas of forest in a Wellington context [46].
3.4.2. Curitiba Habitat Provision Targets
The theoretical fragmentation threshold for forest such as Atlantic Forest is 30% [47]. However, 30% forest cover is problematic in the urban context of Curitiba. If all existing regenerating forest, non-native forest, woodland, urban parkland, agricultural, and pastoral land, and all lakes, wetlands, and rivers were devoted towards the regeneration of wildlife habitat in Curitiba, then an almost exact 30% coverage could theoretically be achieved. Practically though, it may be more beneficial to focus efforts on some of the larger areas of forest remaining outside of Curitiba in terms of continuous non-fragmented habitat provision. Fragmentation is particularly problematic in Atlantic Forest, meaning effort should be made to provide habitat in as large continuous areas as possible (upwards of 10,000 hectares) [48].
Networks of protected areas connected by forest corridors and stepping stone habitats are often accepted as the basic foundations of effective biodiversity conservation (or habitat provision) strategies in highly fragmented forest biotas, including urban settings. For these reasons, a goal of 10% forest coverage (3863 hectares) is used as an initial habitat regeneration goal for Curitiba, and 30% as a stage 2 goal (11,589 hectares). There are 1457 hectares of existing urban park land and woodlands and regenerating forest, presumably with some habitat value, or that could be developed with habitat provision as a focus. This leaves a 6% deficit, or 2406 additional hectares of land that should be dedicated to forest regeneration in Curitiba. This means approximately 28% of Curitiba’s non-built-up land (predominantly agricultural and pastoral) would need to be dedicated to forest regeneration to achieve this target. This is likely to conflict with food growing or new development, particularly as Curitiba is an expanding city.
Although regenerating Atlantic Forest needs about 100–300 hundred years to reach the proportions and types of plants and animals found in mature forests, only approximately 65 years is needed to achieve 80% of the animal-dispersed species found in mature forests. Tabarelli et al. [48] stated that forest patches and connecting corridors that have over 80 tree species within them, for example, can be rapidly implemented, even in highly degraded habitats such as abandoned pastures in the Atlantic Forest context. However, between one and four thousand years is required to reach the endemism levels (40% of the species) that exist in mature forests [42]. This means the beginning of any habitat regeneration will take at least 65 years to achieve; however, ultimately, this is a very long-term project from the point of view of humans.
3.4.3. Habitat Provision Summary: Wellington and Curitiba
Results indicate that, for the ecosystem services of provision of habitat, it is likely to be difficult to meet ESA-devised urban regeneration goals without a radically different way of creating and living in the built environment in the context of the two cities studied, and probably in most modern cities. However, targets for beginning this process based on pre-development levels of ecosystem service provision and analysis of the current situation can be deduced (Table 6).
Figure 3 shows that, even with modest 10% habitat coverage goals, achieving these targets will require great effort in both cities, although reaching the goal is clearly more likely in Wellington. Although Wellington is described as a “city in a forest” [13], because of the presence of humans, buildings, and infrastructure, most parts of the city could never be the equivalent of the healthy, functioning pre-development temperate rainforest ecosystem that once existed on the same site. The same is true of Curitiba. Pursuing such goals, however, helps certain species continue to exist in the city. Crucially, it also adds to the provision of most of the other ecosystem services. The benefits in terms of increased biodiversity and increased provision of ecosystem services are large [27,29]. It would be necessary for any increase in habitat and, therefore, biodiversity to fit within regional and national programmes of biodiversity restoration. This illustrates that ecosystem services-based urban design, planning, and development, even at the city scale, cannot exist in isolation from its larger surrounding physical and cultural contexts. By linking habitat provision and urban biodiversity with other ecosystem services, people may see the value of such an exercise more readily than if it is assumed provision of habitat is simply an altruistic or aesthetic exercise.
4. Discussion: Implications for Urban Design Professionals of Using an Ecosystem Services Analysis Methodology
4.1. Site Specificity
The ESA method and the data used to make the calculations are very site-specific. This means that the habitat coverage threshold percentages appropriate for Wellington differ from those for Curitiba, and would differ for other locations also. While the methodology is transferable to other urban locations, climates, and ecosystem types, it is important to note that the ecological history process and the data used to calculate habitat threshold percentages must be derived from local ecological literature or experts.
4.2. Scale
ESA can provide city-wide ecosystem services targets, but these can also be scaled down to work for smaller developments. A development within a city could measure the additional habitat (or other ecosystem services) they would provide based on the city-wide target, and could claim to be providing a certain percentage of the extra habitat cover needed for the whole city. For example, for a new development, a minimum habitat provision of 10% of the footprint being dedicated to habitat provision would be useful. At least 30% in Curitiba or 20% in Wellington would be ideal. Where existing stands of forest or land to be dedicated to regeneration exist, the size can be understood as part of the habitat provision goals for a city. To demonstrate, if the total goal for habitat provision within Wellington City is 2319 hectares, a hillside, an urban stream that is in need of regeneration, or an area of land that is to be set aside as reserve, even an urban street scape, can be understood as a specific calculated fraction of the total needed. A site which is four hectares (a reasonable size for a small block of domestic houses in New Zealand) can be understood, therefore, as approximately 0.2% of the total habitat required to begin a process of habitat regeneration in Wellington. Understanding spatial habitat provision goals in this way lends itself to different kinds of incentives and provisions. For example, people may be able to earn and then trade in habitat credits within a closed site-specific city wide or regional system. Developers may have to generate (rather than purchase) habitat credits on site or elsewhere within the city boundaries (which may be part of larger ecosystem services credit systems). In Curitiba, similar credit swap systems already exist related to how high buildings can be in certain parts of the city [49]; thus, the concept is feasible. This gives designers and city planners a goal to work towards that is based on ecological reality and is tangible even related to very small areas of development or urban green or blue space. It enables piece-by-piece development of cities which is currently the norm, while maintaining a holistic overview of the whole area in terms of urban ecosystem services provision. Such a scaling of the ESA concept also allows private and public participation in the goals. If these goals are then spatialised, mapped, and matched with priority biodiversity areas, this could contribute to effective urban ecosystem services provision.
4.3. Design for Combinations of Ecosystem Services
While urban green and blue space is of great importance to habitat provision and the provision of many of the other ecosystems services simply because it comprises living elements, if it is not designed with these specific functions in mind, it is unlikely to be as effective as it could be in terms of ecosystem services provision. This is particularly true when seeking to create or support combinations of provisioning, regulating, supporting, and cultural ecosystem services on the same site [50]. It is well understood that, in urban areas, the coexistence of people, wildlife, and ecosystems can lead to conflicts [37], particularly in terms of land-use priorities [22]. Often, cultural ecosystem services are prioritised over provisioning, regulating, and supporting ecosystem services in urban green spaces. Many ecosystem services have potential competing “trade-off” relationships with each other, meaning efforts to increase one can result in reductions in another [11,51]. If designers and policy-makers are to effectively use the ecosystem services model in an urban setting, they must understand how ecosystem services are related so that potential synergies between ecosystem services can be utilised, but also so that potential trade-off relationships between all ecosystem services, particularly between cultural ones and the other categories, can be avoided or addressed [52]. This is of particular importance to ensure that ecosystem services based urban design do not disproportionately impact poorer or disenfranchised people in terms of loss of cultural ecosystem services. This highlights the importance of a holistic approach to urban design that understands, protects, and regenerates the breadth of ecosystem services potentially inherent in urban green and blue space. Further experimentation with urban spatial analysis tools and methodologies would be useful to resolve the conflict for space between additional ecosystem services other than just the one examined here (habitat provision). This could reveal how to determine where ecosystem services could or should occur in given locations, where their provision could overlap spatially, and where separations must be made.
4.4. Spatial Targets
Combined with a prioritisation of the kinds of spaces to be dedicated (not necessarily exclusively) to habitat provision regeneration or conservation (Table 7), there is a need to devise specific spatial targets for habitat provision. It is possible within an expanded ESA framework to generate detailed maps that respond to local issues related to the provision of habitat for wildlife. For example, key spatial data (i.e., Figure 2) can be used in combination with additional information (e.g., digital elevation model (DEM), soil type and fertility, temperature, rainfall, wind speed and direction, hydrology, salinity, etc.) to provide detailed and spatialised information about potentials for the provision of habitat in an urban context. Such maps would indicate which areas of the cities are likely to be better dedicated to the different ecosystem services studied, and where areas overlap. They may be useful in illustrating the need to take a holistic approach to ecosystem services provision in cities, and both the scale and potential location of interventions needed just to begin a process of regeneration of ecosystems [53,54]. Such maps would also show where major areas of ecosystem service provision conflict occur in terms of land-cover type and management, and would illustrate which parts of the cities are likely to be strategically most important in terms of ecosystem service provision in the future. While it is true that some fauna cannot easily coexist with humans in urban environments, and require habitat that is not conducive to urban contexts, additional focus on the provision of urban habitat and increased biodiversity does not detract from the importance of the conservation and regeneration of non-urban habitat for both flora and fauna.
4.5. Increased Collaboration
Integrating the provision of habitat more effectively within the urban areas studied would need careful design collaboration between landscape architects, urban planners, architects, engineers, ecologists, biologists, climatologists, and citizens of the cities. The needs of indigenous biodiversity, present and future predicted climatic conditions, and support for other compatible ecosystem services must be considered alongside human demand for resources. Local and national government policy mechanisms such as zoning, development right transfers, environmental impact statements, and even rules for strategic indigenous street planting or green space provision can be explored for contribution to increasing biodiversity in urban areas [55]. Mechanisms such as “no net loss” (NNL) biodiversity policies could provide a further means of legislating or encouraging increased biodiversity conservation or regeneration in urban centres. Such mechanisms are increasing globally, and it is of note that NNL projects were implemented in both Brazil and New Zealand, related predominantly to preservation of native forest [56]. The contribution of private land owners and hybrid grey/green infrastructure is also likely to be important in meeting ecosystem services-based goals in cities including that of habitat provision [50]. For example, the following could be features of cities working to provide more habitat: careful choice of species for plantings; more strategic use of roof tops and vertical space suitable for plant growth; the addition of nesting boxes, water sources, and high ledges to buildings where appropriate; ecologically engineered walls, seawalls, and other infrastructure with integrated habitat provision; and increased green infrastructure and the vegetation of open space, including land around dwellings and other buildings with plant selection tailored to habitat provision [57,58,59].
5. Conclusions
The provision of biodiversity conservation through habitat provisioning in cities is of great significance in an era of rapid urbanisation and climate change. ESA-derived targets based on the rates of ecosystem services provision that existed prior to development mean that goals are based on site- and climate-specific ecological realities and potentials. The first aim of this research was to test if the ESA methodology could be applied to real world existing city contexts. Results show that ESA is a method that can be used to define quantifiable goals in terms of urban ecological performance and the provision of ecosystem services in both Wellington and Curitiba. The next step will be to determine if using ESA is likely to be helpful in beginning the process of determining how to practically achieve such goals, and to communicate to professionals, policy-makers, and residents alike what the ecological limits and capacities of specific cities are. Results indicated that the changes possible to the ecosystem service of habitat provision in the cities studied are not insignificant and, if implemented, could contribute positive benefits for humans, other living organisms, and local and global climatic systems. Beyond this, the study shows how ecological history-based urban ESA can be undertaken using spatial data and a core set of indicators, in order to provide a clear picture of the existing potentials and limitations for the provision of habitat for wildlife in urban areas. The ESA methodology shows that urban spatial design goals, including those that involve urban forests, other habitat types, and even hybrid grey/green infrastructure or buildings, can be determined based on the ecological reality of the site, even in sites of differing histories and cultural contexts if the needs of indigenous biodiversity are understood.
The second aim of this research was to understand to what extent regenerating or creating the ecosystem service of habitat provision is feasible within existing cities. The ESA methodology produced quantitative goals over temporal stages related to the regeneration of habitat provision in both Wellington and Curitiba. The idea of urban environments producing ecosystem services and matching base line rates determined by ecosystems that existed on the same site and in the same climate before they were removed to make way for a city is philosophically appealing; however, the results of this research show that making this a reality in existing urban environments is likely to be difficult in the near future in terms of habitat provision, at least in the two cities studied. This does not mean such goals should not explored further, however, or adopted in order to improve the relationship between urban environments and the ecosystems on which they rely and are part of, which ultimately is crucial for continued human wellbeing.
Funding
This research received no external funding.
Acknowledgments
The research assistance of Amin Rastandeh related to the GIS mapping is gratefully acknowledged.
Conflicts of Interest
The author declares no conflicts of interest.
References
- Röckstrom, J.; Steffen, W.; Noone, K.; Persson, Å.; Chapin, F.S., III; Lambin, E.F.; Lenton, T.M.; Scheffer, M.; Folke, C.; Schellnhuber, H.J.; et al. A safe operating space for humanity. Nature 2009, 461, 472–475. [Google Scholar] [CrossRef]
- Montanarella, L.; Scholes, R.; Brainich, A. The IPBES Assessment Report on Land Degradation and Restoration; Secretariat of the Intergovernmental Science-Policy Platform on Biodiversity and Ecosystem Services: Bonn, Germany, 2018. [Google Scholar]
- Eigenbrod, F.; Bell, V.A.; Davies, H.N.; Heinemeyer, A.; Armsworth, P.R.; Gaston, K.J. The impact of projected increases in urbanization on ecosystem services. Proc. R. Soc. B 2011, 278, 3201–3208. [Google Scholar] [CrossRef]
- CIESIN-Center for International Earth Science Information Network. Global Rural-Urban Mapping Project (GRUMP), Alpha Version: Urban Extents. 2004. Available online: http://sedac.ciesin.columbia.edu/gpw (accessed on 10 January 2018).
- Thomson, G.; Newman, P. Urban fabrics and urban metabolism—from sustainable to regenerative cities. Resour. Conserv. Recycl. 2018, 132, 218–229. [Google Scholar] [CrossRef]
- Girardet, H. Creating Regenerative Cities; Routledge: New York, NY, USA, 2015. [Google Scholar]
- McGranahan, G.; Marcotullio, P.; Bai, X.; Balk, D.; Braga, T.; Douglas, I.; Elmquist, T.; Rees, W.; Satterwaite, D.; Songsore, J. Urban Systems. In Ecosystems and Human Well-being. Volume 1: Current State and Trends; Hassan, R., Scholes, R., Ash, N., Eds.; Island Press & Millennium Ecosystem Assessment: Washington, DC, USA, 2005. [Google Scholar]
- Pedersen Zari, M. Ecosystem services analysis: Mimicking ecosystem services for regenerative urban design. IJSBE 2015, 4, 145–157. [Google Scholar] [CrossRef]
- Millennium Ecosystem Assessment Board. Ecosystems and Human Well-Being: Synthesis; Island Press: Washington, DC, USA, 2005. [Google Scholar]
- Potschin, M.; Haines-Young, R. Defining and measuring ecosystem services. In Routledge Handbook of Ecosystem Services; Potschin, M., Haines-Young, R., Fish, R., Turner, R.K., Eds.; Routledge: London, UK; New York, NY, USA, 2016; pp. 25–44. [Google Scholar]
- Pedersen Zari, M. Regenerative Urban Design and Ecosystem Biomimicry; Routledge: Oxon, UK, 2018. [Google Scholar]
- Fazzano, A.; Weiss, M.A. Global Urban Development; GUD: Curitiba, Brazil, 2004; Available online: http://www.globalurban.org/GUD_Curitiba_MES_Report.pdf. (accessed on 1 May 2019).
- Beatley, T. Wellington, New Zealand: From Town Belt to Blue Belt. In Handbook of Biophilic City Planning and Design; Island Press: Washington, DC, USA, 2016; pp. 75–84. [Google Scholar]
- Pires, A.C.D.; de Freitas Melo, V., II; Lima, V.C., II; Motta, A.C.V. Major soil classes of the metropolitan region of Curitiba (PR), Brazil: I-mineralogical characterization of the sand, silt and clay fractions. Braz. Arch. Biol. Technol. 2007, 50, 169–181. [Google Scholar] [CrossRef]
- Aparecida, S.; Pilotto, A.S. Urban disparity in Curitiba: Studies on segregation. In ISA-RC21 Sao Paulo Conference Inequality, Inclusion and the Sense of Belonging 2009; University of São Paulo: Sao Paulo, Brazil, 2009. [Google Scholar]
- Macedo, J. Curitiba. Cities 2004, 21, 537–549. [Google Scholar] [CrossRef]
- Rabinovitch, J.; Leitman, J. Urban planning in Curitiba. In The Sustainable Urban Development Reader; Routledge: London, UK, 2004; pp. 236–249. [Google Scholar]
- Specht, K.; Siebert, R.; Hartmann, I.; Freisinger, U.B.; Sawicka, M.; Werner, A.; Thomaier, S.; Henckel, D.; Walk, H.; Dierich, A. Urban agriculture of the future: An overview of sustainability aspects of food production in and on buildings. Agric. Hum. Values 2014, 31, 33–51. [Google Scholar] [CrossRef]
- Pedersen Zari, M. Ecosystem services analysis: Incorporating an understanding of ecosystem services into built environment design and materials selection. In Materials for a Healthy, Ecological and Sustainable Built Environment: Principles for Evaluation; Petrović, E.K., Vale, B., Pedersen Zari, M., Eds.; Woodhead: Duxford, UK; pp. 29–64.
- Pedersen Zari, M. Ecosystem Services Analysis in Response to Biodiversity Loss Caused by the Built Environment. SAPIENS 2014, 7, 1–14. [Google Scholar]
- Connop, S.; Vandergert, P.; Eisenberg, B.; Collier, M.J.; Nash, C.; Clough, J.; Newport, D. Renaturing cities using a regionally-focused biodiversity-led multifunctional benefits approach to urban green infrastructure. Environ. Sci. Policy 2016, 62, 99–111. [Google Scholar] [CrossRef]
- Le Roux, D.S.; Ikin, K.; Lindenmayer, D.B.; Blanchard, W.; Manning, A.D.; Gibbons, P. Reduced availability of habitat structures in urban landscapes: Implications for policy and practice. Landsc. Urban Plan 2014, 125, 57–64. [Google Scholar] [CrossRef]
- Clarkson, B.; Wehi, P.; Brabyn, L. A spatial analysis of indigenous cover patterns and implications for ecological restoration in urban centres, New Zealand. Urban Ecosyst. 2007, 10, 441–457. [Google Scholar] [CrossRef]
- Zupancic, T.; Westmacott, C.; Bulthuis, M. The Impact of Green Space on Heat and Air Pollution in Urban Communities: A Meta-Narrative Systematic Review; David Suzuki Foundation: Vancouver, BC, Canada, 2015. [Google Scholar]
- Nielsen, A.; van den Bosch, M.; Maruthaveeran, S.; van den Bosch, C.K. Species richness in urban parks and its drivers: A review of empirical evidence. Urban Ecosyst. 2014, 17, 305–327. [Google Scholar] [CrossRef]
- Van Zoest, J.; Hopman, M. Taking the economic benefits of green space into account: The story of the Dutch TEEB for Cities project. Urban Clim. 2014, 7, 107–114. [Google Scholar] [CrossRef]
- Lee, A.C.K.; Maheswaran, R. The health benefits of urban green spaces: A review of the evidence. J. Public Health 2011, 33, 212–222. [Google Scholar] [CrossRef]
- Maas, J.; A Verheij, R.; Groenewegen, P.P.; De Vries, S.; Spreeuwenberg, P. Green space, urbanity, and health: How strong is the relation? J. Epidemiol. Community Health. 2006, 60, 587–592. [Google Scholar] [CrossRef] [PubMed]
- Heidt, V.; Neef, M. Benefits of Urban Green Space for Improving Urban Climate, in Ecology, Planning, and Management of Urban Forests; Springer: New York, NY, USA, 2008; pp. 84–96. [Google Scholar]
- IPPUC—Instituto de Pesquisa Planejamento Urbano de Curitiba. Curitiba Spatial Dataset Based on DATUM: SAD-69/original. 2017. Available online: http://ippuc.org.br/geodownloads/geo.htm (accessed on 21 September 2017).
- Landcare Research. LCDB v4.1—Land Cover Database Version 4.1, Mainland New Zealand. 2015. Available online: https://lris.scinfo.org.nz/layer/423-lcdb-v41-land-cover-database-version-41-mainland-new-zealand (accessed on 23 January 2018).
- Wellington City Council. Biodiversity Action Plan; Wellington City Council: Wellington, New Zealand, 2007. [Google Scholar]
- Holdaway, R.N. New Zealand’s pre-human avifauna and its vulnerability. N. Z. J. Ecol. 1989, 12, 11–25. [Google Scholar]
- Park, G. An Inventory of the Surviving Traces of the Primary Forest of Wellington City; Wellington City Council: Wellington, New Zealand, 1999. [Google Scholar]
- Karori Sanctuary Trust. A Daring Plan. 2010. Available online: http://www.sanctuary.org.nz/Site/About_us/A_500_year_journey/A_500-year_journey.aspx (accessed on 28 February 2019).
- Gabites, I. Wellington’s Living Cloak. A Guide to the Natural Plant Communities; Victoria University Press: Wellington, New Zealand, 1993. [Google Scholar]
- Rastandeh, A.; Brown, D.K.; Pedersen Zari, M. Biodiversity conservation in urban environments: A review on the importance of spatial patterning of landscapes. In Proceedings of the Ecocity World Summitt, Melbourne, Australia, 12–14 July 2017. [Google Scholar]
- Rastandeh, A.; Brown, D.K.; Zari, M.P. Site selection of urban wildlife sanctuaries for safeguarding indigenous biodiversity against increased predator pressures. Urban For. Urban Green. 2018, 32, 21–31. [Google Scholar] [CrossRef]
- Pedersen Zari, M. Ecosystem Services Analysis for the Design of Regenerative Urban Built Environments, in School of Architecture; Victoria University of Wellington: Wellington, New Zealand, 2012; p. 476. [Google Scholar]
- Rastandeh, A.; Zari, M.P. A spatial analysis of land cover patterns and its implications for urban avifauna persistence under climate change. Landsc. Ecol. 2018, 33, 455–474. [Google Scholar] [CrossRef]
- Klink, J.; Denaldi, R. Metropolitan fragmentation and neo-localism in the periphery: Revisiting the case of Curitiba. Urban Stud. 2012, 49, 543–561. [Google Scholar] [CrossRef]
- Liebsch, D.; Marques, M.C.; Goldenberg, R. How long does the Atlantic Rain Forest take to recover after a disturbance? Changes in species composition and ecological features during secondary succession. Boil. Conserv. 2008, 141, 1717–1725. [Google Scholar] [CrossRef]
- Silvano, R.A.; Udvardy, S.; Ceroni, M.; Farley, J. An ecological integrity assessment of a Brazilian Atlantic Forest watershed based on surveys of stream health and local farmers’ perceptions: Implications for management. Ecol. Econ. 2005, 53, 369–385. [Google Scholar] [CrossRef]
- Rabinovitch, J. Curitiba: Towards sustainable urban development. Environ. Urban. 1992, 4, 62–73. [Google Scholar] [CrossRef]
- Ewing, K. Conservation Covenants and Community Conservation Groups: Improving the Protection of Private Land. New Zeal. J. Environ. Law 2008, 12, 315–337. [Google Scholar]
- Carswell, F.; Mason, M.; Davis, M.; Briggs, C.; Clinton, P.; Green, W.; Standish, R.; Allen, R. Synthesis of Carbon Stock Information Regarding Conservation Land; Landcare Research Contract Report LC0708/071; Department of Conservation: Wellington, New Zealand, 2008. [Google Scholar]
- Andrén, H. Effects of Habitat Fragmentation on Birds and Mammals in Landscapes with Different Proportions of Suitable Habitat: A Review. Oikos 1994, 71, 355. [Google Scholar] [CrossRef]
- Tabarelli, M.; Aguiar, A.V.; Ribeiro, M.C.; Metzger, J.P.; Peres, C.A. Prospects for biodiversity conservation in the Atlantic Forest: Lessons from aging human-modified landscapes. Boil. Conserv. 2010, 143, 2328–2340. [Google Scholar] [CrossRef]
- Rabinovitch, J.; Leitman, J. Urban Planning in Curitiba; Routlegde: London, UK, 2004. [Google Scholar]
- Hansen, R.; Pauleit, S. From Multifunctionality to Multiple Ecosystem Services? A Conceptual Framework for Multifunctionality in Green Infrastructure Planning for Urban Areas. AMBIO 2014, 43, 516–529. [Google Scholar] [CrossRef] [PubMed]
- Haase, D.; Strohbach, M.; Kroll, F.; Schwarz, N.; Seppelt, R. Synergies, Trade-offs, and Losses of Ecosystem Services in Urban Regions: An Integrated Multiscale Framework Applied to the Leipzig-Halle Region, Germany. Ecol. Soc. 2012, 17. [Google Scholar] [CrossRef]
- Grêt-Regamey, A.; Celio, E.; Klein, T.M.; Hayek, U.W. Understanding ecosystem services trade-offs with interactive procedural modeling for sustainable urban planning. Landsc. Urban Plan. 2013, 109, 107–116. [Google Scholar] [CrossRef]
- Lee, H.; Lautenbach, S. A quantitative review of relationships between ecosystem services. Ecol. Indic. 2016, 66, 340–351. [Google Scholar] [CrossRef]
- Howe, C.; Suich, H.; Vira, B.; Mace, G.M. Creating win-wins from trade-offs? Ecosystem services for human well-being: A meta-analysis of ecosystem service trade-offs and synergies in the real world. Environ. Chang. 2014, 28, 263–275. [Google Scholar] [CrossRef]
- Wolch, J.R.; West, K.; Gaines, T.E. Transspecies urban theory. Environ. Plan D Soc. Space 1995, 13, 735–760. [Google Scholar] [CrossRef]
- Bull, J.W.; Strange, N. The global extent of biodiversity offset implementation under no net loss policies. Nat. Sustain. 2018, 1, 790–798. [Google Scholar] [CrossRef]
- Rastandeh, A.; Zari, M.P.; Brown, D.K.; Vale, R. Utilising exotic flora in support of urban indigenous biodiversity: Lessons for landscape architecture. Landsc. Res. 2017, 43, 708–720. [Google Scholar] [CrossRef]
- Lundholm, J.T.; Richardson, P.J. Mini-Review: Habitat analogues for reconciliation ecology in urban and industrial environments. J. Appl. Ecol. 2010, 47, 966–975. [Google Scholar] [CrossRef]
- Lundholm, J. Green Roofs and Facades: A Habitat Template Approach. Urban Habitats 2006, 4, 87–101. [Google Scholar]
Figure 1.
Ecosystem services analysis process (source: Pedersen Zari [11]).
Figure 1.
Ecosystem services analysis process (source: Pedersen Zari [11]).

Figure 2.
Land-cover types in Wellington and Curitiba.

Figure 3.
The provision of habitat for wildlife in Wellington and Curitiba.


Table 1.
Ecosystem services with particular reference to urban settings (adapted from Reference [11]). GHG—greenhouse gas; UV—ultraviolet.
Table 1.
Ecosystem services with particular reference to urban settings (adapted from Reference [11]). GHG—greenhouse gas; UV—ultraviolet.
| 1. Provisioning Services | 2. Regulating Services | 3. Supporting Services | 4. Cultural Services |
|---|---|---|---|
| 1.1 Food - Human (land/fresh water/marine) - Forage 1.2 Biochemicals -Medicines -Other 1.3 Raw materials -Timber -Fibre -Stone -Minerals/ores 1.4 Fuel/energy -Biomass -Solar -Hydro -Other 1.5 Fresh water -Consumption -Irrigation -Industrial processes 1.6 Genetic information | 2.1 Pollination and seed dispersal 2.2 Biological control -Pest regulation -Invasive species resistance -Disease regulation 2.3 Climate regulation -GHG regulation -UV protection -Moderation of temperature -Moderation of noise 2.4 Prevention of disturbance and moderation of extremes -Wind/wave/runoff force modification -Mitigation of flood/drought -Erosion control 2.5 Decomposition -Waste removal 2.6 Purification -Water/air/soil | 3.1 Soil -Formation -Retention -Renewal of fertility -Quality control 3.2 Fixation of solar energy -Primary production/plant growth (above ground, below ground, marine, fresh water) 3.3 Nutrient cycling -Regulation of biogeochemical cycles -Retention of nutrients 3.4 Habitat provision -Suitable habitat for organisms -Suitable reproduction habitat 3.5 Species maintenance -Biodiversity -Natural selection -Self-organisation | 4.1 Education and knowledge 4.2 Aesthetic value and artistic inspiration 4.3 Recreation, relaxation, and psychological wellbeing 4.4 Spiritual inspiration 4.5 Creation of a sense of place and relationship. Cultural diversity and history |
Table 2.
Comparison of climate, population, and ecology between Wellington and Curitiba.
| Criteria | Wellington | Curitiba |
|---|---|---|
| Latitude, longitude | 41.2865° south (S), 174.7762° east (E) | 25.4809° S, 49.3044° west (W) |
| Population | 200,000 | 1,800,000 |
| Population density (people per hectare) | 7 | 90 |
| Average income (United States dollars ($US) per annum) 1 | $33,737 (2015) | $7888 (2017) |
| Average age of residents in 2015 (years) | 38 | 31.3 |
| Average life expectancy in 2015 (combined genders in years) | 81.5 | 77.8 |
| Population growth per annum | 1.9% | 1.7% |
| Area of city (hectares) | 28,990 | 38,629 |
| Built up area (hectares) | 5446 (19%) | 26,906 (69%) |
| Other land cover types (hectares): | ||
| Forest (regenerating/exotic), parkland | 2089 (7%) | 1457 (4%) |
| Agricultural and/or pasture land | 9424 (32%) | 8472 (22%) |
| Bushland and scrub | 11,700 (40%) | N/A |
| Lake, pond, wetland and/or river | 16 (<0.1%) | 1794 (5%) |
| Sand and/or gravel | 149 (0.5%) | N/A |
| Native forest | 166 (0.6%) | ~0 |
| Green space (m2 per person) | 200 | 52 |
| GHG emissions per capita (tonnes of CO2-e) | 6.6 | 1.7 |
| Classified as a global biodiversity hotspot | ✓ | ✓ |
| Climate (Köppen–Geiger classification) | Cfb (temperate oceanic climate) | Cfb (subtropical highland climate) |
| Average temperature (°C) | 12.8 | 16.5 |
| Annual rainfall (mm) | 1250 | 1408 |
| Surface perviousness (SP) (%) | 80 | 31 |
| Annual sunshine (hours) | 2059 | 2006 |
| Annual wind speed (km/h) | 27 | 14 |
| Elevation (metres above sea level) | 0 to 299 | Average: 935 |
| Topography | Complex steep valley and ridge systems running predominantly north–east/south–west | Mostly flat with smooth rounded hills on a plateau |
| Natural hazards | Earthquakes, wind | Floods, wind |
1 These figures vary considerably between sources. N/A—not applicable.
Table 3.
Ecosystem services analysis process steps 2a, 2b, and 3 for habitat (adapted from Pedersen Zari [11]).
Table 3.
Ecosystem services analysis process steps 2a, 2b, and 3 for habitat (adapted from Pedersen Zari [11]).
| Determining ecosystem services present for a city pre-human development (Step 2a) | |
| Indicators and units | Process |
| Area covered by forest, wetland, lake/river, pasture, etc. (ha) | Calculate total area of site Determine land-cover types for the pre-development condition Determine pre-development areas of each land-cover type by conducting an ecological history review and/or examining nearby intact ecosystems |
| Determining ecosystem services present in a city currently (Step 2b) | |
| Indicators and units | Process |
| Area covered by forest, wetland, lake/river, pasture, etc. (ha) | Calculate area of site where habitat suitable for indigenous wildlife remains |
| Determining ecosystem services-based goals for urban development (Step 3) | |
| Process | |
| Determine vegetation cover necessary for increase in biodiversity health (%) through literature review or expert interview Use results from 2b to determine additional vegetation necessary for increase in biodiversity health Note: spatial analysis is required to determine specifically where regeneration should occur to take into account habitat fragmentation and edge effects. | |
Table 4.
Definitions of classified land-cover types in Curitiba and Wellington.
| Land-Cover Type | Definition |
|---|---|
| Built-up and/or non-vegetated area | Impervious areas covered by buildings, roads, etc., as well as non-vegetated areas covered by rock, sand, and/or gravel. |
| Agriculture and/or pastureland | Areas covered by a wide range of agricultural and/or pastureland, croplands, orchards, etc., managed by people for the production of fresh fruit, vegetables, dairy, meat, etc. |
| Native Forest | Remnant patches of native forests used by native species as the primary habitat and food source. |
| Exotic forest and/or urban parkland | Green spaces including exotic and invasive plant species mainly created and managed by people for recreational and/or commercial purposes. Bushlands, grasslands, and scrublands were also included in this land-cover type. |
| Lake, pond, and/or wetland | Inland water bodies including natural and/or artificial lakes, ponds, and wetlands. |
Table 5.
The extent of land-cover types in Curitiba and Wellington.
| Land Cover Type | Curitiba | Wellington | ||
|---|---|---|---|---|
| Area (ha) | Percent | Area (ha) | Percent | |
| Built-up and/or non-vegetated area | 26,906 | 69 | 5595 | 20.3 |
| Agriculture and/or pastureland | 8472 | 22 | 9424 | 32 |
| Native forest | ~0 | ~0 | 166 | 0.6 |
| Exotic forest and/or urban parkland | 1457 | 4 | 13789 | 47 |
| Lake, pond, and/or wetland | 1794 | 5 | 16 | <0.1 |
| Total | 38,629 | 100 | 28,990 | 100 |
Table 6.
Comparison of pre-development, current, and potential future provision of habitat in Wellington and Curitiba.
Table 6.
Comparison of pre-development, current, and potential future provision of habitat in Wellington and Curitiba.
| Wellington | Curitiba | |
|---|---|---|
| Pre-development habitat ecosystem service provision | 100% | 100% |
| Current habitat ecosystem service provision | 0.6%–2% | <1% |
| Potential future ecosystem service provision targets | Stage 1: 10% Stage 2: 20% | Stage 1: 10% Stage 2: 30% |
Table 7.
Priorities for areas that should be dedicated to urban habitat provision.
|
© 2019 by the author. Licensee MDPI, Basel, Switzerland. This article is an open access article distributed under the terms and conditions of the Creative Commons Attribution (CC BY) license (http://creativecommons.org/licenses/by/4.0/).
Share and Cite
MDPI and ACS Style
Pedersen Zari, M. Devising Urban Biodiversity Habitat Provision Goals: Ecosystem Services Analysis. Forests 2019, 10, 391. https://doi.org/10.3390/f10050391
AMA Style
Pedersen Zari M. Devising Urban Biodiversity Habitat Provision Goals: Ecosystem Services Analysis. Forests. 2019; 10(5):391. https://doi.org/10.3390/f10050391
Chicago/Turabian StylePedersen Zari, Maibritt. 2019. "Devising Urban Biodiversity Habitat Provision Goals: Ecosystem Services Analysis" Forests 10, no. 5: 391. https://doi.org/10.3390/f10050391
Note that from the first issue of 2016, this journal uses article numbers instead of page numbers. See further details here.