Bamboo Water Transport Assessed with Deuterium Tracing


Abstract
:1. Introduction
2. Materials and Methods
2.1. Study Site and Species
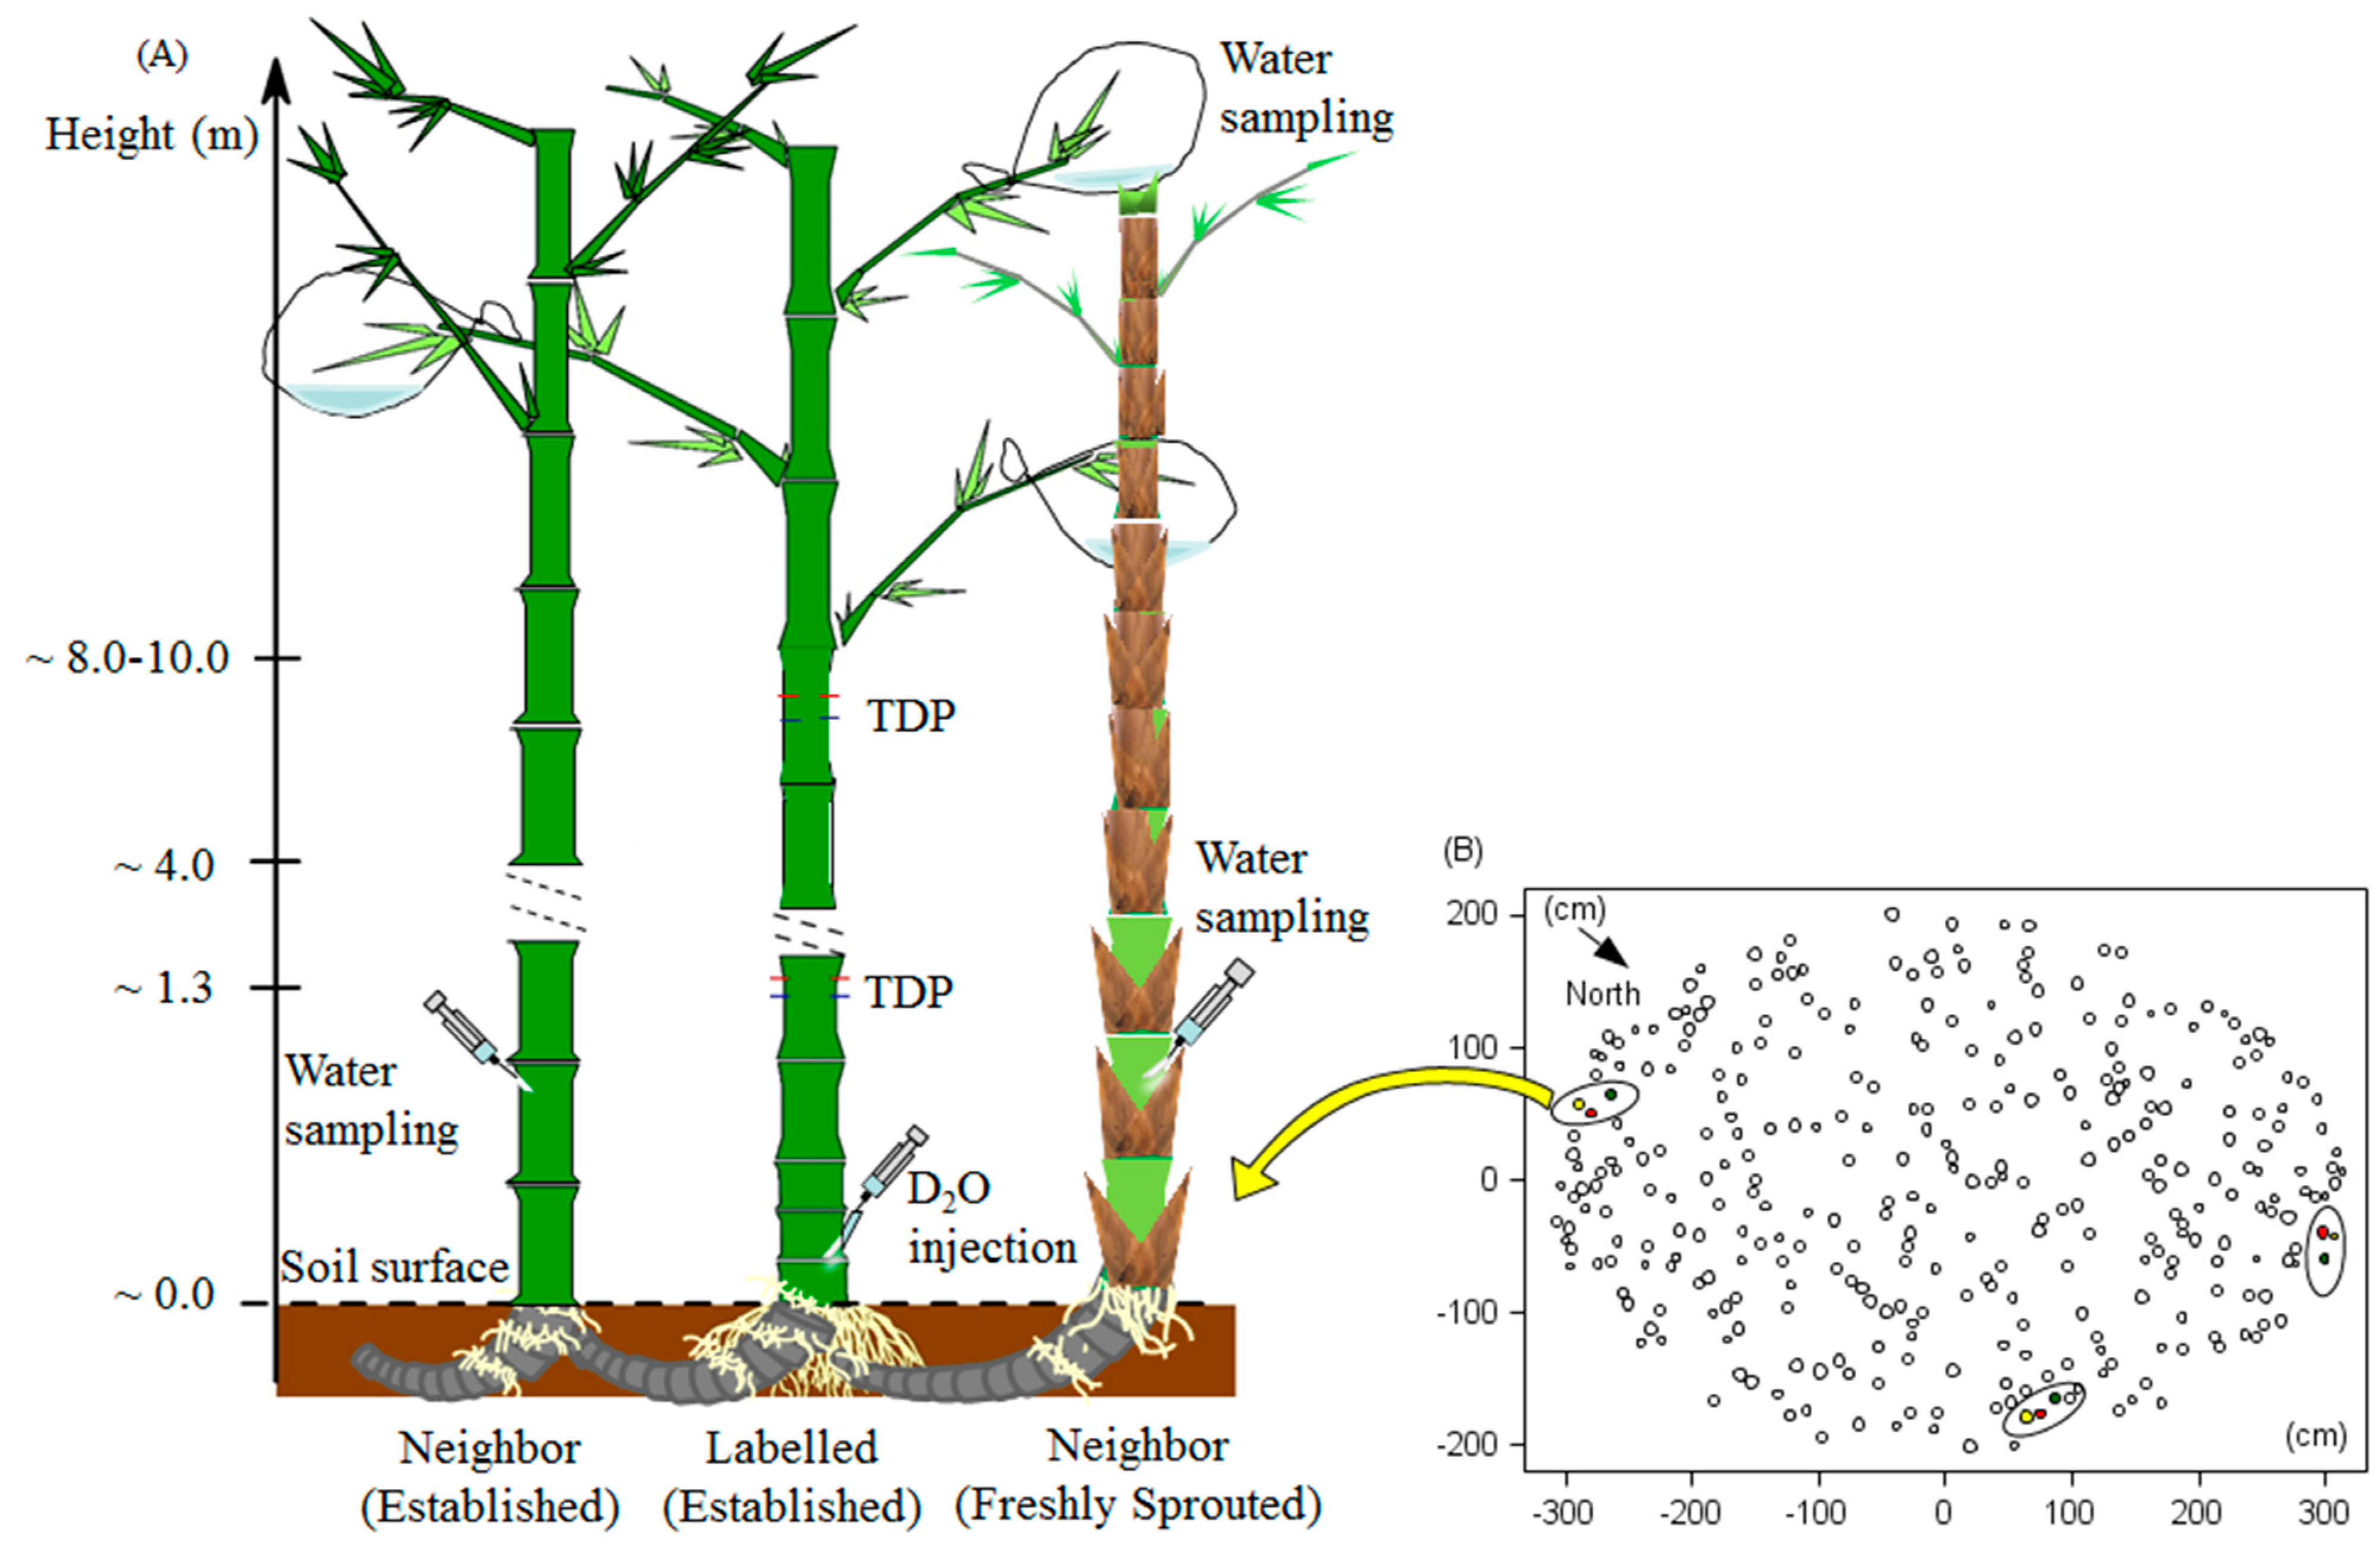
2.2. D2O Tracing
2.3. D2O Laboratory Analysis
2.4. D2O Tracer Movement and Derived Velocity and Water Use
2.5. Sap Flow Measurements and Water Use Estimation with the Thermal Dissipation Probes (TDP) Method
2.6. Water Transfer among Culms
2.6.1. The Receiving Culm
2.6.2. The Donating Culm
2.7. Data Analysis and Statistics
3. Results
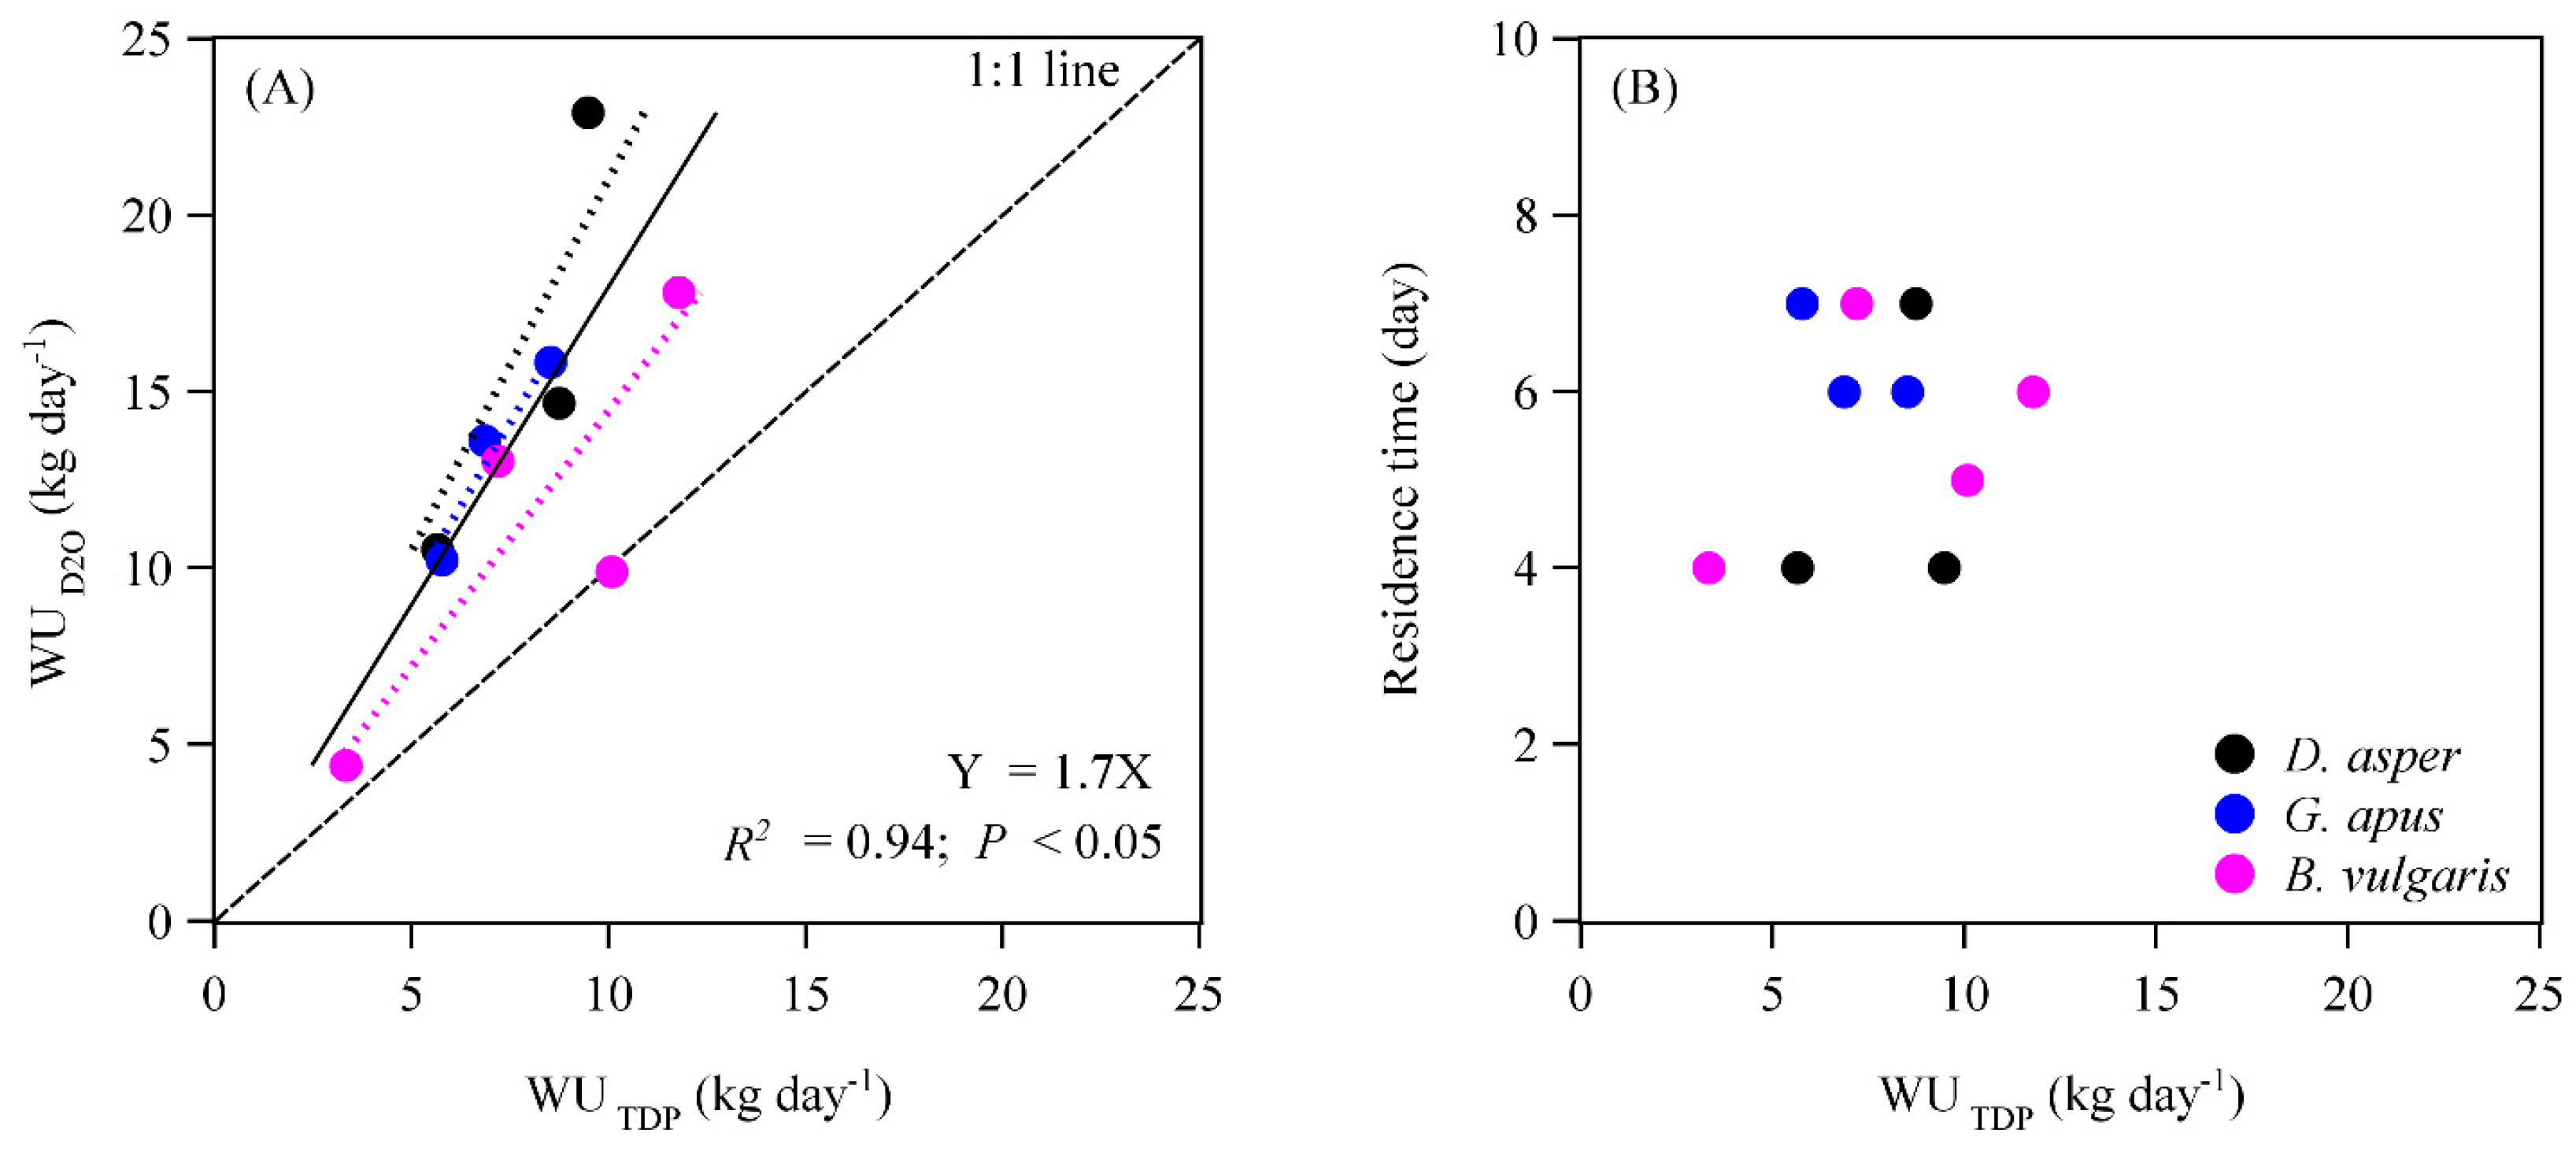
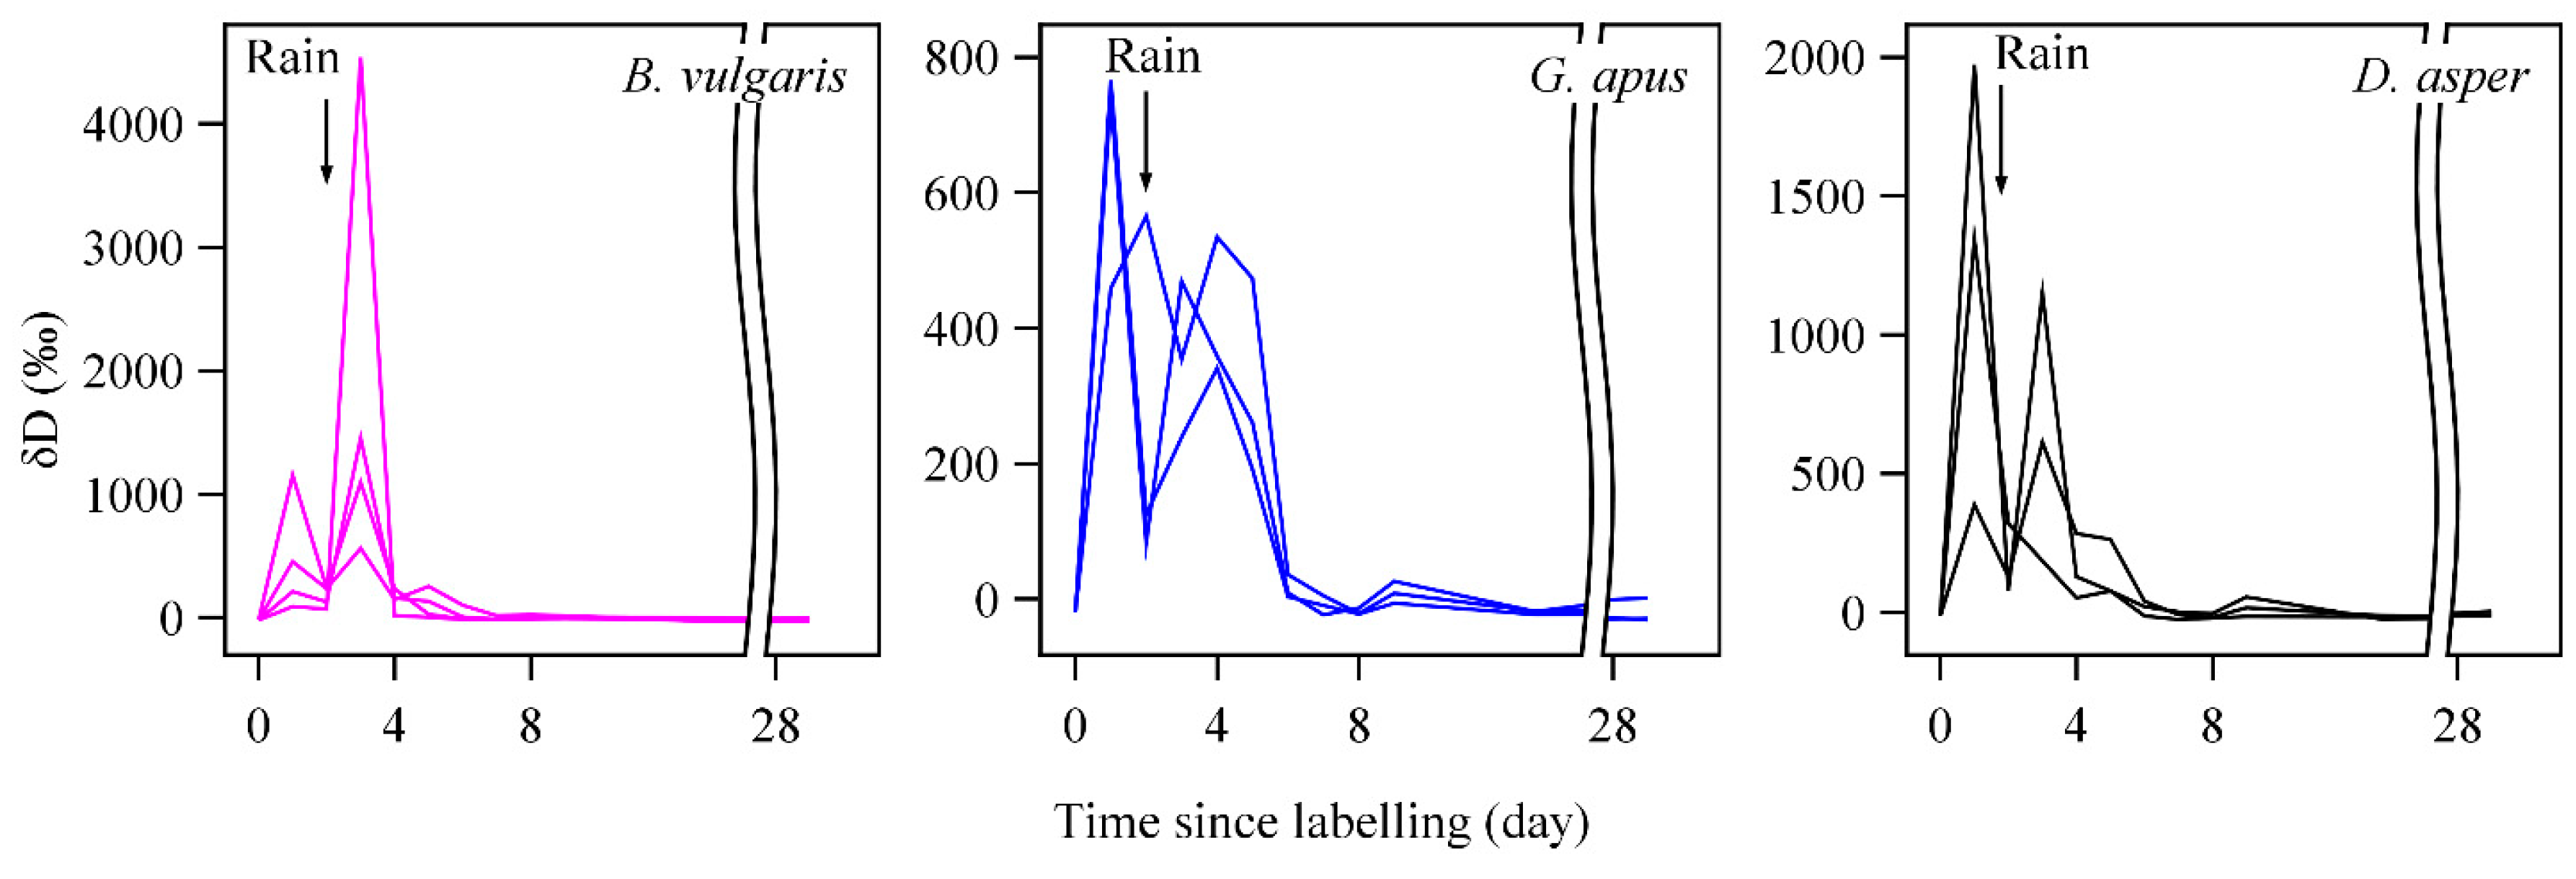
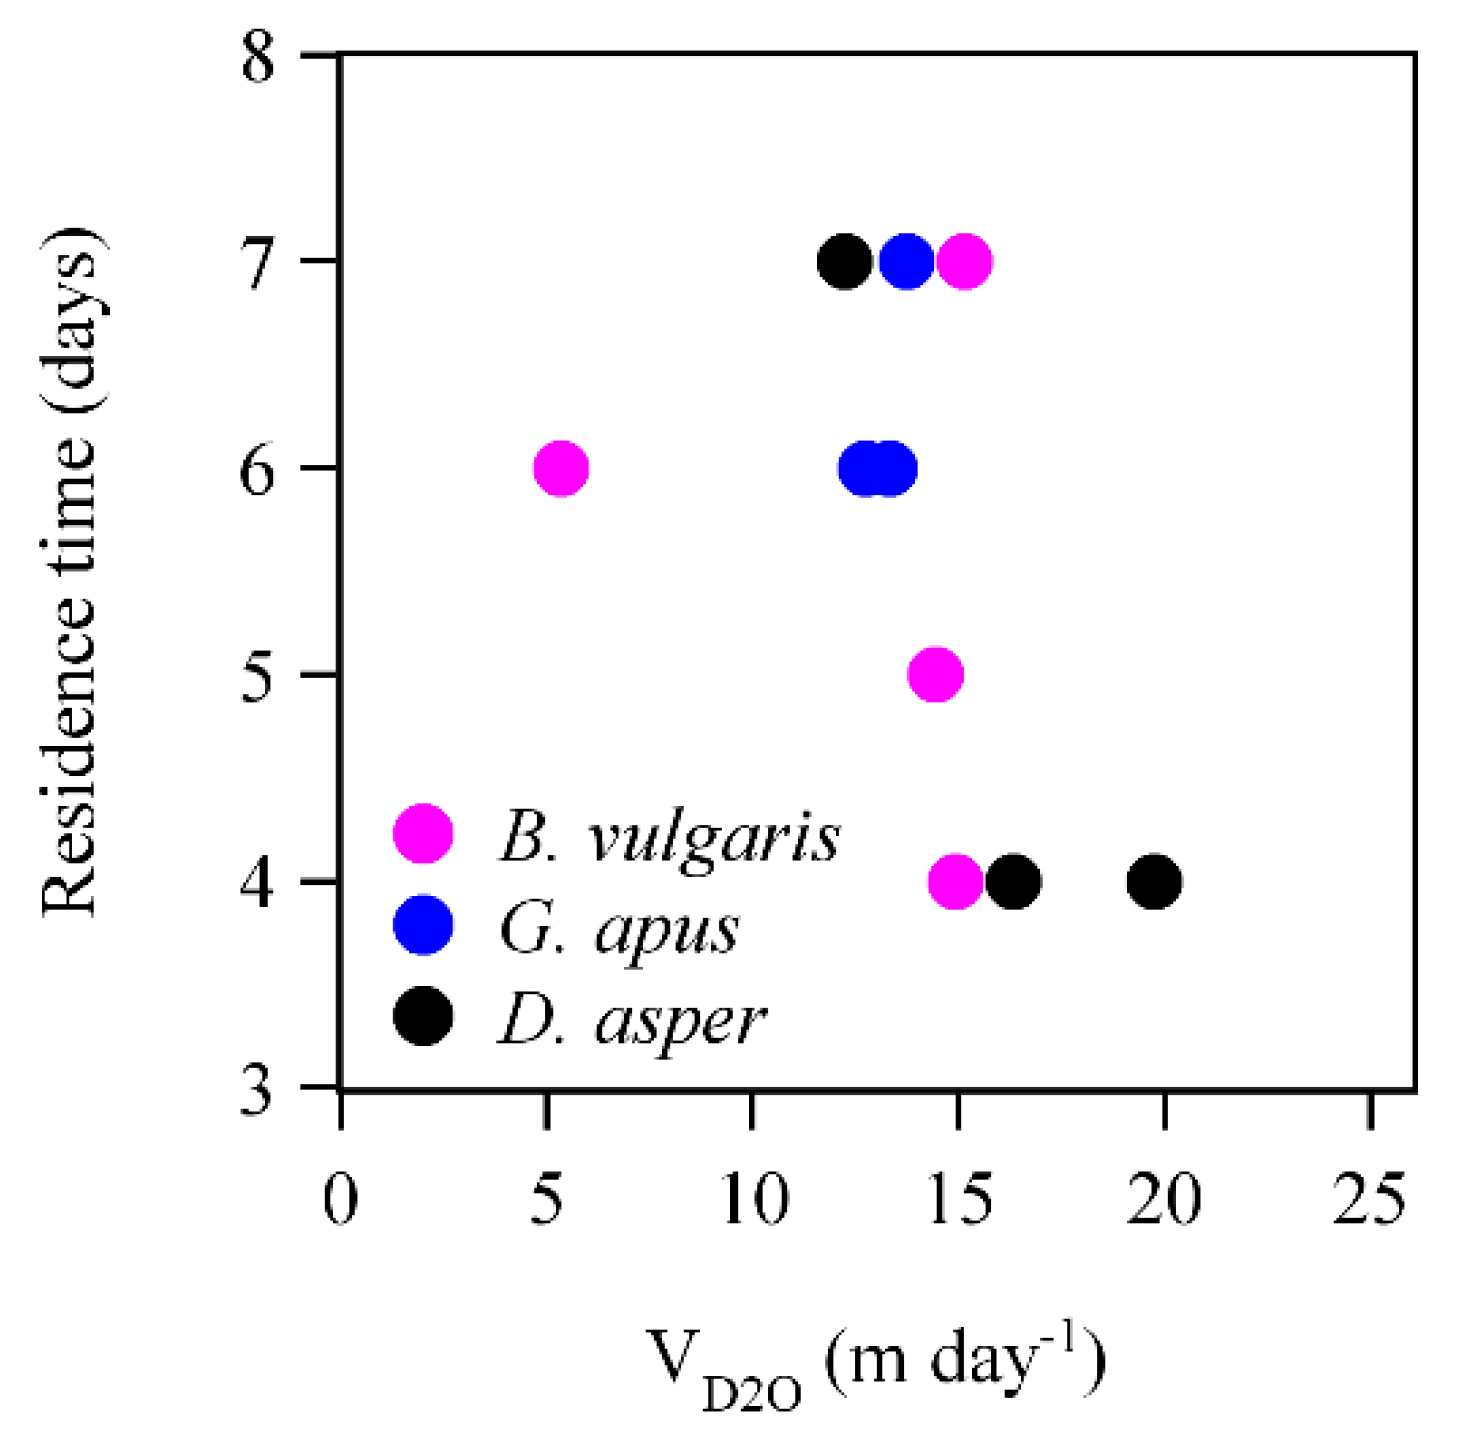
3.1. Tracer Movement, Sap Velocities, and Water Use Rates
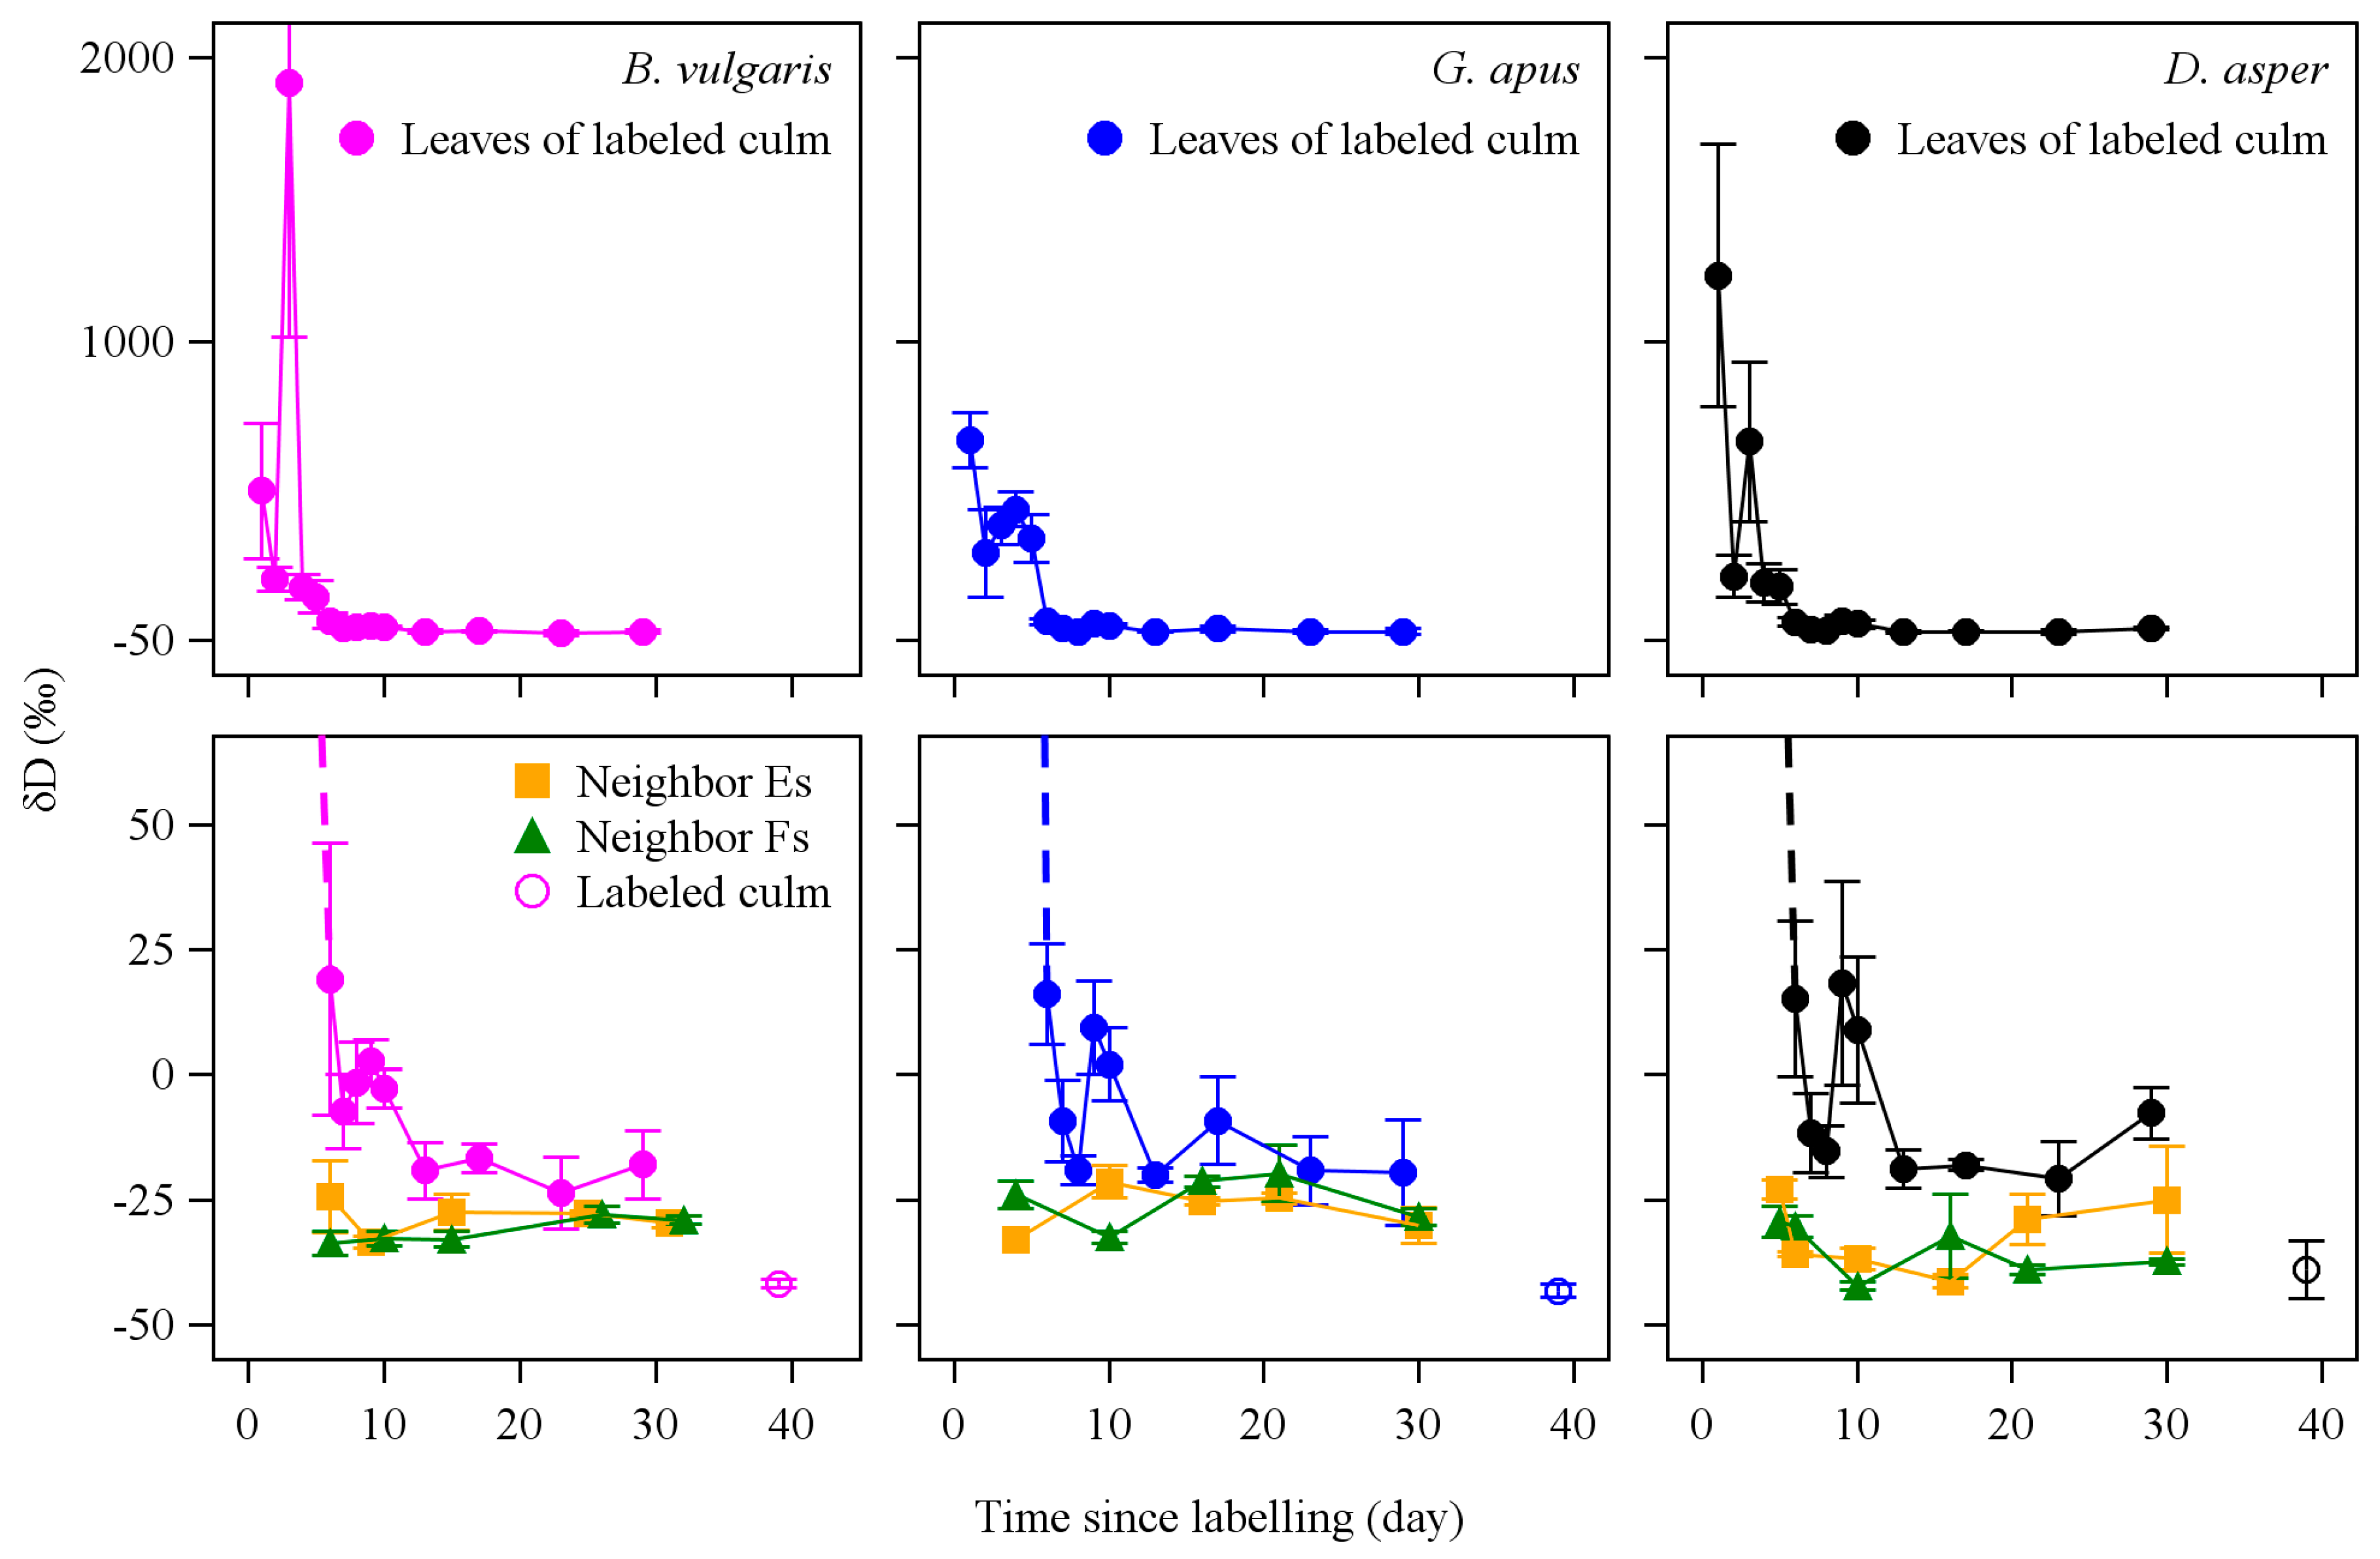
3.2. D2O Retention
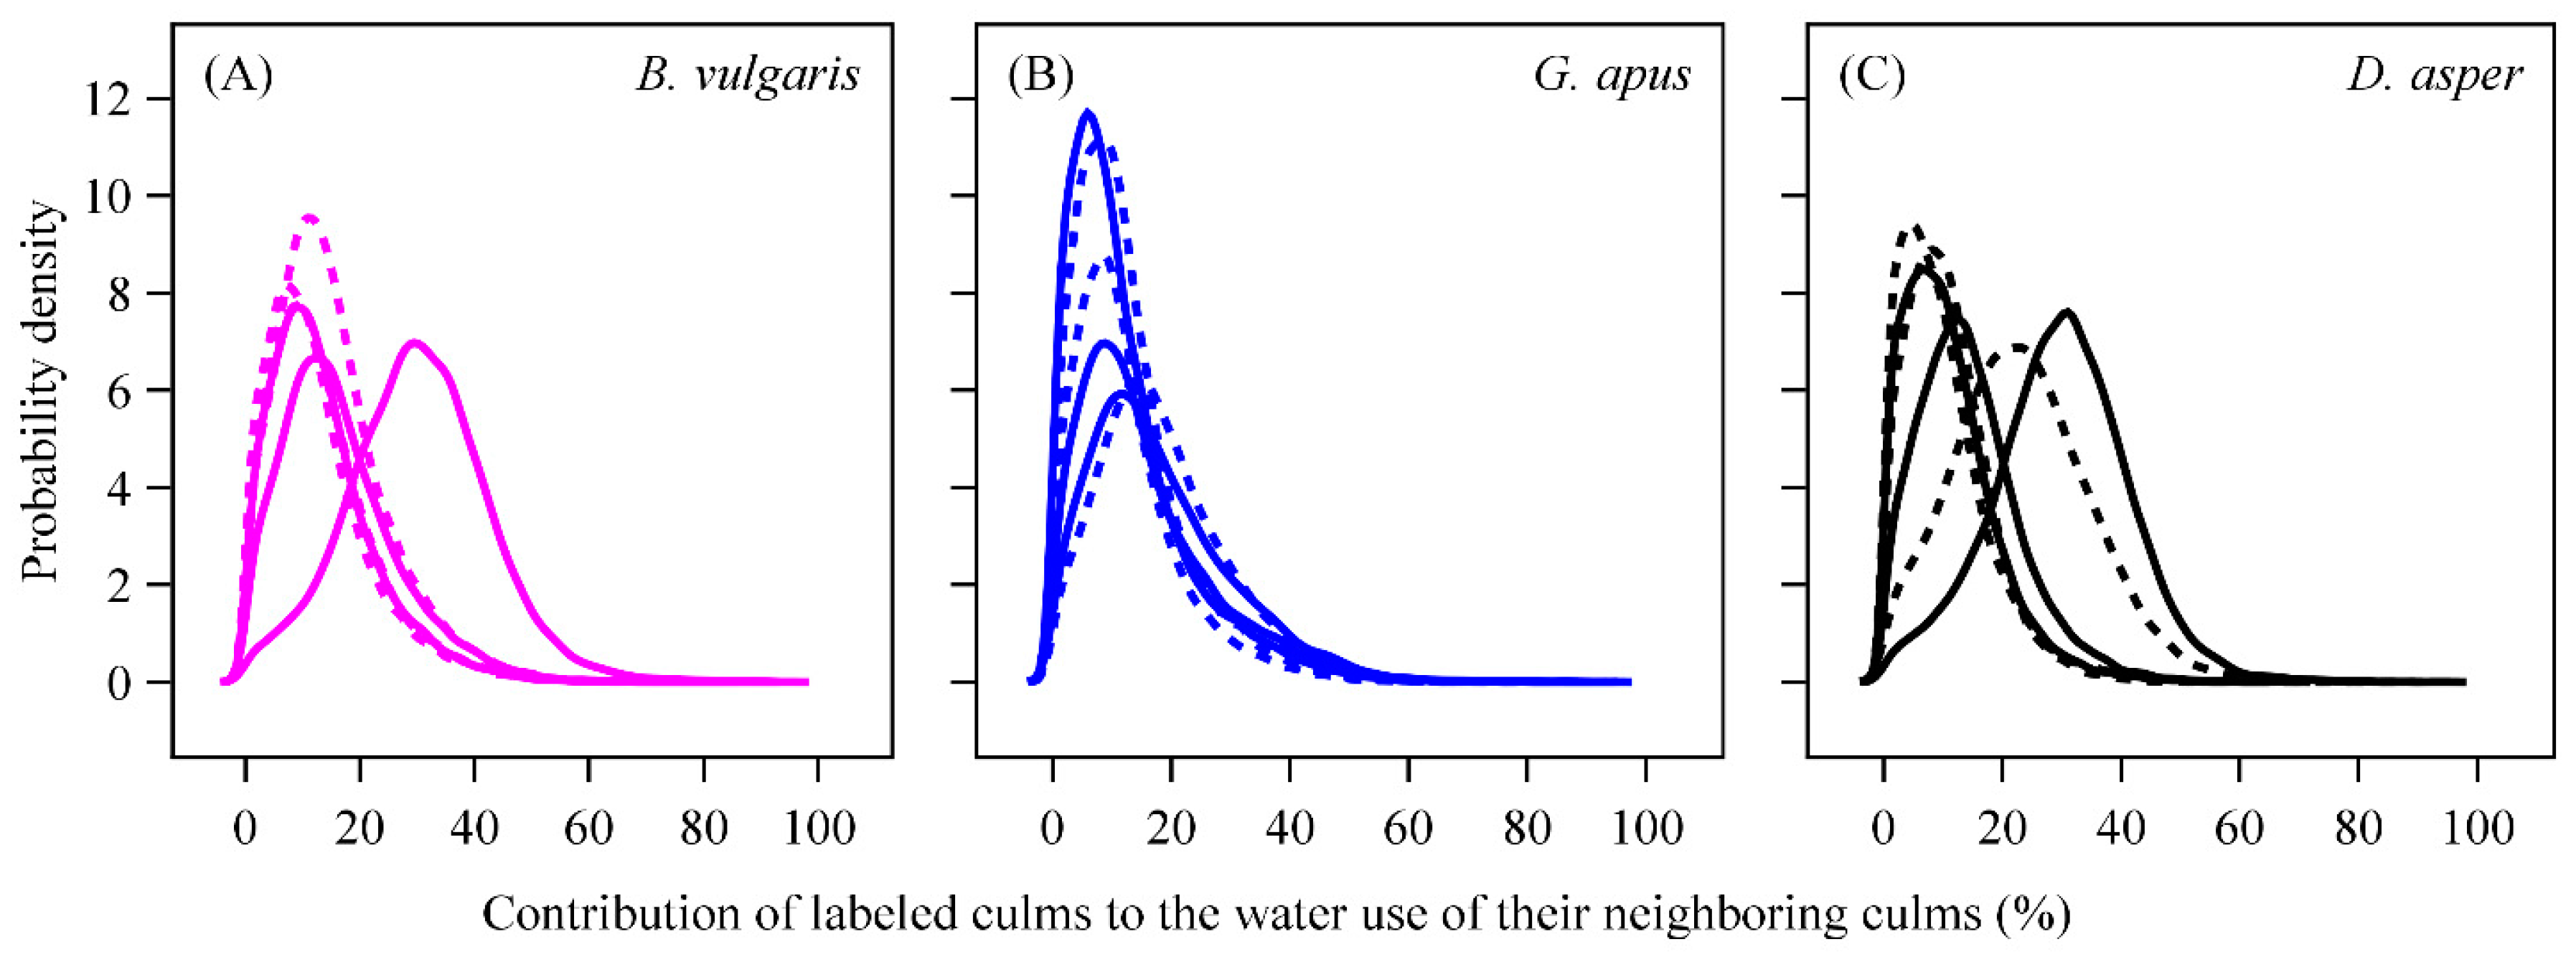
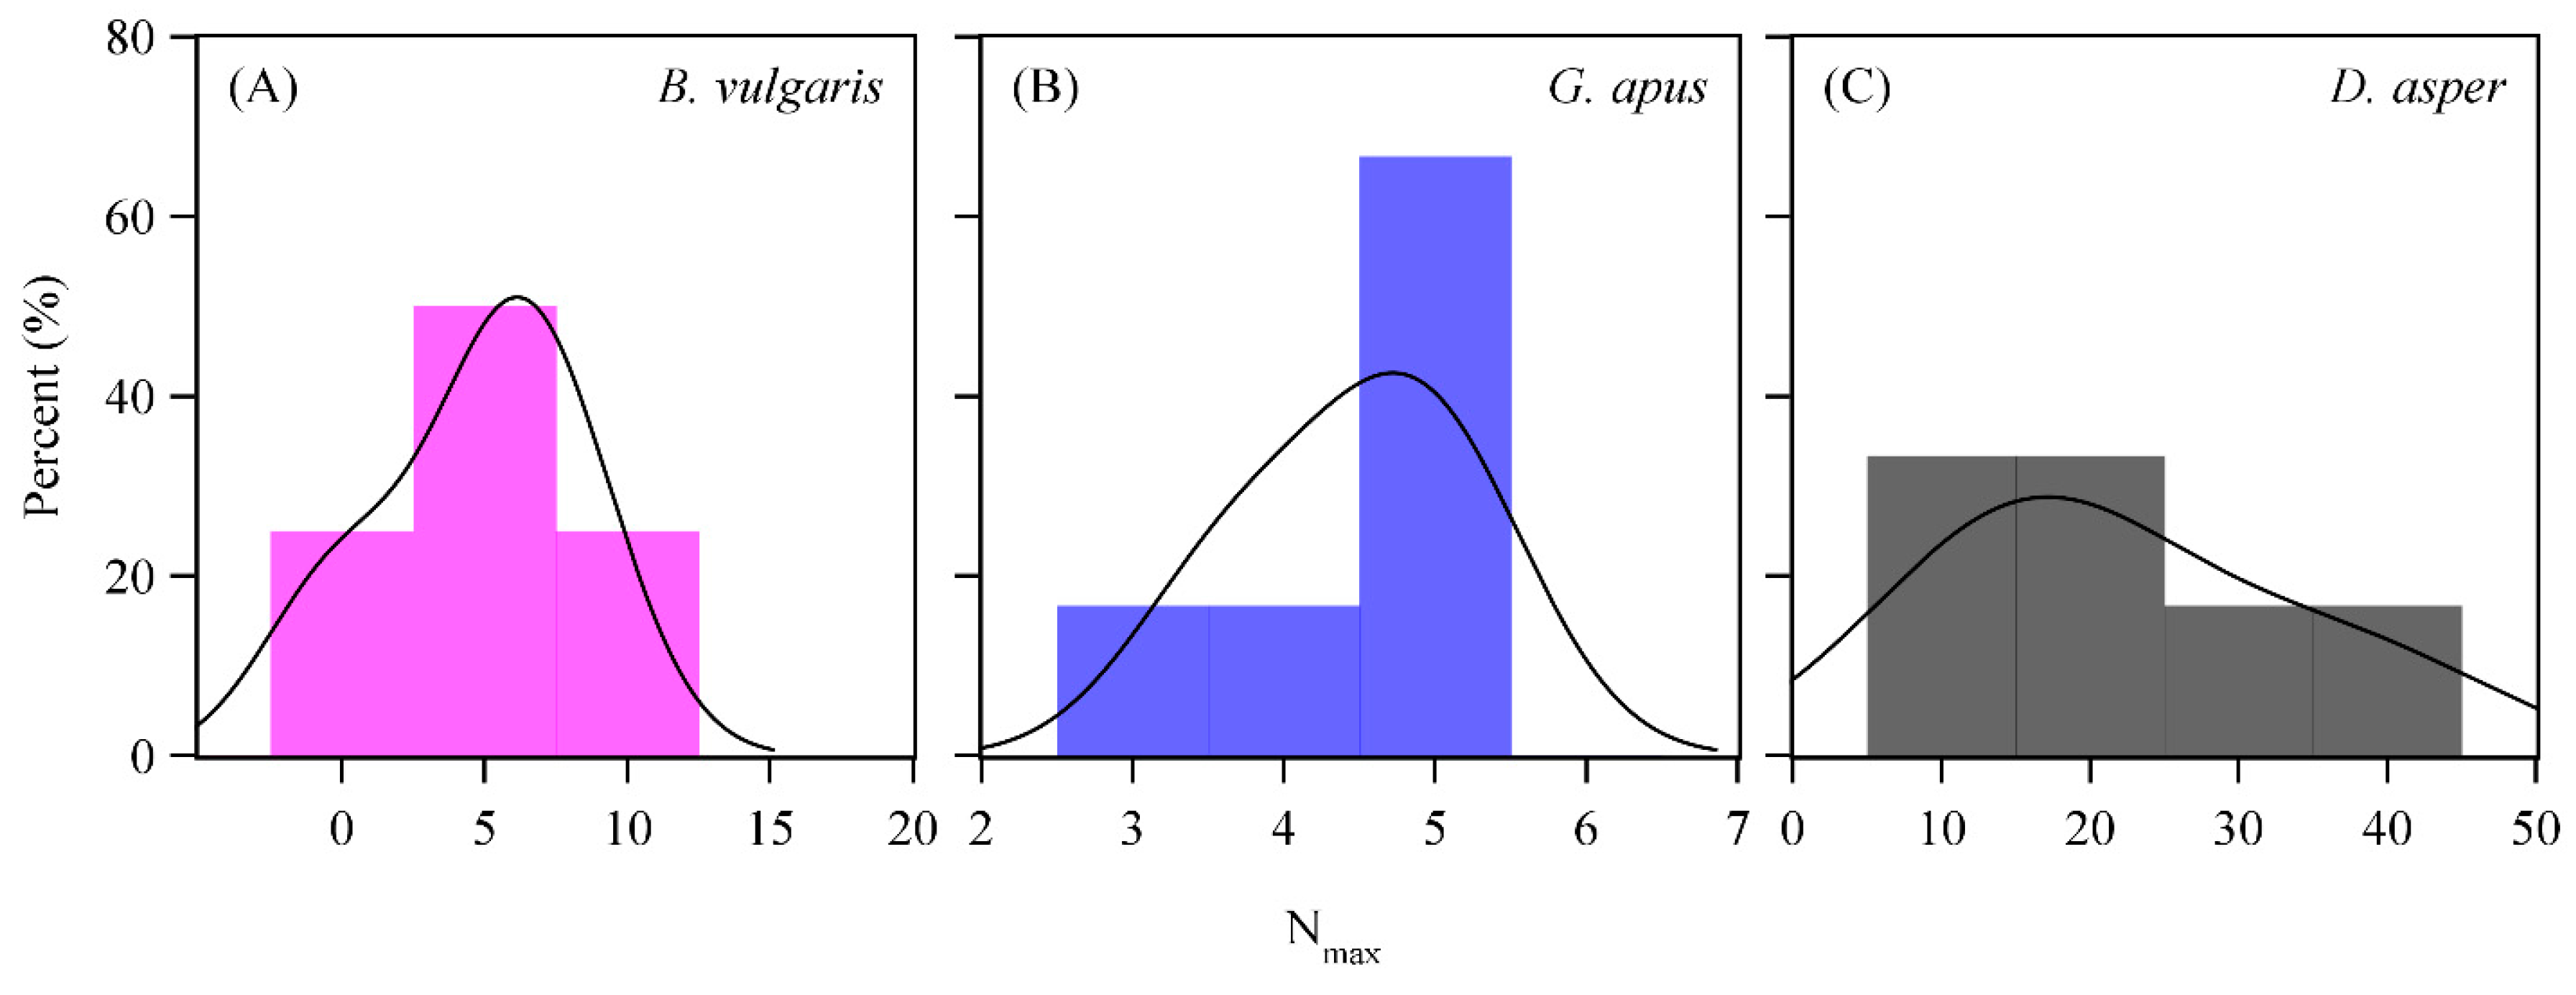
3.3. D2O Transfer
4. Discussion
4.1. Sap Velocity
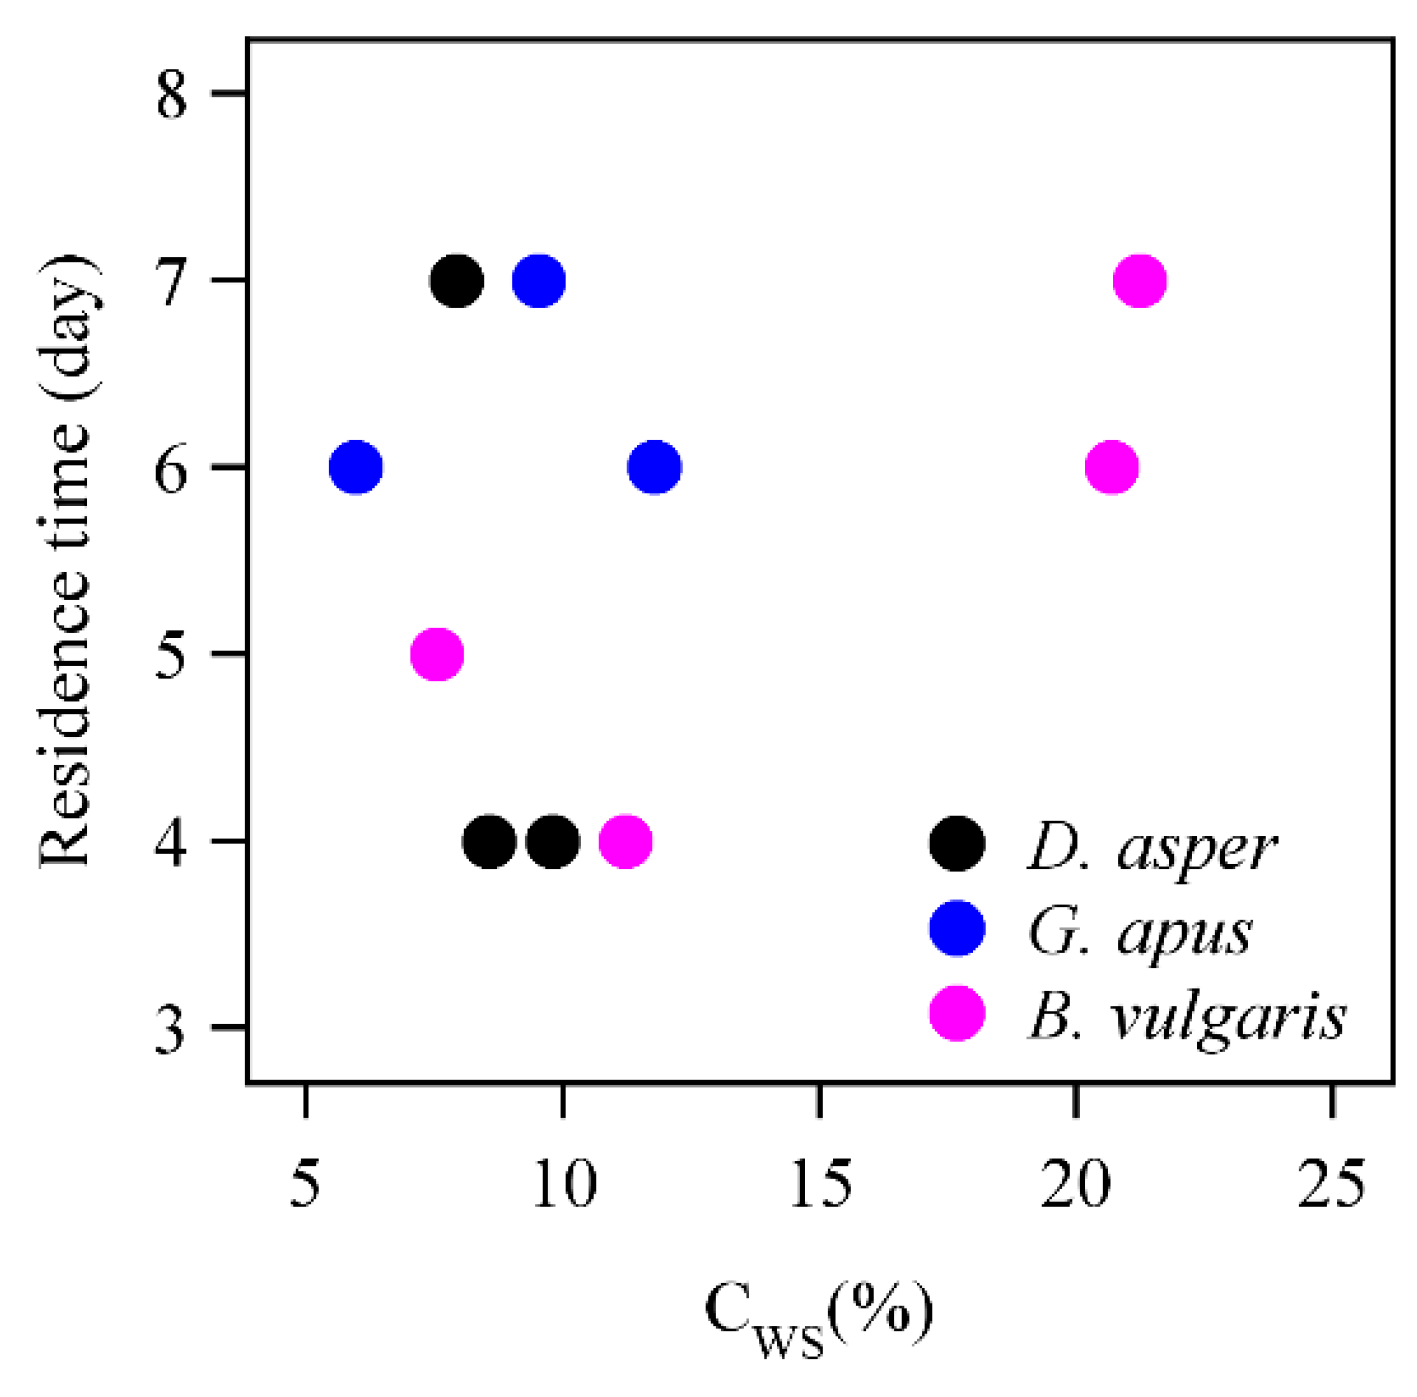
4.2. D2O Residence Time and Water Storage
4.3. Water Use Rates Derived with the Deuterium Tracing Method
4.4. D2O Retention
4.5. D2O Transfer between Culms
4.6. Lessons for Future Water Transfer Studies on Bamboos
5. Conclusions
Author Contributions
Funding
Acknowledgments
Conflicts of Interest
Appendix A


| Dependent | Source | DF | Sum of Squares | Mean Square | F Value | Pr > F |
|---|---|---|---|---|---|---|
| Tarrival | species | 2 | 1.35 | 0.68 | 1.58 | 0.2724 |
| Error | 7 | 3.00 | 0.43 | . | . | |
| Tmax | species | 2 | 0.76 | 0.38 | 0.62 | 0.5639 |
| Error | 7 | 4.26 | 0.61 | . | . | |
| Tresidence | species | 2 | 4.79 | 2.39 | 1.66 | 0.2565 |
| Error | 7 | 10.07 | 1.44 | . | . | |
| VD2O | species | 2 | 1383.1 | 691.6 | 1.37 | 0.3139 |
| Error | 7 | 3525.1 | 503.6 | . | . | |
| WUD2O | species | 2 | 818.52 | 409.3 | 0.99 | 0.4190 |
| Error | 7 | 2900.6 | 414.4 | . | . |
| Dependent | Source | DF | Sum of Squares | Mean Square | F Value | Pr > F |
|---|---|---|---|---|---|---|
| Tarrival | Model | 2 | 0.60 | 0.30 | 0.70 | 0.5283 |
| Error | 7 | 3.00 | 0.43 | . | . | |
| Corrected Total | 9 | 3.60 | . | . | . | |
| Tmax | Model | 2 | 2.57 | 1.28 | 1.42 | 0.3040 |
| Error | 7 | 6.33 | 0.90 | . | . | |
| Corrected Total | 9 | 8.90 | . | . | . | |
| Tresidence | Model | 2 | 2.73 | 1.37 | 0.82 | 0.4787 |
| Error | 7 | 11.67 | 1.67 | . | . | |
| Corrected Total | 9 | 14.40 | . | . | . | |
| VD2O | Model | 2 | 45.62 | 22.81 | 1.35 | 0.3182 |
| Error | 7 | 117.88 | 16.84 | . | . | |
| Corrected Total | 9 | 163.50 | . | . | . | |
| WUD2O | Model | 2 | 38.72 | 19.36 | 0.71 | 0.5225 |
| Error | 7 | 190.01 | 27.14 | . | . | |
| Corrected Total | 9 | 228.72 | . | . | . |
| Species | Source | DF | Sum of Squares | Mean Square | F Value | Pr > F |
|---|---|---|---|---|---|---|
| D. asper | organs | 4 | 380,615 | 95154 | 3.44 | 0.0515 |
| Error | 10 | 276,822 | 27682 | . | . | |
| G. apus | organs | 4 | 62.44 | 15.61 | 0.86 | 0.5176 |
| Error | 10 | 180.60 | 18.06 | . | . | |
| B. vulgaris | organs | 6 | 1746.4 | 291.1 | 2.17 | 0.0896 |
| Error | 20 | 2682.0 | 134.1 | . | . |
| Species | Source | DF | Sum of Squares | Mean Square | F Value | Pr > F |
|---|---|---|---|---|---|---|
| D. asper | Model | 6 | 555.02 | 92.50 | 0.60 | 0.7289 |
| Error | 12 | 1863.8 | 155.3 | . | . | |
| Corrected Total | 18 | 2418.8 | . | . | . | |
| G. apus | Model | 6 | 402.56 | 67.09 | 10.87 | 0.0003 |
| Error | 12 | 74.05 | 6.17 | . | . | |
| Corrected Total | 18 | 476.61 | . | . | . | |
| B. vulgaris | Model | 6 | 491.48 | 81.91 | 7.95 | 0.0002 |
| Error | 20 | 206.04 | 10.30 | . | . | |
| Corrected Total | 26 | 697.52 | . | . | . |
References
- Philip, J.R. Plant water relations: Some physical aspects. Ann. Rev. Plant Physiol. 1966, 17, 245–268. [Google Scholar] [CrossRef]
- Goldsmith, G.R. Changing directions: The atmosphere–plant–soil continuum. New Phytol. 2013, 199, 4–6. [Google Scholar] [CrossRef] [PubMed]
- Goldsmith, G.R.; Matzke, N.J.; Dawson, T.E. The incidence and implications of clouds for cloud forest plant water relations. Ecol. Lett. 2013, 16, 307–314. [Google Scholar] [CrossRef] [PubMed]
- Studer, M.S.; Siegwolf, R.T.W.; Leuenberger, M.; Abiven, S. Multi-isotope labelling of organic matter by diffusion of 2H/18O-H2O vapour and 13C-CO2 into the leaves and its distribution within the plant. Biogeosciences 2015, 12, 1865–1879. [Google Scholar] [CrossRef]
- Eller, C.B.; Lima, A.L.; Oliveira, R.S. Foliar uptake of fog water and transport belowground alleviates drought effects in the cloud forest tree species, Drimys brasiliensis (Winteraceae). New Phytol. 2013, 199, 151–162. [Google Scholar] [CrossRef] [PubMed]
- Smith, D.M.; Jackson, N.A.; Roberts, J.M.; Ong, C.K. Reverse flow of sap in tree roots and downward siphoning of water by Grevillea robusta. Funct. Ecol. 1999, 13, 256–264. [Google Scholar] [CrossRef]
- Sakuratani, T.; Aoe, T.; Higuchi, H. Reverse flow in roots of Sesbania rostrata measured using the constant power heat balance method. Plant Cell Environ. 1999, 22, 1153–1160. [Google Scholar] [CrossRef]
- Burgess, S.S.; Adams, M.A.; Turner, N.C.; White, D.A.; Ong, C.K. Tree roots: Conduits for deep recharge of soil water. Oecologia 2001, 126, 158–165. [Google Scholar] [CrossRef]
- Adonsou, K.E.; DesRochers, A.; Tremblay, F. Physiological integration of connected balsam poplar ramets. Tree Physiol. 2016, 36, 797–806. [Google Scholar] [CrossRef]
- Zhao, X.; Zhao, P.; Zhang, Z.; Zhu, L.; Niu, J.; Ni, G.; Hu, Y.; Ouyang, L. Sap flow-based transpiration in Phyllostachys pubescens: Applicability of the TDP methodology, age effect and rhizome role. Trees 2017, 31, 765–779. [Google Scholar]
- James, S.A.; Meinzer, F.C.; Goldstein, G.; Woodruff, D.; Jones, T.; Restom, T.; Mejia, M.; Clearwater, M.; Campanello, P. Axial and radial water transport and internal water storage in tropical forest canopy trees. Oecologia 2003, 134, 37–45. [Google Scholar] [CrossRef] [PubMed]
- Meinzer, F.C.; Brooks, J.R.; Domec, J.C.; Gartner, B.L.; Warren, J.M.; Woodruff, D.R.; Bible, K.; Shaw, D.C. Dynamics of water transport and storage in conifers studied with deuterium and heat tracing techniques. Plant Cell Environ. 2006, 29, 105–114. [Google Scholar] [CrossRef] [PubMed]
- Yang, S.; Zhang, Y.; Goldstein, G.; Sun, M.; Ma, R.; Cao, K. Determinants of water circulation in a woody bamboo species: Afternoon use and night-time recharge of culm water storage. Tree Physiol. 2015, 35, 964–974. [Google Scholar] [CrossRef] [PubMed]
- Hartung, W.; Sauter, A.; Hose, E. Abscisic acid in the xylem: Where does it come from, where does it go to? J. Exp. Bot. 2002, 53, 27–32. [Google Scholar] [CrossRef] [PubMed]
- Goldstein, G.; Andrade, J.L.; Meinzer, F.C.; Holbrook, N.M.; Cavelier, J.; Jackson, P.; Celis, A. Stem water storage and diurnal patterns of water use in tropical forest canopy trees. Plant Cell Environ. 1998, 21, 397–406. [Google Scholar] [CrossRef]
- Liese, W.; Köhl, M. Bamboo: The plant and its uses; Springer: Cham, Switzerland, 2015; ISBN 978-3-319-14133-6. [Google Scholar]
- Liese, W.; Weiner, G. Ageing of bamboo culms. A review. Wood Sci. Technol. 1996, 30, 77–89. [Google Scholar] [CrossRef]
- Kume, T.; Onozawa, Y.; Komatsu, H.; Tsuruta, K.; Shinohara, Y.; Umebayashi, T.; Otsuki, K. Stand-scale transpiration estimates in a Moso bamboo forest: I. Applicability of sap flux measurements. For. Ecol. Manage. 2010, 260, 1287–1294. [Google Scholar] [CrossRef]
- Dierick, D.; Hölscher, D.; Schwendenmann, L. Water use characteristics of a bamboo species (Bambusa blumeana) in the Philippines. Agric. For. Meteorol. 2010, 150, 1568–1578. [Google Scholar] [CrossRef]
- Ichihashi, R.; Komatsu, H.; Kume, T.; Onozawa, Y.; Shinohara, Y.; Tsuruta, K.; Otsuki, K. Stand-scale transpiration of two Moso bamboo stands with different culm densities. Ecohydrology 2015, 8, 450–459. [Google Scholar] [CrossRef]
- Mei, T.; Fang, D.; Röll, A.; Niu, F.; Hendrayanto; Hölscher, D. Water use patterns of four tropical bamboo species assessed with sap flux measurements. Front. Plant Sci. 2016, 6, 1202. [Google Scholar] [CrossRef]
- Schwendenmann, L.; Dierick, D.; Köhler, M.; Hölscher, D. Can deuterium tracing be used for reliably estimating water use of tropical trees and bamboo? Tree Physiol 2010, 30, 886–900. [Google Scholar] [CrossRef] [PubMed] [Green Version]
- Stapleton, C. Form and function in the bamboo rhizome. J. Amer. Bamboo Soc. 1998, 12, 21–29. [Google Scholar]
- Granier, A. Une nouvelle méthode pour la mesure du flux de sève brute dans le tronc des arbres. Ann. Sci. For. 1985, 42, 193–200. [Google Scholar] [CrossRef]
- Fang, D.; Mei, T.; Röll, A.; Hölscher, D. Water transfer between bamboo culms in the period of sprouting. Front. Plant Sci. 2019, 10, 786. [Google Scholar] [CrossRef] [PubMed]
- Gaines, K.P.; Meinzer, F.C.; Duffy, C.J.; Thomas, E.M.; Eissenstat, D.M. Rapid tree water transport and residence times in a Pennsylvania catchment. Ecohydrology 2016, 9, 1554–1565. [Google Scholar] [CrossRef]
- Calder, I.R. Implications and assumptions in using the ‘total counts’ and convection-dispersion equations for tracer flow measurements -With particular reference to transpiration measurements in trees. J. Hydrol. 1991, 125, 149–158. [Google Scholar] [CrossRef]
- Dye, P.J.; Olbrich, B.W.; Calder, I.R. A Comparison of the heat pulse method and deuterium tracing method for measuring transpiration from Eucalyptus grandis trees. J. Exp. Bot. 1992, 43, 337–343. [Google Scholar] [CrossRef]
- Van Den Besselaar, E.J.; Klein Tank, A.M.; Van Der Schrier, G.; Abass, M.S.; Baddour, O.; Van Engelen, A.F.; Freire, A.; Hechler, P.; Laksono, B.I.; Jilderda, R.; et al. International climate assessment & dataset: Climate services across borders. Bull. Am. Meteor. Soc. 2014, 96, 16–21. [Google Scholar]
- Cao, K.; Yang, S.; Zhang, Y.; Brodribb, T.J. The maximum height of grasses is determined by roots. Ecol. Lett. 2012, 15, 666–672. [Google Scholar] [CrossRef]
- Hardanto, A.; Röll, A.; Hendrayanto; Hölscher, D. Tree soil water uptake and transpiration in mono-cultural and jungle rubber stands of Sumatra. For. Ecol. Manag. 2017, 397, 67–77. [Google Scholar] [CrossRef]
- Coplen, T.B. Reporting of stable hydrogen, carbon, and oxygen isotopic abundances. Geothermics 1995, 24, 707–712. [Google Scholar] [CrossRef]
- Calder, I.R.; Kariyappa, G.S.; Srinivasalu, N.V.; Srinivasa Murty, K.V. Deuterium tracing for the estimation of transpiration from trees Part 1. Field calibration. J. Hydrol. 1992, 130, 17–25. [Google Scholar] [CrossRef]
- Parnell, A.C.; Inger, R.; Bearhop, S.; Jackson, A.L. Source partitioning using stable isotopes: coping with too much variation. PLoS ONE 2010, 5, 1–5. [Google Scholar] [CrossRef] [PubMed]
- Rúgolo de Agrasar, Z.; Rodríguez, M.F. Culm anatomy of native woody bamboos in Argentina and neighboring areas: Cross section. J. Am. Bamboo Soc. 2003, 17, 28–43. [Google Scholar]
- Calder, I.R.; Narayanswamy, M.N.; Srinivasalu, N.V.; Darling, W.G.; Lardner, A.J. Investigation into the use of deuterium as a tracer for measuring transpiration from eucalypts. J. Hydrol. 1986, 84, 345–351. [Google Scholar] [CrossRef]
- Tatarinov, F.A.; Kučera, J.; Cienciala, E. The analysis of physical background of tree sap flow measurement based on thermal methods. Meas. Sci. Technol. 2005, 16, 1157. [Google Scholar] [CrossRef]
- Vandegehuchte, M.W.; Steppe, K. Improving sap flux density measurements by correctly determining thermal diffusivity, differentiating between bound and unbound water. Tree Physiol 2012, 32, 930–942. [Google Scholar] [CrossRef] [Green Version]
- Waring, R.H.; Running, S.W. Sapwood water storage: Its contribution to transpiration and effect upon water conductance through the stems of old-growth Douglas-fir. Plant Cell Environ. 1978, 1, 131–140. [Google Scholar] [CrossRef]
- Holbrook, N.M.; Sinclair, T.R. Water balance in the arborescent palm, Sabal palmetto. II. Transpiration and stem water storage. Plant Cell Environ. 1992, 15, 401–409. [Google Scholar] [CrossRef]
- Scholz, F.C.; Bucci, S.J.; Goldstein, G.; Meinzer, F.C.; Franco, A.C.; Miralles-Wilhelm, F. Temporal dynamics of stem expansion and contraction in savanna trees: Withdrawal and recharge of stored water. Tree Physiol. 2008, 28, 469–480. [Google Scholar] [CrossRef]
- Carrasco, L.O.; Bucci, S.J.; Francescantonio, D.D.; Lezcano, O.A.; Campanello, P.I.; Scholz, F.G.; Rodríguez, S.; Madanes, N.; Cristiano, P.M.; Hao, G.-Y.; et al. Water storage dynamics in the main stem of subtropical tree species differing in wood density, growth rate and life history traits. Tree Physiol. 2014, 35, 354–365. [Google Scholar] [CrossRef] [PubMed] [Green Version]
- Gleason, S.M.; Westoby, M.; Jansen, S.; Choat, B.; Hacke, U.G.; Pratt, R.B.; Bhaskar, R.; Brodribb, T.J.; Bucci, S.J.; Cao, K.-F.; et al. Weak tradeoff between xylem safety and xylem-specific hydraulic efficiency across the world’s woody plant species. New Phytol. 2016, 209, 123–136. [Google Scholar] [CrossRef] [PubMed]
- Kalma, S.J.; Thorburn, P.J.; Dunn, G.M. A comparison of heat pulse and deuterium tracing techniques for estimating sap flow in Eucalyptus grandis trees. Tree Physiol. 1998, 18, 697–705. [Google Scholar] [CrossRef] [PubMed]
- Kline, J.R.; Martin, J.R.; Jordan, C.F.; Koranda, J.J. Measurement of transpiration in tropical trees with tritiated water. Ecology 1970, 51, 1068–1073. [Google Scholar] [CrossRef]
- Roden, J.S.; Ehleringer, J.R. Observations of hydrogen and oxygen isotopes in leaf water confirm the craig-gordon model under wide-ranging environmental conditions. Plant Physiol. 1999, 120, 1165–1174. [Google Scholar] [CrossRef] [PubMed]
- Münch, E. Versuche über den Saftkreislauf. Ber. Dtsch. Bot. Ges. 1927, 45, 340–356. [Google Scholar]
- Choi, I.C.; Aronoff, S. Photosynthate transport using tritiated water. Plant Physiol. 1966, 41, 1119–1129. [Google Scholar] [CrossRef]
- Pfautsch, S.; Hölttä, T.; Mencuccini, M. Hydraulic functioning of tree stems-fusing ray anatomy, radial transfer and capacitance. Tree Physiol. 2015, 35, 706–722. [Google Scholar] [CrossRef]
- Pfautsch, S.; Renard, J.; Tjoelker, M.G.; Salih, A. Phloem as capacitor: Radial transfer of water into xylem of tree stems occurs via symplastic transport in ray parenchyma. Plant Physiol. 2015, 167, 963–971. [Google Scholar] [CrossRef]
- Grosser, D.; Liese, W. On the anatomy of Asian bamboos, with special reference to their vascular bundles. Wood Sci. Technol. 1971, 5, 290–312. [Google Scholar] [CrossRef]
- Marc, V.; Robinson, M. Application of the deuterium tracing method for the estimation of tree sap flow and stand transpiration of a beech forest (Fagus silvatica L.) in a mountainous Mediterranean region. J. Hydrol. 2004, 285, 248–259. [Google Scholar] [CrossRef]
- Münch, E. Die Stoffbewegunen in der Pflanze; Verlag von Gustav Fischer: Jena, Germany, 1930. [Google Scholar]
- Fraser, E.C.; Lieffers, V.J.; Landhäusser, S.M. Carbohydrate transfer through root grafts to support shaded trees. Tree Physiol. 2006, 26, 1019–1023. [Google Scholar] [CrossRef] [PubMed] [Green Version]
- Baret, M.; DesRochers, A. Root connections can trigger physiological responses to defoliation in nondefoliated aspen suckers. Botany 2011, 89, 753–761. [Google Scholar] [CrossRef]


| Species | Length (m) | DBH (cm) | Culm Wall Thickness (cm) | WUTDP (kg day−1) | Culm Water Storage/Daily Water Use (CWS, %) |
|---|---|---|---|---|---|
| B. vulgaris | 17.9 (0.4) | 7.0 (0.2) | 1.3 (0.1) | 8.1 (1.8) | 15.2 (3.4) |
| G. apus | 16.2 (1.3) | 7.9 (0.6) | 1.2 (0.1) | 7.0 (0.8) | 9.1 (1.7) |
| D. asper | 21.1 (0.5) | 10.7 (0.5) | 2.4 (0.1) | 8.0 (1.2) | 8.8 (0.6) |
| Species | D2O Injected (g) | Tarrival (days) | Tmax (days) | Tresidence (days) | WUD2O (kg day−1) | VD2O (m day−1) |
|---|---|---|---|---|---|---|
| B. vulgaris | 5.8 (0.8) | 1.5 (0.5) | 2.5 (0.5) | 5.5 (0.6) | 11.3 (2.8) | 12.5 (2.4) |
| G. apus | 5.7 (0.1) | 1.0 (0.0) | 1.3 (0.3) | 6.3 (0.3) | 13.2 (1.6) | 13.3 (0.3) |
| D. asper | 8.0 (0.7) | 1.0 (0.0) | 1.7 (0.7) | 5.0 (1.0) | 16.0 (3.6) | 16.1 (2.2) |
| Species | Rhizome | Culm | Branch | Leaf | |||
|---|---|---|---|---|---|---|---|
| 0 m | 2 m | 6 m | 10 m | ||||
| B. vulgaris | −32.9 (2.8)a | −40.9 (0.9)b | −42.8 (0.8)b | −43.3 (1.0)b | −43.7 (2.3)b | −41.7 (1.4)b | −33.8 (0.7)a |
| G. apus | −38.5 (0.6)a | −42.4 (1.8)a | −44.3 (1.7)a | −43.1 (1.3)a | −41.7 (1.8)a | −38.4 (1.7)a | −30.2 (0.6)b |
| D. asper | −44.9 (1.3)a | −32.5 (14.5)a | −38.0 (6.4)a | −40.9 (2.9)a | −42.4 (1.9)a | −39.0 (6.7)a | −52.3 (9.3)a |
© 2019 by the authors. Licensee MDPI, Basel, Switzerland. This article is an open access article distributed under the terms and conditions of the Creative Commons Attribution (CC BY) license (http://creativecommons.org/licenses/by/4.0/).
Share and Cite
Mei, T.; Fang, D.; Röll, A.; Hölscher, D. Bamboo Water Transport Assessed with Deuterium Tracing. Forests 2019, 10, 623. https://doi.org/10.3390/f10080623
Mei T, Fang D, Röll A, Hölscher D. Bamboo Water Transport Assessed with Deuterium Tracing. Forests. 2019; 10(8):623. https://doi.org/10.3390/f10080623
Chicago/Turabian StyleMei, Tingting, Dongming Fang, Alexander Röll, and Dirk Hölscher. 2019. "Bamboo Water Transport Assessed with Deuterium Tracing" Forests 10, no. 8: 623. https://doi.org/10.3390/f10080623
APA StyleMei, T., Fang, D., Röll, A., & Hölscher, D. (2019). Bamboo Water Transport Assessed with Deuterium Tracing. Forests, 10(8), 623. https://doi.org/10.3390/f10080623