Article

Regeneration in the Understory of Declining Overstory Trees Contributes to Soil Respiration Homeostasis along Succession in a Sub-Mediterranean Beech Forest

by
Jesús Rodríguez-Calcerrada
1,*,
Roberto Salomón
2,
Josep Barba
3,
Guillermo G. Gordaliza
1,
Jorge Curiel Yuste
4,5,
Carlos Magro
1 and
Luis Gil
1
1
Forest History, Physiology and Genetics Research Group, School of Forestry Engineering, “Universidad Politécnica de Madrid”, 28040 Madrid, Spain
2
Laboratory of Plant Ecology, Department of Applied Ecology and Environmental Biology, Faculty of Bioscience Engineering, Ghent University, Coupure links 653, B-9000 Ghent, Belgium
3
Plant and Soil Sciences Department, University of Delaware, Newark, DE 19711, USA
4
BC3-Basque Centre for Climate Change, Scientific Campus of the University of the Basque Country, 48940 Leioa, Spain
5
IKERBASQUE-Basque Foundation for Science, María Díaz de Haro 3, 6 solairua, 48013 Bilbao, Spain
*
Author to whom correspondence should be addressed.
Forests 2019, 10(9), 727; https://doi.org/10.3390/f10090727
Submission received: 12 July 2019 / Revised: 21 August 2019 / Accepted: 22 August 2019 / Published: 24 August 2019
(This article belongs to the Special Issue Dieback on Drought-Prone Forest Ecosystems)

Abstract

:
Research Highlights: Tree decline can alter soil carbon cycling, given the close relationship between primary production and the activity of roots and soil microbes. Background and Objectives: We studied how tree decline associated to old age and accelerated by land-use change and increased drought in the last decades, affects soil properties and soil respiration (Rs). Materials and Methods: We measured Rs over two years around centennial European beech (Fagus sylvatica L.) trees representing a gradient of decline in a sub-Mediterranean forest stand, where the number of centennial beech trees has decreased by 54% in the last century. Four replicate plots were established around trees (i) with no apparent crown dieback, (ii) less than 40% crown dieback, (iii) more than 50% crown dieback, and (iv) dead. Results: Temporal variations in Rs were controlled by soil temperature (Ts) and soil water content (SWC). The increase in Rs with Ts depended on SWC. The temperature-normalized Rs exhibited a parabolic relationship with SWC, suggesting a reduced root and microbial respiration associated to drought and waterlogging. The response of Rs to SWC did not vary among tree-decline classes. However, the sensitivity of Rs to Ts was higher around vigorous trees than around those with early symptoms of decline. Spatial variations in Rs were governed by soil carbon to nitrogen ratio, which had a negative effect on Rs, and SWC during summer, when drier plots had lower Rs than wetter plots. These variations were independent of the tree vigor. The basal area of recruits, which was three times (although non-significantly) higher under declining and dead trees than under vigorous trees, had a positive effect on Rs. However, the mean Rs did not change among tree-decline classes. These results indicate that Rs and related soil physico-chemical variables are resilient to the decline and death of dominant centennial trees. Conclusions: The development of advanced regeneration as overstory beech trees decline and die contribute to the Rs homeostasis along forest succession.

1. Introduction

Soil respiration (Rs) has been measured in most terrestrial biomes, from deserts, grasslands and shrublands, to forests in temperate, boreal, tropical and Mediterranean regions [1]. From forest studies where carbon (C) fluxes have been partitioned among their components, it has been shown that Rs typically accounts for more than half of the total annual ecosystem respiration [2,3,4]. Tree ageing and forest succession involve changes in the overstory and, in turn, in water, nutrient and C fluxes between the atmosphere and the rhizosphere that can translate into different rates of Rs [5,6]. Global change-related episodes of forest decline and die off are accelerating forest succession worldwide, particularly in forests weakened by tree ageing, overcrowding and sub-optimal climate conditions where ancient land uses have changed [7]. To date, however, relatively little is known on how forest succession [8,9] and decline affect Rs [10]. In general, the impact of forest decline on Rs is likely to vary among ecosystems depending on how sensitive the roots of dominant species are to defoliation, and how fast microbes are in the decomposing litter and other plant species in colonizing the canopy gaps opened by defoliation and tree death. However, complex plant-soil-climate interactions mediate tree mortality impacts on Rs [10]. For example, Ávila et al. [11] found that the effect of tree decline on soil variables differed in woodlands and closed forests, varied between seasons, and was higher as declining trees were larger.
The net impact of forest decline on Rs is not straightforward, due to direct and indirect effects of the decline on soil C and nutrient inputs and icroclimate. Soil areas close to vigorous trees with a high foliage volume might exhibit higher Rs than those close to declining trees with smaller crowns due to higher supply rates of respiratory substrates to roots and their mycorrhizal symbionts [12,13]. Moreover, the microbial respiration could increase around vigorous trees as a result of higher root exudation rates and leaf and fine root litter supply to the soil [14]. In support of this reasoning it has been observed that variables related with photosynthetic C uptake, such as the leaf area index, sap flow, tree size, or tree proximity to and live tree basal area around Rs sampling locations are positively related to Rs [11,15,16,17,18,19,20]. Nevertheless, Rs can be relatively homeostatic across successional stages or after perturbations [8,21,22,23]. A progressive decline in the vigor (and crown and root volume) of mature trees may prompt space colonization by woody recruits and herbaceous species, so that the Rs remains similar across successional stages. Further, because Rs results to a large extent from the activity of decomposing microorganisms–contributing 40 to almost 100% of the total Rs at some periods of the year [6,21,24]–it can also be envisaged that Rs is higher close to declining than vigorous trees due to higher litter input and soil metabolic activity [19]. In fact, the plant litter quality and amount affect the soil microclimate and microbial community composition and activity [25,26].
Reducing the leaf area associated to the tree decline may affect Rs via increasing the soil temperature due to enhanced penetration of solar radiation through the canopy. Temperature is one of the main drivers of temporal and spatial variations in Rs, e.g., [27]. Given the positive effect of temperature on enzymatic reactions of all living organisms, Rs can increase in warmer soils of declining stands under non-limiting soil C and nitrogen (N) conditions. Similarly, the soil water content (SWC) has a profound effect on the metabolic activity of roots, associated microorganisms (e.g., mycorrhiza) and soil microbial decomposers [28,29], which is reflected in the positive correlations between Rs and SWC, over time [30,31,32] and space [31,33,34] at multiple scales. The limiting effect of low SWC on Rs is observed in many studies in seasonally dry ecosystems where, below a threshold of SWC, Rs exhibits a weak sensitivity to temperature. For example, in Mediterranean-type ecosystems where the dry period occurs at the warmer time of the year, low SWC results in the saturation of the response of Rs to temperature [35]. On the contrary, a high SWC can restrict CO2 diffusion from soils, and also make soil oxygen concentrations to drop to limiting thresholds for Rs [36,37]. The effects of vegetation die-off on soil water availability are not easy to predict. Tree dieback might result in lower water consumption, but also in higher soil water evaporation due to canopy defoliation [38,39,40].
Studying the interactions between environmental conditions and forest decline on Rs helps to understand and predict the C balance of forest ecosystems. We measured Rs in a marginal beech (Fagus sylvatica L.) forest stand in south Europe during two consecutive years. This population is suffering an accelerated loss of centennial trees. Among the probable causes are (i) the 21% reduction in annual rainfall occurred in the last decade relative to the previous one; (ii) the ancient practice of pollarding, which has favored the development of large horizontal branches, prone to fall from mechanical instability, and being infected from open wounds; and (iii) competition with recruits, mainly for water. One objective of this work was to compare Rs among sites of different degrees of decline, from mature climax stages where vigorous centennial trees dominate, to stages of increasing tree decline and understory colonization with recruits (Figure 1). We hypothesized that tree decline would result in a reduction in Rs that would be partly related to a change in the soil physico-chemical properties and a reduction in the fine root density. As a second objective, we explored the influence of soil temperature and water availability on Rs seasonality in two years of contrasted climate conditions, and whether soil temperature, SWC or their influence on Rs changed across the tree decline stages. We expected that Rs was driven by temperature across periods of high SWC, and by SWC below a certain threshold of SWC.

2. Materials and Methods

2.1. Area and Design of the Study

The study was conducted in a 1-ha beech stand located within a 120-ha mixed forest in central Spain (3°30′ W, 41°07′ N; at 1240–1550 m a.s.l.). Trees of beech and oak (Quercus petraea and Quercus pyrenaica) formed an open overstory during most of the 19th and 20th centuries when the forest was managed as an open woodland used for sheep and cattle grazing, resting and breeding [41]. In the 1960s, domestic livestock was banned, and the understory was rapidly colonized by the progeny of overstory trees and other woody species from surrounding forests (hereafter recruits). The climate of the area is sub-Mediterranean, with a mean annual temperature of 9.7 °C and a mean annual rainfall of 873 mm (data from 1994 to 2017, recorded in a meteorological station within the forest). Both variables exhibit a strong seasonality: Minimum and maximum temperatures are reached in January and July, respectively, and a dry period (i.e., 131 mm rainfall on average) typically extends from June through September. Soils are formed from mica schists and mica gneiss substrates.
In 2015, sixteen circular plots of 10 m radius were established around centennial beech trees with different degrees of vigor, or dead approximately 15–25 years ago (Figure 1; Table 1). The slope ranged from 15% to 22%, and the orientation from 40° N to 87° N across the study area. Four plots were selected for each of the four tree-decline classes: Healthy trees with no symptoms of decay (vigorous; V), trees with less than 40% of the crown dead (affected; A1), trees with severe symptoms of decay and most of the crown dead (severely affected; A2), and finally snags, i.e., dead trees with part of the main trunk still standing up (dead; D). The stem density and basal area were computed within the plots, including all stems taller than 1.5 m. Given the high contribution of the central tree to the basal area, the data were also given for the recruits only. Beech and occasionally holly (Ilex aquifolium) were the main recruits in the understory, while shrubs (mostly Genista florida) and herbaceous species (mostly Melica uniflora) were rare. Table 1 summarizes the structural and edaphic properties of the plots.

2.2. Soil Respiration

On each plot, four 19-cm diameter polyvinyl chloride (PVC) collars were inserted 2 cm deep into the soil and fixed with brackets and nails. Soil respiration (Rs) was measured in situ with a close-path infrared gas analyzer (LI-6400, Li-Cor, Inc., Lincoln, NE, USA) coupled to a closed dynamic soil chamber (LI-6400-09). The collars were larger than those supplied by the manufacturer to sample a larger soil surface area (284 cm2). A custom-made PVC lid with a central hole slightly larger than the soil chamber was fit to the collar, and the soil chamber was inserted in the hole with a foam gasket to ensure an appropriate seal. The four collars were placed forming a square of 5–8 m side around the centennial beech tree/snag, avoiding fallen branches and rare rock outcrops. If at the time of measuring there was evidence that the collar had been moved by animals, the location was not measured, and the collar was re-installed for subsequent dates. Despite the tree rhizosphere is laterally expansive and belowground delimitation of individual trees is challenging, previous studies in denser forests than the one surveyed here have shown that single trees are determinant of the surrounding Rs [19,21] and soil microbial communities [42].
Fourteen measurement campaigns were conducted between May 2015 and November 2016, at 1–3 months intervals. On each campaign, all measurements were conducted in one day, typically from 10:00 am to 17:00 pm, alternating V, A1, A2, and D plots to avoid differences in soil temperature among tree-decline classes due to the sampling time. Three measurement cycles were recorded per collar and campaign. The topsoil temperature (Ts) was measured at the same time than Rs with a 6000-09TC temperature probe 5–10 cm away from the collar.

2.3. Soil Physico-Chemical Properties and Root Density

A soil pit excavated in one location of the study area revealed a 46 cm deep A horizon (29.3% coarse sand, 51.4% fine sand, 7.3% silt, 12% clay), a 61 cm deep B horizon (53.5% coarse sand, 27.8% fine sand, 8.3% silt, 10.4% clay) and an 18 cm deep C horizon (33.5% coarse sand, 38.5% fine sand, 12.8% silt, 15.2% clay).
Moreover, on each plot and campaign, the volumetric soil water content (SWC) was measured in the top 20 cm with a quasi-time-domain-reflectometry system (TDR; TRIME-FM, IMKO Micromodultechnik GmbH, Germany) coupled to a TRIME-T3 tube probe. The frequency of measurements was the same than for Rs. To account for soil physical properties specific of the forest, TDR measurements were calibrated with independent gravimetric SWC measurements, transformed to volumetric SWC values using the soil bulk density (r2 = 0.97, p < 0.001, n = 13).
In November 2015, one sample from the 0–10 cm topsoil per plot was taken for analyses of organic matter (OM) and total C and N content using the Dumas method [43] with an elemental analyzer (Elementar N/CN; VarioMax, Hanau, Germany). Two 10 cm deep soil samples per plot were also taken with a corer and used to measure the bulk density, as the ratio of soil sample mass dried at 105 °C to the core volume. Litter depth was measured with a ruler in four locations per plot, near the soil collars.
At the end of the study, two cores of 19 cm in diameter and 10 cm depth were taken per plot to collect small roots. In the laboratory, roots were separated from successive small volumes of soil with the help of a 2-mm sieve, first, and a 200 μm sieve afterwards, using water to carefully disaggregate numerous soil aggregates holding fine roots. Soil-free roots were oven-dried at 70 °C and weighted separately according to their diameter: <2 mm (fine) or 2–5 mm (small). We are confident that roots belonged to beech, given the low abundance of herbaceous and shrub species in the study plots (Figure 1; Table 1) and the same morphology of roots across soil samples.

2.4. Data Analyses

For each single date, cycles higher than 1.5 times the 25th to 75th interquartile range were considered outliers and thus removed from the data set. These outliers accounted for 6.1% of the total data set. Thereafter, we calculated the mean Rs per collar, and the mean Rs per plot after averaging the four (occasionally 2–3) collars per plot on each of the 14 field campaigns.
Mixed-effects models were used to analyze the temporal relationship between the plot-based mean Rs and tree-decline classes (i.e., V, A1, A2, and D), seasons, Ts and SWC. We evaluated all possible models combining the tree-decline classes, season, Ts, SWC and their first order interactions (saturated model) in order to achieve the minimum adequate model according to the corrected Akaike information criterion (AICc). Once we had the minimum adequate models, we calculated the adjusted r2. Before running the model selection, we tested the variance inflation factor (VIF) in the saturated model to assess collinearity between Ts and SWC; VIF was lower than two, indicating low collinearity [44]. Since the magnitude of the mixed effects models is dependent on the units of each variable, we scaled and centered all variables to improve the performance and interpretability of the output models [45]. A plot identity and correlation structure was included in the random part of the model to control for the temporal autocorrelation between measurements.
The spatial variation in Rs across the 16 plots was studied for the mean Rs measured over the two-year study period, the mean Rs measured on each season, and standardized Rs at constant Ts, or constant Ts and SWC (i.e., at the mean annual or seasonal annual Ts and SWC values). The standardization allowed to account for small differences in Ts and SWC among plots (Figure 2) when studying the influence of OM, C, N, C/N, soil density, and fine and small root density on spatial variations in Rs. To do so, we first model Rs as a linear function of Ts over dates with SWC not limiting to Rs (i.e., >15%; Figure 3a). The 15% SWC threshold was determined as the SWC value below which Rs was best explained by SWC (r2 = 0.44, p < 0.001, n = 73). Second, the residuals between the observed and modeled values of Rs from Ts across the entire range of SWC were modeled as a quadratic function of SWC (Figure 4b). Finally, the standardized Rs was derived from the following equation using the observed Ts and SWC:
R s = ( a + b   T soil ) + ( c + d   SWC + e   ( SWC ) 2 )
where a through e were coefficients specific to each tree-decline class (see Table 2).
Differences in all soil physico-chemical variables among the tree-decline classes were tested with general linear models, using a repeated measures analysis for Ts and SWC. Post-hoc Tukey’s HSD tests were conducted to separate the mean values among the tree classes and measurement dates when these factors were significant at p < 0.05. Analyses were performed with Statistica (StatSoft, Tulsa, OK, USA), and R using the packages SMATR [46], nlme [47] and MuMIn [48].

3. Results

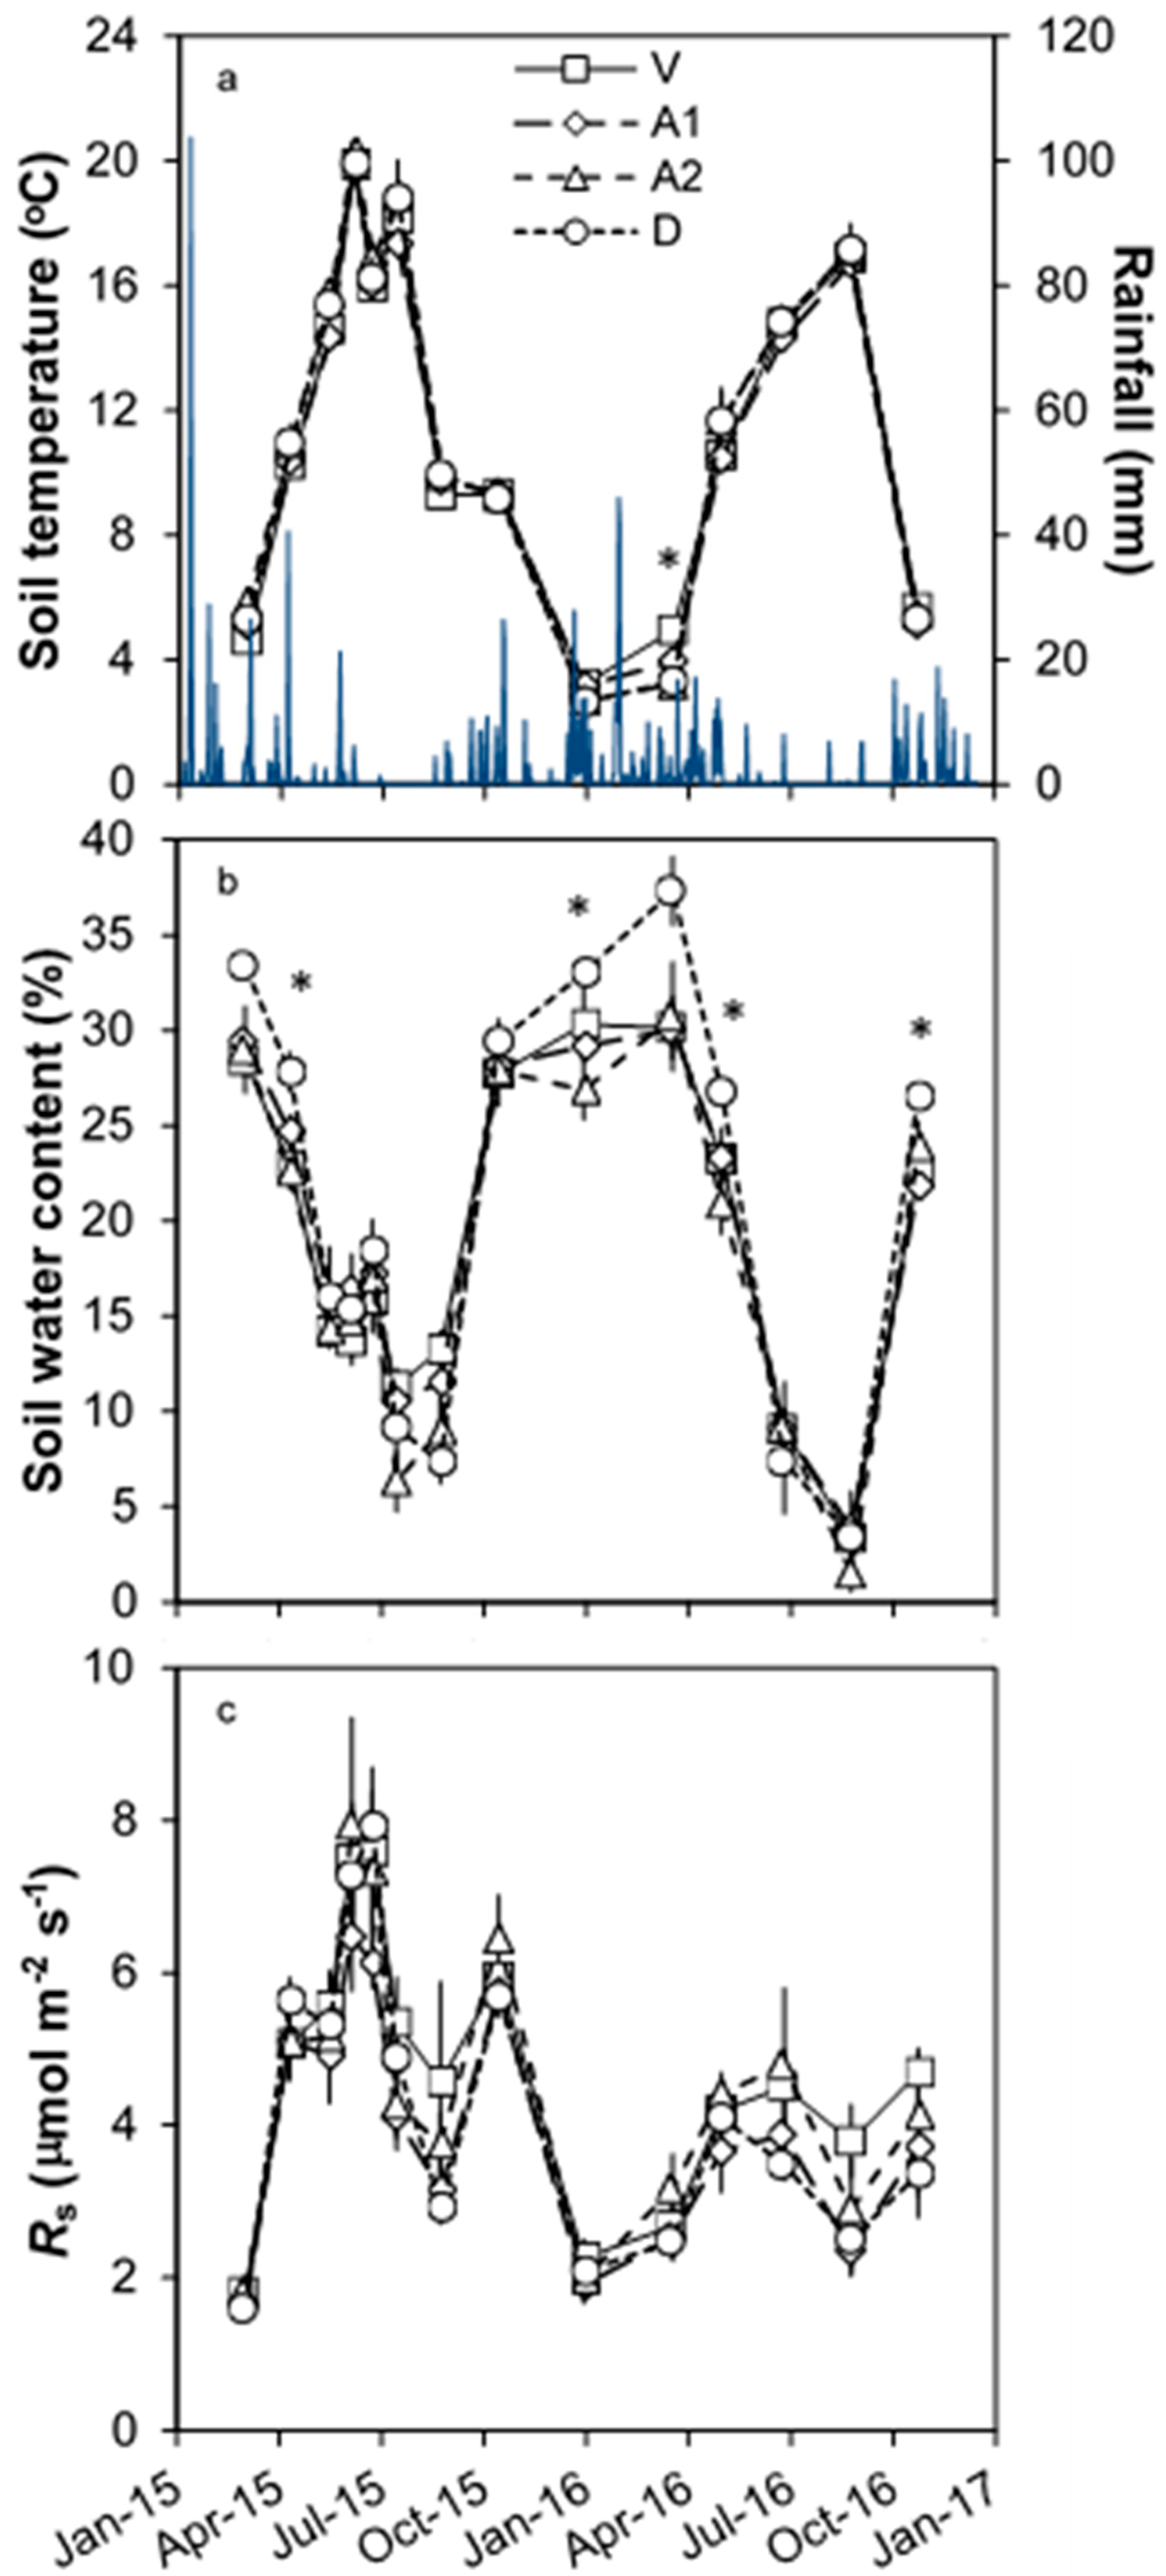
3.1. Environmental Conditions

The two years of study were climatically anomalous: Compared to the 25-year averages of the study site, the spring through summer period of 2015 was 1.4 °C warmer, while the summer rainfall in 2016 was 67% lower. The temperature and rainfall followed the typical seasonal pattern of Mediterranean climates, with warmer temperatures being registered during the drier period in the summer (Figure 2a). This resulted in an inverse relationship between Ts and SWC (r2 = 0.59, p < 0.001, n = 214; Figure 2a,b).
Neither Ts nor SWC, nor their temporal variations were significantly different among the tree-decline classes. Still, in some dates of spring and autumn, SWC was consistently higher near the dead trees (Figure 2b).

3.2. Temporal Changes in Rs

The mean values of Rs varied by 4-fold over the course of the experiment (Figure 2c), and significantly among seasons (Table 2). The lowest values were registered in winter/early spring and the highest in early summer, when Ts was high and storms prevented SWC to drop (Figure 2). This reflects the interaction effect of Ts and SWC on Rs: At a low SWC, the effect of Ts on Rs was lower than at a high SWC (Table 2). The lower sensitivity of Rs to Ts during the summer drought resulted in an asymptotic relationship between Rs and Ts (Figure 3a). Similarly, a lower Ts during periods of high SWC (from fall though spring), resulted in a parabolic relationship between SWC and Rs across the entire range of SWC observed (Figure 3b). Exploring the relationship between both variables at increasing SWC intervals revealed that a positive significant relationship existed between SWC and Rs below 15% SWC (Figure 4a), i.e., mostly during the summer (Table 2). This explains that the sensitivity of Rs to SWC was highest in the summer (when a low SWC was limiting Rs), and the sensitivity of Rs to Ts was highest in fall (when a high SWC did not limit Rs; Table 2). The only significant effect of the factor “tree decline” was an interaction with Ts, which indicated that Rs increased with increasing Ts faster near vigorous trees than near trees with early symptoms of decline (Table 2, Figure 3). The best regression model explaining the relationship between Ts and Rs excluding values with SWC <15% was a linear model (Figure 3b), which contrasts with the logarithmic relationship between both variables when all data were included (Figure 3a). The residuals of the Rs vs Ts linear regression model were related with SWC, with larger deviations of observed values from the predicted Rs values occurring at a low SWC (Figure 4b). The Rs standardized at the mean annual Ts (11) continued to be non-linearly related with SWC (Figure 4c).
Modeled Rs as a function of both Ts and SWC exhibited a good agreement with observed Rs values (Figure 5). However, the slope and intercept of the linear relationship between both variables differed significantly from one and zero, respectively.

3.3. Spatial Changes in Soil Physico-Chemical Variables and Rs

Spatial patterns of most variables analyzed were not related to the degree of beech decline. Compared to large changes in the percentage of crown dieback of each plot’s central tree, changes in Ts and SWC (Figure 2a,b), soil physico-chemical variables, fine root density, and Rs were insignificant among tree-decline classes, irrespective of the season, or whether Rs was standardized at a given Ts and SWC or not (Table 1 and Table 2).
Nonetheless, spatial variations in Rs were considerable and partly explained by soil physico-chemical variables, mostly C/N and SWC during summer. Litter depth, which was not significantly related to aboveground canopy features (e.g., basal area or stem density), was related with soil ground area covered by herbaceous species (r = −0.54; p = 0.032), soil density (r = 0.52; p = 0.039) and summer SWC (Figure 6a) across the 16 studied plots. SWC controlled spatial variability in Rs during summer, when wetter plots had higher standardized Rs at 17 oC (the average Ts during summer) than drier ones (Figure 6b). On the other hand, wetter plots during summer had higher soil N concentrations and lower C/N than drier plots (Figure 6c), whereas, in turn, C/N was marginally significantly related to the mean annual Rs standardized at the mean annual Ts and SWC (i.e., taking differences in Ts and SWC among plots into account; Figure 6d). Soil total C and N were positively correlated (r = 0.92; p < 0.001).
Of the vegetation-related features examined, only the basal area of recruits was negatively related to the soil C/N (r = −0.51; p = 0.046), which is consistent with the trend of Rs (standardized at the mean annual Ts and SWC) to increase in plots with a higher basal area of recruits (r = 0.48; p = 0.06).

4. Discussion

4.1. Does Rs Change with Tree Decline in a Mature Beech Forest?

The spatial variation of Rs was controlled by the soil C/N, basal area of recruits and, during summer, by SWC. However, the spatial variation in Rs was independent of the overstory tree decline. Previous studies have reported a homeostatic response of Rs to successional changes in forest structure involving either unchanged forest species composition [8] or species replacement [21]. Here, a minor influence of tree decline on Rs is consistent with non-significant changes in soil properties across tree-decline classes (Table 1). Large differences in the living crown volume among beech trees contrasted with non-significant changes in the soil density, litter depth, C, N, C/N or fine root density across tree-decline classes. Only SWC tended to be higher near snags from autumn to spring (Figure 2b), but this did not translate into higher Rs than in the other tree-decline classes because, at this time period, SWC did not control Rs (Figure 4a). The impact of the tree dieback on above- and below-ground processes depends on the speed at which different processes are co-occurring. The progressive degradation of ancient beech trees in the studied forest might have been lately enhanced by (i) competition from their own recruits, starting to fill the open woodland in 1960s when grazing by domestic livestock ceased, and (ii) drought, exacerbated by a 21% reduction in the summer rainfall in this decade relative to the previous one. Still, several decades can elapse between the incipient to large decline and eventually death of centennial beech trees in the studied forest. During this time, regeneration under declining dominant beech trees is evidenced by the increasing understory population and size of beech seedlings (and more rarely holly recruits) that benefit from the increase in available resources (i.e., irradiance, soil water and nutrients) resulting from the progressive decline of overstory trees [10,21]. Reductions in the leaf biomass, root biomass, nutrients uptake and litter fall from these trees are compensated for by the development of understory trees, as discussed by others [10,21,49]. In support of this, there was a 3-fold increment in the density and basal area of recruits under declining trees than under vigorous ones, although not significant at p < 0.05 (Figure 1; Table 1), and Rs tended to increase as the basal area of recruits was higher. Consistently with these results, Søe and Buchmann [16] found that the stand structure was not related to the vegetation area index in another unmanaged, uneven-aged beech stand; Barba et al. [19] measured a similar root biomass in areas nearing dead and live trees; and Pereira-Blanco et al. [50] measured similar respiration rates in fine roots near dead and living trees. The progressive decline of dominant trees favors a gradual filling of the gaps left by the branch dieback that buffer its impact on the soil microclimate, root biomass and rate of decomposition processes [51]. Moreover, the late-successional character of beech allows trees of this species to establish in the understory for decades “waiting” for the canopy to open, and precludes that other species replace it, which contributes to moderate changes in the soil climate, chemistry and Rs compared to successional changes involving species replacement [19]. Future research should address how the impact of the sudden tree death on soil processes compares with a progressive process of decline.
Other studies have discussed that minor changes in Rs associated to stress- or perturbation-induced forest decline can be related to a balancing contribution of autotrophic and heterotrophic respiration to total Rs [10,52]. A reduced activity of roots and mycorrhiza associated to a reduced phloem carbohydrate transport below the ground near declining trees observed in some cases [12,20], (but see [50]) can be counteracted by an increased activity of decomposing microorganisms associated to an increased litterfall [8,53]. Unfortunately, using the trenching method in a parallel experiment did not allow us to separate the autotrophic and heterotrophic components of Rs. The higher Rs temperature sensitivity near vigorous trees than near trees with incipient symptoms of decline (Table 2) could reflect a higher contribution of autotrophic respiration to Rs near vigorous trees, given the higher temperature sensitivity of the autotrophic than heterotrophic respiration [10,24,54]. However, it could also reflect a higher seasonality in plant and soil activity, co-varying with Ts, near vigorous trees [55,56]. The fact that Rs temperature sensitivity did not gradually vary with the degree of tree decline suggests that it was not simply related to the health status of the dominant trees [56].
Independently of the degree of dominant tree decline, there were considerable variations in the mean Rs across plots (3.25–6.35 μmol m−2 s−1), that were partly controlled by the microclimate, basal area of beech recruits under the dominant tree, and soil C/N. As already observed, the spatial variability of Rs across plots was controlled by the spatial variability in SWC rather than Ts [16,57]. During summer, Rs was higher in wetter plots (Figure 6b), likely due to low-SWC limitations on the respiratory metabolism of roots and soil microorganisms [28,29,58]; whereas spatial variations in Ts were probably too small (0.86 °C in autumn and 2.74 °C in spring) to cause noticeable changes in Rs. The maintenance of relatively high SWC during the dry summer period favored soil N (but not soil C) concentration and resulted in a reduced C/N (Figure 6c). A higher soil total N concentration in areas of higher SWC [59] or higher precipitation [60] has been previously reported. Here, this result might be related with a higher litter and N input in sites of high SWC (Figure 6a), although soil N and litter were not significantly related. The data suggest that litter accumulation helped to retain the soil water during summer (probably by preventing soil evaporation; Figure 6a), and that a high SWC had a direct effect on Rs by stimulating the soil activity. At comparable Ts and SWC conditions, Rs was negatively related with C/N across plots (Figure 6d). This suggests that N was a better proxy of the soil metabolic activity than C, and/or that the N substrates were more limiting than the C substrates for the respiratory metabolism of roots and microorganisms. Studies in northern European beech forests have reported the opposite result, which could be explained by lower soil C/N ratios in these forests (9.6–11.7 in the organo-mineral layer [17] and 11.1–13.2 in the mineral layer; Søe and Buchmann [16]) than in our case (13.7–17.8). Higher soil C/N in the studied sub-Mediterranean stand can be related to drier conditions favoring higher plant and litter C/N [61], and/or slowing down soil organic matter decomposition [58,62,63], relative to northern European beech stands.

4.2. How SWC and Ts Govern Temporal Changes in Rs?

The soil temperature drove intra-annual changes in Rs. The positive effect of temperature on the activity of respiratory enzymes of roots and soil microorganisms results in the increase of Rs as Ts rises. This has worried managers and scientists about the impact that climate warming may have on the release of C from soils, which, in forests, stock 383 ± 30 Pg C [64]. Projecting how Rs is going to respond to on-going warming is hampered, among other factors, by the interaction of Ts with many biotic and abiotic factors, including SWC [9,20,21,27,58]. Here, a progressively lower SWC registered during summer had a negative effect on Rs (Figure 4a), attenuated the increase in Rs as Ts increased (Table 2), and resulted in a logarithmic fit of Rs and Ts across the two years of study, given that higher temperatures were registered during the summer drought (Figure 3a). The limiting effect of low SWC on the enzymatic activity of roots and soil microorganisms [29,58] is likely the main factor resulting in reduced Rs rates below certain SWC thresholds in the tropical [65], temperate [16,17] and Mediterranean-type [5,6] forests. Here, the threshold below which SWC controlled Rs was 15%, which is within the wide range but in the lower end of thresholds that have been reported in literature (between 10% to 35% SWC [5,16,35,65]), suggesting a variable sensitivity of soil activity to SWC across systems.
The soil water excess also appeared to exert a small negative effect on Rs (Figure 4c). The filling of a large proportion of soil pores with water could reduce the CO2 diffusion from the soil, and also reduce oxygen diffusion to mitochondria of roots and soil microorganisms [37,65]. In temperate forests with clay-rich soils, transient periods of waterlogging can result in the suppression of Rs [16]. Moderate soil clay proportions (12% in the A horizon) and relatively high slopes in the studied forest make waterlogging less relevant to Rs suppression than recurrent summer droughts. The mean Rs normalized at a constant Ts of 11 °C and non-limiting SWC (20%)–the mean annual values–was 4.90 μmol m−2 s−1, which is higher than Rs at a similar Ts reported in temperate beech forests [16,17]. This is in spite of the higher long-term influence of drought on reducing Rs in the studied sub-Mediterranean stand. It is possible that the high soil N concentration (4.6 g K−1, equivalent to 368 g m−2 in the mineral topsoil), partly associated to the high basal area and litterfall across plots, contributes to the high Rs in this old forest (with dominant trees >200 years and suppressed trees often >50 years; Gil et al. [41]), compared to younger beech forests.

5. Conclusions

The decline of centennial dominant beech trees in a mature forest has only minor effects on the soil microclimate, physico-chemical variables, fine root density and Rs. The gradual process of decline of these trees, even if accelerated in the last years probably by competition with their own recruits and enhanced drought, is probably contributing to the homeostasis in soil processes. Shade tolerant beech recruits establish in the understory and develop as crown dieback advances, self-perpetuating the beech stand and maintaining above- and below-ground characteristics relatively constant. Increased duration and intensity of droughts projected for the study area [66] could exacerbate the control of SWC on the soil activity seen here over time and space; however, it could also have more profound effects on soil processes by altering the successional direction and velocity. Further research oriented to separate the autotrophic and heterotrophic contribution to Rs will help to better understand how tree decline affects soil biological processes, and to eventually delineate management practices aiming at increasing soil organic carbon stocks and reducing soil heterotrophic respiration [67].

Author Contributions

J.R.-C., R.S., J.B. and J.C.Y.; Methodology, J.R.-C., R.S., J.B., G.G.G., J.C.Y. and C.M.; Software, J.R.-C. and J.B.; Validation, J.R.-C. and J.B.; Formal Analysis, J.R.-C. and J.B.; Investigation, J.R.-C., R.S., J.B., G.G.G., J.C.Y. and L.G.; Resources, J.R.-C., R.S., G.G.G., C.M. and L.G.; Data Curation, J.R.-C., R.S., G.G.G. and C.M.; Writing – Original Draft Preparation, J.R.-C.; Writing – Review and Editing, J.R.-C., R.S., J.B., G.G.G., J.C.Y. and L.G.; Visualization, J.R.-C.; Supervision, J.R.-C., R.S., J.B., G.G.G., J.C.Y. and L.G.; Project Administration, J.R.-C. and L.G.; Funding Acquisition, J.R.-C. and L.G.

Funding

This project was possible thanks to the support of the Regional Government of Madrid (P2013/MAE-2760).

Acknowledgments

We are thankful to Nicolas Martin-St.Paul and Pepa Aroca for insightful comments on data analyses, and Eva Miranda for technical assistance. J.R.-C. acknowledges the support of the Ministry of Economy, Industry and Competitiveness through the “Ramón y Cajal” Programme. J.C.Y. is indebted to the Spanish projects IBERYCA (CGL2017-84723-P), the BC3 María de Maeztu excellence accreditation (MDM-2017-0714) funded by the Ministry of Economy and Competitiveness (MINECO) and the Basque Government through the BERC 2018-2021 program. R.S. is supported by the FWO and European Union’s Horizon 2020 research and innovation programme under the Marie Skłodowska-Curie fellowship (grant agreement no. 665501).

Conflicts of Interest

The authors declare no conflict of interest.

References

  1. Bond-Lamberty, B.P.; Thomson, A.M. Global Database of Soil Respiration Data, Version 3.0. Data Set; Oak Ridge National Laboratory Distributed Active Archive Center: Oak Ridge, TN, USA, 2014. Available online: http://daac.ornl.gov (accessed on 9 July 2018). [CrossRef]
  2. Curiel Yuste, J.; Nagy, M.; Janssens, I.A.; Carrara, A.; Ceulemans, R. Soil respiration in a mixed temperate forest and its contribution to total ecosystem respiration. Tree Physiol. 2005, 25, 609–619. [Google Scholar] [CrossRef] [PubMed] [Green Version]
  3. Davidson, E.A.; Richardson, A.D.; Savage, K.E.; Hollinger, D.Y. A distinct seasonal pattern of the ratio of soil respiration to total ecosystem respiration in a spruce- dominated forest. Glob. Chang. Biol. 2006, 12, 230–239. [Google Scholar] [CrossRef]
  4. Salomón, R.; Rodríguez-Calcerrada, J.; Staudt, M. Carbon losses from respiration and emission of volatile organic compounds—The overlooked side of tree carbon budgets. In Oaks Physiological Ecology, Exploring the Functional Diversity of Genus Quercus L.; Gil-Pelegrín, E., Peguero-Pina, J.J., Sancho-Knapik, D., Eds.; Tree Physiology 7; Springer International Publishing: Basel, Switzerland, 2017; pp. 327–359. [Google Scholar]
  5. Tedeschi, V.; Rey, A.; Manca, G.; Valentini, R.; Jarvis, P.G.; Borghetti, M. Soil respiration in a Mediterranean oak forest at different developmental stages after coppicing. Glob. Chang. Biol. 2006, 12, 110–121. [Google Scholar] [CrossRef]
  6. Fernández-Alonso, M.J.; Díaz-Pinés, E.; Ortiz, C.; Rubio, A. Disentangling the effect of tree species and microclimate on heterotrophic and autotrophic soil respiration in a Mediterranean ecotone forest. For. Ecol. Manag. 2018, 430, 533–544. [Google Scholar] [CrossRef]
  7. Ruiz-Benito, P.; Ratcliffe, S.; Zavala, M.A.; Martínez-Vilalta, J.; Vilà-Cabrera, A.; Lloret, F.; Madrigal-González, J.; Wirth, C.; Greenwood, S.; Kändler, G.; et al. Climate- and successional-related changes in functional composition of European forests are strongly driven by tree mortality. Glob. Chang. Biol. 2017, 23, 4162–4176. [Google Scholar] [CrossRef] [PubMed]
  8. Yermakov, Z.; Rothstein, D.E. Changes in soil carbon and nitrogen cycling along a 72-year wildfire chronosequence in Michigan jack pine forests. Oecologia 2006, 149, 690–700. [Google Scholar] [CrossRef]
  9. Yan, J.; Zhang, D.; Zhou, G.; Liu, J. Soil respiration associated with forest succession in subtropical forests in Dinghushan Biosphere Reserve. Soil Biol. Biochem. 2009, 41, 991–999. [Google Scholar] [CrossRef]
  10. Curiel Yuste, J.; Flores-Rentería, D.; García-Angulo, D.; Hereş, A.-M.; Bragă, C.; Petritan, A.-M.; Petritan, I.C. Cascading effects associated with climate-change-induced conifer mortality in mountain temperate forests result in hot-spots of soil CO2 emissions. Soil Biol. Biochem. 2019, 133, 50–59. [Google Scholar] [CrossRef]
  11. Avila, J.M.; Gallardo, A.; Ibáñez, B.; Gómez-Aparicio, L. Quercus suber dieback alters soil respiration and nutrient availability in Mediterranean forests. J. Ecol. 2016, 104, 1441–1452. [Google Scholar] [CrossRef]
  12. Högberg, P.; Nordgren, A.; Buchmann, N.; Taylor, A.F.S.; Ekblad, A.; Högberg, M.N.; Nyberg, G.; Ottosson-Lofvenius, M.; Read, D.J. Large-scale forest girdling shows that current photosynthesis drives soil respiration. Nature 2001, 411, 789–792. [Google Scholar] [CrossRef]
  13. Epron, D.; Ngao, J.; Dannoura, M.; Bakker, M.R.; Zeller, B.; Bazot, S.; Bosc, A.; Plain, C.; Lata, J.C.; Priault, P.; et al. Seasonal variations of belowground carbon transfer assessed by in situ 13 CO2 pulse labelling of trees. Biogeosciences 2011, 8, 1153–1168. [Google Scholar] [CrossRef]
  14. Drake, J.E.; Darby, B.A.; Giasson, M.-A.; Kramer, M.A.; Phillips, R.P.; Finzi, A.C. Stoichiometry constrains microbial response to root exudation—Insights from a model and a field experiment in a temperate forest. Biogeosciences 2013, 10, 821–838. [Google Scholar] [CrossRef]
  15. Pangle, R.E.; Seiler, J. Influence of seedling roots, environmental factors and soil characteristics on soil CO2 efflux rates in a 2-year-old loblolly pine (Pinus taeda L.) plantation in the Virginia Piedmont. Environ. Pollut. 2002, 116, 85–96. [Google Scholar] [CrossRef]
  16. Søe, A.R.B.; Buchmann, N. Spatial and temporal variations in soil respiration in relation to stand structure and soil parameters in an unmanaged beech forest. Tree Physiol. 2005, 25, 1427–1436. [Google Scholar] [CrossRef]
  17. Ngao, J.; Epron, D.; Delpierre, N.; Bréda, N.; Granier, A.; Longdoz, B. Spatial variability of soil CO2 efflux linked to soil parameters and ecosystems characteristics in a temperate beech forest. Agric. For. Meteorol. 2012, 154, 136–146. [Google Scholar] [CrossRef]
  18. Salomón, R.; Valbuena-Carabaña, M.; Rodríguez-Calcerrada, J.; Aubrey, D.; McGuire, M.A.; Teskey, R.; Gil, L.; González-Doncel, I. Xylem and soil CO2 fluxes in a Quercus pyrenaica Willd. coppice: Root respiration increases with clonal size. Ann. For. Sci. 2015, 72, 1065–1078. [Google Scholar] [CrossRef]
  19. Barba, J.; Curiel Yuste, J.; Martinez-Vilalta, J.; Lloret, F. Drought-induced tree species replacement is reflected in the spatial variability of soil respiration in a mixed Mediterranean forest. For. Ecol. Manag. 2013, 306, 79–87. [Google Scholar] [CrossRef]
  20. Barba, J.; Lloret, F.; Poyatos, R.; Molowny-Horas, R.; Curiel Yuste, J.C. Multi-temporal influence of vegetation on soil respiration in a drought-affected forest. iForest 2018, 11, 189. [Google Scholar] [CrossRef]
  21. Barba, J.; Curiel Yuste, J.; Poyatos, R.; Janssens, I.A.; Lloret, F. Strong resilience of soil respiration components to drought-induced die-off resulting in forest secondary succession. Oecologia 2016, 182, 27–41. [Google Scholar] [CrossRef] [Green Version]
  22. Binkley, D.; Stape, J.L.; Takahashi, E.N.; Ryan, M.G. Tree-girdling to separate root and heterotrophic respiration in two Eucalyptus stands in Brazil. Oecologia 2006, 148, 447–454. [Google Scholar] [CrossRef]
  23. Levy-Varon, J.H.; Schuster, W.S.F.; Griffin, K.L. Rapid rebound of soil respiration following partial stand disturbance by tree girdling in a temperate deciduous forest. Oecologia 2014, 174, 1415–1424. [Google Scholar] [CrossRef]
  24. Epron, D.; Le Dantec, V.; Dufrene, E.; Granier, A. Seasonal dynamics of soil carbon dioxide efflux and simulated rhizosphere respiration in a beech forest. Tree Physiol. 2001, 21, 145–152. [Google Scholar] [CrossRef]
  25. Schmidt, M.W.I.; Torn, M.S.; Abiven, S.; Dittmar, T.; Guggenberger, G.; Janssens, I.A.; Kleber, M.; Kögel-Knabner, I.; Lehmann, J.; Manning, D.A.C.; et al. Persistence of soil organic matter as an ecosystem property. Nature 2011, 478, 49–58. [Google Scholar] [CrossRef]
  26. Zhang, Y.; Guo, S.; Liu, Q.; Jiang, J. Influences of soil moisture on litter respiration in the semiarid loess plateau. PLoS ONE 2014, 9, e114558. [Google Scholar] [CrossRef]
  27. Reichstein, M.; Rey, A.; Freibauer, A.; Tenhunen, J.; Valentini, R.; Banza, J.; Casals, P.; Cheng, Y.; Grünzweig, J.M.; Irvine, J.; et al. Modeling temporal and large-scale spatial variability of soil respiration from soil water availability, temperature and vegetation productivity indices. Glob. Biogeochem. Cy. 2003, 4, 1104. [Google Scholar] [CrossRef]
  28. Curiel Yuste, J.; Janssens, I.A.; Carrara, A.; Meiresonne, L.; Ceulemans, R. Interactive effects of temperature and precipitation on soil respiration in a temperate maritime pine forest. Tree Physiol. 2003, 23, 1263–1270. [Google Scholar]
  29. Sardans, J.; Peñuelas, J. Drought decreases soil enzyme activity in a Mediterranean Quercus ilex L. forest. Soil Biol. Biochem. 2005, 37, 455–461. [Google Scholar] [CrossRef]
  30. Raich, J.W.; Potter, C.S.; Bhagawati, D. Interannual variability in global soil respiration, 1980–1994. Glob. Chang. Biol. 2002, 8, 800–812. [Google Scholar] [CrossRef]
  31. Kosugi, Y.; Mitani, T.; Itoh, M.; Noguchi, S.; Tani, M.; Matsuo, N.; Takanashi, S.; Ohkubo, S.; Nik, A.R. Spatial and temporal variation in soil respiration in a Southeast Asian tropical rainforest. Agric. For. Meteorol. 2007, 147, 35–47. [Google Scholar] [CrossRef]
  32. Misson, L.; Rocheteau, A.; Rambal, S.; Ourcival, J.-M.; Limousin, J.-M.; Rodríguez, R. Functional changes in the control of carbon fluxes after 3 years of increased drought in a Mediterranean evergreen forest? Glob. Chang. Biol. 2010, 16, 2461–2475. [Google Scholar] [CrossRef]
  33. Matías, L.; Castro, J.; Zamora, R. Effect of simulated climate change on soil respiration in a Mediterranean-type ecosystem: Rainfall and habitat type are more important than temperature on the soil carbon pool. Ecosystems 2012, 15, 299–310. [Google Scholar] [CrossRef]
  34. Campo, J.; Merino, A. Variations in soil carbon sequestration and their determinants along a precipitation gradient in seasonally dry tropical forest ecosystems. Glob. Chang. Biol. 2016, 22, 1942–1956. [Google Scholar] [CrossRef]
  35. Almagro, M.; López, J.; Querejeta, J.I.; Martínez-Mena, M. Temperature dependence of soil CO2 efflux is strongly modulated by seasonal patterns of moisture availability in a Mediterranean ecosystem. Soil Biol. Biochem. 2009, 41, 594–605. [Google Scholar] [CrossRef]
  36. Kutsch, W.L.; Staack, A.; Wötzel, J.; Middelhoff, U.; Kappen, L. Field measurements of root respiration and total soil respiration in an alder forest. New Phytol. 2001, 150, 157–168. [Google Scholar] [CrossRef]
  37. Domínguez, M.T.; Sowerby, A.; Smith, A.R.; Robinson, D.A.; Van Baarsel, S.; Mills, R.T.E.; Marshall, M.R.; Koller, E.; Lebron, I.; Hall, J.; et al. Sustained impact of drought on wet shrublands mediated by soil physical changes. Biogeochemistry 2015, 122, 151–163. [Google Scholar] [CrossRef]
  38. Aussenac, G. Interactions between forest stands and microclimate: Ecophysiological aspects and consequences for silviculture. Ann. For. Sci. 2000, 57, 287–301. [Google Scholar] [CrossRef]
  39. Bréda, N.; Huc, R.; Granier, A.; Dreyer, E. Temperate forest trees and stands undersevere drought: A review of ecophysiological responses, adaptation processes and long-term conse-quences. Ann. For. Sci. 2006, 63, 625–644. [Google Scholar] [CrossRef]
  40. Rodríguez-Calcerrada, J.; Mutke, S.; Alonso, J.; Gil, L.; Pardos, J.A.; Aranda, I. Influence of overstory density on understory light, soil moisture, and survival of two underplanted oak species in a Mediterranean montane Scots pine forest. For. Syst. 2008, 17, 31–38. [Google Scholar] [CrossRef]
  41. Gil, L.; Alonso Nager, J.; Aranda García, I.; González Doncel, I.; Gonzalo Jiménez, J.; López de Heredia, U.; Millerón, M.; Nanos, N.; Perea García-Calvo, R.; Rodríguez-Calcerrada, J.; et al. El Hayedo de Montejo—Una Gestión Sostenible; Dirección General de Medio Ambiente: Madrid, Spain, 2010.
  42. Curiel Yuste, J.; Barba, J.; Fernández-Gonzalez, J.A.; Fernández-López, M.; Mattana, S.; Nolis, P.; Lloret, F. Changes in soil bacterial community triggered by drought-induced gap succession preceded changes in soil C stocks and quality. Ecol. Evol. 2012, 2, 3016–3031. [Google Scholar] [CrossRef] [Green Version]
  43. Buckee, G.K. Determination of total nitrogen in Barley, Malt and Beer by Kjeldahl procedures and the Dimas combustion method. J. Inst. Brew. 1994, 100, 57–64. [Google Scholar] [CrossRef]
  44. Zuur, A.F.; Ieno, E.N.; Elphick, C.S. A protocol for data exploration to avoid common statistical problems. Methods Ecol. Evol. 2010, 1, 3–14. [Google Scholar] [CrossRef]
  45. Gelman, A.; Hill, J. Data Analysis Using Regression and Multilevel/Hierarchical Models; Cambridge University Press: New York, NY, USA, 2007. [Google Scholar]
  46. Warton, D.I.; Duursma, R.A.; Falster, D.S.; Taskinen, S. SMATR 3—An R package for estimation and inference about allometric lines. Methods Ecol. Evol. 2012, 3, 257–259. [Google Scholar] [CrossRef]
  47. Pinheiro, J.; Bates, D.; DepRoy, S. Linear and Nonlinear Mixed Effects Models. In R Package Version 3; R Foundation for Statistical Computing: Vienna, Austria, 2009; pp. 1–96. [Google Scholar]
  48. Barton, K. MuMIn: Multi-model inference. In R Package Version 3; R Foundation for Statistical Computing: Vienna, Austria, 2014; pp. 1–96. [Google Scholar]
  49. Nave, L.E.; Gough, C.M.; Maurer, K.D.; Bohrer, G.; Hardiman, B.S.; Le Moine, J.; Munoz, A.B.; Nadelhoffer, K.J.; Sparks, J.P.; Strahm, B.D.; et al. Disturbance and the resilience of coupled carbon and nitrogen cycling in a north temperate forest. J. Geophys. Res. Biogeosci. 2011, 116, G04016. [Google Scholar] [CrossRef]
  50. Pereira-Blanco, E. Response of Fine Root Respiration to Variations in Biotic and Abiotic Factors in A Mixed Mediterranean Forest Affected by Drought Induced Secondary Succession. Master’s Thesis, Digital Repository, Autonomous University of Barcelona, Bellaterra, Spain, 2014; pp. 1–27. [Google Scholar]
  51. McCarthy, J. Gap dynamics of forest trees: A review with particular attention to boreal forests. Environ. Rev. 2001, 9, 1–59. [Google Scholar] [CrossRef]
  52. Moore, D.J.; Trahan, N.A.; Wilkes, P.; Quaife, T.; Stephens, B.B.; Elder, K.; Desai, A.R.; Negron, J.; Monson, R.K. Persistent reduced ecosystem respiration after insect disturbance in high elevation forests. Ecol. Lett. 2013, 16, 731–737. [Google Scholar] [CrossRef] [Green Version]
  53. Borkhuu, B.; Peckham, S.D.; Ewers, B.E.; Norton, U.; Pendall, E. Does soil respiration decline following bark beetle induced forest mortality? Evidence from a lodgepole pine forest. Agric. For. Meteorol. 2015, 214, 201–207. [Google Scholar] [CrossRef]
  54. Ngao, J.; Longdoz, B.; Granier, A.; Epron, D. Separating autotrophic and heterotrophic respiration in two young beech stands: Impact of corrections for root decomposition in trenched plots. Plant Soil 2007, 301, 99–110. [Google Scholar] [CrossRef]
  55. Curiel Yuste, J.; Janssens, I.A.; Carrara, A.; Ceulemans, R. Annual Q10 of soil respiration reflects plant phenological patterns as well as temperature sensitivity. Glob. Chang. Biol. 2004, 161–169. [Google Scholar] [CrossRef]
  56. Subke, J.-A.; Bahn, M. On the “temperature sensitivity” of soil respiration: Can we use the immeasurable to predict the unknown? Soil Biol. Biochem. 2010, 42, 1653–1656. [Google Scholar] [CrossRef]
  57. Buchmann, N. Biotic and abiotic factors controlling soil respiration rates in Picea abies stands. Soil Biol. Biochem. 2000, 32, 1625–1635. [Google Scholar] [CrossRef]
  58. Curiel Yuste, J.; Baldocchi, D.D.; Gershenson, A.; Godlstein, A.; Misson, L.; Wong, S. Microbial soil respiration and its dependency on carbon inputs, soil temperature and moisture. Glob. Chang. Biol. 2007, 13, 2018–2035. [Google Scholar] [CrossRef] [Green Version]
  59. He, X.; Hou, E.; Liu, Y.; Wen, D. Altitudinal patterns and controls of plant and soil nutrient concentrations and stoichiometry in subtropical China. Sci. Rep. 2016, 6, 24261. [Google Scholar] [CrossRef]
  60. Liu, Z.-P.; Shao, M.-A.; Wang, Y.-Q. Spatial patterns of soil total nitrogen and soil total phosphorus across the entire Loess Plateau region of China. Geoderma 2013, 197, 67–78. [Google Scholar] [CrossRef]
  61. Sardans, J.; Rivas-Ubach, A.; Peñuelas, J. The C: N: P stoichiometry of organisms and ecosystems in a changing world: A review and perspectives. Perspect. Plant Ecol. 2012, 14, 33–47. [Google Scholar] [CrossRef]
  62. Pardo, F.; Gil, L.; Pardos, J.A. Field study of beech (Fagus sylvatica L.) and melojo oak (Quercus pyrenaica Willd.) leaf litter decomposition in the centre of the Iberian Peninsula. Plant Soil 1997, 191, 89–100. [Google Scholar] [CrossRef]
  63. Jin, V.L.; Haneu, R.L.; Fay, P.A.; Polley, H.W. Soil type and moisture regime control microbial C and N mineralization in grassland soils more than atmospheric CO2-induced changes in litter quality. Soil Biol. Biochem. 2013, 58, 172–180. [Google Scholar] [CrossRef]
  64. Pan, Y.; Birdsey, R.A.; Fang, J.; Houghton, R.; Kauppi, P.E.; Kurz, W.A.; Phillips, O.L.; Shvidenko, A.; Lewis, S.L.; Canadell, J.G.; et al. A large and persisntent carbon sink in the world’s forests. Science 2011, 333, 988–993. [Google Scholar] [CrossRef]
  65. Wood, T.E.; Detto, M.; Silver, W.L. Sensitivity of soil respiration to variability in soil moisture and temperature in a humid tropical forest. PLoS ONE 2013, 8, e80965. [Google Scholar] [CrossRef]
  66. Gao, X.; Giorgi, F. Increased aridity in the Mediterranean region under greenhouse gas forcing estimated from high resolution simulations with a regional climate model. Glob. Planet. Chang. 2008, 62, 195–209. [Google Scholar] [CrossRef]
  67. Comeau, L.-P.; Lai, D.Y.F.; Cui, J.J.; Farmer, J. Separation of soil respiration: A site-specific comparison of partition methods. Soil 2018, 4, 141–152. [Google Scholar] [CrossRef]
Figure 1. Examples of centennial beech trees around which soil respiration measurements were conducted. Tree decline classes were established in relation to the crown dieback: Vigorous (a; no apparent crown dieback), affected (b; less than 40% crown dieback), severely affected (c; more than 50% crown dieback), and dead (d) trees.
Forests 10 00727 g001
Figure 2. Temporal changes in (a) soil temperature and daily rainfall (blue line), (b) soil water content at 0–20 cm depth, and (c) soil respiration (Rs) around centennial beech trees of different decline classes – vigorous (V), affected (A1), severely affected (A2) – and dead (D). Values are means (±SE) of n=4 replicate plots, except for rainfall, recorded in a meteorological station in the study area. Asterisks indicate dates in which significantly different means among tree-decline classes were found at p = 0.05.
Forests 10 00727 g002
Figure 3. Soil respiration (Rs) as a function of soil temperature (Ts) throughout the entire study period (a) or after excluding observations above 15% soil water content (b); non-limiting SWC for Rs; see text), observed around centennial beech trees of different decline classes–vigorous (V; squares), affected (A1; diamonds), severely affected (A2; triangles), and dead (D; circles). Data points are mean values per plot and sampling campaign. In (a) open and closed symbols account for Rs values above and below 15% SWC, respectively; non-linear models are fitted to all data points, separately among tree-decline classes.
Forests 10 00727 g003
Figure 4. Observed soil respiration (Rs; a) and derived parameters (b,c) modeled as a function of soil water content (SWC) in plots established around centennial beech trees of different decline classes – vigorous (V; squares), affected (A1; diamonds), severely affected (A2; triangles), and dead (D; circles). Data points are mean values per plot and sampling campaign. In (a) the inset depicts the relationship below 15% SWC. b,c) relationship of SWC with residuals between observed Rs values and Rs values modeled from Ts above 15% SWC (b), and standardized Rs at 11 °C (mean annual Ts; c). Non-linear regression models were fitted pooling all tree-decline classes or separately among tree-decline classes to account for the significant relationship of Ts with factor “Decline” (see Table 2).
Forests 10 00727 g004
Figure 5. Relationship between observed soil respiration (Rs) and Rs modeled from temporal variations in soil water content and soil temperature. Different symbols are used to distinguish between vigorous (squares), slightly affected (diamonds), severely affected (triangles) and dead (circles) trees, but a single regression model is given for all tree-decline classes pooled for clarity. The major axis regression analysis was used to analyze the relationship between the observed and the modeled Rs. Dotted line depicts the 1:1 line.
Forests 10 00727 g005
Figure 6. Relationships between soil variables across 16 plots established around centennial beech trees of different decline classes – vigorous (squares), affected (diamonds), severely affected (triangles) – and dead (circles): (a) Litter depth versus soil water content (SWC) during summer; (b) summer SWC versus standardized soil respiration (Rs) during summer at 17 °C (the average soil temperature (Ts) during summer); (c) summer SWC versus soil nitrogen concentration (open symbols) and C to N ratio (C/N; closed symbols); and (d) C/N versus mean Rs during the entire study period standardized at 11 °C (the mean annual Ts over the study period; open symbols) and at 11 °C and 20% SWC (the mean annual SWC over the study period; closed symbols). The coefficient of determination (r2) and p-value of linear regression models fitted to all tree-decline classes pooled are shown.
Forests 10 00727 g006
Table 1. Characterization of the four types of plots established around centennial beech trees of different declines–vigorous, affected, severely affected–and dead. Crown dieback of the centennial beech tree (%); cover of herbaceous (Herb.) species (%) and cover of shrub species (%); stem density (stems ha−1) and basal area (m2 ha−1) of either all trees in the plot (ALL) or only saplings >1.5 m height and <0.5 m diameter at breast height (i.e., of recruits established after the woodland was banned to cattle grazing in the 1960s; REC); fine litter depth (i.e., leaves and small twigs; cm); soil water content over 0–20 cm topsoil (SWC; %) averaged for all or only summer measurement dates, and soil bulk density (g cm−3), organic matter (OM; %), total carbon (C, %), total nitrogen (N, %), C to N ratio, and fine root density (<2 mm; g m−2) of 0–10 cm topsoil; average soil respiration measured across two years (Rs; μmol m−2 s−1), and modeled at mean annual soil temperature (11 °C), and constant temperature and soil water content (20%). Data are means (±SE) from four replicate plots per tree decline class. Different letters separate significantly different means of crown dieback, the only variable for which significant differences among tree classes were found at p < 0.05.
VigorousAffectedSeverely AffectedDead
Crown dieback 16.3 ± 3.8 a25 ± 5.4 a68.8 ± 8.3 b100 ± 0 c
Herb. cover 13.7 ± 1.33.2 ± 2.011.1 ± 4.412.7 ± 4.7
Shrub cover 14.2 ± 3.210.4 ± 4.913.3 ± 8.412.3 ± 3.9
Stem density (ALL)1003 ± 4862045 ± 5432690 ± 5922355 ± 185
Basal area (ALL)48.8 ± 9.736.9 ± 5.737.7 ± 6.627.4 ± 9.5
Stem density (REC)963 ± 4912021 ± 5382658 ± 5922340 ± 183
Basal area (REC)5.3 ± 1.812 ± 4.115.6 ± 6.618 ± 1.3
Soil litter depth5.3 ± 0.35.3 ± 0.35.3 ± 0.84.1 ± 0.6
SWC18.8 ± 0.219.4 ± 0.118.5 ± 0.121.4 ± 0.3
SWC summer10.7 ± 0.211.0 ± 0.29.6 ± 0.210.7 ± 0.4
Soil bulk density0.77 ± 0.010.78 ± 0.010.76 ± 0.010.73 ± 0.01
Soil OM9.7 ± 1.08.3 ± 0.68.9 ± 0.48.8 ± 0.6
Soil total carbon7.7 ± 0.86.5 ± 0.57.2 ± 0.47.4 ± 0.7
Soil total nitrogen0.48 ± 0.050.41 ± 0.040.45 ± 0.040.49 ± 0.06
Soil C/N15.8 ± 0.116.1 ± 0.216.1 ± 0.115.2 ± 0.2
Root density232 ± 4208 ± 11229 ± 6224 ± 8
Rs4.67 ± 0.083.95 ± 0.064.49 ± 0.144.29 ± 0.05
Rs_11 °C4.51 ± 0.073.92 ± 0.074.31 ± 0.154.15 ± 0.07
Rs_11 °C, 20%5.19 ± 0.064.41 ± 0.075.20 ± 0.124.81 ± 0.04
1: Variables visually estimated by the same observer.
Table 2. Mixed effects model of temporal variations in soil respiration as a function of soil temperature (Ts), soil water content (SWC), tree-decline class (vigorous [V], affected [A1], severely affected [A2] and dead [D]) and season. The model explained 83% of the variation in Rs and was significant at p < 0.001.
EstimateSEDFt-Valuep-Value
Intercept0.2260.1841861.2250.222
Ts0.8290.1631865.088<0.001
SWC0.1030.1541860.6650.507
Ts × SWC0.2330.0881862.6460.009
Tree-decline
V----- a
A1−0.3760.24512−1.5360.151 a
A2−0.0260.24512−0.1050.918 a
D−0.1310.24912−0.5250.609 a
Season
Spring----- a
Summer0.7960.1891864.211<0.001 b
Fall1.8280.4781863.821<0.001 c
Winter0.2311.9311860.120.905 abc
Ts × season
Ts × spring----- a
Ts × summer0.0930.2251860.4110.681 a
Ts × fall1.0170.3931862.5890.01 b
Ts × winter0.1881.2371860.1520.879 ab
SWC × season
SWC × spring----- a
SWC × summer1.0090.1981865.09<0.001 b
SWC × fall−0.5070.378186−1.3410.182 a
SWC × winter0.1170.431860.2730.786 ab
Ts × tree-decline
Ts × V----- a
Ts × A1−0.2520.092186−2.7380.007 b
Ts × A2−0.1050.091186−1.1570.249 ab
Ts × D−0.1470.097186−1.5170.131 ab

