Article

Differential Responses and Controls of Soil CO2 and N2O Fluxes to Experimental Warming and Nitrogen Fertilization in a Subalpine Coniferous Spruce (Picea asperata Mast.) Plantation Forest

1
Key Laboratory of Mountain Ecological Restoration and Bioresource Utilization & Ecological Restoration Biodiversity Conservation Key Laboratory of Sichuan Province, Chengdu Institute of Biology, Chinese Academy of Sciences, Chengdu 610041, China
2
Department of Biological Sciences, Northern Arizona University, Flagstaff, AZ 86001, USA
3
Department of Biological Sciences, Tennessee State University, Nashville, TN 37209, USA
*
Author to whom correspondence should be addressed.
Forests 2019, 10(9), 808; https://doi.org/10.3390/f10090808
Submission received: 13 August 2019 / Revised: 11 September 2019 / Accepted: 15 September 2019 / Published: 17 September 2019

Abstract

:
Emissions of greenhouse gases (GHG) such as CO2 and N2O from soils are affected by many factors such as climate change, soil carbon content, and soil nutrient conditions. However, the response patterns and controls of soil CO2 and N2O fluxes to global warming and nitrogen (N) fertilization are still not clear in subalpine forests. To address this issue, we conducted an eight-year field experiment with warming and N fertilization treatments in a subalpine coniferous spruce (Picea asperata Mast.) plantation forest in China. Soil CO2 and N2O fluxes were measured using a static chamber method, and soils were sampled to analyze soil carbon and N contents, soil microbial substrate utilization (MSU) patterns, and microbial functional diversity. Results showed that the mean annual CO2 and N2O fluxes were 36.04 ± 3.77 mg C m−2 h−1 and 0.51 ± 0.11 µg N m−2 h−1, respectively. Soil CO2 flux was only affected by warming while soil N2O flux was significantly enhanced by N fertilization and its interaction with warming. Warming enhanced dissolve organic carbon (DOC) and MSU, reduced soil organic carbon (SOC) and microbial biomass carbon (MBC), and constrained the microbial metabolic activity and microbial functional diversity, resulting in a decrease in soil CO2 emission. The analysis of structural equation model indicated that MSU had dominant direct negative effect on soil CO2 flux but had direct positive effect on soil N2O flux. DOC and MBC had indirect positive effects on soil CO2 flux while soil NH4+-N had direct negative effect on soil CO2 and N2O fluxes. This study revealed different response patterns and controlling factors of soil CO2 and N2O fluxes in the subalpine plantation forest, and highlighted the importance of soil microbial contributions to GHG fluxes under climate warming and N deposition.

1. Introduction

Due to fossil fuel combustion and land use change, global air temperature has been increasing over the past decades [1]. The Qinghai–Tibet Plateau region (QTP) of China is experiencing a larger increase in temperature than other regions with an increasing rate of 0.2 °C per decade [2]. Accompanied with climate warming, nitrogen (N) deposition is increasing in many places on the Earth [3]. China has the third highest rate of nitrogen deposition, followed by North America and Western Europe due to the industrialization and intensive agricultural activities [3,4]. Additionally, in the QTP region, N deposition continues to increase. The climate warming and N deposition are likely to have significant impacts on greenhouse gases (GHG) emissions in QTP ecosystems because the high-latitude regions are very sensitive to global change with large soil C pool, low inorganic N availability, and higher temperature sensitivity [3].
Carbon dioxide (CO2) and nitrous oxide (N2O) are two important GHGs, which contribute to about 60% and 6% of the global warming potential, respectively [2,5]. Many studies have investigated the effects of warming and N deposition on soil GHG fluxes, but large uncertainties still remain. For example, some studies found that warming leads to increase in soil CO2 emission because it accelerates the decomposition of soil organic C (SOC) [6], but others reported that warming decreases or has no effect on soil CO2 emission due to the loss of SOC in a long-term warming experiment [7]. Climate warming generally increases soil N2O flux by enhancing decomposition and N mineralization [8,9], however, it may not influence soil N2O flux or decrease it depending on the soil conditions [10]. Studies on the effect of N fertilization or deposition on GHG fluxes also showed various results. For example, Jassal et al. [11] found that the N application increases soil CO2 and N2O emissions in the first year, but shifts to soil N2O uptake has no effect on soil CO2 emission in the second year. Geng et al. [12] reported that the N addition at a low rate of 10 kg N ha−1 year−1 significantly stimulated soil CO2 emission, whereas the high rate of N addition (140 kg N ha−1 year−1) significantly inhibits soil CO2 emission in a temperate mixed forest.
The different responses of soil CO2 and N2O fluxes to global warming and N fertilization in different environments could be determined by soil physical–chemical properties such as soil temperature, soil inorganic nitrogen availability, and soil carbon content [13,14]. One study showed that soil CO2 flux is positively related to soil dissolve organic carbon (DOC) and NO3-N, and soil N2O flux is positively correlated with soil NH4+-N [14]. Another study found that soil CO2 efflux is positively correlated with soil NH4+-N and negatively with soil NO3-N [12]. Thus, any changes in these soil properties caused by warming and N fertilization could have different impacts on GHG fluxes [15]. Indeed, Geng et al. [12] found high N addition enhances soil NO3-N and inhibits soil CO2 emission, while low N addition does not affect soil NO3-N but stimulates soil CO2 emission. Seo et al. [16] found warming increases the labile C pool, causes a loss of soil C, and increases soil CO2 emission. Yin et al. [7] reported that warming decreases SOC and decreases soil CO2 emission.
The influences of warming and N deposition on soil microbial activity and composition may have significant impacts on soil CO2 and N2O fluxes. Soil microorganisms are the major drivers in the biogeochemical processes such as soil C decomposition and N mineralization [17,18]. Any changes in soil microbial diversity and community structure may alter the C and N cycling [17]. For instance, the fungi to bacteria ratio is negatively correlated to soil N mineralization [19]. Furthermore, soil microorganisms can be affected by multiply factors such as climate, soil physical, and chemical properties, and substrate quantity and quality [20,21]. Several studies reported that soil microbial community structure and diversity are strongly impacted by warming and N fertilization, and play an important role on controlling soil CO2 and N2O fluxes [17,22,23]. However, convincing data about the direct link of soil GHG fluxes and soil microbial characteristics under warming and N fertilization are still scarce.
The subalpine and alpine forest ecosystems in Eastern Tibetan Plateau, located at the high latitude of the transition zone from the QTP to Sichuan basin, constitute the second largest biome in China and are the main forest ecosystems in southwest China [24]. Spruce (Picea asperata Mast.) is the dominant tree species of the plantation, which is the major forest ecosystem in this region after deforestation in the 1950s. Past studies on climate warming and N fertilization in forests in this region mostly focused on the soil C pool and N pool and associated processes [7,25,26]. Although soil GHG fluxes are highly related to the soil C and N pool, these data are not directly reflecting the GHG magnitude. Direct evidence of variations of the responses of soil CO2 and N2O fluxes and their controls is needed.
We took advantage of an eight-year field experiment with warming and N fertilization in subalpine spruce plantation forest, and measured soil CO2 and N2O fluxes over one year using the static chamber method. We also analyzed soil C and N contents, microbial substrate utilization patterns, and microbial functional diversity using BIOLOG microplates. We aimed to quantify the magnitude of soil CO2, N2O fluxes in the plantation forest and the effects of climate warming and applying N fertilization on the gas fluxes, and reveal influential factors that control soil CO2 and N2O fluxes.

2. Materials and Methods

2.1. Experimental Site

The experimental site is located at the Maoxian Ecological Station of the Chinese Academy of Sciences, Sichuan Province, China (31°41′ N, 103°53′ E, 1820 m a.s.l.). The site is in a subalpine canyon zone at the transition region from Qinghai–Tibet Plateau (QTP) to Sichuan basin, with the mean annual temperature, total annual precipitation, and evaporation of 8.9 °C, 920 mm, and 796 mm, respectively. The experiment started in March 2007 with warming and N fertilization treatments and ended in 2015. Soil CO2 and N2O fluxes were measured for one year from 14 June 2014 to 25 June 2015, eight years after the treatments were applied.

2.2. Experimental Set-Up and Design

To avoid the potential effects of soil heterogeneity on soil GHG fluxes, we collected the top 50 cm soil from a nearby spruce plantation forest and replaced the indigenous soil in all plots. In March 2007, 40 healthy four-year-old seedlings of spruce were randomly planted in each plot (2 m × 2 m). The seedlings were collected from a local nursery. The experiment included four treatments: Control, warming, N fertilization, and warming and N fertilization. A randomized block design with four replicates (blocks) was used in this study. Artificial warming and N application started in April 2007 and continued to the end of the experiment. The heating method were described in detail in published papers of our research team [27,28]. Ammonium nitrate solution (25 g N m−2 year−1) was added weekly to the soil surface of fertilization treatment. The equivalent amount of water was added to the other four pairs of plots for unfertilized treatments. In order to eliminate the potential effects of difference in soil water on soil processes between the warmed and un-warmed plots, the warmed plots were watered as frequently as needed and were monitored with a hand-held probe (IMKO, Ettlingen, Germany).

2.3. Microclimate Measurements

Air temperature (20 cm above soil surface) and soil temperature (5 cm depth) were measured using the DS1923G temperature sensor with iButton data loggers (Maxim/Dallas Semiconductor Inc., Dallas, TX, USA) at 60 min intervals. The warming effect decreased with the trees growth and plant coverage. The monthly air temperature in the warmed plots was increased by an average of 2.1, 1.9, 0.3 °C in 2007, 2011, and 2014, respectively. The monthly soil temperature in the warmed plots was increased by an average of 2.6, 3.6, and 0.6 °C in 2007, 2011, and in 2014, respectively.

2.4. Soil CO2 and N2O Fluxes Measurements

Soil CO2 and N2O fluxes were measured monthly using the static chamber method and gas chromatography technique from 14 June 2014 to 25 June 2015 according to Cai et al. [29]. One PVC tube base with a groove outside but without top and bottom (20 cm inside diameter, and 15 cm height) was inserted into a 10 cm-depth soil in each plot. The removable chamber with a small silicon-sealed bent for gas sampling and a port for measuring chamber temperature at the top of the chamber (without bottom, 21 cm in diameter and 30 cm in height) was placed into the PVC tube base during sampling and removed afterwards. Litter and plants were removed around the tube base before fixing it and four replicates were set in each treatment.
Samples were taken between 10:00 a.m. and 1:00 p.m. in order to minimize diurnal variation in fluxes. Each time, four air samples of each chamber were manually pulled into 100 mL pre-evacuated gas collecting bags (made in Dalian, China) at 0, 15, 30, and 45 min after enclosure of the chamber, and were taken to the laboratory for analysis using gas chromatography (Agilent 7890A, Santa Clara, CA, USA) within two weeks. Air temperature inside the chamber was measured with a mercury-in-glass thermometer at the time of gas sampling. Soil temperature and moisture were measured outside of each chamber with the DS1923G temperature sensor with iButton data loggers (Maxim/Dallas Semiconductor Inc., Dallas, TX, USA).
Soil CO2 and N2O fluxes were calculated as the slope of linear regression between gases concentration and time with an average chamber temperature [30]. All the coefficients of the linear regression (r2) were greater than 0.80 in this study. Flux was calculated as:
F = d c d t × p 0.082 T × M × V A
where F is the gas flux (µg N m−2 h−1 for N2O and mg C m−2 h−1 for CO2), d c d t is the rate of change in gas concentration inside the chamber, p is barometric pressure at temperature T (atm), T is the air temperature inside the chamber in K, M is the molecular weight of the gas, 0.082 is the universal gas constant, V is the chamber volume (m3) and A is the chamber area (m2).

2.5. Soil Samples and Analysis

Soil samples (n = 4) in each treatment were collected in August and November of 2014, and February and May of 2015. At each sampling date, we took five topsoil (0–15 cm) cores (2.5 cm diameter) close to each chamber and then combined into one composite sample. Soil samples were sieved through 2 mm mesh to remove visible living plant and rock, stored in an icebox at 4 °C, and delivered to the laboratory for analysis.
Soil organic C (SOC) was determined using the K2Cr2O7-H2SO4 wet digestion method [31]. After digestion with K2Cr2O7-H2SO4, FeSO4 was used to titrate the remaining K2Cr2O7 in the digestion solution and SOC was calculated based on the consumptions of the K2Cr2O7. The dissolve organic C (DOC) was measured using the K2Cr2O7-H2SO4 wet digestion method after extracted by deionized water [32]. Total soil N (TN) was determined by semi-micro Kjeldahl digestion using Se, CuSO4, and K2SO4 as catalysts [33]. Soil ammonium (NH4+), nitrate (NO3), and nitrite (NO2)-N concentrations were determined using Auto Analyzer 3 (AA3, Bran Luebbe, Norderstedt, Germany) after being extracted with 2 M KCl solution (soil:water = 1:5) for 1 h [34]. Microbial biomass C (MBC) and N (MBN) concentrations were measured with the chloroform fumigation extraction method [35]. MBC and MBN were calculated as the difference between the C and N concentrations extracted with 2 M K2SO4 solution of the fumigated and non-fumigated soil, respectively, and then divided an efficiency factor K = 0.45. All the concentrations were calculated based on soil dry weight.
Microbial substrate utilization (MSU) patterns were analyzed using BIOLOG ECO plates (Biolog, Inc., Hayward, CA, USA). Equivalent to 1.0 g dry soil from each fresh sample was first added into 99 mL distilled autoclaved water and was shaken for 20 min to ensure that all the fungal spores are well mixed. Then, the soil solutions were settled for 30 min at 4 °C to remove suspended clay particles. 150 μL supernatant was transferred to the plates and then was incubated at 25 °C for up to 168 h. The OD values (absorbance at 590 nm and 750 nm, respectively) were measured at each 24 h from 48 to 168 h with a microtiter-plate reader (Biolog GenⅢ Microstation, Biolog company, Hayward, CA, USA). The OD value at 590 nm subtracting the OD value at 750 nm, and then the difference in the control was subtracted from each well’s OD to correct for background activity. To minimize the effects of different inoculation densities, data from the 96 h reading were normalized by h dividing the absorbency of each well by the average absorbency for the whole plate (average well color development, AWCD) [17]. AWCD reflect the metabolic activity of soil microbes. Moreover, the Shannon diversity index (H) and diversity index (U) were calculated to represent the diversity and uniformity of the microbial communities.
H = p i l n p i
U = ( n i 2 )
where p i = O D ( i , j , t ) O D ( i , j , t ) ; and n i = O D ( i , j , t )

2.6. Data Analysis

The exponential model was used to determine the sensitivity of soil GHG fluxes to soil temperature (T):
F = a e b T
where F is the GHG flux, a is the value of flux at 0 °C, and b is the sensitivity of flux to temperature.
The flux sensitivity to temperature (Q10) was calculated as:
Q 10 = e 10 b
The cumulative global warming potential (GWP, kg CO2 hm−2) was calculated by adding cumulative soil CO2 flux, and the cumulative GWP from N2O (cumulative N2O flux multiplied by 298) [36].
The repeated measure-ANOVA was used to analyze the effects of warming and N fertilization on soil CO2 and N2O fluxes. A three-way analysis of variance (ANOVA) was used to test the effects of warming, N fertilization, and sample time (season) on TOC, DOC, TN, inorganic N, AWCD, H, and U. The ECO plates contained 31 types of carbon substrates. The microbial substrates utilization patterns were analyzed to identify the effects of treatments and soil environment factors such as soil water, temperature, soil DOC, SOC, and inorganic nitrogen using Canonical Correspondence Analysis (CCA) in the CANOCO 4.5 software (Microcomputer Power, Ithaca, NY, USA).
Structural equation modelling (SEM) was performed to determine the relative importance of soil variables to soil CO2 and N2O fluxes using the Amos 24.0 software package (IBM, New York, NY, USA). We first tested the relationships between the CO2 and N2O fluxes and soil properties before the SEM analysis. If the correlation was significant, that variable was put into the SEM. As microbial substrate utilization patterns included 31 types of carbon source utilization, we selected the significant correlations of the carbon source utilization with soil CO2 and N2O fluxes, and then used the Principal Component Analysis (PCA) to create a multivariate functional index. The best-fit model was derived using maximum likelihood and a chi-square test (χ2), P-values, df, and root mean square errors of approximation (RSMEA) were used to evaluate model fitting.

3. Results

3.1. Soil Carbon, Nitrogen and Microbial Properties

Warming significantly increased soil NO3-N, NO2-N, DOC, and the ratio of MBC/MBN, but decreased TN, SOC, MBC, and MBN (Table 1). Nitrogen fertilization significantly increased soil NO3-N, TN, TOC, and the ratio of MBC/MBN, but decreased soil NO2-N, DOC, MBC, and MBN. The metabolic activity of soil microbes measured as the average absorbency for the whole BIOLOG ECO plate (AWCD), the Shannon diversity index (H), and uniformity index (U) varied seasonally (Table 1). Warming decreased AWCD and U. Nitrogen fertilization alone had no effect on AWCD and U but significantly affected these variables with warming. The CCA analysis identified 21 substrates that were the most important variables in separating plots along the environmental axes among the 31 carbon substrates (Figure 1). Most of these MSU patterns were correlated with temperature, soil DOC, and soil water. The correlation coefficient were 0.68, 0.72, −0.72 in CCA1 and −0.62, −0.18, 0.32 in CCA2 for temperature, soil DOC, and soil water, respectively.

3.2. Soil CO2 and N2O Fluxes

The highest soil CO2 and N2O fluxes occurred in August and the lowest in January (Figure 2). The mean annual CO2 and N2O fluxes were 36.04 ± 3.77 mg C m−2 h−1 and 0.51 ± 0.11 µg N m−2 h−1, respectively (Table 2). Compared to the control (W0N0), the annual soil CO2 flux was slightly decreased in the WN0 and WN treatments but was increased by 27.8% in the W0N treatment. Annual soil N2O flux was increased by 8.2 times and 3.0 times in the W0N and WN treatments. Soil CO2 flux was mainly affected by warming, while soil N2O flux was mainly affected by N fertilization and its interaction with warming. The cumulative GWP from CO2 and N2O were 9984 ± 321 and 20.31 ± 3.02 kg CO2 hm−2, respectively (Table 2).

3.3. Relationship between the Soil CO2 and N2O Fluxes and Environmental Factors

Soil CO2 and N2O fluxes increased exponentially with soil temperature across all treatments (Figure 3). The Q10 values for CO2 flux were not significantly different among the control, W0N, and WN0 treatments, while Q10 in the WN treatment was increased to 5.54 compared to the control (3.94). The Q10 values for soil N2O flux was increased by N fertilization without warming but was decreased by N fertilization with warming.
Soil CO2 flux was positively correlated with soil MBC, DOC and the microbial substrates utilization, and negatively correlated with soil NH4+-N. Soil N2O flux was positively correlated with the MSU and negatively correlated with soil NH4+-N (Figure 3).

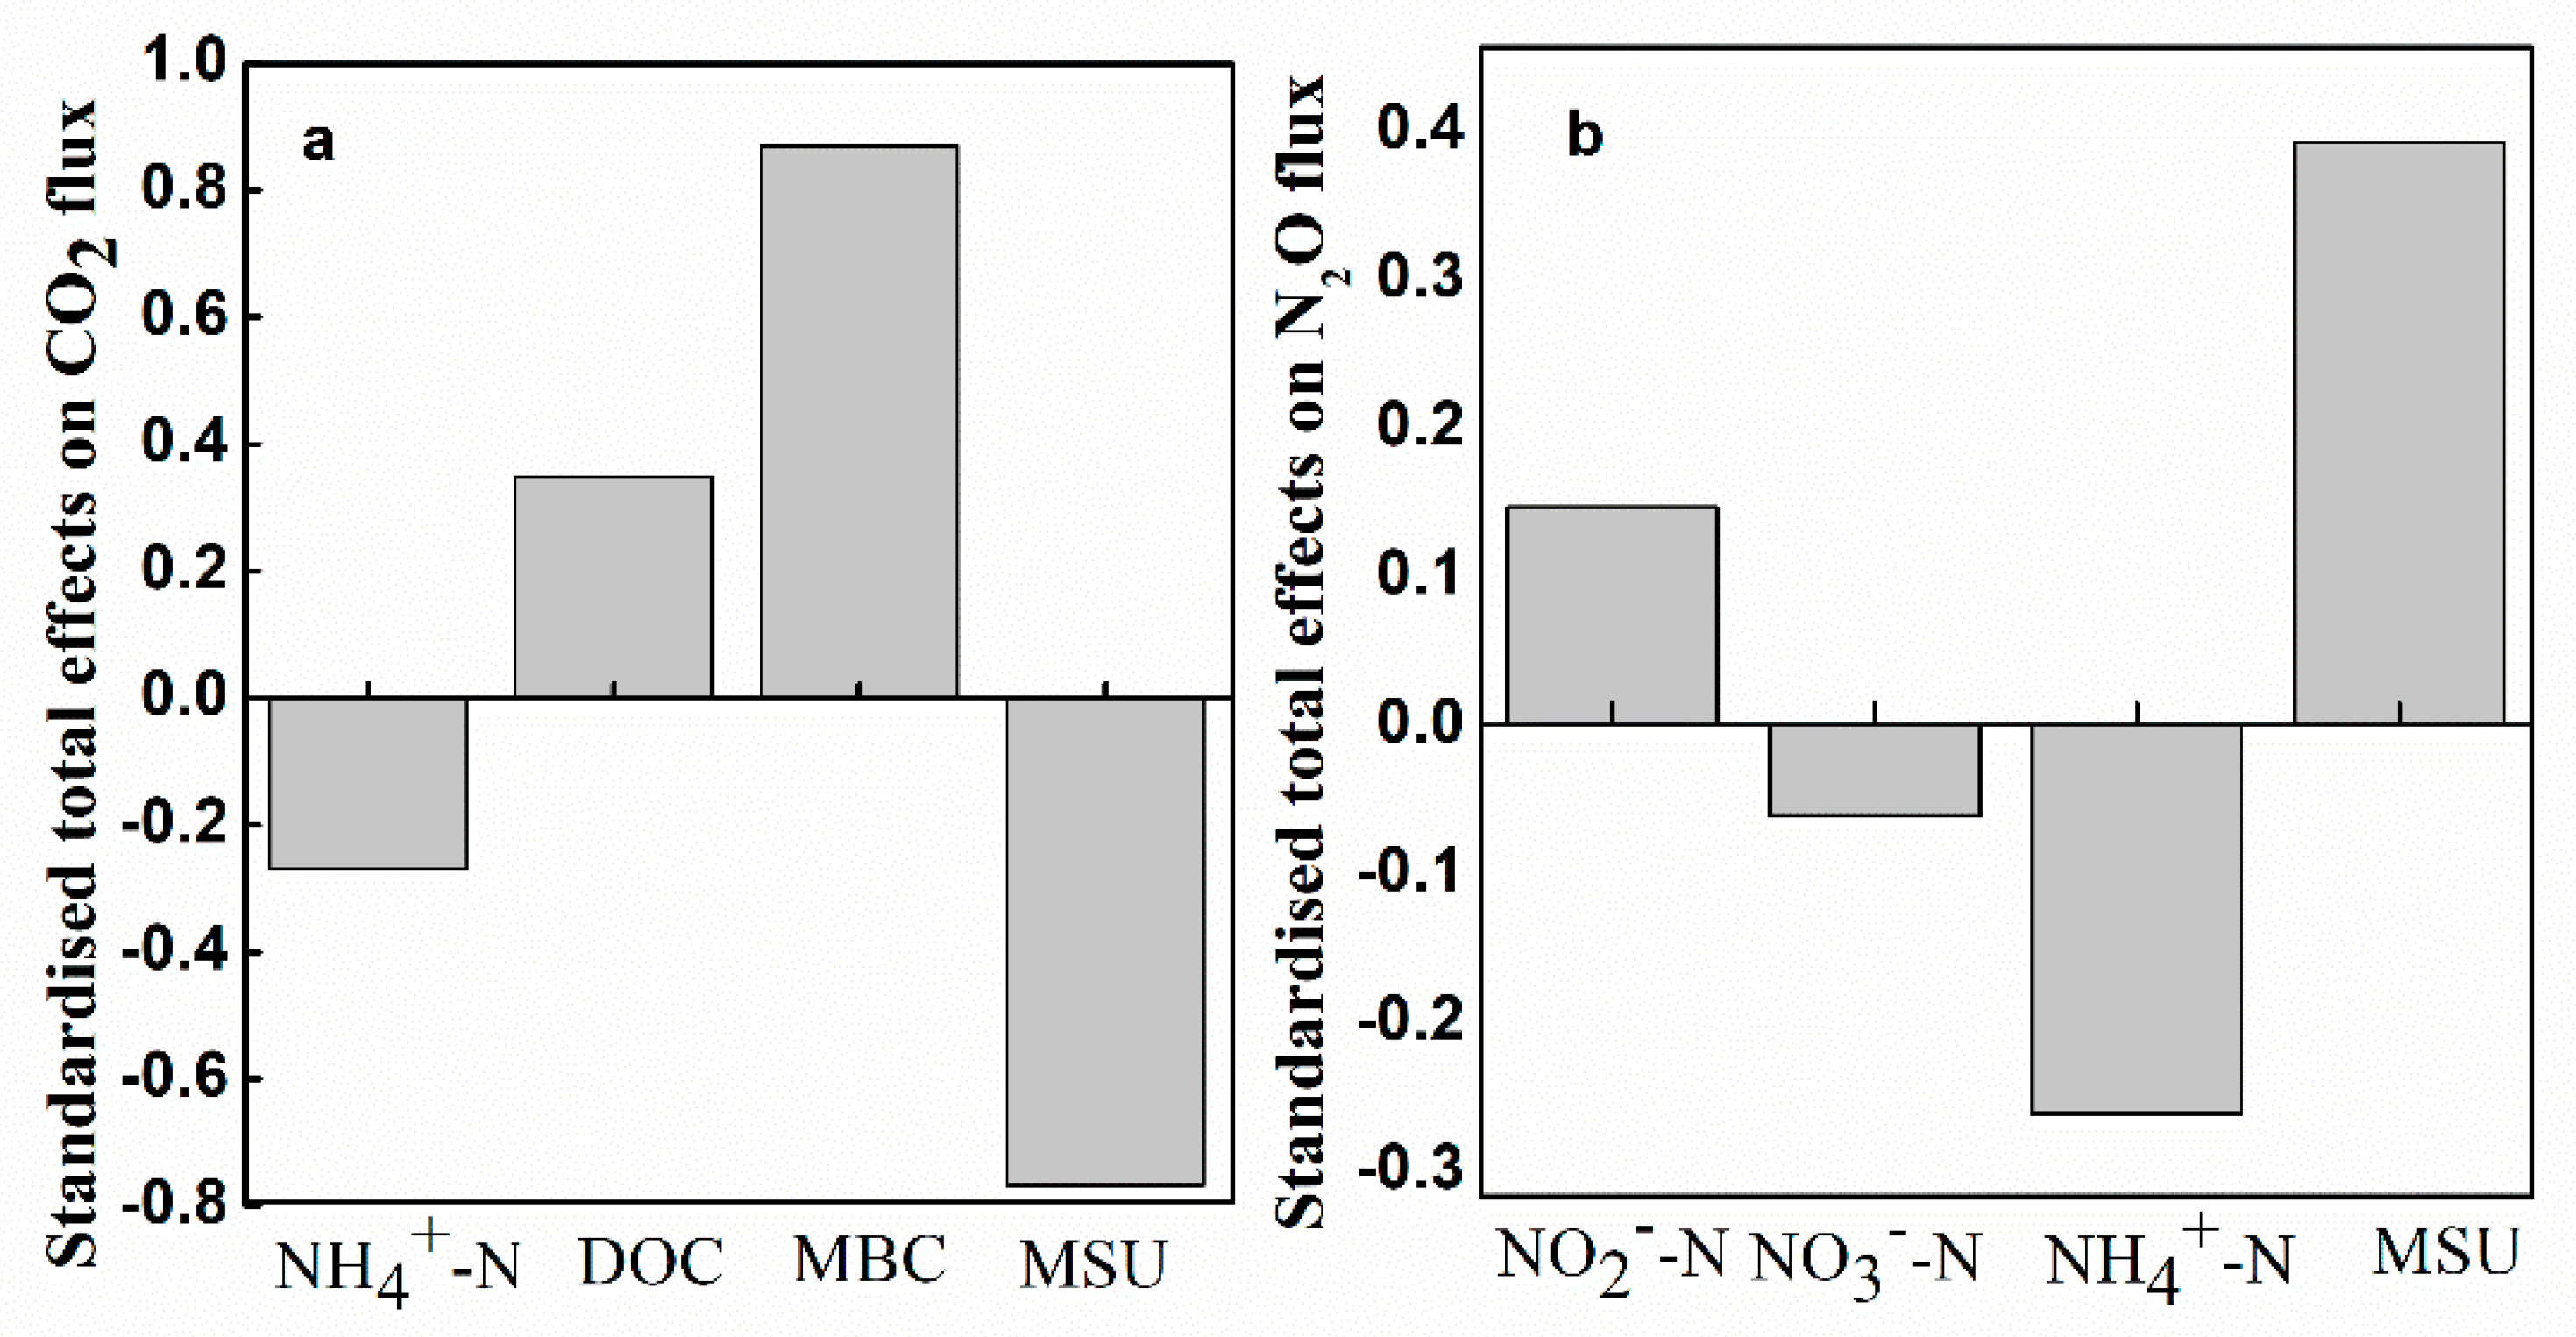
3.4. Contributions of Soil Variables to Soil CO2 and N2O Fluxes

To quantify the relative importance of the different controlling factors on soil CO2 and N2O fluxes, two structural equation modellings (SEMs) were constructed based on the known relationships between soil CO2 and N2O fluxes and their key drivers in soil. The SEM showed a better fit to our hypothesized causal relationships (χ2 = 2.82, p = 0.59, RMSEA) = 0.000, Figure 4a; χ2 = 0.81, p = 0.94, RMSEA = 0.000, Figure 4b). The models accounted for 63% and 22% of the variance of soil CO2 and N2O fluxes, respectively. Microbial substrates utilization patterns had dominant direct negative effect on soil CO2 flux and positive effect on N2O (Figure 5). Soil NH4+-N had negative effects on soil CO2 and N2O fluxes. DOC and MBC had indirect positive effects on soil CO2. In addition, soil NO3-N and NO2-N had indirect effects on soil N2O.

4. Discussion

4.1. Effects of Warming and Nitrogen Fertilization on Soil CO2 Flux

We found that warming decreased soil CO2 flux, while the N fertilization and its interaction with warming had no significant effect on soil CO2 flux (Figure 2a, Table 2). These results were quite different to some previous studies. For example, Zou et al. [5] and Xu et al. [37] found warming increases soil CO2 flux in spruce forests, and the effect of N fertilization on soil CO2 flux varied in forest plantations [12,38,39]. These differences were a consequence of the different soil properties and experimental conditions among these sites, as the interactions among climate, soil organisms, and vegetation, and the duration of experiment could influence soil CO2 flux [40].
Carbon quality and quantity could regulate the responses of soil CO2 flux to temperature. The decrease in soil respiration could be due to the consuming of labile C [41,42]. In this study, the experimental plots were filled with forest soil and spruce seedlings were planted in the plots. There was very limited C input compared to the forest plantation with mature trees. Consequently, the CO2 emission could be restricted by less carbon in the soil [7]. Indeed, SOC and MBC at the site were lower after eight years of warming, although soil DOC was enhanced in this study. Bossio et al. [43] also found similar results. Although SEM analysis showed that soil DOC had a positive effect on soil CO2 emission, the decreases in MBC had larger effect on soil CO2 emission than the increases in DOC (Figure 4a and Figure 5a). Overall, warming decreased soil CO2 emission.
Climate warming and N fertilization studies have mostly focused on the changes of microbial processes (respiration and N mineralization) [25,26]. Few studies have investigated the direct link of soil microbial community with soil CO2 flux. In this study, we found that microbial substrate utilization patterns had a direct negative effect on soil CO2 flux (Figure 4a and Figure 5a). This result suggested that there is an association of soil microbial community composition with the response of soil CO2 flux to warming and N fertilization, as different microbial communities had different sole substrate utilization patterns in the BIOLOG ECO-plate analysis [44]. The CCA analysis further showed that the MSU patterns were positively correlated with soil DOC and soil temperature in the CCA1 although they had contrast effects in the CCA2 (Figure 3). It suggested that climate warming could enhance the activity of the microbial community and the DOC, then reduce the quantity of SOC, and finally decrease soil CO2 emission. A similar result was reported by Walker et al. [43] who found that permanent warming accelerates microbial activity and causes more carbon loss from soil, and the soil carbon loss in return reduces soil microbial biomass and constrains the influence of microbes on the ecosystem. In this study, warming decreased the microbial metabolic activity represented by AWCD and uniformity of microbial community. The result further suggested that warming induced a shift of microbial community structure from bacteria to fungi. Since fungi have lower growth rates than bacteria on BIOLOG plates, higher fungal dominance may have lower color development rate, resulting in lower AWCD [17]. Consistently, the higher ratio of MBC/MBN in the warmed plots indicated that warming enhanced the fungi as the microbial biomass C/N ratio has been used as an indicator of changes in microbial community structure [45]. Since fungi have greater C assimilation efficiency compared to bacteria, warming decreased the CO2 release [17,46]. These findings highlighted the important contribution of soil microbial community to soil CO2 emission.
Moreover, soil carbon quality and quantity and microbes, soil N had a significant effect on soil CO2 flux. Previous studies showed that the soil N availability affects the soil C turnover by modifying microbial composition and activity or through its limitation on plant growth [47,48]. With sufficient C supply, an increase in N availability could stimulate the microbial activity, and accelerate SOC mineralization [49]. In this study, there was relatively a lack of soil C and no effect on microbial community induced by N fertilization. As a result, N fertilization did not affect the soil CO2 flux. One surprising finding was that soil NH4+-N had a negative effect on soil CO2 flux in this study (Figure 4a). The positive effect of soil NH4+ on soil CO2 flux had been reported in temperate and subtropical forests [12,50]. The difference between our study and the previous studies may be attributed to the following two reasons. One reason was that spruce prefers to absorb soil NO3-N than soil NH4+-N [51]. As NH4+ was strongly absorbed and held to cation exchange sites of SOC and clay minerals, it would lead to declines in labile C compounds and increases in complex C compounds [50,52]. Thus, soil NH4+ had a negative effect on soil DOC as shown in the SEM (Figure 4a). The second reason was that soil NH4+ had a negative relationship with the microbial substrate utilization (Figure 4), tended to inhibit soil microbial activity and community composition, and resulted in a decrease in the decomposition of SOC [50]. Therefore, soil NH4+ had a negative effect on soil CO2 flux in this study.

4.2. Effects of Warming and Nitrogen Fertilization on Soil N2O Flux

Previous studies showed strong positive correlations between soil temperature and N2O emission in temperate forests [53,54], but quite weak correlations in tropical forests [55,56]. In this study, we found that the soil N2O emission was slightly positively correlated with the soil temperature and warming did not significantly affect soil N2O flux in the subalpine plantation forest. However, applying N fertilization had a positive effect on soil N2O emission. These results suggested that the soil N condition rather than the temperature controls soil N2O emission. Consistent with our study, other studies also found that soil N2O emission increased with N addition in forests [57,58]. The reasons could be that high NO3 deposition provided additional N for denitrification and thus increased soil N2O emission. In this study, the fertilizer as NH4NO3 was added into the soil and resulted in an increase in soil NO3, but the SEM indicated that the soil NH4+ and NO2 were the key factors controlling soil N2O emission and soil NO3 had little effect on soil N2O. Furthermore, N fertilization had no effect on soil NH4+ and decreased soil NO2 which may result from enhanced nitrification of soil NH4+ and denitrification of soil NO2 by nitrifier. The resulting increase in soil N2O emission, with the depletion of soil NH4+, was probably not due to plant uptake as spruce prefers to uptake soil NO3 than NH4+ [51]. In theory, inorganic N, as the substrate for nitrification and denitrification processes, should be positively correlated with soil N2O emission regardless of N forms [14,57]. However, more soil NH4+ decreased the soil DOC (Figure 4a) and inhibited the soil microbiomes activity (Figure 4b). Since soil N2O emission was positively correlated with soil CO2 flux, soil NH4+ had the negative effect on soil N2O emission.
Soil microbe is another factor controlling soil N2O emission (Figure 4b). The analysis of SEM showed that the soil microbial substrate utilization pattern had a positive effect on soil N2O emission, which provided direct information that the soil microbial activity controls the soil N2O emission under global change. Several previous studies showed that climate change can impact N transformations and N2O emissions via indirect effects on the abundance of different microbial populations and microbial community structure [9,59]. For instance, Cantarel et al. [9] showed a stronger correlation of N2O fluxes with the soil denitrification activity and the nirK denitrifiers community. In this study, the method of the BIOLOG ECO plates identified soil microbial community and functional diversity mainly through carbon substrates, which may not be sensitive to N addition and may not directly reflect N transformation. Thus, MSU patterns was not affected by N fertilization in this study. Future study is needed to determine the relative importance of the specific microbial activities in nitrification and denitrification.
Furthermore, N condition and microbes, many other soil environmental factors such as soil moisture and soil pH may influence soil N2O emission [60]. In this study, soil moisture was not influenced by treatments as plots were monitored and watered as frequently as needed to eliminate the effects of soil moisture induced by warming. Seasonal variation of soil N2O flux could be influenced by soil moisture change. Soil pH varied slightly seasonally and among different treatments, and might not have a large influence on soil N2O emission. In addition, soil moisture and soil pH mainly affect the soil N availability and soil microbial activity and then indirectly influence soil N2O emission [60]. Thus, soil N condition and soil microbes were the main factors controlling soil N2O emission.

5. Conclusions

Eight years after continuous warming and N fertilization in a subalpine spruce plantation forest, we found that soil CO2 flux was decreased by warming while soil N2O flux was significantly increased by N fertilization and its interaction with warming. Warming enhanced the DOC and MSU pattern, reduced SOC and MBC, and further constrained the metabolic potential of soil microbes, uniformity index of microbial communities, and finally resulted in a decrease in soil CO2 emission. For soil N2O emission, the MSU pattern and soil NO2 had positive effects on soil N2O flux, while the soil NH4+ had a negative effect on soil N2O emission. Both for soil CO2 flux and N2O flux, the microbes played a more important role than other factors. This study revealed different response patterns and controls of soil CO2 and N2O fluxes in the subalpine plantation forest under climate warming and N deposition, and further highlighted the important contributions of soil microbes to GHG fluxes.

Author Contributions

Conceptualization, D.L. and Q.L.; Methodology, H.Y.; Software, Y.L.; Validation, D.L., Q.L., H.Y., Y.L., and D.H.; Formal analysis, Y.L. and D.H.; Investigation, D.L. and H.Y.; Resources, Q.L.; Data curation, D.L.; Writing—original draft preparation, D.L.; Writing—review and editing, D.L., Q.L., and D.H; Supervision, H.Y.; Project administration, D.L.; Funding acquisition, D.L. and Q.L.

Funding

This research was funded by the National Key R&D Program of China, 2017YFC0505002 and the China Scholarship Council, CSC201804910053.

Acknowledgments

We would like to express our gratitude to the Maoxian Ecological Station of the Chinese Academy of Sciences, Sichuan Province, China, who gave permission to conduct the experiment in this study.

Conflicts of Interest

The authors declare no conflict of interest.

References

  1. Trenberth, K.E. Stronger evidence of human influences on climate—The 2001 IPCC assessment. Environment 2001, 43, 8–19. [Google Scholar] [CrossRef]
  2. IPCC. Climate Change 2013: The Physical Science Basis; Cambridge University Press: Cambridge, UK; New York, NY, USA, 2013. [Google Scholar]
  3. Chen, X.P.; Wang, G.X.; Zhang, T.; Mao, T.X.; Wei, D.; Hu, Z.Y.; Song, C.L. Effects of warming and nitrogen fertilization on GHG flux in the permafrost region of an alpine meadow. Atmos. Environ. 2017, 157, 111–124. [Google Scholar] [CrossRef]
  4. Galloway, J.N.; Cowling, E.B. Reactive nitrogen and the world: 200 years of change. Ambio 2002, 31, 64–71. [Google Scholar] [CrossRef]
  5. Zou, J.L.; Tobin, B.; Luo, Y.Q.; Osborne, B. Differential responses of soil CO2 and N2O fluxes to experimental warming. Agric. For. Meteorol. 2018, 259, 11–22. [Google Scholar] [CrossRef]
  6. Wu, Z.T.; Dijkstra, P.; Koch, G.W.; Penuelas, J.; Hungate, B.A. Responses of terrestrial ecosystems to temperature and precipitation change: A meta-analysis of experimental manipulation. Glob. Chang. Biol. 2011, 17, 927–942. [Google Scholar] [CrossRef]
  7. Yin, H.J.; Xiao, J.; Li, Y.F.; Chen, Z.; Cheng, X.Y.; Zhao, C.Z.; Liu, Q. Warming effects on root morphological and physiological traits: The potential consequences on soil C dynamics as altered root exudation. Agric. For. Meteorol. 2013, 180, 287–296. [Google Scholar] [CrossRef]
  8. Bijoor, N.S.; Czimczik, C.I.; Pataki, D.E.; Billings, S.A. Effects of temperature and fertilization on nitrogen cycling and community composition of an urban lawn. Glob. Chang. Biol. 2008, 14, 2119–2131. [Google Scholar] [CrossRef] [Green Version]
  9. Cantarel, A.A.M.; Bloor, J.M.G.; Pommier, T.; Guillaumaud, N.; Moirot, C.; Soussana, J.F.; Poly, F. Four years of experimental climate change modifies the microbial drivers of N2O fluxes in an upland grassland ecosystem. Glob. Chang. Biol. 2012, 18, 2520–2531. [Google Scholar] [CrossRef]
  10. Hu, Y.G.; Chang, X.F.; Lin, X.W.; Wang, Y.F.; Wang, S.P.; Duan, J.C.; Zhang, Z.H.; Yang, X.X.; Luo, C.Y.; Xu, G.P.; et al. Effects of warming and grazing on N2O fluxes in an alpine meadow ecosystem on the Tibetan plateau. Soil Biol. Biochem. 2010, 42, 944–952. [Google Scholar] [CrossRef]
  11. Jassal, R.S.; Black, T.A.; Trofymow, J.A.; Roy, R.; Nesic, Z. Soil CO2 and N2O flux dynamics in a nitrogen-fertilized Pacific Northwest Douglas-fir stand. Geoderma 2010, 157, 118–125. [Google Scholar] [CrossRef]
  12. Geng, J.; Cheng, S.L.; Fang, H.J.; Yu, G.R.; Li, X.Y.; Si, G.Y.; He, S.; Yu, G.X. Soil nitrate accumulation explains the nonlinear responses of soil CO2 and CH4 fluxes to nitrogen addition in a temperate needle-broadleaved mixed forest. Ecol. Indic. 2017, 79, 28–36. [Google Scholar] [CrossRef]
  13. Huang, R.; Wang, Y.; Liu, J.; Li, J.; Xu, G.; Luo, M.; Xu, C.; Ci, E.; Gao, M. Variation in N2O emission and N2O related microbial functional genes in straw- and biochar-amended and non-amended soils. Appl. Soil Ecol. 2019, 137, 57–68. [Google Scholar] [CrossRef]
  14. Zhang, J.J.; Peng, C.H.; Zhu, Q.A.; Xue, W.; Shen, Y.; Yang, Y.Z.; Shi, G.H.; Shi, S.W.; Wang, M. Temperature sensitivity of soil carbon dioxide and nitrous oxide emissions in mountain forest and meadow ecosystems in China. Atmos. Environ. 2016, 142, 340–350. [Google Scholar] [CrossRef]
  15. Shrestha, R.K.; Strahm, B.D.; Sucre, E.B. Greenhouse gas emissions in response to nitrogen fertilization in managed forest ecosystems. New For. 2015, 46, 167–193. [Google Scholar] [CrossRef]
  16. Seo, J.; Jang, I.; Jung, J.Y.; Lee, Y.K.; Kang, H. Warming and increased precipitation enhance phenol oxidase activity in soil while warming induces drought stress in vegetation of an Arctic ecosystem. Geoderma 2015, 259, 347–353. [Google Scholar] [CrossRef]
  17. Zhang, W.; Parker, K.M.; Luo, Y.; Wan, S.; Wallace, L.L.; Hu, S. Soil microbial responses to experimental warming and clipping in a tallgrass prairie. Glob. Chang. Biol. 2005, 11, 266–277. [Google Scholar] [CrossRef]
  18. Qin, H.L.; Xing, X.Y.; Tang, Y.F.; Hou, H.J.; Yang, J.; Shen, R.; Zhang, W.Z.; Liu, Y.; Wei, W.X. Linking soil N2O emissions with soil microbial community abundance and structure related to nitrogen cycle in two acid forest soils. Plant Soil 2019, 435, 95–109. [Google Scholar] [CrossRef]
  19. Hogberg, P.; Hogberg, M.N.; Gottlicher, S.G.; Betson, N.R.; Keel, S.G.; Metcalfe, D.B.; Campbell, C.; Schindlbacher, A.; Hurry, V.; Lundmark, T.; et al. High temporal resolution tracing of photosynthate carbon from the tree canopy to forest soil microorganisms. New Phytol. 2008, 177, 220–228. [Google Scholar] [CrossRef]
  20. Djukic, I.; Zehetner, F.; Watzinger, A.; Horacek, M.; Gerzabek, M.H. In situ carbon turnover dynamics and the role of soil microorganisms therein: A climate warming study in an Alpine ecosystem. FEMS Microbiol. Ecol. 2013, 83, 112–124. [Google Scholar] [CrossRef]
  21. Gholz, H.L.; Wedin, D.A.; Smitherman, S.M.; Harmon, M.E.; Parton, W.J. Long-term dynamics of pine and hardwood litter in contrasting environments: Toward a global model of decomposition. Glob. Chang. Biol. 2000, 6, 751–765. [Google Scholar] [CrossRef]
  22. Wang, Y.S.; Cheng, S.L.; Fang, H.J.; Yu, G.R.; Yang, X.M.; Xu, M.J.; Dang, X.S.; Li, L.S.; Wang, L. Relationships between ammonia-oxidizing communities, soil methane uptake and nitrous oxide fluxes in a subtropical plantation soil with nitrogen enrichment. Eur. J. Soil Biol. 2016, 73, 84–92. [Google Scholar] [CrossRef]
  23. Martins, C.S.C.; Macdonald, C.A.; Anderson, I.C.; Singh, B.K. Feedback responses of soil greenhouse gas emissions to climate change are modulated by soil characteristics in dryland ecosystems. Soil Biol. Biochem. 2016, 100, 21–32. [Google Scholar] [CrossRef]
  24. Xu, Z.F.; Yin, H.J.; Xiong, P.; Wan, C.; Liu, Q. Short-term responses of Picea asperata seedlings of different ages grown in two contrasting forest ecosystems to experimental warming. Environ. Exp. Bot. 2012, 77, 1–11. [Google Scholar] [CrossRef]
  25. Zhao, C.; Zhu, L.; Liang, J.; Yin, H.; Yin, C.; Li, D.; Zhang, N.; Liu, Q. Effects of experimental warming and nitrogen fertilization on soil microbial communities and processes of two subalpine coniferous species in Eastern Tibetan Plateau, China. Plant Soil 2014, 382, 189–201. [Google Scholar] [CrossRef]
  26. Yin, H.J.; Li, Y.F.; Xiao, J.; Xu, Z.F.; Cheng, X.Y.; Liu, Q. Enhanced root exudation stimulates soil nitrogen transformations in a subalpine coniferous forest under experimental warming. Glob. Chang. Biol. 2013, 19, 2158–2167. [Google Scholar] [CrossRef]
  27. Zhang, Z.L.; Qiao, M.F.; Li, D.D.; Yin, H.J.; Liu, Q. Do warming-induced changes in quantity and stoichiometry of root exudation promote soil N transformations via stimulation of soil nitrifiers, denitrifiers and ammonifiers? Eur. J. Soil Biol. 2016, 74, 60–68. [Google Scholar] [CrossRef]
  28. Yin, H.J.; Chen, Z.; Liu, Q. Effects of experimental warming on soil N transformations of two coniferous species, Eastern Tibetan Plateau, China. Soil Biol. Biochem. 2012, 50, 77–84. [Google Scholar] [CrossRef]
  29. Cai, Y.J.; Wang, X.D.; Tian, L.L.; Zhao, H.; Lu, X.Y.; Yan, Y. The impact of excretal returns from yak and Tibetan sheep dung on nitrous oxide emissions in an alpine steppe on the Qinghai-Tibetan Plateau. Soil Biol. Biochem. 2014, 76, 90–99. [Google Scholar] [CrossRef]
  30. Liu, H.; Zhao, P.; Lu, P.; Wang, Y.S.; Lin, Y.B.; Rao, X.Q. Greenhouse gas fluxes from soils of different land-use types in a hilly area of South China. Agric. Ecosyst. Environ. 2008, 124, 125–135. [Google Scholar] [CrossRef]
  31. Walkley, A.; Black, L.A. An examination of the Dgtjareff method for determining soil organic matter, and a proposed modification of the chromic acid titration method. Soil Sci. 1934, 37, 29–38. [Google Scholar] [CrossRef]
  32. Li, Y.Q.; Qing, Y.X.; Lyu, M.K.; Chen, S.D.; Yang, Z.J.; Lin, C.F.; Yang, Y.S. Effects of artificial warming on different soil organic carbon and nitrogen pools in a subtropical plantation. Soil Biol. Biochem. 2018, 124, 161–167. [Google Scholar] [CrossRef]
  33. Cohen, J.B. Practical Organic Chemistry; Macmillan Collection Library: London, UK, 1910. [Google Scholar]
  34. Maynard, D.G.; Kalra, Y.P. Nitrate and exchangeable ammonium nitrogen. In Soil Sampling and Methods of Analysis; Carter, M.R., Ed.; Lewis: Edmonton, AB, Canada, 1993. [Google Scholar]
  35. Vance, E.D.; Brookes, P.C.; Jenkinson, D.S. An Extraction Method for Measuring Soil Microbial Biomass-C. Soil Biol. Biochem. 1987, 19, 703–707. [Google Scholar] [CrossRef]
  36. Dijkstra, F.A.; Morgan, J.A.; Follett, R.F.; Lecain, D.R. Climate change reduces the net sink of CH4 and N2O in a semiarid grassland. Glob. Chang. Biol. 2013, 19, 1816–1826. [Google Scholar] [CrossRef]
  37. Xu, Z.F.; Wan, C.A.; Xiong, P.; Tang, Z.; Hu, R.; Cao, G.; Liu, Q. Initial responses of soil CO2 efflux and C, N pools to experimental warming in two contrasting forest ecosystems, Eastern Tibetan Plateau, China. Plant Soil 2010, 336, 183–195. [Google Scholar] [CrossRef]
  38. Zhang, J.J.; Li, Y.F.; Chang, S.X.; Qin, H.; Fu, S.L.; Jiang, P.K. Understory management and fertilization affected soil greenhouse gas emissions and labile organic carbon pools in a Chinese chestnut plantation. For. Ecol. Manag. 2015, 337, 126–134. [Google Scholar] [CrossRef]
  39. Deng, Q.; Zhou, G.; Liu, J.; Liu, S.; Duan, H.; Zhang, D. Responses of soil respiration to elevated carbon dioxide and nitrogen addition in young subtropical forest ecosystems in China. Biogeosciences 2010, 7, 315–328. [Google Scholar] [CrossRef] [Green Version]
  40. Barrena, I.; Menéndez, S.; Duñabeitia, M.; Merino, P.; Stange, C.F.; Spott, O.; González-Murua, C.; Estavillo, J.M. Greenhouse gas fluxes (CO2, N2O and CH4) from forest soils in the Basque Country: Comparison of different tree species and growth stages. For. Ecol. Manag. 2013, 310, 600–611. [Google Scholar] [CrossRef]
  41. Luo, Y.Q.; Wan, S.Q.; Hui, D.F.; Wallace, L.L. Acclimatization of soil respiration to warming in a tall grass prairie. Nature 2001, 413, 622–625. [Google Scholar] [CrossRef]
  42. Oechel, W.C.; Vourlitis, G.L.; Hastings, S.J.; Zulueta, R.C.; Hinzman, L.; Kane, D. Acclimation of ecosystem CO2 exchange in the Alaskan Arctic in response to decadal climate warming. Nature 2000, 406, 978–981. [Google Scholar] [CrossRef]
  43. Walker, T.W.N.; Kaiser, C.; Strasser, F.; Herbold, C.W.; Leblans, N.I.W.; Woebken, D.; Janssens, I.A.; Sigurdsson, B.D.; Richter, A. Microbial temperature sensitivity and biomass change explain soil carbon loss with warming. Nat. Clim. Chang. 2018, 8. [Google Scholar] [CrossRef]
  44. Bossio, D.A.; Scow, K.M. Impact of Carbon and Flooding on the Metabolic Diversity of Microbial Communities in Soils. Appl. Environ. Microb. 1995, 61, 4043–4050. [Google Scholar]
  45. Paul, E.A.; Clark, F.E. Soil Microbiology and Biochemistry; Academic Press: San Diego, CA, USA, 1989. [Google Scholar]
  46. Sakamoto, K.; Oba, Y. Effect of Fungal to Bacterial Biomass Ratio on the Relationship between CO2 Evolution and Total Soil Microbial Biomass. Biol. Fert. Soils 1994, 17, 39–44. [Google Scholar] [CrossRef]
  47. Chen, R.R.; Senbayram, M.; Blagodatsky, S.; Myachina, O.; Dittert, K.; Lin, X.G.; Blagodatskaya, E.; Kuzyakov, Y. Soil C and N availability determine the priming effect: Microbial N mining and stoichiometric decomposition theories. Glob. Chang. Biol. 2014, 20, 2356–2367. [Google Scholar] [CrossRef]
  48. Fisk, M.; Santangelo, S.; Minick, K. Carbon mineralization is promoted by phosphorus and reduced by nitrogen addition in the organic horizon of northern hardwood forests. Soil Biol. Biochem. 2015, 81, 212–218. [Google Scholar] [CrossRef]
  49. Qiu, Q.Y.; Wu, L.F.; Ouyang, Z.; Li, B.B.; Xu, Y.Y.; Wu, S.S.; Gregorich, E.G. Priming effect of maize residue and urea N on soil organic matter changes with time. Appl. Soil Ecol. 2016, 100, 65–74. [Google Scholar] [CrossRef]
  50. Wang, Y.S.; Cheng, S.L.; Fang, H.J.; Yu, G.R.; Xu, X.F.; Xu, M.J.; Wang, L.; Li, X.Y.; Si, G.Y.; Geng, J.; et al. Contrasting effects of ammonium and nitrate inputs on soil CO2 emission in a subtropical coniferous plantation of southern China. Biol. Fert. Soils 2015, 51, 815–825. [Google Scholar] [CrossRef]
  51. TingTing, Z.; ZILiang, Z.; Na, L.; YuanShuang, Y.; DongHui, Z.; Qin, L.; HuaJun, Y. Differential uptakes of different forms of soil nitrogen among major tree species in subalpine coniferous forests of western Sichuan, China. Chin. J. Plant Ecol. 2017, 41, 1051–1059. [Google Scholar]
  52. Fang, H.J.; Cheng, S.L.; Yu, G.R.; Xu, M.J.; Wang, Y.S.; Li, L.S.; Dang, X.S.; Wang, L.; Li, Y.N. Experimental nitrogen deposition alters the quantity and quality of soil dissolved organic carbon in an alpine meadow on the Qinghai-Tibetan Plateau. Appl. Soil Ecol. 2014, 81, 1–11. [Google Scholar] [CrossRef]
  53. Schindlbacher, A.; Zechmeister-Boltenstern, S.; Butterbach-Bahl, K. Effects of soil moisture and temperature on NO, NO2, and N2O emissions from European forest soils. J. Geophys. Res.-Atmos. 2004, 109. [Google Scholar] [CrossRef]
  54. Wu, X.; Bruggemann, N.; Gasche, R.; Shen, Z.Y.; Wolf, B.; Butterbach-Bahl, K. Environmental controls over soil-atmosphere exchange of N2O, NO, and CO2 in a temperate Norway spruce forest. Glob. Biogeochem. Cycles 2010, 24, 45. [Google Scholar] [CrossRef]
  55. Kiese, R.; Butterbach-Bahl, K. N2O and CO2 emissions from three different tropical forest sites in the wet tropics of Queensland, Australia. Soil Biol. Biochem. 2002, 34, 975–987. [Google Scholar] [CrossRef]
  56. Werner, C.; Kiese, R.; Butterbach-Bahl, K. Soil-atmosphere exchange of N2O, CH4, and CO2 and controlling environmental factors for tropical rain forest sites in western Kenya. J. Geophys. Res.-Atmos. 2007, 112, 71. [Google Scholar] [CrossRef]
  57. Yan, J.H.; Zhang, W.; Wang, K.Y.; Qin, F.; Wang, W.T.; Dai, H.T.; Li, P.X. Responses of CO2, N2O and CH4 fluxes between atmosphere and forest soil to changes in multiple environmental conditions. Glob. Chang. Biol. 2014, 20, 300–312. [Google Scholar] [CrossRef]
  58. Venterea, R.T.; Groffman, P.M.; Verchot, L.V.; Magill, A.H.; Aber, J.D.; Steudler, P.A. Nitrogen oxide gas emissions from temperate forest soils receiving long-term nitrogen inputs. Glob. Chang. Biol. 2003, 9, 346–357. [Google Scholar] [CrossRef]
  59. Barnard, R.; Leadley, P.W.; Hungate, B.A. Global change, nitrification, and denitrification: A review. Glob. Biogeochem. Cycles 2005, 19, 152. [Google Scholar] [CrossRef]
  60. Signor, D.; Cerri, C.E.P. Nitrous oxide emissions in agricultural soils: A review. Pesq. Agropec. Trop. 2013, 43, 322–338. [Google Scholar] [CrossRef]
Figure 1. Canonical correspondence analysis (CCA) ordination biplot of treatment plot scores, Biolog substrates, and significant environmental variables. Arrows indicate the direction and relative importance (arrow length) of the environmental variable. Substrates with approximate correlation coefficient >0.20 to the environmental variables are labelled. W0N0: Ambient temperature without nitrogen fertilization; W0N: Ambient temperature with nitrogen fertilization; WN0: Warming without nitrogen fertilization; WN: Warming with nitrogen fertilization. Environmental variables in CCA1 and CCA2 explain 93% and 95%, respectively.
Forests 10 00808 g001
Figure 2. Seasonal changes of soil CO2 (a) and N2O fluxes (b) affected by warming and nitrogen fertilization. W0N0: Ambient temperature without nitrogen fertilization; W0N: Ambient temperature with nitrogen fertilization; WN0: Warming without nitrogen fertilization; WN: Warming with nitrogen fertilization.
Forests 10 00808 g002
Figure 3. Relationships between the fluxes of soil CO2 and soil temperature (a), MBC (c), DOC (e), soil NH4+ (f) and soil microbial substrates utilization (g), and between the fluxes of soil N2O and soil temperature (b), soil NH4+ (d), and carbon utilization of microbial communities (h) in the different treatments. Q10 values with different lowercase letters indicate significant difference at p < 0.05. W0N0: Ambient temperature without nitrogen fertilization; W0N: Ambient temperature with nitrogen fertilization; WN0: Warming without nitrogen fertilization; WN: Warming with nitrogen fertilization. Different lowercase letters in Figure 3a represent significant differences (p < 0.05) between the treatments using least square difference (LSD) method. Significant * p < 0.05, ** p < 0.01, *** p < 0.001.
Forests 10 00808 g003
Figure 4. Result of structural equation modelling (SEM) to assess the direct and indirect effects of soil carbon, nitrogen, and microbial properties on soil CO2 (a) and N2O fluxes (b). Single-headed arrows indicate the hypothesized direction of causation. Double-headed arrows represent covariance between related variables. Arrow width is proportional to the strength of the relationship. The numbers adjacent to arrows are standardized path coefficient, which reflect the effect size of the relationship. R2 value represent the proportion of variance explained for each endogenous variable. Significant * p < 0.05, ** p < 0.01, *** p < 0.001.
Forests 10 00808 g004
Figure 5. Standardized total effects of soil variables on soil CO2 (a) and N2O fluxes (b) derived from structural equation modelling (SEM). MSU: Microbial substrate utilizations; DOC: Dissolved organic C; MBC: Microbial biomass C.
Forests 10 00808 g005
Table 1. Factorial ANOVA results (p-values) of the effects of season, warming, nitrogen fertilization, as well as their interactions on the soil properties and microbial function diversity. MBC: Microbial biomass C, MBN: Microbial biomass N, SOC: Soil organic C, DOC: Dissolved organic C, TN: Total N, AWCD: Average well color development, H: Shannon diversity index, U: Uniformity.
TreatmentsNO3-NNH4+-NNO2-NTNSOCDOCMBCMBNMBC/MBNAWCDHU
Season (S)<0.001<0.001<0.001<0.001<0.001<0.001<0.001<0.001<0.0010.001<0.0010.010
Warming (W)<0.0010.756<0.001<0.001<0.001<0.001<0.001<0.001<0.0010.0090.4610.006
Nitrogen (N)<0.0010.103<0.0010.009<0.001<0.001<0.001<0.001<0.0010.2370.9530.276
S × W<0.0010.322<0.001<0.001<0.001<0.001<0.001<0.001<0.001<0.0010.032<0.001
S × N<0.0010.0080.0400.365<0.001<0.001<0.001<0.001<0.0010.0020.0130.006
W ×N0.5650.0110.0590.015<0.0010.0020.003<0.001<0.0010.0160.1150.032
S × W × N<0.0010.209<0.0010.080<0.001<0.001<0.001<0.001<0.0010.0010.0020.004
Table 2. Mean annual fluxes of CO2 (mg m−2 h−1), N2O (µg N m−2 h−1) (means + SE) and the cumulative global warming potential (GWP) from CO2 and N2O fluxes (kg CO2 hm−2 year−1) as affected by treatments.
VariablesTreatmentCO2N2O
FluxesW0N036.04 ± 3.77 ab0.51 ± 0.11 a
WN027.90 ± 3.14 a0.65 ± 0.27 a
W0N46.08 ± 5.39 b4.68 ± 1.61 b
WN29.07 ± 3.29 a2.02 ± 0.32 b
GWPW0N09984 ± 321 ab20.31 ± 3.02 a
WN07800 ± 844 a25.63 ± 10.33 a
W0N12748 ± 2110 b208.8 ± 56.37 b
WN8002 ± 282 a79.88 ± 8.90 b
ANOVA (F values)Warming8.97 *4.52
N fertilization1.6417.47 **
Warming ∗ N fertilization1.275.34 *
Different lowercase letters represent significant differences (p < 0.05) between the treatments analyzed by least-significant difference (LSD). Significant * p < 0.05, ** p < 0.01, *** p < 0.001.

