Article

Effects of Long-Term Successive Rotations, Clear-Cutting and Stand Age of Prince Rupprecht’s larch (Larix principis-rupprechtii Mayr) on Soil Quality

1
Key Laboratory for Silviculture and Conservation of the Ministry of Education, College of Forestry, Beijing Forestry University, Beijing 100083, China
2
Department of Natural Resources, Cornell University, New York, NY 14853, USA
3
Beijing Hangtian Wanyuan Landscape Environment Greening Engineering Co., Ltd., Beijing 100076, China
4
National Energy R&D Center for Non-Food Biomass, Beijing Forestry University, Beijing 100083, China
*
Author to whom correspondence should be addressed.
Forests 2019, 10(10), 932; https://doi.org/10.3390/f10100932
Submission received: 5 August 2019 / Revised: 7 October 2019 / Accepted: 8 October 2019 / Published: 22 October 2019

Abstract

:
A decline in soil quality is a major factor contributing to the degradation of forest ecological function. Vegetation plays a vital role in maintaining soil quality; however, the influence of plantation length on soil quality remains unclear. In this study, we collected soil samples in Northern China using a space-for-time substitution method. Soil were collected from control grassland; a clear-cutting site; 16-year-old (young, first, and second generation), 28-year-old (immature, first, and second generation), and 44-year-old (mature, first generation) Larix principis-rupprechtii Mayr stands in May, July, and September 2016. We measured soil physical and chemical properties, microbial communities, and enzymatic activities. We selected soil bulk density, non-capillary porosity, volume humidity, soil organic carbon and activity of polyphenol oxidase to calculate a soil quality index (SQI) for each site. Our data indicated that clear-cutting greatly decreased soil quality of Larix principis-rupprechtii forests but returning the harvesting residues to the forest floor could reduce the negative impact of clear-cutting on soil quality. The soil quality improved significantly by prolonging the cultivation cycle and it took about 39 years for the first-generation forest to restore soil quality to the level of the control plot. Our study confirms that SQI provides a comprehensive measurement of soil quality with the identification of a minimum data set. Comparing SQI with other soil quality indicators would help us to optimize the method for assessing soil quality.

1. Introduction

Soil degradation is a global problem in the 21st century [1]. Declining soil quality leads to the disruption of normal ecosystem functions and a reduction in ecosystem services [2]. From 1950 to 2010, soil ecosystem services were degraded by 60% [3], and accelerated soil degradation was reported to globally affect around 33% of the earth’s land surface [4]. One potential cause of soil degradation is plantation forestry since repeated harvest and successive replanting can result in the depletion of soil nutrients [5,6]. The high nutrient demands of some tree species [7,8] may eventually lead to a decrease in soil quality [9]. Therefore, to maintain the productivity of forests, urgent action is needed to assess the impact of successive cultivation of timber forests on soil quality.
The selection of soil quality indicators should be based on the comprehensive evaluation of soil functions and ecological services [10]. Some studies have evaluated soil quality with soil chemistry [11,12,13], in particular, soil organic carbon (SOC) and nitrogen content [14]. Some other works have assessed soil quality only in terms of biological properties, such as microarthropod communities, without regarding chemical or physical properties or both [15,16,17]. These studies only reflect the limited aspects of soil quality. Ideally, soil quality indicators should take physical properties, chemical properties, biological communities, enzyme activities, and the interactions among these indicators into account [18]. A more comprehensive and easy-to-understand soil quality index (SQI) has been proposed for quantifying the combined physical, chemical, and biological properties of soil and their response to soil management practices [19].
Soil quality and forest stand management can affect each other [20]. The impact of forest growth on soil quality has been extensively studied in fast-growing plantation forests [6]. However, soil quality changes in successive rotations have been rarely investigated in timber forests with long growth cycles. The contribution of soil quality to ecosystem services is closely linked to forest management activities. In some situations, forest management results in complex interactive effects on soil properties [21]. Many works have evaluated the effects of clear-cutting on soil quality [22,23,24,25]; however, few studies have reported the SQI approach by considering forest stand growth (stand age and forest generation), human management (afforestation and clear-cutting), afforestation-stand growth-timber harvest, continuous variation of forest land.
Larix principis-rupprechtii is one of the main afforestation species in China due to its wide ecological plasticity, rapid growth, high-quality wood products, and strong stress resistance. We explored the application of the SQI approach to evaluate the effects of forest plantation management on soil health in Northern China. We quantified a suite of soil properties and evaluated the SQI of a reference grassland and a series of Larix principis-rupprechtii forest plantations, including first-generation 16-year-old (young), 28-year-old (immature) and 44-year-old (mature) forests, a clear-cutting site, and second-generation 16-year-old (young) and 28-year-old (immature) forests. The changes in soil quality were investigated by measuring the physical and chemical properties, the microbial communities, and the extracellular enzyme activity of soil. We aimed to advise forest management planning to maintain soil health and sustainability. We expected (1) that the soil quality would improve with an increase in stand age; (2) that the soil quality would decline by the change of successive forest generations; and (3) that clear-cutting would decrease soil quality.

2. Materials and Methods

2.1. Study Area

This experiment was carried out in Saihanba National Forest Park (SNFP), Weichang Manchu and Mongolian Autonomous County, Hebei Province, China (E 116°51′–117°39′, N 42°02′–42°36′). The elevation of the study sites was from 1600 to 1800 m. The area has a semi-arid monsoon climate and is located in the cool temperate zone with a mean annual temperature of −1.5 °C, a maximum annual temperature of 29.7 °C, and a minimum annual temperature of −38.7 °C. The mean annual rainfall is 433 mm, concentrated from June to August. Study sites are characterized as mainly gray forest soils, predominantly consisting of sand, since about 65% of the soils are sand silt. The carbon (C): nitrogen (N) ratio is 8.9 ± 0.3, and the soil parent materials are eluvium, saprolite, and alluvium; the thickness of the surface organic layer of each stand was about 3–8 cm [26]. Larix principis-rupprechtii is the dominant tree species in the coniferous forest belt of Northern China [27], and the plantation area accounts for 77.1% of the total plantation area in SNFP.

2.2. Experimental Design and Sampling

The experimental site was originally native grassland dominated by Maianthemum bifolium and Saussurea japonica. A reference grassland plot (abbreviated as CG) represented the sites on which the forest plantations of Larix principis were established. The forest plantations included the first-generation 16-year-old (young, abbreviated as 1G-16YR), 28-year-old (immature, abbreviated as 1G-28YR), and 44-year-old (mature, abbreviated as 1G-44YR) stands; the second-generation 16-year-old (young, abbreviated as 2G-16YR) and 28-year-old (immature, abbreviated as 2G-28YR) stands; and a clear-cutting site (CC) where a mature, i.e., 44-year old, first-generation plantation was harvested in 45 years. The CG plot had never been planted with any trees and had no human disturbance. The 2G-16YR and 2G-28YR were plots where 3-year-old Larix principis-rupprechtii seedlings were planted after clear-cutting of mature plantations 13 and 25 years earlier respectively. The woodland was plowed the year before afforestation; in the year of afforestation, the woodland was excavated by a tree planting digger, and the seedlings were planted. The first five years after afforestation, workers used a mower to cut grass in the woodlands. After clear-cutting, we also employed a tracked grab wood machine to remove the timber from the woodland. Unfortunately, no 44-year-old second-generation stands were available in the SNFP. All the sites used in the present study were located in similar soil and landscape.
In May 2015, five 20 m × 20 m quadrats were established in a grid within each of the seven types of plots, totaling 35 plots. More information is provided in Table 1.
In May, July, and September 2016, the soils from the top 0–10 cm, 10–20cm and 20–30 cm layers were collected from the study sites in one day. Ten soil cores were collected at randomly selected points from each plot with a 3.6-cm-diameter soil auger, and the samples from different depths at the same location were mixed together as a composite sample, thereby totaling ten composite samples. Stones and roots were removed from the soil samples by hand, and the samples were sieved through 2-mm sieves. Five soil samples were stored at 4 °C to analyze the soil microbial biomass and enzyme activity, and the remaining samples were oven-dried at 105 °C to reach a constant dry weight for chemical analysis.

2.3. Physical Analysis

Soil bulk density (SBD) was determined by the intact core method [28,29], and soil capillary porosity (CP) was subsequently calculated using Equation (1) [30]. Soil non-capillary porosity (NCP) was also assessed by employing Equation (2) [31]. Moreover, Equation (3) was utilized to quantify total soil porosity (TP) based on NCP and CP [32], and soil ventilation (SV) was measured by Equation (4); Equation (5) estimated volume humidity (VH). Soil water content (SWC) and saturated soil water content (SSWC) were also measured according to the gravimetric method [33]. Capillary water capacity (CWC) was characterized by the method of Rowell [34], and field capacity (FC) was analyzed using a pressure plate apparatus [35,36].
CP = CWC × SBD v × 100
NCP = SSWC CWC SBD
TP = NCP + CP
SV = VH TP
VH = SWC × SBD
where CP (%), CWC (%), SBD (g cm−3), V (cm3), and NCP (%) represent capillary porosity, capillary water capacity, the soil bulk density, the volume of the soil core, and non-capillary porosity, respectively; SSWC (%), TP (%), SV (%), VH (%), and SWC (%) stand for the saturated soil water content, the soil total porosity, the soil ventilation, volume humidity, and the soil water content, respectively.

2.4. Chemical Analysis

The soil pH was measured in deionized water by a Delta320 pH-meter using a slurry having a soil to water ratio of 2:5 (Mettler-Toledo Instruments, Shanghai Co., Ltd., Shanghai, China). The SOC was also evaluated using Walkley and Black wet oxidation method as outlined in Bao’s work [37]. Moreover, the total nitrogen (TN) of the soil was digested by concentrated sulfuric acid (98% H2SO4), and the available phosphorus (AP) extracted from soil by employing hydrochloric acid-ammonium fluoride (HCl+NH4F) was determined by AA3 HR AutoAnalyzer (Seal Analytical Ltd., Southampton, UK). The total potassium (TK) of the soil was extracted using concentrated sulfuric acid (98% H2SO4) and measured by Lumina3300 (Aurora Biomed Inc., Vancouver, BC, Canada).

2.5. Microbial Properties

Soil samples for soil microorganism analysis were passed through a 1-mm sieve and stored in a ziplock bag at 4 °C. The soil microbes were assessed using dilution plate counting [38], and five replicates were performed on each sample. Bacteria were cultured in a medium of beef-extracted peptone agar. Actinomycetes and fungi were respectively cultured using a modified Gaussian medium and Martin’s agar medium; the culture temperature was 28 °C. The bacteria and actinomycetes were cultured for 3–5 days and the fungi were cultured for 5–7 days.

2.6. Soil Enzyme Activity

The activity of catalase and polyphenol oxidase (PPO) activities were measured by potassium permanganate titration and pyrogallol colorimetry according to Waldrop et al. [39]. Soil urease activity was also assessed by sodium phenol colorimetry according to Kandeler and Gerber [40].

2.7. Statistical Analysis

The SQI was calculated according to Andrews and Carroll [18], and three steps were involved in the elaboration of the quality index: (1) the identification of a minimum data set (MDS), (2) the assignment of a score to each indicator by linear scoring functions, and (3) the data integration into an index.
Three steps were used to identify the MDS. (1) Data screening: one-way analysis of variance (ANOVA) was performed on the physical, chemical, and biological properties and the enzyme activities of the soil. Then, the variables exhibiting significant differences among treatments (p < 0.05) were chosen for the next step. (2) Selection of representative variables: the principal component analysis (PCA, see Supplementary Material, Table S1) was performed on the variables chosen from step (1). Only the principal component (PC) explained greater than 5% and eigenvalues ≥ 1 were examined. Within each PC, only the factors weighted with absolute values within 10% of the highest weight were retained for the MDS. (3) Redundancy reduction: multivariate correlation coefficients were used to determine the strength of the relationships among the variables. Highly correlated variables (correlation coefficient > 0.70) were considered redundant and nominated to be eliminated from the data set. To choose variables within the well-correlated groups, we summed the absolute values of the correlation coefficients for these variables. It was assumed that the variable with the highest correlation sum represents the group best. Any uncorrelated, highly weighted variable was considered important and retained in the MDS.
Linear scoring was applied in this study following the approach of Andrews and Carroll [18]. The linear scoring function (Equation (6)) was used to convert the measured values to the scored values as follows [41]:
S i j = V i j V i m i n V i m a x V i m i n
where Sij is the score of soil variable i of sample j, and Vij represents the observed variable value of sample j; Vimax and Vimin stand for the highest value of variable i and the lowest value of variable i, respectively. The scores of the indicators in the MDS (Table 2) were integrated into an SQI (Equation (7)) according to the work of Andrews et al. [42], as follows:
SQI = i = 1 n ( S i × Q ( x i ) )
where Si is the score assigned to indicator i, and Q(xi) denotes the scoring result of each soil quality factor; n represents the number of indicators included in the MDS.
One-way analysis of variance (ANOVA) was utilized to judge the significant differences among the physical, chemical, and biological properties of the soil, among the enzyme activity of the soil, and among the SQI of these treatments for the seven types of the forest lands. First, Shapiro-Wilk test and Levene test were used to respectively verify the assumptions of the normality and homogeneity of variance of the data on each variable; Duncan test was then used for a multiple comparison analysis. All the statistics calculation was conducted using PASW Statistics 18 (IBM, Armonk, NY, USA) with the level of significance set at p < 0.05. A p-value smaller than 0.05 indicates that the possibility of assumption is greater than 95%, and a p-value less than 0.01 in the following denotes that the possibility of assumption is greater than 99%. All the figures were also generated using Origin 8 (Origin Lab, Northampton, MA, USA).

3. Results

3.1. Soil Physical Properties

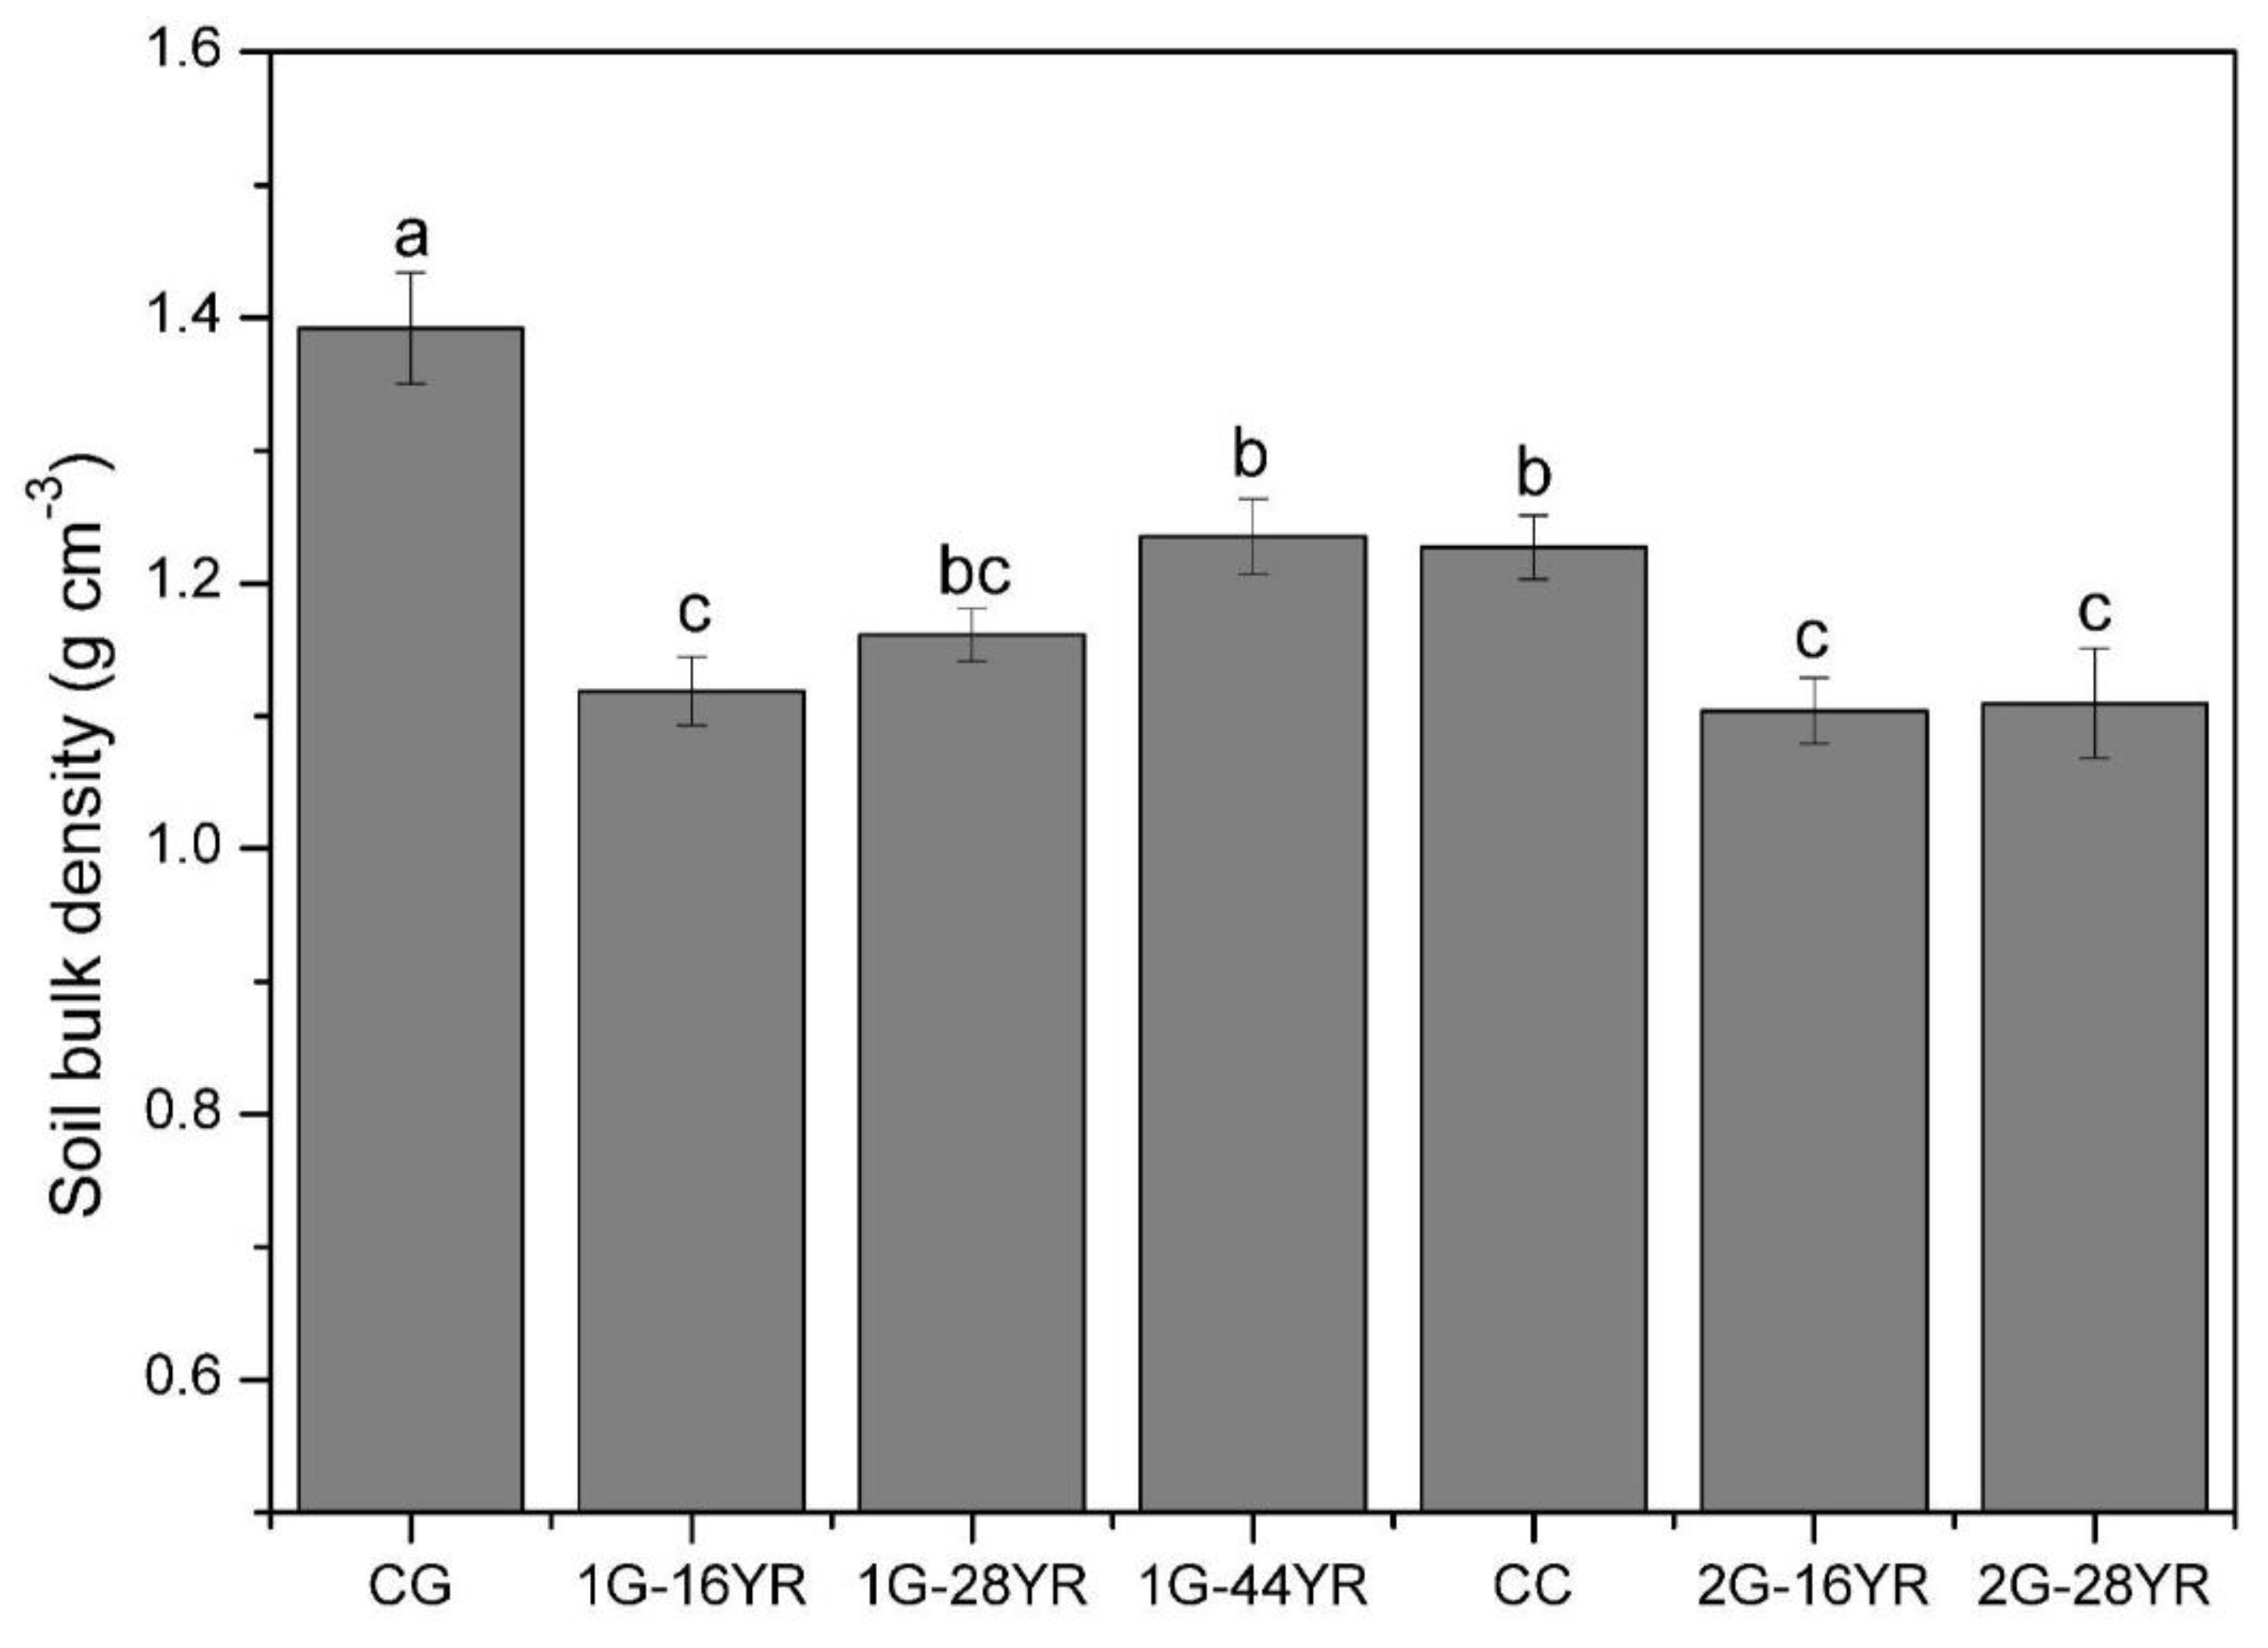
3.1.1. Soil Bulk Density

As shown in Figure 1, SBD was significantly higher in CG plot (1.39 g cm−3) among the seven types of plots. After the initial afforestation, the sample SBD dropped significantly, i.e., the SBD of 1G-16YR was 1.12 g cm−3. The SBD of the first-generation forest was enhanced with an increase in stand age. The SBD of the mature forest wood (1.24 g cm−3) was also higher than that of the other stands. Moreover, there was no significant difference in SBD before and after clear-cutting. The SBD of the 2G-16YR plot (1.10 g cm−3) was significantly lower than that of CC plots. The SBD of the second-generation forest still rose with an increase in stand age, but the SBD of CC was significantly dropped by 11.85% compared to CG. In this study, the difference in the SBD of the soils of the seven types of plots was significant (p < 0.01).

3.1.2. Soil Porosity

TP and NCP generally improved with a rise in stand age synchronously, and the values (60.73% and 11.99%) in 1G-44YR were higher compared to the other stand types (Figure 2). The TP of 1G-16YR was significantly increased by 9.62% compared with that of CG, but the NCP of 1G-16YR was 20.46% lower than that of CG. The TP and NCP of the samples in the plot were not significantly different before and after the second afforestation (p > 0.05). Caused by clear-cutting, NCP fell by 23.61% in the 1G-44YR plot. CP and SV also decreased with the increase of stand age. The values of forest CP (51.72%) and SV (43.61%) appeared in 1G-16YR were higher than those of the other stands. The CP and SV of 1G-16YR were 1.82% and 9.67% higher than that of CG, respectively, whereas the difference was not significant (p < 0.05). Also, the CP and SV of 2G-16YR significantly grew respectively by 2.63% and 106.62% compared to that of CC (p < 0.01); however, the SV of CC was significantly lower than that of CG by 49.77%. Except for CP (p = 0.15), the other soil porosity indicators were significantly different among the seven types of the plots (p ≤ 0.05).

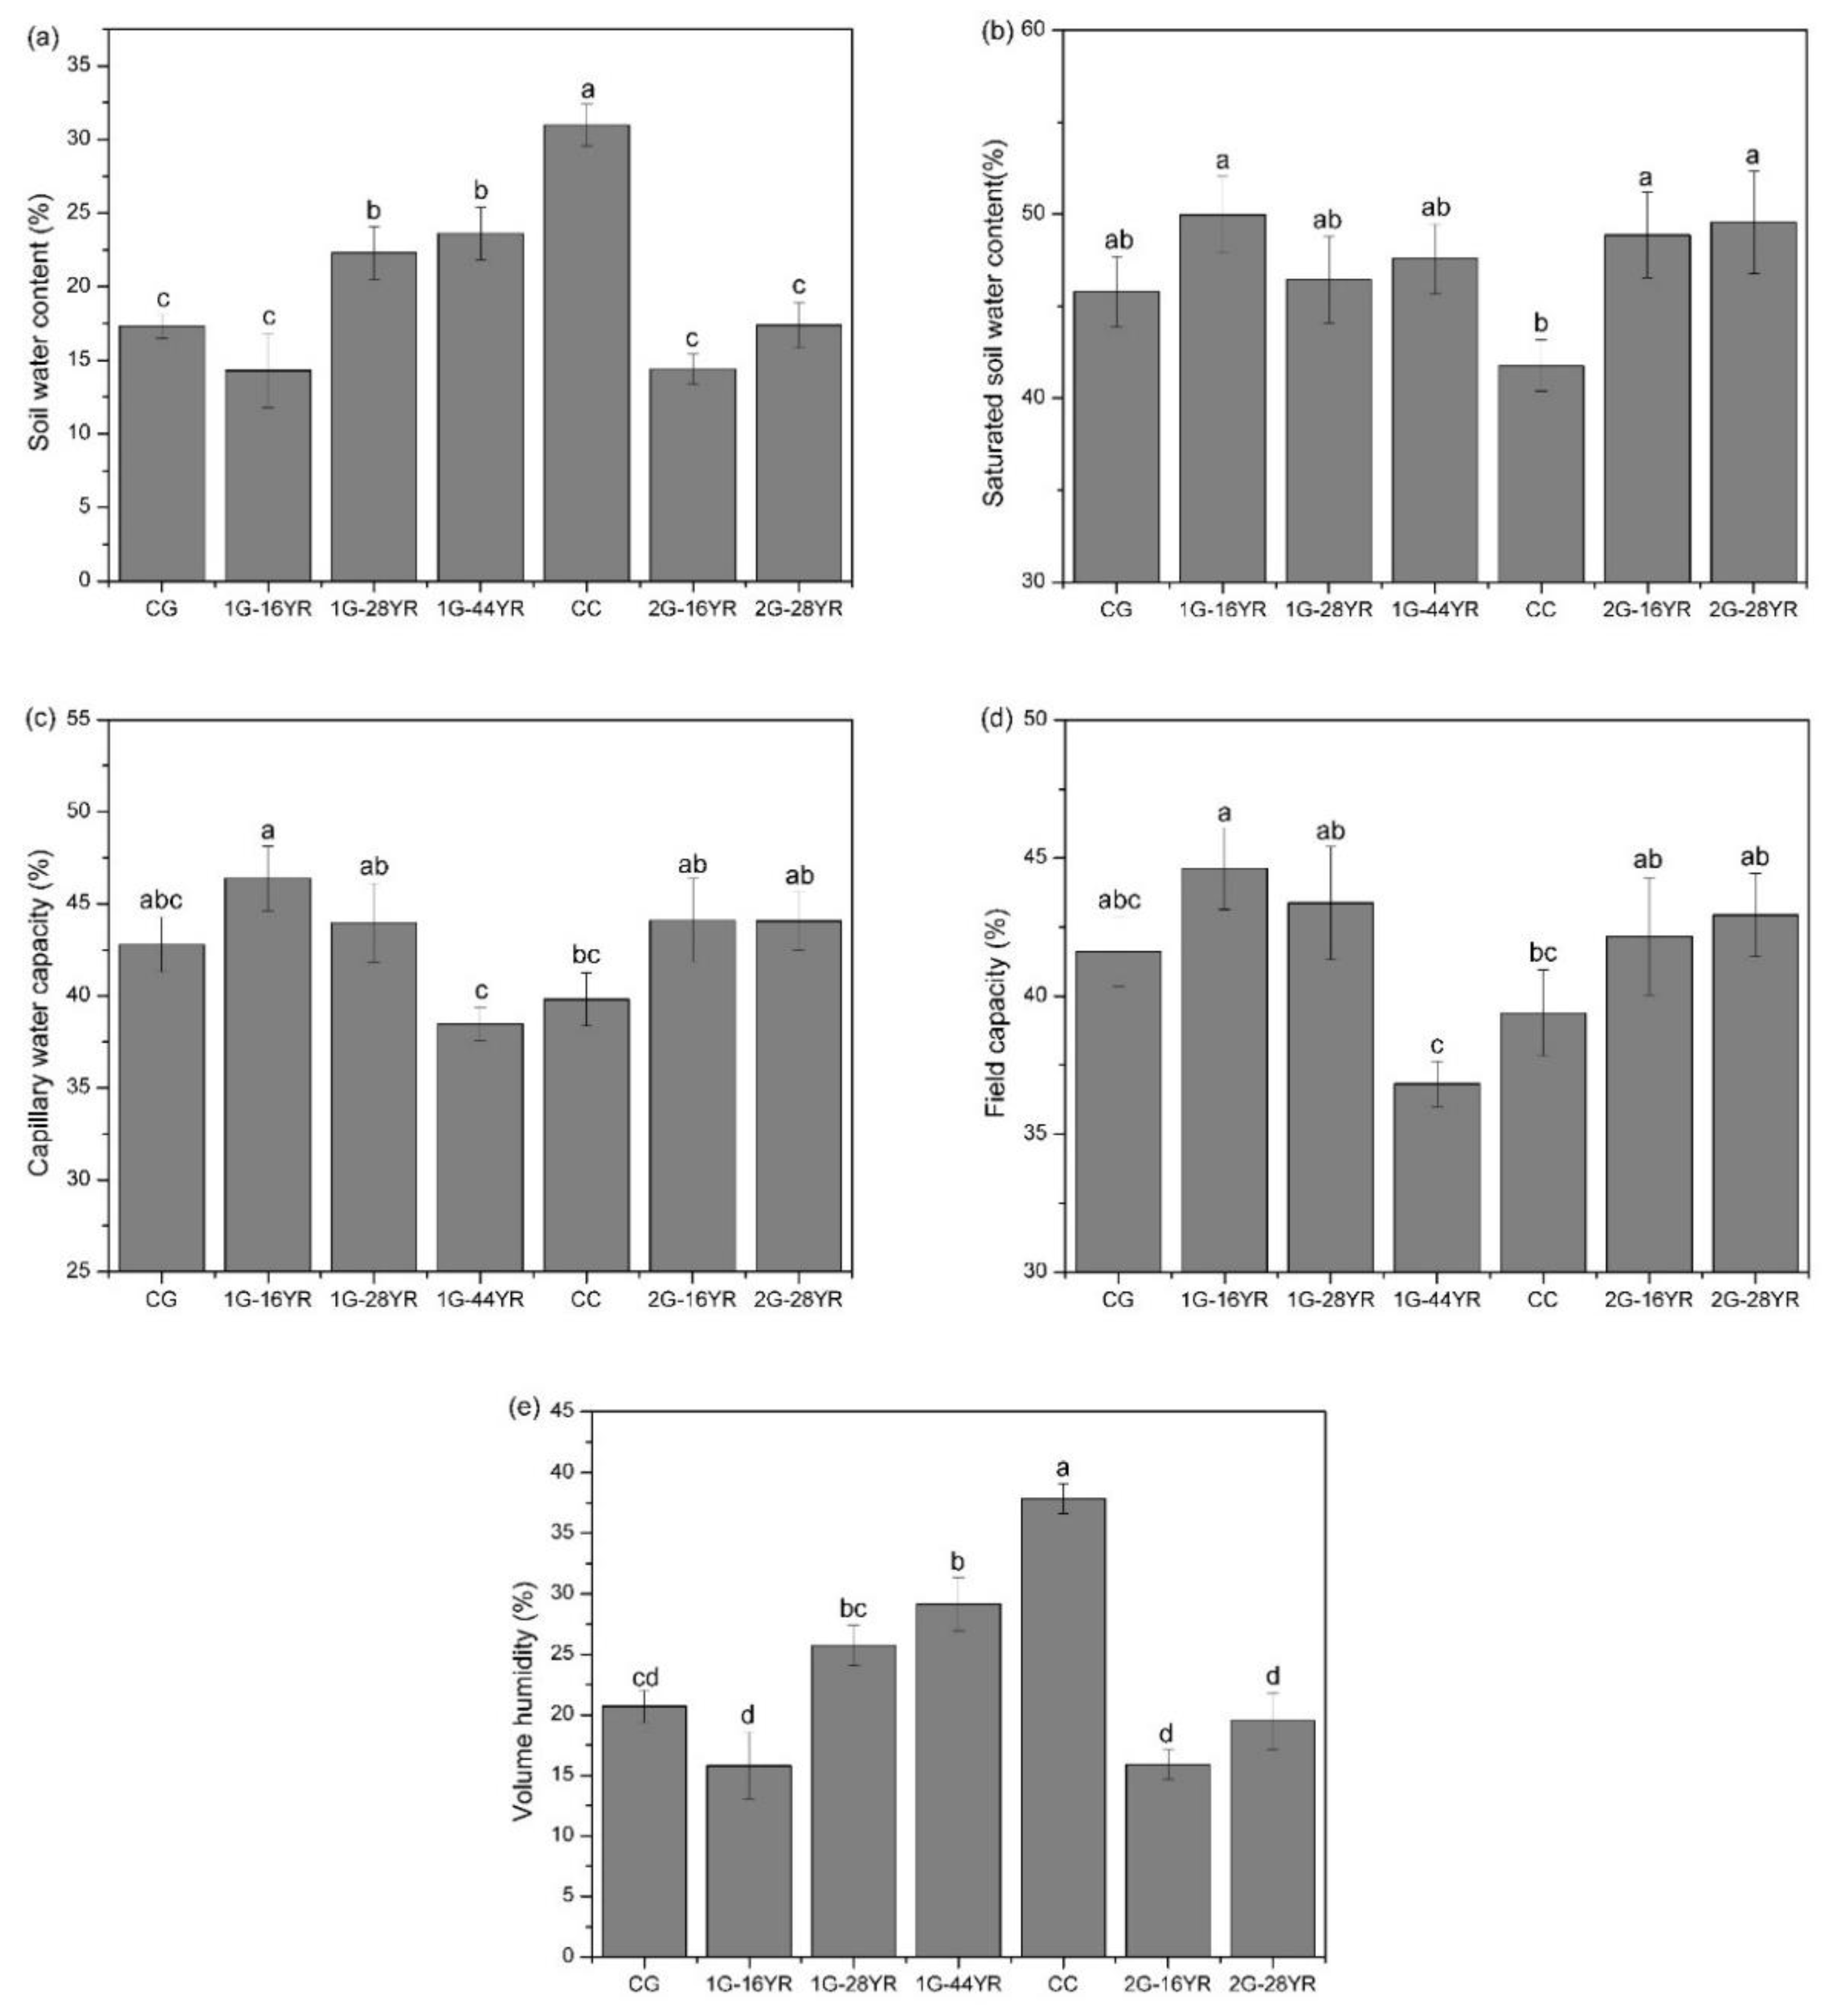
3.1.3. Soil Water Content

The trend of SWC was the same as VH trend (Figure 3a,e). As stand age rises, a significant decline was seen in SWC and VH after afforestation, but an opposite trend was noticed after clear-cutting. SWC (30.97%) and VH (29.14%) in the CC plots were significantly higher than those of the other stands. The CWC and FC of the first-generation forest dropped with an increase in stand age. Nevertheless, no significant difference was seen in CWC and FC between the two stand ages of the second-generation forest. The values of CWC (46.39%) and FC (44.62%) appeared in 1G-16YR (Figure 3c,d) were higher compared to the other stand types, and CWC and FC were upgraded either by afforestation or by clear-cutting. The value of SSWC was significantly higher in 1G-16YR (49.97%) than in the CC plots (41.76%, Figure 3b). Compared with CG, SWC and VH significantly rose by 78.83% and 82.96% in the CC plots, respectively. Except for SSWC, the soil moisture indices were significantly different among the seven types of the plots (p < 0.05).

3.2. Soil Chemical Properties

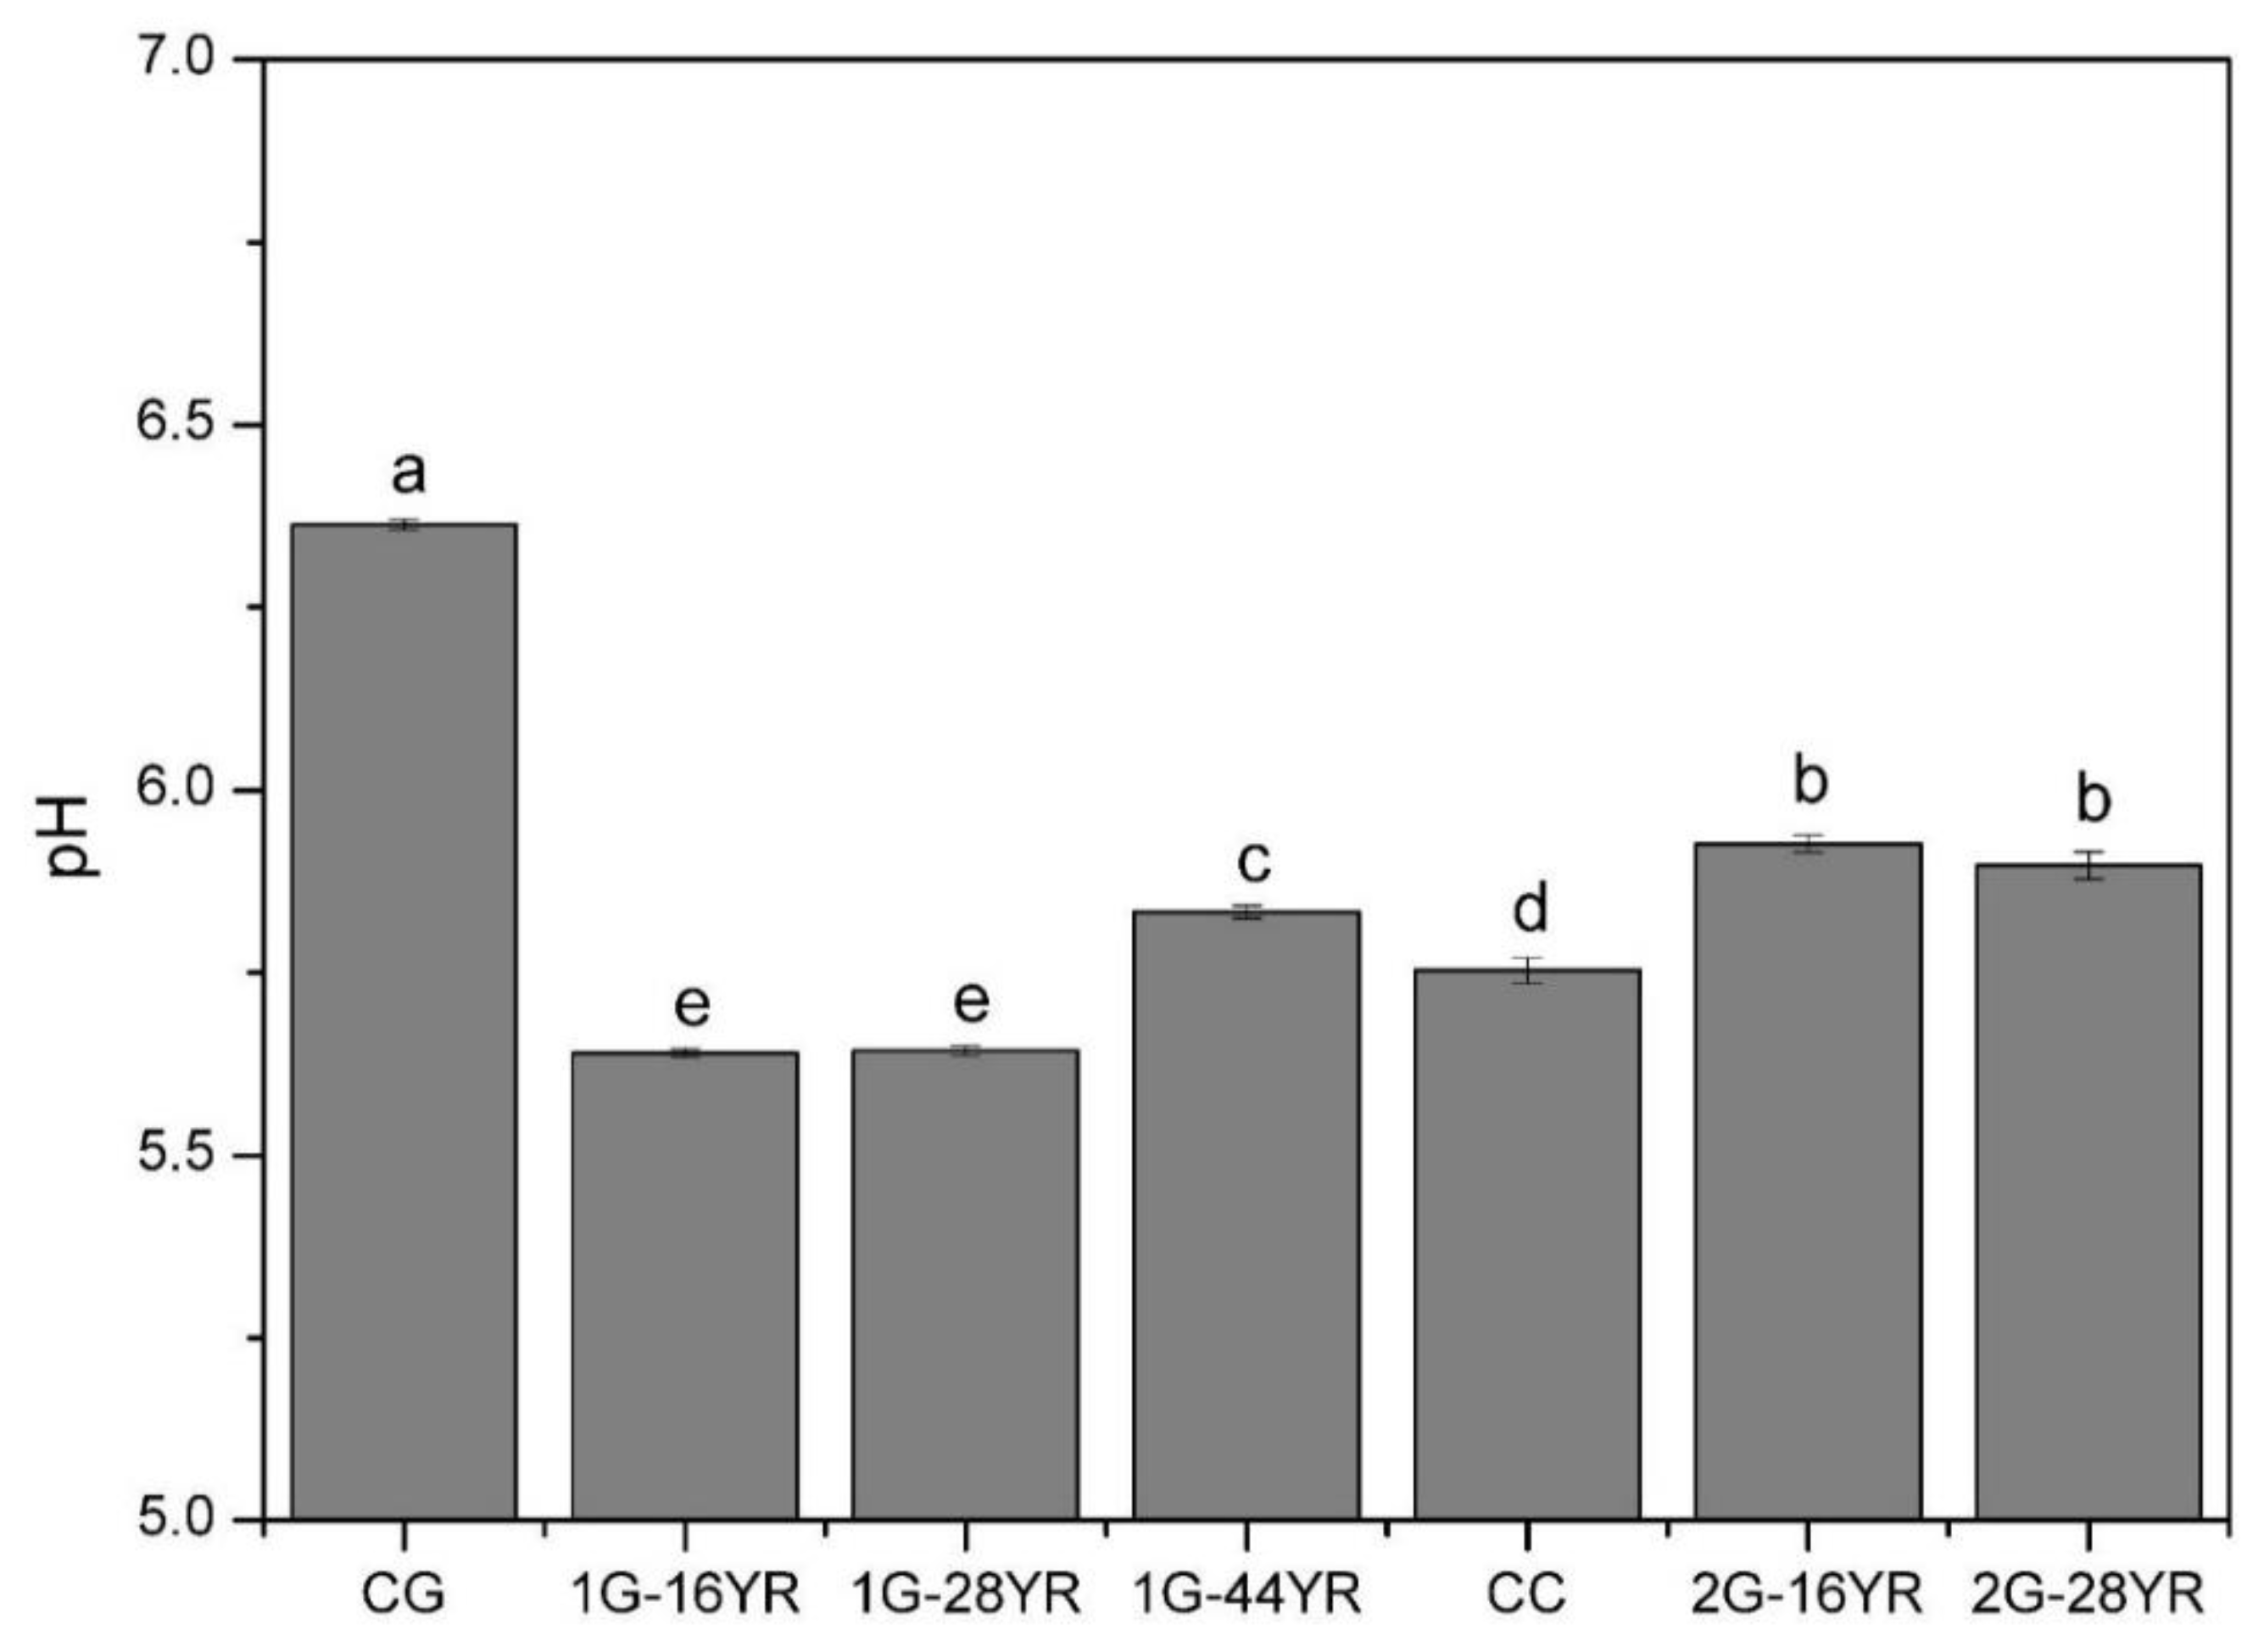
3.2.1. Soil pH Value

The pH value of the second-generation forest was significantly higher than that of the first-generation forest (Figure 4); the acidity of the soil was lower in the CG plot (6.36), but the acidity of 1G-16YR (5.64) soil was higher compared to the other stand types. The pH value of the first-generation forest increased as the stand age rose, while the second-generation forest showed an opposite trend. The pH of clear-cut land was also reduced by 1.37%. Moreover, the pH of CC was significantly lower (9.59%) than that of CG. The pH difference among the plots was significant (p < 0.01).

3.2.2. Soil Nutrients

SOC, TN, and TK all were enhanced with an increase in stand age unanimously. After clear-cutting, SOC, TN, and TK were reduced by 44.44%, 29.85%, and 16.31%, respectively. Afforestation reduced TN and TK both in the CG plot and the CC plot but increased SOC. The value of SOC in 1G-44YR (84.27 g kg−1) was significantly higher than that of the other stand types. In addition, the values of TN (3.90 g kg−1) and TK (3.02 g kg−1) of the CG plots were remarkably higher compared to the other stand types (Figure 5). However, the TN and TK values of the CC plot were considerably lower than those of CG plot by 44.97% and 23.65%, respectively. Except for AP, the indicators were markedly different among the seven types of plots (p < 0.01).

3.3. Soil Biological Properties

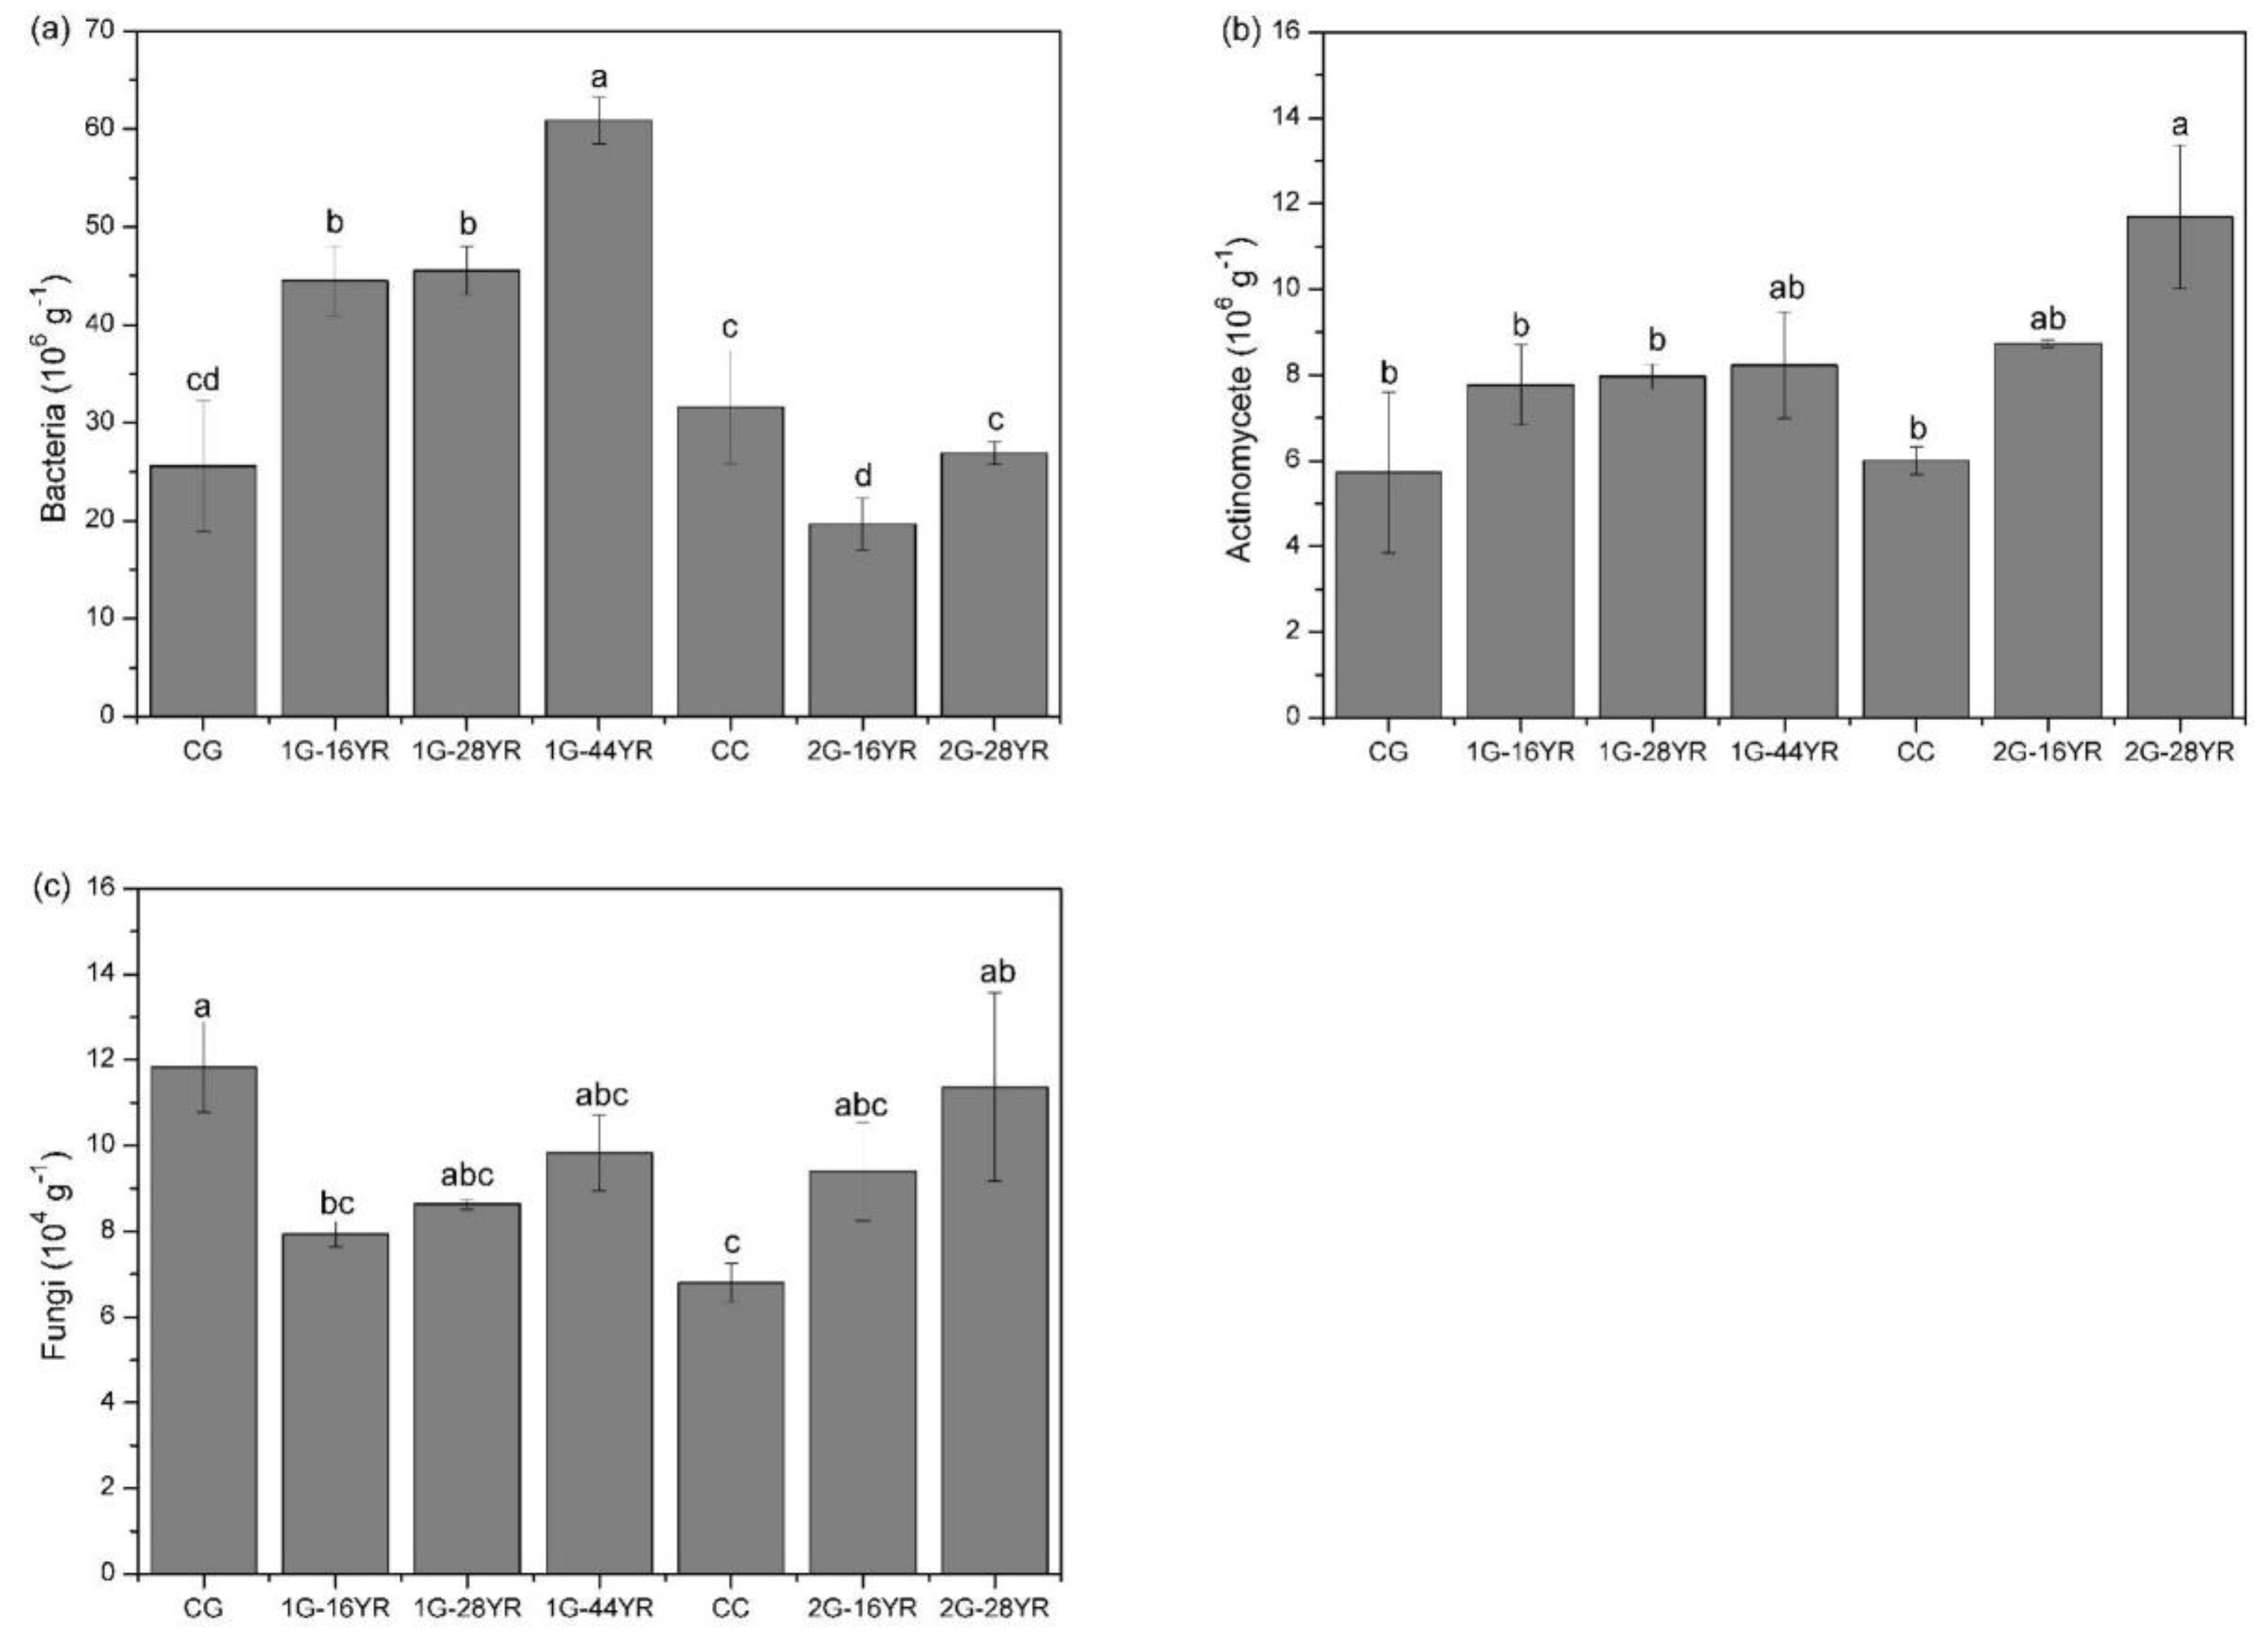
3.3.1. Soil Microorganisms

As illustrated in Figure 6, bacteria, actinomycete, and fungi were promoted with the increased stand age. The value of bacteria in 1G-44YR (60.87 × 10⁶ g−1), the value of actinomycete in 2G-28YR (11.70 × 10⁶ g−1), and that of fungi in the CG plots (11.83 × 10⁴ g−1) were higher than their counterparts in the other types of stands. The bacteria of the first-generation forest land were significantly larger than those of the second-generation forest. The value of the bacteria of 1G-16YR was 2.27 times more than that of 2G-16YR, and the bacteria value of 1G-28YR was 1.69 times higher than that of 2G-28YR. Except for fungi (p = 0.06), the other indicators were noticeably different among the plots (p < 0.05).

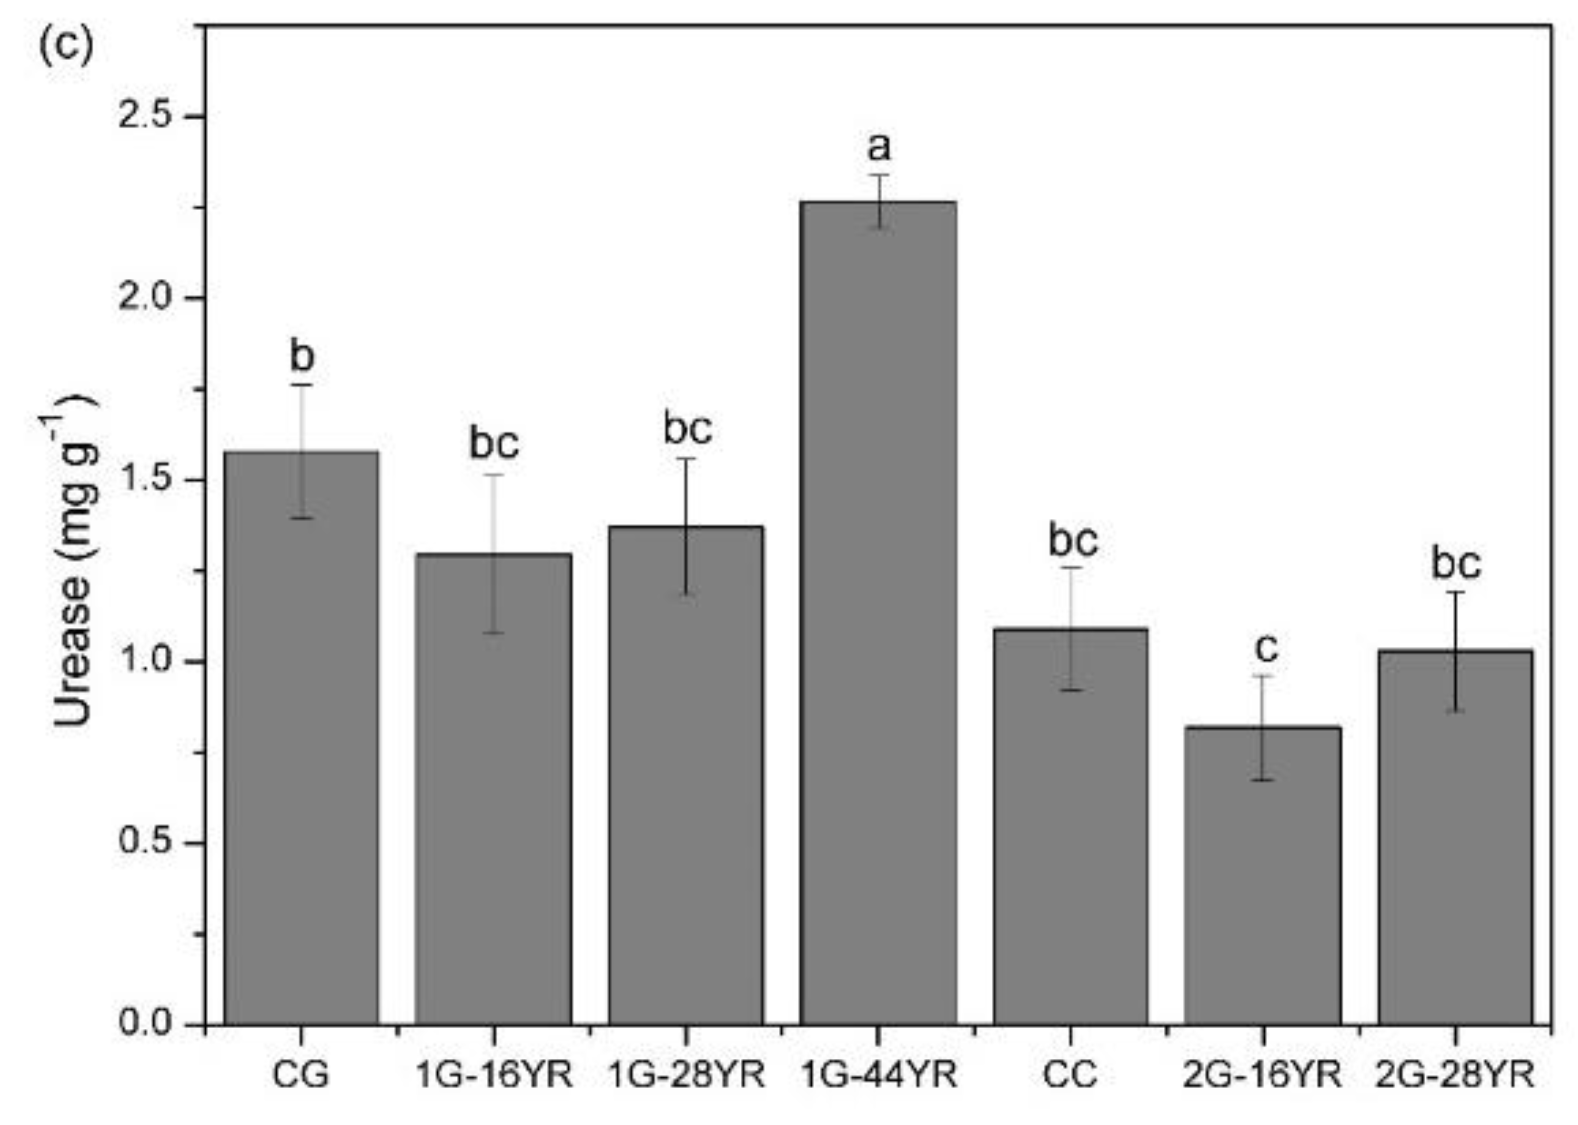
3.3.2. Soil Enzyme Activity

The activity of catalase, PPO, and urease was enhanced with the increase of stand age (Figure 7). The catalase value of the CG plot (0.62 mL g−1) and the values of PPO and urease of the 1G-44YR plot (0.44 10−2 and 2.67 mg g−1) were higher than those of the other plots. The PPO value of 2G-16YR was significantly decreased by 32.03% compared with that of the CC plot, while the PPO value was considerably reduced by 26.39% due to clear-cutting. Also, clear-cutting markedly dropped urease by 51.94%.

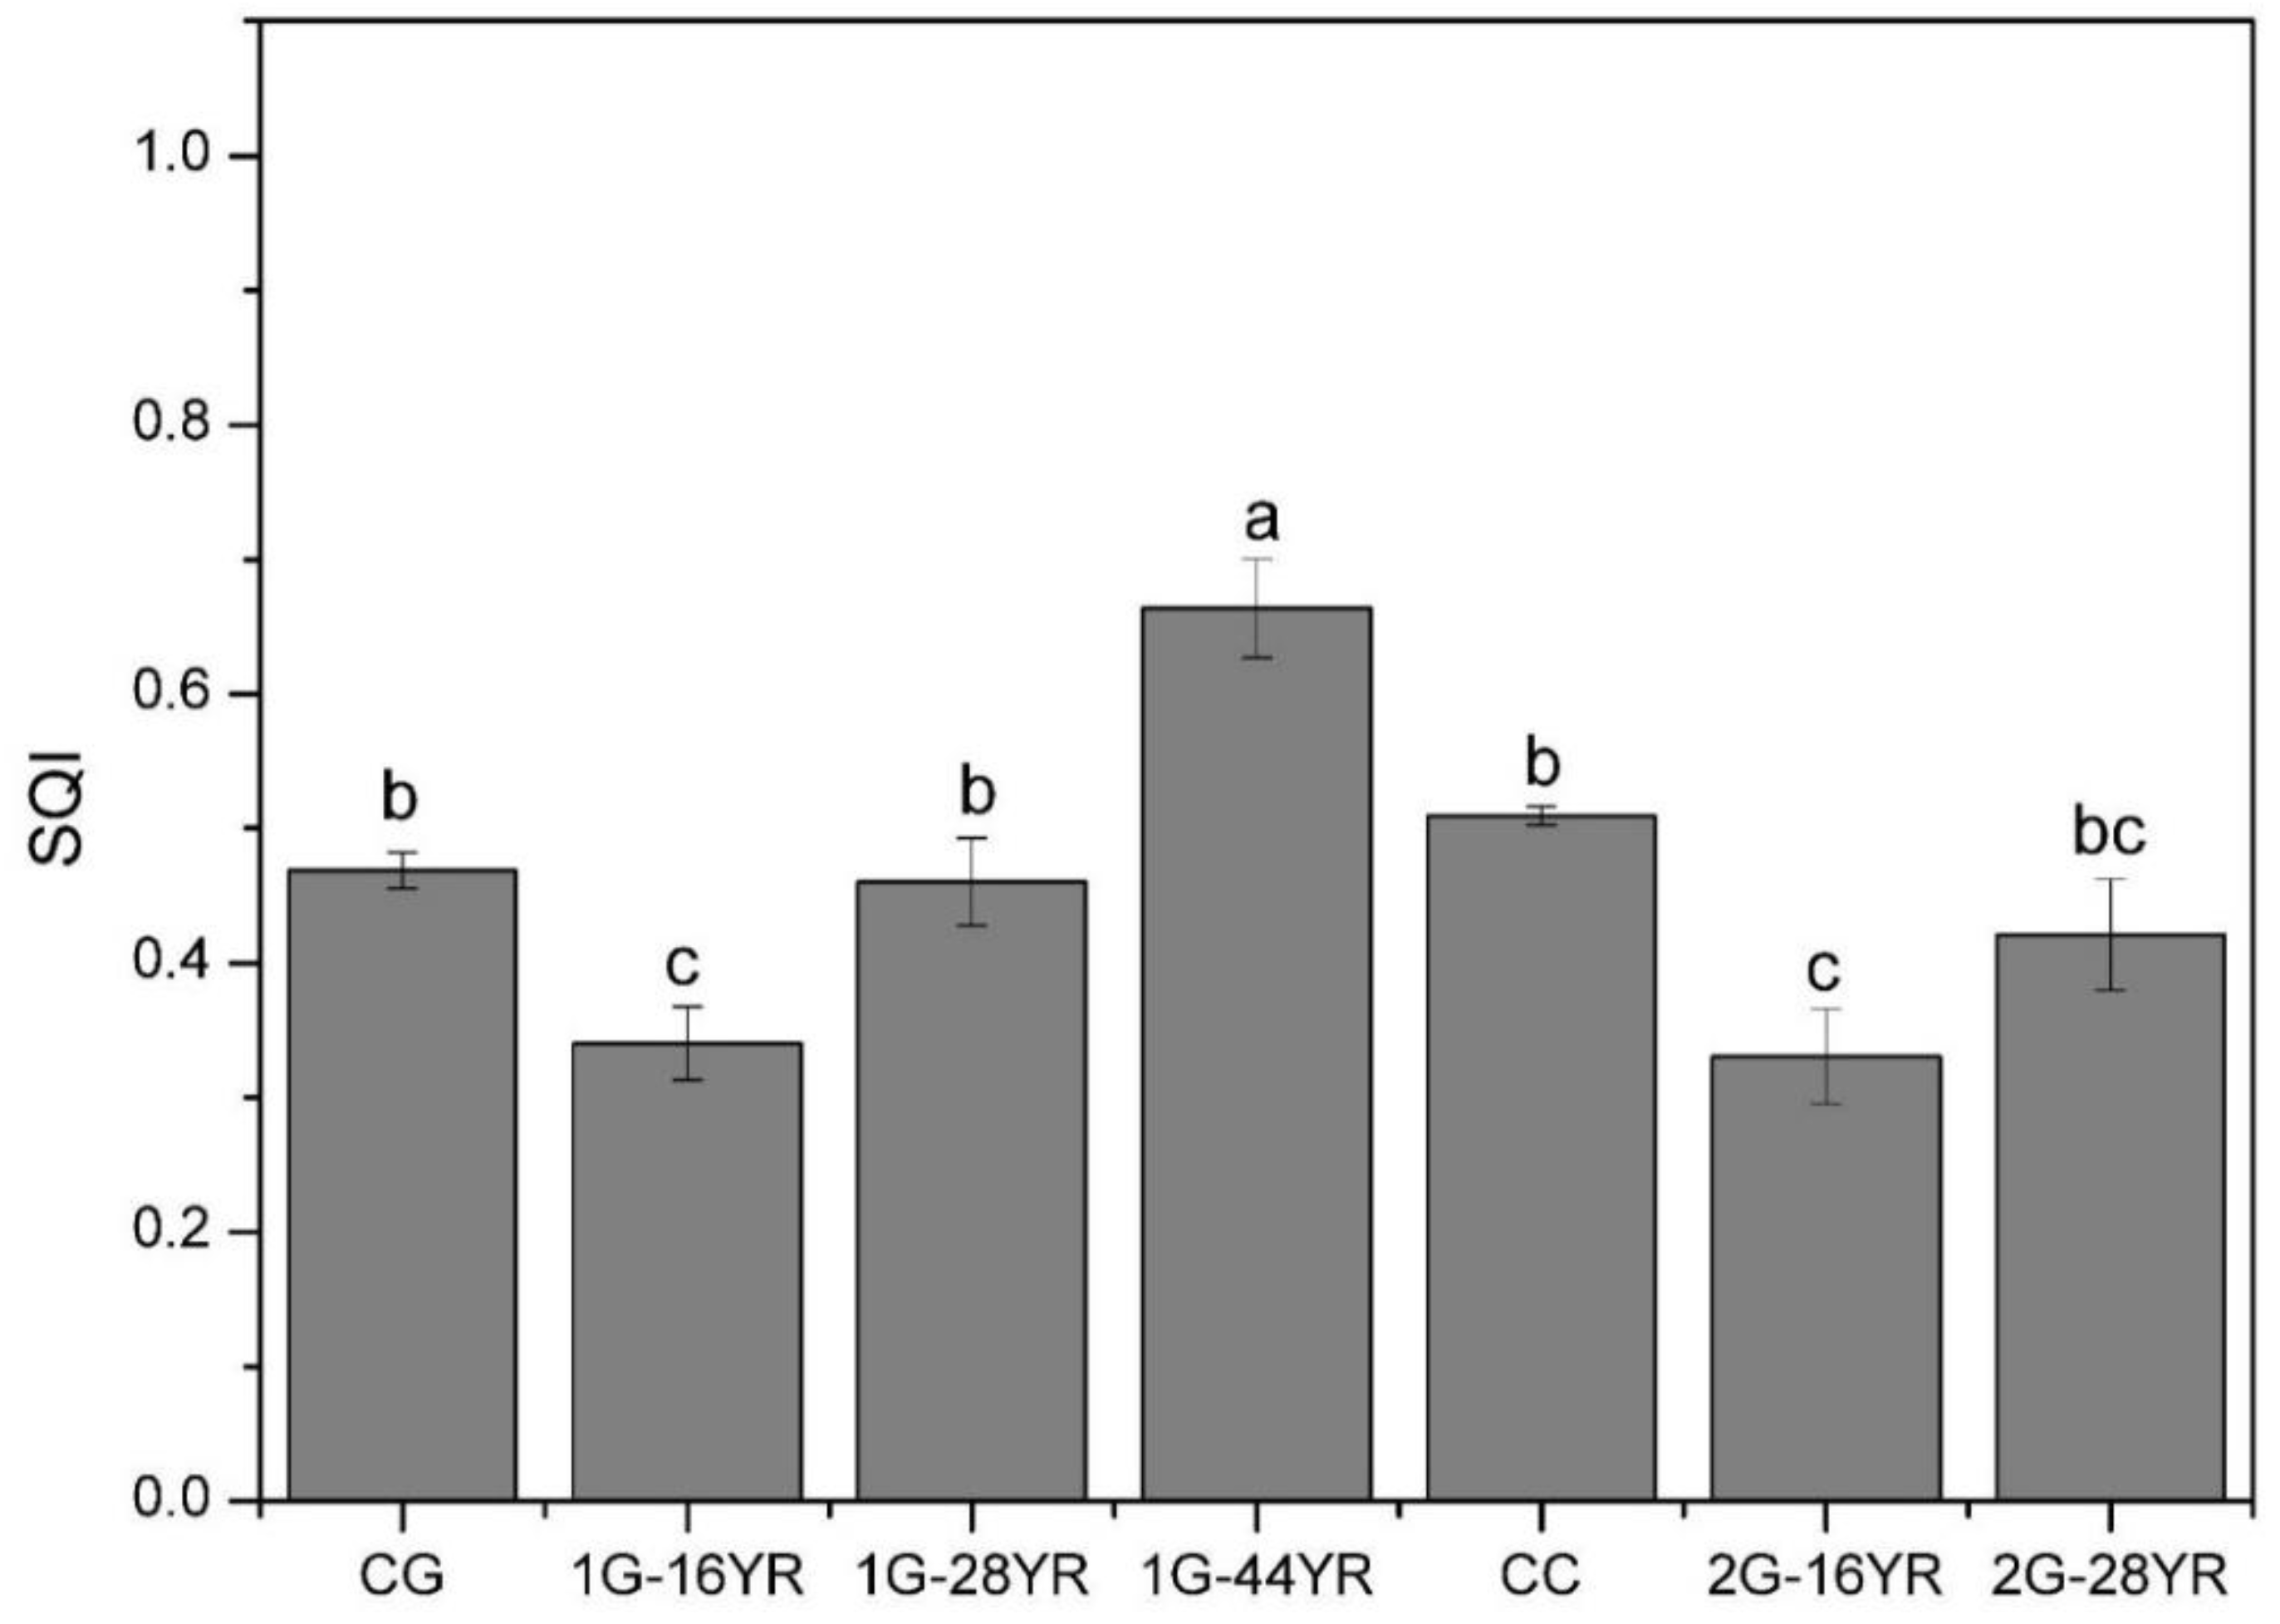
3.4. Soil Quality Index

Soil variables with significant differences among treatments included SBD, TP, NCP, SV, SWC, CWC, FC, VH, pH, SOC, TN, TK, bacteria, actinomycete, PPO, and urease. The first four PC’s explained greater than 5% and eigenvalues ≥ 1. The highly weighted variables under the four PC’s were SBD, TN, SV, VH, bacteria, PPO, NCP and SOC (see Supplementary Material, Table S1). As illustrated in Figure 8 and Table S2, 1G-44YR had the greatst soil quality; NCP and SOC were not well correlated with the other variables and retained for the MDS. SBD and TN were remarkably correlated; SBD had a higher correlation sum, so it was retained for the MDS. SV and VH were negatively correlated to each other; VH was retained for the MDS by the higher correlation sum. Bacteria and PPO were noticeably correlated; PPO had a higher correlation sum and was retained for the MDS. The variables selected to remain in MDS are SBD, NCP, VH, SOC, and PPO, which are used to calculate SQI.
As depicted in Figure 9, the SQI of 1G-44YR (0.66) was significantly larger than that of the other stand types. The SQI of CG (0.47) and that of CC (0.51) were remarkably higher than that of 1G-16YR (0.34) and that of 2G-16YR (0.33) by 38.24% and 54.55%, respectively. After a stand incubation period (compare the 1G-16YR with the 2G-16YR), the SQI was decreased by 2.90%, but the improvement was not significant (p < 0.05).

4. Discussion

4.1. Stand Age

Our observations supported our first hypothesis since all the indicators improved with an increase in stand age, except for TP, CP, SV, SSWC, CWC, FC, pH, AP, and catalase. The comprehensive analysis confirmed that the SQI was also significantly increased with an increased stand age. Furthermore, the results of this study are consistent with the work of Lima et al. [43], whereas they are contrary to the results of Zhang et al. [6]; this contrast is attributed to the lower temperature of the studied site, which consequently slowed down the decomposition of soil organic matter. Moreover, tree species are the main factors affecting microbial community activity and changing soil nutrient dynamics [44], and the pine needles of Larix principis-rupprechtii returns nutrients to the soil in the form of litter in the non-growth season. The growth rate of Larix principis-rupprechtii was slower and the demand for soil nutrients was relatively less. Thus, the cultivation of Larix principis-rupprechtii would improve soil quality. This study also stated that the average annual growth of the SQI from 28- to 44-year old was 1.27 times larger than that of the SQI from 16- to 28-year old (Figure 9). The older the forest stand is, the clearer the improvement of the soil quality is. It was speculated that the reason may be as follows: (1) The forest was gradually closed due to the increase of stand age; lower decomposition and soil disturbance reduction were found after the canopy closed [14,45,46]. Also, a high litter mass may contribute to the subsequent increase in SOC stocks in the older stands [47,48,49]. (2) During the early stages of plant life, nutrient absorption was kept at a high level, whereas litter production was at a low level. However, litter production increased, but nutrient absorption fell as the plant became older [50]. Therefore, extending the cultivation cycle of Larix principis-rupprechtii forests is beneficial to improving soil quality.

4.2. Forest Generation

The results also showed that indicators such as SWC, VH, bacteria and PPO dropped by the change of forest generation. According to the comprehensive analysis, increasing forest generation reduced the soil quality in the stand, but the difference was insignificant, which failed to support our second hypothesis. The results of this study are not consistent with the work of Zhang et al. [6] on the soil change of the third and fourth generations of eucalyptus forests. It was speculated that Zhang et al. [6] decreased the disturbance of soil afforestation activities by changing the reclamation method the after clear-cutting of the third-generation forest and fertilized forest land to supplement soil nutrients and improve soil quality. In the present study, plowing the forest (creating furrows and ridges) exposed the soil to air during afforestation. The exposure process promoted the loss of mineral components and reduced soil quality. In addition to afforestation activities, clear-cutting also accelerates the decomposition rate of SOC [51,52] and reduces SOC stocks, thereby causing a considerable decline in the soil quality in the forest land [27]. After clear-cutting, the cutting remains were not returned to the forest land, further resulting in a remarkable decrease in the soil quality of the forest land. However, the growth of the first-generation forests for more than 40 years has noticeably enhanced the soil quality. Therefore, an increase in the forest generation did not significantly reduce the soil quality of the forest land. Hence, the main reason for the decline of soil quality was artificial disturbance, including clear-cutting and afforestation. By returning harvesting residues and taking fertilizing measures, the negative effects of human disturbance, such as clear-cutting and afforestation, on the soil quality of forest lands would be reduced; delaying deforestation is also helpful in improving soil quality. Due to the long growth cycle of Larix principis-rupprechtii in Northern China, this study only focused on the first- and second-generation forests of Larix principis-rupprechtii in Northern China, and the influence of successive rotations on the soil quality should be continuously observed.

4.3. Clear-Cutting

Our observations demonstrated that a decline in the soil quality is caused by the reduction in porosity, microbial quantity except catalase, and the enzyme activity of soil with clear-cutting supporting the third hypothesis. Previous studies have shown that soil quality also declines due to human disturbance such as clear-cutting [6,53]. They are mutually validated by the present study. Deforestation negatively impacts on soil physical properties and leads to the loss of soil nutrients [23], coinciding with our results. Understorey vegetation also provides a better condition for microorganisms and alleviates rainfall-induced erosion and nutrient leaching [54]. After clear-cutting, dragging wood away and cutting residues could destroy the understorey vegetation and litter on soil and could expose a large number of aggregates of soil to air; thus, soil erosion and nutrient leaching occur after heavy rainfalls [55]. Erosion also damages soil structure and influences the circulation of elements, microbial populations, and organic compounds in soil [56,57]. While most litter and harvesting residues were not returned to the forest land, the return of forest nutrients mainly depends on the precipitation leaching and the decomposition of inorganic nutrients by roots, leading to the remarkable inhibition of nutrient cycle in the forest ecosystem and a marked reduction in the efficiency of nutrient cycle [58]. Clear-cutting causes the exposure of ridges to air, the decomposition of organic matter, and the massive loss of soil mineral elements (a maximum loss of N, C, and K+) [24,59,60,61], which in turn lowers the number of microorganisms and soil enzyme activity, thereby ultimately reducing the soil quality and making the soil more barren [22,25]. Therefore, clear-cutting causes exposure of soil to air and ultimately declines soil quality. In order to alleviate the negative effects of clear-cutting on soil quality, the use of heavy machinery should be minimized during the clear-cutting process, and the disturbance of human activities to forest soil should be lessened as well [62], especially the disturbance to forest soil during the removal of tree stumps. Returning the harvesting residues to the forest land is required to maintain the coverage of litter and understorey vegetation. Thus, the decomposition of the soil organic matters, the soil erosion, the changes in soil structure, and the loss of soil nutrients through drenching would be minimized.

4.4. Forest Cultivation Cycle and Soil Quality Recovery Time

From planting Larix principis-rupprechtii seedlings to harvesting wood as a cultivation cycle, the soil quality declined by 2.90% through a forest cultivation cycle. Soil quality declining problems such as exposure of soil to air and nutrient loss are caused by the distribution of land through planting trees. As the soil quality in the growing forests gradually recovers, the forests play a role in improving the soil quality. In this study, due to the use of heavy machinery in the harvesting process and failure to take measures such as returning the cutting leftovers, the forest soil quality was greatly reduced. The studies of Selvaraj et al. [52] also support our results. Since the soil quality gradually improved from 16-year-old to 44-year-old forest stands after planting Larix principis-rupprechtii, the change in the stand SQI (Figure 9) presumed that it would take about 39 years for the first-generation forest (calculated by regression analysis, see Supplementary Material, Table S3) and more than 28 years for the second-generation forest to restore soil quality. Therefore, in order to maintain the soil quality, the planting cycle of Larix principis-rupprechtii should be longer than 39 years.
SQI is a relatively novel method for soil quality assessment. In this research, five representative variables were selected among 24 soil variables to define the smallest data set, for SQI calculation. It provides a more intelligible and comprehensive measurement for soil quality. In future research, comparsion SQI and other common indicators for soil quality evaluation would be expected for more accurate variables determinating, to further optimize SQI calculation method.

5. Conclusions

The main findings of this study are as follows:
(1)
Extending the cultivation cycle of Larix principis-rupprechtii forest was beneficial to improving soil quality.
(2)
Increasing forest generation did not significantly reduce soil quality.
(3)
Clear-cutting could greatly decrease soil quality, and returning the harvesting residues to the forest land may reduce the negative impact of clear-cutting on soil quality.
(4)
In order to maintain soil health and achieve sustainable planting, the planting period of Larix principis-rupprechtii forests should be more than 39 years.
(5)
SQI provided a more intelligible and comprehensive measurement of soil quality with the identification of a minimum data set. Future studies should compare SQI with other soil quality indicators to further optimize SQI calculation method.
To better understand the impacts of successive Larix principis-rupprechtii planting on soil quality, more generations of Larix principis-rupprechtii plantations should be evaluated.

Supplementary Materials

The following are available online at https://www.mdpi.com/1999-4907/10/10/932/s1, Table S1: Results of the principal components analysis of soil variables, Table S2: Results of the correlation analysis of soil variables, Table S3: Standardized regression coefficients of the generalized linear models (GLMs) used to examine the effects of stand age on SQI for the first-generation Larix principis-rupprechtii.

Author Contributions

K.Z.: Data collection, data analysis, and manuscript writing. T.J.F.: Guide the revision of the manuscript. D.L.: Data collection, data analysis. Z.J.: Design of the study and supervision of the scientific experiments and data analysis. L.M.: Supervision of the scientific experiments.

Funding

This research was funded by National Natural Science Foundation of China (31870387) and China Scholarship Council.

Conflicts of Interest

The authors declare no conflicts of interest.

References

  1. Lal, R. Restoring Soil Quality to Mitigate Soil Degradation. Sustainability 2015, 7, 5875–5895. [Google Scholar] [CrossRef] [Green Version]
  2. Lal, R. Soil degradation as a reason for inadequate human nutrition. Food Sec. 2009, 1, 45–57. [Google Scholar] [CrossRef]
  3. León, J.D.; Osorio, N.W. Role of Litter Turnover in Soil Quality in Tropical Degraded Lands of Colombia. Sci. World J. 2014, 2014, 693981. [Google Scholar] [CrossRef] [PubMed]
  4. Bini, C. Soil: A precious natural resource. In Conservation of Natural Resources; Kudrow, N.J., Ed.; Nova Science Publishers: Hauppauge, NY, USA, 2009; pp. 1–48. [Google Scholar]
  5. Yu, X.B.; Yang, G.Q.; Li, S.K. Study on the changes of soil properties in Eucalyptus plantation under continuous-planting practices. In Studies on Longterm Productivity Management of Eucalyptus Plantation; Yu, X.B., Ed.; China Forestry Publishing House: Beijing, China, 2000; pp. 94–103. [Google Scholar]
  6. Zhang, K.; Zheng, H.; Chen, F.L.; Ouyang, Z.Y.; Wang, Y.; Wu, Y.F.; Lan, J.; Fu, M.; Xiang, X.W. Changes in Soil Quality after Converting Pinus to Eucalyptus Plantations in Southern China. Solid Earth 2015, 6, 115–123. [Google Scholar] [CrossRef]
  7. LeBauer, D.S.; Treseder, K.K. Nitrogen Limitation of Net Primary Productivity in Terrestrial Ecosystems Is Globally Distributed. Ecology 2008, 89, 371–379. [Google Scholar] [CrossRef] [PubMed]
  8. Laclau, J.P.; Ranger, J.; Goncalves, J.L.D.; Maquere, V.; Krusche, A.V.; M’Bou, A.T.; Nouvellon, Y.; Saint-Andre, L.; Bouillet, J.P.; Piccolo, M.D.; et al. Biogeochemical Cycles of Nutrients in Tropical Eucalyptus Plantations Main Features Shown by Intensive Monitoring in Congo and Brazil. For. Ecol. Manag. 2010, 259, 1771–1785. [Google Scholar] [CrossRef]
  9. Yu, F.K.; Huang, X.H.; Wang, K.Q.; Duang, C.Q. An overview of ecological degradation and restoration of Eucalyptus plantations. Chin. J. Eco-Agric. 2009, 17, 393–398. [Google Scholar] [CrossRef]
  10. Bünemann, E.K.; Bongiorno, G.; Bai, Z.; Creamer, R.E.; De Deyn, G.; de Goede, R.; Pulleman, M. Soil quality—A critical review. Soil Biol. Biochem. 2018, 120, 105–125. [Google Scholar] [CrossRef]
  11. Garay, I.; Pellens, R.; Kindel, A.; Barros, E.; Franco, A.A. Evaluation of soil conditions in fast-growing plantations of Eucalyptus grandis and Acacia mangium in Brazil: A contribution to the study of sustainable land use. Appl. Soil Ecol. 2004, 27, 177–187. [Google Scholar] [CrossRef]
  12. Muñoz-Rojas, M.; Jordán, A.; Zavala, L.M.; De la Rosa, D.; AbdElmabod, S.K.; Anaya-Romero, M. Organic carbon stocks in Mediterranean soil types under different land uses (Southern Spain). Solid Earth 2012, 3, 375–386. [Google Scholar] [CrossRef] [Green Version]
  13. Parras-Alcántara, L.; Martín-Carrillo, M.; Lozano-García, B. Impacts of land use change in soil carbon and nitrogen in a Mediterranean agricultural area (Southern Spain). Solid Earth 2013, 4, 167–177. [Google Scholar] [CrossRef] [Green Version]
  14. Zhang, Y.; Wei, Z.C.; Li, H.T.; Guo, F.T.; Wu, P.F.; Zhou, L.L.; Ma, X.Q. Biochemical quality and accumulation of soil organic matter in an age sequence of Cunninghamia lanceolata plantations in southern China. J. Soils Sediments 2017, 17, 2218–2229. [Google Scholar] [CrossRef]
  15. Filip, Z. International approach to assessing soil quality by ecologically-related biological parameters. Agric. Ecosyst. Environ. 2002, 88, 169–174. [Google Scholar] [CrossRef]
  16. Parisi, V.; Menta, C.; Gardi, C.; Jacomini, C.; Mozzanica, E. Microarthropod communities as a tool to assess soil quality and biodiversity: A new approach in Italy. Agric. Ecosyst. Environ. 2005, 105, 323–333. [Google Scholar] [CrossRef]
  17. Ritz, K.; Black, H.I.J.; Campbell, C.D.; Harris, J.A.; Wood, C. Selecting biological indicators for monitoring soils: A framework for balancing scientific and technical opinion to assist policy development. Ecol. Indic. 2009, 9, 1212–1221. [Google Scholar] [CrossRef] [Green Version]
  18. Andrews, S.S.; Carroll, C.R. Designing a soil quality assessment tool for sustainable agroecosystem management. Ecol. Appl. 2001, 11, 1573–1585. [Google Scholar] [CrossRef]
  19. Zornoza, R.; Acosta, J.A.; Bastida, F.; Domínguez, S.G.; Toledo, D.M.; Faz, A. Identification of sensitive indicators to assess the interrelationship between soil quality, management practices and human health. Soil 2015, 1, 173–185. [Google Scholar] [CrossRef] [Green Version]
  20. Gruba, P.; Socha, J.; Pietrzykowski, M.; Pasichnyk, D. Tree species affects the concentration of total mercury (Hg) in forest soils: Evidence from a forest soil inventory in Poland. Sci. Total Environ. 2019, 647, 141–148. [Google Scholar] [CrossRef]
  21. Bouma, J.; Van Ittersum, M.K.; Stoorvogel, J.J.; Batjes, N.H.; Droogers, P.; Pulleman, M.M. Soil capability: Exploring the functional potentials of soils. Glob. Soil Secur. 2017, 27–44. [Google Scholar] [CrossRef]
  22. Weis, W.; Huber, C.; Gattlein, A. Regeneration of mature Norway spruce stands: Early effects of selective cutting and clear cutting on seepage water quality and soil fertility. Sci. World J. 2001, 1, 493–499. [Google Scholar] [CrossRef]
  23. Zhou, X.N.; Zhou, Y.; Zhou, C.J.; Wu, Z.L.; Zheng, L.F.; Hu, X.S.; Chen, H.X.; Gan, J.B. Effects of Cutting Intensity on Soil Physical and Chemical Properties in a Mixed Natural Forest in Southeastern China. Forests 2015, 6, 4495–4509. [Google Scholar] [CrossRef]
  24. Aleksandrowicz-Trzcinska, M.; Drozdowski, S.; Zybura, H. Effect of Mechanical Site Preparation on Features of the Soil in a Clear-Cut Area. Sylwan 2018, 162, 648–657. [Google Scholar]
  25. Hume, A.M.; Chen, H.Y.H.; Taylor, A.R. Intensive Forest Harvesting Increases Susceptibility of Northern Forest Soils to Carbon, Nitrogen and Phosphorus Loss. J. Appl. Ecol. 2018, 55, 246–255. [Google Scholar] [CrossRef]
  26. Zhao, K.J.; Zheng, M.X.; Fahey, T.J.; Jia, Z.K.; Ma, Y.L. Vertical gradients and seasonal variations in the stem CO2 efflux of Larix principis-rupprechtii Mayr. Agric. For. Meteorol. 2018, 262, 71–80. [Google Scholar] [CrossRef]
  27. Yao, Y.T.; Zhang, J.Z.; Hu, J.F. Larix Principis-Rupprechtii; Agricultural Science and Technology Press of China: Beijing, China, 2013. [Google Scholar]
  28. McKenzie, N.; Coughlan, K.; Cresswell, H. Soil Physical Measurement and Interpretation for Land Evaluation; Csiro Publishing: Collingwood, Australia, 2002; Volume 5. [Google Scholar]
  29. Wu, G.L.; Yang, Z.; Cui, Z.; Liu, Y.; Fang, N.F.; Shi, Z.H. Mixed artificial grasslands with more roots improved mine soil infiltration capacity. J. Hydrol. 2016, 535, 54–60. [Google Scholar] [CrossRef]
  30. Jiao, F.; Wen, Z.M.; An, S.S. Changes in soil properties across a chronosequence of vegetation restoration on the Loess Plateau of China. Catena 2011, 86, 110–116. [Google Scholar] [CrossRef]
  31. Huang, C.Y. Soil Science; China Agriculture Press: Beijing, China, 2003; pp. 89–92. [Google Scholar]
  32. Hardie, M.; Clothier, B.; Bound, S.; Oliver, G.; Close, D. Does Biochar Influence Soil Physical Properties and Soil Water Availability? Plant Soil 2014, 376, 347–361. [Google Scholar] [CrossRef]
  33. Clark, M.D.; Gilmour, J.T. The effect of temperature on decomposition at optimum and saturated soil water contents. Soil Sci. Soc. Am. J. 1983, 47, 927–929. [Google Scholar] [CrossRef]
  34. Rowell, D.L. Soil Science: Methods and Applications; Routledge: London, UK, 2014. [Google Scholar]
  35. Cassel, D.K.; Nielsen, D.R. Field capacity and available water capacity. In Methods of Soil Analysis. Part 1, 2nd ed.; Klute, A., Ed.; Agron. Monogr. 9. ASA and SSSA: Madison, WI, USA, 1986; pp. 901–926. [Google Scholar]
  36. Givi, J.; Prasher, S.O.; Patel, R.M. Evaluation of pedotransfer functions in predicting the soil water contents at field capacity and wilting point. Agric. Water Manag. 2004, 70, 83–96. [Google Scholar] [CrossRef]
  37. Bao, S.D. Soil Agro-Chemical Analysis; China Agriculture Press: Beijing, China, 2000. [Google Scholar]
  38. Chen, H.K. Soil Microbiology; Shanghai Science and Technology Press: Shanghai, China, 1981; pp. 44–45. [Google Scholar]
  39. Waldrop, M.P.; Balser, T.C.; Firestone, M.K. Linking microbial community composition to function in a tropical soil. Soil Biol. Biochem. 2000, 32, 1837–1846. [Google Scholar] [CrossRef]
  40. Kandeler, E.; Gerber, H. Short-term assay of soil urease activity using colorimetric determination of ammonium. Biol. Fertil. Soils 1988, 6, 68–72. [Google Scholar] [CrossRef]
  41. Zheng, H.; Ouyang, Z.Y.; Wang, X.K.; Miao, H.; Zhao, T.Q.; Peng, T.B. How different reforestation approaches affect red soil properties in Southern China. Land Degrad. Dev. 2005, 16, 387–396. [Google Scholar] [CrossRef]
  42. Andrews, S.S.; Karlen, D.L.; Mitchell, J.P. A comparison of soil quality indexing methods for vegetable production systems in Northern California. Agric. Ecosyst. Environ. 2002, 90, 25–45. [Google Scholar] [CrossRef]
  43. Lima, A.M.; Silva, I.R.; Neves, J.C.; Novais, R.F.; Barros, N.F.; Mendonça, E.S.; Leite, F.P. Soil organic carbon dynamics following afforestation of degraded pastures with eucalyptus in southeastern Brazil. For. Ecol. Manag. 2006, 235, 219–231. [Google Scholar] [CrossRef]
  44. Lucas-Borja, M.E.; Hedo, J.; Cerdá, A.; Candel-Pérez, D.; Viñegla, B. Unravelling the importance of forest age stand and forest structure driving microbiological soil properties, enzymatic activities and soil nutrients content in Mediterranean Spanish black pine (Pinus nigra Ar. ssp. salzmannii) Forest. Sci. Total Environ. 2016, 562, 145–154. [Google Scholar] [CrossRef]
  45. Mao, R.; Zeng, D.H.; Hu, Y.L.; Li, L.J.; Yang, D. Soil organic carbon and nitrogen stocks in an age-sequence of poplar stands planted on marginal agricultural land in Northeast China. Plant Soil 2010, 332, 277–287. [Google Scholar] [CrossRef]
  46. Cheng, J.; Lee, X.; Theng, B.K.; Zhang, L.; Fang, B.; Li, F. Biomass accumulation and carbon sequestration in an age-sequence of Zanthoxylum bungeanum plantations under the Grain for Green Program in karst regions, Guizhou province. Agric. For. Meteorol. 2015, 203, 88–95. [Google Scholar] [CrossRef]
  47. Zhou, G.Y.; Liu, S.G.; Li, Z.; Zhang, D.Q.; Tang, X.L.; Zhou, C.Y.; Yan, J.H.; Mo, J.M. Old-Growth Forests Can Accumulate Carbon in Soils. Science 2006, 314, 1417. [Google Scholar] [CrossRef]
  48. Luyssaert, S.; Schulze, E.D.; Borner, A.; Knohl, A.; Hessenmoller, D.; Law, B.E.; Ciais, P.; Grace, J. Old-growth forests as global carbon sinks. Nature 2008, 455, 213–215. [Google Scholar] [CrossRef]
  49. Chen, G.S.; Yang, Z.J.; Gao, R.; Xie, J.S.; Guo, J.F.; Huang, Z.Q.; Yang, Y.S. Carbon Storage in a Chronosequence of Chinese Fir Plantations in Southern China. For. Ecol. Manag. 2013, 300, 68–76. [Google Scholar] [CrossRef]
  50. Xu, D.P. An approach to nutrient balance in tropical and south subtropical short rotation plantations. In Studies on Long-Term Productivity Management of Eucalyptus Plantation; Yu, X.B., Ed.; China Forestry Publishing House: Beijing, China, 2000; pp. 27–35. [Google Scholar]
  51. Diochon, A.C.; Kellman, L. Physical fractionation of soil organic matter: Destabilization of deep soil carbon following harvesting of a temperate coniferous forest. J. Geophys. Res. Biogeosci. 2009, 114, G01016. [Google Scholar] [CrossRef]
  52. Selvaraj, S.; Duraisamy, V.; Huang, Z.J.; Guo, F.T.; Ma, X.Q. Influence of Long-Term Successive Rotations and Stand Age of Chinese Fir (Cunninghamia lanceolata) Plantations on Soil Properties. Geoderma 2017, 306, 127–134. [Google Scholar] [CrossRef]
  53. Jennings, T.N.; Smith, J.E.; Cromack, K.; Sulzman, E.W.; McKay, D.; Caldwell, B.A.; Beldin, S.I. Impact of postfire logging on soil bacterial and fungal communities and soil biogeochemistry in a mixed-conifer forest in central Oregon. Plant Soil 2012, 350, 393–411. [Google Scholar] [CrossRef]
  54. Yu, X.B.; Chen, Q.B.; Wang, S.M.; Mo, X.Y. Research on land degradation in forest plantation and preventive strategies. In Studies on Long-Term Productivity Management of Eucalyptus Plantation; Yu, X.B., Ed.; China Forestry Publishing House: Beijing, China, 2000; pp. 1–7. [Google Scholar]
  55. Zhang, X.; Kirschbaum, M.U.F.; Hou, Z.; Guo, Z. Carbon stock changes in successive rotations of Chinese fir (Cunninghamia lanceolata (Lamb.) Hook.) plantations. For. Ecol. Manag. 2004, 202, 131–147. [Google Scholar] [CrossRef]
  56. Kibblewhite, M.G.; Ritz, K.; Swift, M.J. Soil health in agricultural systems. Philos. Trans. R. Soc. Lond. Ser. B 2008, 363, 685–701. [Google Scholar] [CrossRef]
  57. Brussaard, L. Ecosystem services provided by the soil biota. In Soil Ecology and Ecosystem Services; Wall, D.H., Bardgett, R.D., Behan-Pelletier, V., Herrick, J.E., Jones, H., Ritz, K., Six, J., Strong, D.R., van der Putten, W.H., Eds.; Oxford University Press: Oxford, UK, 2012; pp. 45–58. [Google Scholar]
  58. Zinn, Y.L.; Resck, D.V.; da Silva, J.E. Soil organic carbon as affected by afforestation with Eucalyptus and Pinus in the Cerrado region of Brazil. For. Ecol. Manag. 2002, 166, 285–294. [Google Scholar] [CrossRef]
  59. Nave, L.E.; Vance, E.D.; Swanston, C.W.; Curtis, P.S. Harvest impacts on soil carbon storage in temperate forests. For. Ecol. Manag. 2010, 259, 857–866. [Google Scholar] [CrossRef]
  60. Achat, D.L.; Deleuze, C.; Landmann, G.; Pousse, N.; Ranger, J.; Augusto, L. Quantifying consequences of removing harvesting residues on forest soils and tree growth—A meta-analysis. For. Ecol. Manag. 2015, 348, 124–141. [Google Scholar] [CrossRef]
  61. Thiffault, E.; Hannam, K.D.; Pare, D.; Titus, B.D.; Hazlett, P.W.; Maynard, D.G.; Brais, S. Effects of forest biomass harvesting on soil productivity in boreal and temperate forests—A review. Environ. Rev. 2011, 19, 278–309. [Google Scholar] [CrossRef]
  62. Cambi, M.; Grigolato, S.; Neri, F.; Picchio, R.; Marchi, E. Effects of forwarder operation on soil physical characteristics: A case study in the Italian alps. Croat. J. For. Eng. 2016, 37, 233–239. [Google Scholar]
Figure 1. Soil bulk density in the successive Larix principis-rupprechtii plantations. CG indicated the control grassland; 1G-16YR indicated the 16-year 1st generation forest; 1G-28YR indicated the 28-year 1st generation forest; 1G-44YR indicated the 44-year 1st generation forest; CC indicated clear-cutting forest; 2G-16YR indicated the 16-year 2nd generation forest, and 2G-28YR indicated the 28-year 2nd generation forest. Soil bulk density (SBD) values with the same letter are not significantly different at p < 0.05. Error bars indicate the standard error; n = 15.
Forests 10 00932 g001
Figure 2. Soil porosity in the successive Larix principis-rupprechtii plantations. (a) Total porosity; (b) Non-capillary porosity; (c) Capillary porosity; (d) Soil ventilation. CG indicated the control grassland; 1G-16YR indicated the 16-year 1st generation forest; 1G-28YR indicated the 28-year 1st generation forest; 1G-44YR indicated the 44-year 1st generation forest; CC indicated clear-cutting forest; 2G-16YR indicated the 16-year 2nd generation forest, and 2G-28YR indicated the 28-year 2nd generation forest. Soil porosity values with the same letter are not significantly different at p < 0.05. Error bars indicate the standard error; n = 15.
Forests 10 00932 g002
Figure 3. Water in soil in the successive Larix principis-rupprechtii plantations. (a) Soil water content; (b) Saturated soil water content; (c) Capillary water capacity; (d) Field capacity; (e) Volume humidity. CG indicated the control grassland; 1G-16YR indicated the 16-year 1st generation forest; 1G-28YR indicated the 28-year 1st generation forest; 1G-44YR indicated the 44-year 1st generation forest; CC indicated clear-cutting forest; 2G-16YR indicated the 16-year 2nd generation forest and 2G-28YR indicated the 28-year 2nd generation forest. Water in soil values with the same letter are not significantly different at p < 0.05. Error bars indicate the standard error; n = 15.
Forests 10 00932 g003
Figure 4. Soil pH value in the successive Larix principis-rupprechtii plantations. CG indicated the control grassland; 1G-16YR indicated the 16-year 1st generation forest; 1G-28YR indicated the 28-year 1st generation forest; 1G-44YR indicated the 44-year 1st generation forest; CC indicated clear-cutting forest; 2G-16YR indicated the 16-year 2nd generation forest and 2G-28YR indicated the 28-year 2nd generation forest. The pH value with the same letter is not significantly different at p < 0.05. Error bars indicate the standard error; n = 15.
Forests 10 00932 g004
Figure 5. Soil nutrients in the successive Larix principis-rupprechtii plantations. (a) Soil organic carbon; (b) Total nitrogen; (c) Available phosphorus; (d) Total potassium. CG indicated the control grassland; 1G-16YR indicated the 16-year 1st generation forest; 1G-28YR indicated the 28-year 1st generation forest; 1G-44YR indicated the 44-year 1st generation forest; CC indicated clear-cutting forest; 2G-16YR indicated the 16-year 2nd generation forest and 2G-28YR indicated the 28-year 2nd generation forest. Soil nutrients with the same letter are not significantly different at p < 0.05. Error bars indicate the standard error; n=15.
Forests 10 00932 g005
Figure 6. Soil microorganisms in the successive Larix principis-rupprechtii plantations. (a) Bacteria; (b) Actinomycete; (c) Fungi. CG indicated the control grassland; 1G-16YR indicated the 16-year 1st generation forest; 1G-28YR indicated the 28-year 1st generation forest; 1G-44YR indicated the 44-year 1st generation forest; CC indicated clear-cutting forest; 2G-16YR indicated the 16-year 2nd generation forest and 2G-28YR indicated the 28-year 2nd generation forest. Soil microorganisms with the same letter are not significantly different at p < 0.05. Error bars indicate the standard error; n = 15.
Forests 10 00932 g006
Figure 7. Soil enzyme activities in the successive Larix principis-rupprechtii plantations. (a) Catalase; (b) Polyphenol oxidase; (c) Urease. CG indicated the control grassland; 1G-16YR indicated the 16-year 1st generation forest; 1G-28YR indicated the 28-year 1st generation forest; 1G-44YR indicated the 44-year 1st generation forest; CC indicated clear-cutting forest; 2G-16YR indicated the 16-year 2nd generation forest and 2G-28YR indicated the 28-year 2nd generation forest. Soil enzyme activities with the same letter are not significantly different at p < 0.05. Error bars indicate the standard error; n = 15.
Forests 10 00932 g007aForests 10 00932 g007b
Figure 8. Biplots of soil variables and treatments in PC1 and PC2.
Forests 10 00932 g008
Figure 9. Soil quality index in the successive Larix principis-rupprechtii plantations. SQI: soil quality index; CG indicated the control grassland; 1G-16YR indicated the 16-year 1st generation forest; 1G-28YR indicated the 28-year 1st generation forest; 1G-44YR indicated the 44-year 1st generation forest; CC indicated clear-cutting forest; 2G-16YR indicated the 16-year 2nd generation forest and 2G-28YR indicated the 28-year 2nd generation forest. Soil quality indices with the same letter are not significantly different at p < 0.05. Error bars indicate the standard error; n = 15.
Forests 10 00932 g009
Table 1. Stand characteristics of Larix principis-rupprechtii plantations of seven types of plots.
SamplesAspectAngle of the Slope (°)Slope PositionCanopy DensityAge (YR)Altitude (m)Mean DBH (cm)Mean Tree Height (m)
Control grasslandNorthAbove--1657.50--
1G-16YRSouthBelow0.80161666.208.809.40
1G-28YR- -0.50281702.4023.9015.68
1G-44YRNorthMiddle0.70441712.0035.5020.50
Clear-cutting forest land- ---1672.00--
2G-16YR- -0.90161696.007.706.90
2G-28YRSouthMiddle0.90281692.2011.009.60
Notes: DBH indicates the diameter at breast height.
Table 2. Soil quality indicator scores (mean ± standard error) for the soil samples taken from the Larix principis-rupprechtii plantations.
CG1G-16YR1G-28YR1G-44YRCC2G-16YR2G-28YR
SBD0.76 ± 0.04 a0.29 ± 0.04 c0.36 ± 0.04 bc0.49 ± 0.01 b0.48 ± 0.04 b0.27 ± 0.06 c0.28 ± 0.04 c
NCP0.48 ± 0.02 b0.25 ± 0.11 b0.33 ± 0.07 b0.75 ± 0.11 a0.42 ± 0.03 b0.37 ± 0.06 b0.44 ± 0.13 b
VH0.46 ± 0.05 cd0.33 ± 0.09 d0.59 ± 0.03 bc0.67 ± 0.03 b0.90 ± 0.04 a0.33 ± 0.03 d0.43 ± 0.05 d
SOC0.24 ± 0.04 c0.39 ± 0.06 bc0.43 ± 0.04 b0.71 ± 0.09 a0.36 ± 0.01 bc0.43 ± 0.02 b0.47 ± 0.02 b
PPO0.47 ± 0.02 bc0.43 ± 0.06 c0.58 ± 0.09 ab0.63 ± 0.02 a0.43 ± 0.01 c0.25 ± 0.02 d0.45 ± 0.01 bc
Notes: SBD: soil bulk density; NCP: non-capillary porosity; VH: volume humidity; SOC: soil organic carbon; and PPO: polyphenol oxidase. In rows, the values with different letters are significantly different (p < 0.05).

